Article

Are Smart Cities Too Expensive in the Long Term? Analyzing the Effects of ICT Infrastructure on Municipal Financial Sustainability

by
Gabriel Puron-Cid
1,* and
J. Ramon Gil-Garcia
2,3
1
Centro de Investigación y Docencia Económicas, Aguascalientes 20313, Mexico
2
Center for Technology in Government, Department of Public Administration and Policy, Rockefeller College, University at Albany, Albany, NY 12205, USA
3
School of Business, Universidad de las Americas Puebla, Cholula 72810, Mexico
*
Author to whom correspondence should be addressed.
Sustainability 2022, 14(10), 6055; https://doi.org/10.3390/su14106055
Submission received: 19 March 2022 / Revised: 28 April 2022 / Accepted: 10 May 2022 / Published: 17 May 2022

Abstract

:
Cities around the world are attempting to become smarter by using data and technology to improve internal operations, make better decisions, and increase the quality of life. This technology-intensive use frequently comes with large investments in the ICT infrastructure necessary for smart city initiatives, which may not be financially viable in the long term. Financial sustainability (FS) is a useful framework for assessing how governments meet their financial obligations, using different indicators of financial performance over time by controlling for contextual factors. This study examines 1723 municipal governments; only 89 of these explicitly conducted smart-city initiatives in Mexico over three time points (2014, 2016, and 2018). Panel data techniques were applied to compare the effects of the investments in ICT infrastructure across municipalities with or without smart-city initiatives on five indicators related to the financial condition within the FS framework (i.e., cash solvency, budget solvency, long-term solvency, service-level solvency for revenues and expenses). The results show an association between ICT infrastructure and some dimensions of FS. The main findings suggest the importance of adequate financial analysis for long-term capital and budgeting decisions, to create a more solid smart city financial strategy for the long term. Specific recommendations for city managers are also discussed.

1. Introduction

Smart city initiatives have become recurrent strategies used by local governments to provide better services, improve their managerial effectiveness, and increase citizen participation in cities’ decision-making processes. Great potential exists to use data, information, and communication technologies (ICT) more extensively to improve city operations. However, depending on the size and financial situation of the cities, some smart city initiatives could be considered investments that are too expensive and not easy to maintain in the long term. If city governments want to achieve most of the benefits arising from the intense use of technology and data, building financially sustainable smart cities should be seen as a priority.
The literature on smart cities includes different definitions of sustainability. The first definitions of sustainability referred almost exclusively to the conditions of equilibrium between human activities and their impact on the natural environment [1]; today, the term refers more broadly to the duration of the effects derived from the smart city initiative over time [2] and the long-term impacts of this type of project on the environmental, social, political, and economic aspects of a city [3,4]. However, the financial sustainability (FS) aspect of smart cities has been neglected and requires more investigation, particularly in relation to the long-term impact of these types of projects.
An example of this increasing concern about the FS of smart cities is the European Commission’s initiative, entitled “European Innovation Partnership on Smart Cities and Communities” (EIP-SCC). This initiative attempts to build a joint investment program for European smart city projects by involving investors, city governments and other public agencies, small- and medium-sized enterprises, and other actors from society in discussing and finding financially sustainable solutions (for more information, see: https://eu-smartcities.eu/sites/default/files/2018-06/EIP-SCC_TOWARDS%20A%20JOINT%20INVESTMENT-Paper.pdf (accessed on 12 May 2020)). This project also attempts to identify new market and business models for financing infrastructure and services for smart cities in a sustainable way over time (e.g., crowdfunding, community investment, and the digital social market). A set of indicators and measurements are used to guide funding toward the more financially sustainable and viable smart city initiatives.
The assessment of smart cities’ FS takes into consideration not only how local governments perform over time when adopting this type of initiative but also how economic and social contexts may influence their adoption in general [5,6], as well as how these contextual factors may influence investments and spending on an ICT infrastructure in particular [7,8]. Several international organizations have proposed the adoption of FS strategies and policies in the public sector as a form of collective monitoring tool for strengthening financial discipline and preventing financial and economic crises [6,9,10,11,12,13], but the application of an FS framework for local or municipal governments that are adopting large and enduring ICT projects, such as smart city initiatives, is still a work in progress.
We argue that one important strategy for a solid financial plan for a smart city initiative, including solid long-term capital investments and budgetary decisions, is to analyze and to monitor the FS of the municipal government. Despite the contributions of the literature to the study and assessment of the FS of governments, not enough research has been dedicated to studying the effects of smart city initiatives on the financial condition of municipal governments. The assessment of financial condition needs to take into account the amount of human, material, and financial resources dedicated to smart city initiatives and their impact on the long-term capability of local governments to meet their financial obligations [8,14]. In general, the FS framework has been useful, not only as a tool by which to identify potential financial risks that influence the ability of governments to meet their financial obligations but also to identify potential contextual factors that may impact public finances [15]. When examining a local government’s financial performance, an FS framework can be used to identify the proper timing for launching smart city initiatives, detect potential financial risks during each phase of the implementation, and evaluate the project’s financial benefits and/or limitations.
The goal of this study is to analyze how municipal governments could use the FS framework to better understand and improve their management of smart city initiatives from a long-term financial perspective, by answering three research questions that also represent our main objectives: Are smart cities too expensive in the long term? Are investments in ICT infrastructure associated with the financial performance of governments? Does context influence the financial performance of governments?
The paper is organized into six sections, including the above introduction. Section 2 presents a review of the current literature, focusing on smart cities, sustainability as a multidimensional concept, and FS. Based on the FS framework, this section also presents the research question and hypotheses that guide our study. Section 3 explains the research design and methods used for this paper, which is based on quantitative analyses of the official data from 1723 municipalities in Mexico over three time points: 2014, 2016, and 2018. This section also includes a brief description of five examples, which include well-known smart city initiatives in Mexico: Alvaro Obregon (in Mexico City), Aguascalientes (Aguascalientes), Guadalajara (Jalisco), El Marque (Queretaro), and Monterrey (Nuevo Leon). These smart cities are used as reference points to understand the panel data results. Section 4 presents the results of our empirical analysis. The five examples were compared with the average patterns from our panel data results, in order to answer the question: “Are smart cities too expensive in the long term?” Based on the results from the panel data analysis, other questions were also addressed in this section, including “Is the ICT infrastructure associated with the financial performance of governments?”, and “Does context influence the financial performance of governments?” Section 5 discusses the main findings, provides some concluding remarks and suggests ideas for future research about this topic. It also includes some policy recommendations.

2. Literature Review: Smart Cities and FS

This section presents the results of our review of the existing literature related to smart cities and sustainability, as well as FS, including definitions, components, models, indicators, and measurements.

2.1. Smart Cities and Sustainability

Many definitions of a smart city and its components exist. The term “smart city” encompasses a collection of diverse technological developments used to improve cities, through specific tools and applications approaching the topic from a holistic viewpoint [16,17]. Batty [18] (pp. 483–484) pointed out that smart city projects are spaces where ICTs have merged with traditional infrastructures, coordinating and integrating the use of new digital technologies to transform the environment toward a new urban model.
Smart city initiatives require collaborative efforts across multiple levels and functions of government authorities, businesses, citizens, and other actors to improve the quality of life of its inhabitants [19,20]. Therefore, smart city projects attempt to adopt a holistic approach including several dimensions or axes of development [21,22,23,24]. Six main axes guide smart city initiatives around the world: smartness for the economy, people, governance, mobility, environment, and living [25]. A smart city must develop each axis as an aspiration goal toward continuous improvement. These axes represent a global vision of all aspects of a connected society within the urban space in the future from a more holistic perspective [16]. Whatever the goals established for a smart city initiative, it requires critical investments and budget allocations to acquire the necessary resources, such as people, materials, and ICTs for implementing this type of holistic project.
In addition to data and ICT, there are other important components for smart city projects related to organizational capabilities, policies, and the context in which the smart city initiative is embedded [4,26]. In fact, there are definitions of “smart city” that include the roles of governments, citizens, businesses, and other important social actors in this type of project [27,28,29,30]. In addition to data, technology, and the built infrastructure, smart city initiatives include aspects related to the environment, policies, services, openness to citizen participation, and partnerships with private and nonprofit organizations [31,32]. Important aspects of government policies include investment, spending, and the allocation of key resources.
Smart city research also emphasizes the environmental aspect of sustainability [1,31,33]. The rapid adoption of mobile and sensor technologies, as well as the diversity of Internet applications and social media available, extended the scope of smart city projects to saving energy, supporting environmental care, or improving urban mobility [34]. Many modern urban sites have taken advantage of emerging technologies, extending the concept of sustainability into other dimensions, such as improving living conditions and citizen engagement [14,35]. More broadly, the term “sustainability” has also been identified as the ultimate test of a smart city’s strategy for success from a more integral and systematic perspective, in terms of the duration of its results over time [2]. It evaluates outcomes over time, not only focusing on technical or environmental changes but also on a broader perspective of results (e.g., financial health or social justice). Consistently, sustainability now refers to long-term impacts on the environmental, social, political, and economic aspects of a smart city [3,4,36].
Environmental sustainability represents an essential component of the smart city conceptualization. Protecting the environment is recognized as one of the most important characteristics of smartness [14]. However, as mentioned before, other types of sustainability exist, such as social, political, economic, and financial sustainability [37]. Social sustainability refers to a future focus on the improvement of a just society over time [38]. As Castillo, Price, Moobela, and Mathur [39] (p. 39) noted, social sustainability can be defined as “ensuring the well-being of current and future generations, by recognizing people’s right to belong to and participate as valued members of a community.” Economic sustainability focuses on the uneven distribution of the benefits of digital innovation among citizens and the efficiency of technology in practice [40,41]. Political sustainability positions smartness as a mechanism for reconciling conflicting policy ideals and agendas in urban policymaking, regarding mutually recognized problems and solutions, among different stakeholders [42]. Finally, FS refers to a set of criteria to identify how smart city projects affect the finances of governments and citizens in the long term [43]. FS could also be seen as the ability of a local government to meet its financial and service obligations after investing in smart city projects [44].
Today, the use of the term “sustainability” often includes various strategies to improve the use of public infrastructure, engage citizens in local governance, save energy, foster economic growth, attract business and innovation, protect the environment, and help government officials to learn and innovate [27,45]. The emphasis on sustainability has represented an essential feature in the implementation of several examples of smart city initiatives around the world. Furthermore, several international certification bodies have proposed relevant standards for smart city initiatives, in order to characterize an appropriate set of properties for this type of project. The International Electrotechnical Commission (IEC), the International Telecommunication Union (ITU), and the International Organization for Standardization (ISO) have collaborated to create a uniform set of rules, standards of good practice, and technical cooperation mechanisms around the concept of the smart city. A detailed review of these standards exceeds the scope of this article, but many of them constitute an international consensus on best practices for smart cities from the holistic viewpoint of sustainable cities and communities (for examples of these reviews, please see [46,47,48]). This is a list of some of the most well-known standards that are specifically applicable to smart cities:
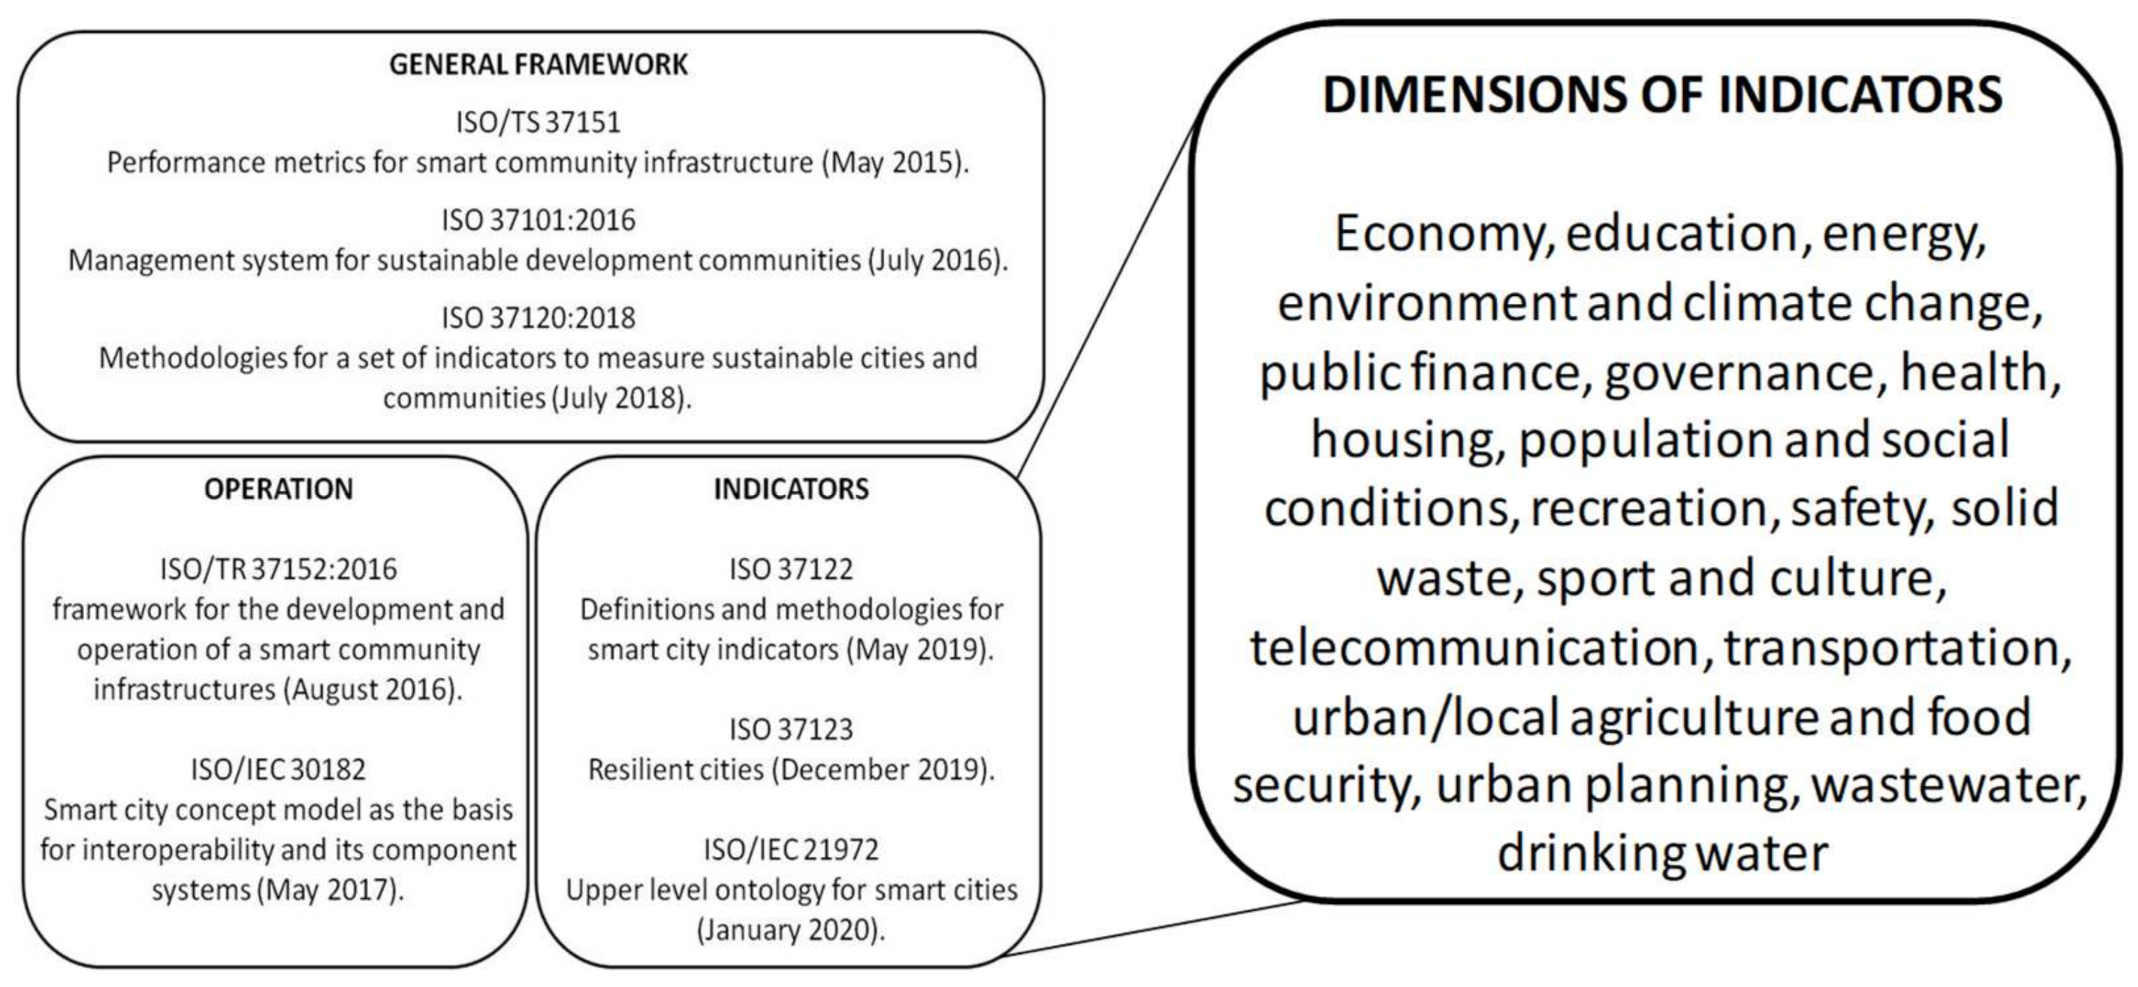
  • ISO/TS 37151 defines the principles and requirements for performance metrics for a smart community infrastructure (May 2015).
  • ISO 37101:2016 establishes the requirements for a management system for sustainable development communities (July 2016).
  • ISO/TR 37152:2016 outlines the basic concept of a common framework for the development and operation of smart community infrastructures (August 2016).
  • ISO/IEC 30182 describes and gives guidance for a smart city concept model as the basis for interoperability, along with its component systems (May 2017).
  • ISO 37120:2018 defines and establishes methodologies for a set of indicators for city services and quality of life by which to measure sustainable cities and communities (July 2018).
  • ISO 37122 specifies and establishes the definitions and methodologies for a set of indicators for smart cities (May 2019).
  • ISO 37123 complements ISO 37122 for resilient cities (December 2019).
  • ISO/IEC 21972 is the standard that establishes the general principles and guidelines for an upper-level ontology for smart cities (January 2020).
These ISO standards complement each other and others dedicated to energy efficiency and savings, transport (traffic safety), water efficiency management systems related to drinking water and wastewater services, public infrastructure, security and resilience in the case of disaster and emergencies, healthcare, and decent standards of living, among others. Several studies have compared and articulated this family of ISO standards and indicators for smart sustainable cities (see Figure 1) [46,47,48].
The association between actions and results in each of these dimensions and indicators is particularly important due to the financial spending and investments in smart city initiatives from a city’s budget. Understanding how financially sustainable the portfolio of smart city initiatives is over time becomes an essential task for city officials and the city’s citizens [14]. As such, this study focuses on the budgetary and financial dimensions of sustainability as they are crucial for smart city initiatives. The following section explains FS in more detail and why it should be seen as an essential tool by which to assess smart city success. It also presents a financial framework that could help city governments to better assess the FS of their initiatives, considering the financial condition of the government, smart city operation over time, ICT infrastructure, and contextual indicators that are compatible with the dimensions and indicators for smart cities from the family of ISO standards.

2.2. FS for Smart Cities

Assessing the financial condition of governments has become an important topic due to several economic and financial crises in the 1970s, 1980s, in 2008, along with the ongoing crisis that started in 2020 as a result of the COVID-19 pandemic [49,50,51]. The term “financial sustainability” is related to the assessment of the financial condition, fiscal health, fiscal stress, and/or financial performance of a government over time, considered within a complex context [5]. It refers to the ability of a government to meet its financial and service obligations from a systematic perspective, wherein public finances are embedded within complex economic, political, and social contexts [15,50]. It also represents the ability of a government to interact with this context in order to meet present and future financial commitments and achieve an effective service delivery without incurring excessive debt, engaging in budget gimmicks, or using evasive tactics [6] (p. 3962) [52] (p. 7) [53] (pp. 1–2). Analyzing FS from a systematic perspective means, for example, identifying the potential risks from the economic and social contexts and adapting fiscal, budgetary, and debt policies according to that government’s context. This type of FS assessment is known as the systemic perspective of the financial condition of governments because it embeds financial condition in its social, economic, and political contexts. The FS framework adopts a systemic perspective within three spheres (see Figure 2): (1) the financial condition of a government, (2) its environment, which includes economic, political, demographic, social, budgeting, accounting, spending needs, revenue wealth, and ICT aspects, among others, and (3) the interactions between the first two spheres over time [15,50].
The first sphere assesses the financial condition of a government by analyzing revenue, spending, fiscal slack, relativity levels, current operating conditions, and future financial obligations (The indicators used include the unreserved fund balance as a percentage of expenditures (capital expenditures excluded), capital expenditures as a percentage of total expenditures, enterprise income as a percentage of total income and own-source revenue, and debt service as a percentage of expenditures). The second sphere assesses the government’s environment by examining the levels of revenue wealth using various indicators. These include the income per capita; the equalized assessed value per square mile; weighted sales receipts per capita; the level of service provisions (spending needs), using indicators such as the weighted crime rate per 1000 inhabitants, reverse median age housing, reverse density (population/square mile), and the presence of a fire district); and other socio-economic, political, and demographic characteristics affecting public finances. The third sphere assesses the interactions between the previous two spheres as marginal effects, assessing indicators such as weighted own-source revenue per capita and the weighted total expenditures per capita (capital expenditure excluded).
Several studies have applied this framework at the national, state/regional, and local levels [6,51,52]. Several international organizations have developed frameworks for monitoring FS at the country level [54]: the UN [13], IMF [12], the World Bank, the Organization for Economic Cooperation and Development (OECD), and the International Federation of Accountants (IFAC) participated in and supported the endeavor together, through the International Public Sector Accounting Standards Board (IPSASB) [11], to establish an international standard of FS, as well as the European System of National and Regional Accounts of the European Commission (EC), for an FS standard based on the European System of Accounts (ESA) [10].
Since the 1970s, several frameworks have been developed and are used to assess the FS of state and municipal governments. For example, the International City/County Management Association (ICMA) developed a handbook for evaluating the financial condition of local governments, based on Hendrick’s model in the US [55]. The Lincoln Institute of Land Policy (LILP) and the Government Finance Officers Association (GFOA) developed a financial sustainability index for local governments in California that considers three features of the inner sphere of the FS framework: (1) cash solvency (current assets divided by current liabilities, and the general fund balance as a percentage of total expenditures), (2) revenue structure (total revenues per capita, with property tax as a percentage of own-source revenues), and (3) debt (total debt as a percentage of revenues, with total debt service as a percentage of revenues) [56]. The Auditor-General of the State of Florida developed a financial condition assessment tool based on 18 financial indicators for counties, municipalities, and special districts. Norcross and Gonzalez (2017) [52] and Wang, Dennis, and Tu (2007) [53] evaluated the IFAC’s model at the state level, while McDonald (2017) [57], reviewing at the municipal level in the US, identified four groups of solvency: (1) the ability of the municipality to meet its immediate or short-term financial obligations (cash solvency), (2) the ability of the municipality to meet its financial balance over a fiscal year (budget solvency), (3) the ability of the municipality to meet its long-term financial obligations (long-run solvency), and (4) the ability of the municipality to finance mandatory programs and services (service-level solvency). The four dimensions used in these frameworks correspond to the sphere of the government financial condition of Hendrick’s model.
In contrast to other regions in the world, in Latin America, a few tools exist to assess the financial performance of state and municipal governments, but very few frameworks exist for assessing FS, fiscal stress, or financial condition in the region. In Mexico, the Ministry of Finance of the federal government devised a warning system for monitoring the financial discipline of state and municipal governments since 2016 but made no reference to any FS framework. In Brazil, there are several studies about financial resilience across municipalities [58,59,60]. As a result, the current study attempts to contribute to filling this gap by adopting the FS framework to analyze local governments in Mexico that have implemented smart city projects.
In general, the literature related to public finance and accounting has identified the impact of digitalization on several aspects of public finance. Some examples are [61]: ICT tools for taxation and revenue administration, computing techniques for analyzing fiscal data, blockchain and cognitive computing for government spending, and digital technologies for improving public service provisions and financial and treasury management. The main focus of this body of research has been the benefits of digital transformation for government, citizens, and businesses, through reduced administrative burdens, costs, and spending, as well as improved service provision. Ndou (2004) [62] (p. 13) points out that the development of a basic ICT infrastructure is essential for implementing digital government tools, such as websites, mobile technologies, and kiosks, among others, that have implications for financial abilities. However, there is no specific mention of the impact of the ICT infrastructure on the financial condition of governments.
In the published smart city research, few studies have raised the importance of the financial assessment of smart city initiatives. Neirotti and colleagues (2014) [4] created a taxonomy of smart city applications to identify possible strategies and planning actions. They found that there are a few best practices for funding smart city investments through public–private partnerships [4] (p. 31). Alawadhi and colleagues (2012) [63] identify several challenges for smart city initiatives; among them, governance encompasses programmatic directions, budgetary and resource allocations, and other interactions and partnerships with internal and external actors. In this sense, these authors suggest that budgetary pressures and financial constraints are some of the main challenges faced by smart city initiatives [63] (p. 51). Timeus, Vinaixa, and Pardo-Bosch (2020) [4] identified the need for smart city business models including the financial aspects of these types of projects. The example of Barcelona was examined by Leon (2008) [64] (p. 145), who also identified several challenges in terms of insufficient venture-capital funding to attract public–private partnerships for smart cities. In addition, both Komninos (2013) [43] and Shen et al. (2011) [44] suggested incorporating a set of sustainability indicators, including measurements for the financial condition of smart city projects. The European Commission’s “European Innovation Partnership on Smart Cities and Communities” (EIP-SCC) initiative raised concerns about the FS aspect of smart cities. This initiative attempted to offer a joint investment platform for European smart city projects by involving investors, city governments, industry, small- and medium-sized enterprises, and other actors in discussing and finding financial and business models solutions for the FS of smart cities, such as crowdfunding, community investment, and digital social markets. Assessing the FS of any municipality, in general [5,6], and those operating smart city initiatives, in particular [63], has become one of the most urgent issues in the context of recurrent severe economic crises such as the financial crisis in 2010 in Europe, caused by the sovereign debt and banking systems of several countries, or the financial crisis in 2009 in the US, provoked by a collapse of the housing bubble in the financial market [7,8].

3. Research Design and Methods

This study was conducted in two phases. The first phase applies panel data analysis in order to examine the relationship between smart city operation over time, the ICT infrastructure, and social and economic contexts. The second phase conducted a comparison of the results of our panel data analyses, specifically, the average of all municipalities in key financial variables, with five examples of well-known smart cities in Mexico (i.e., Mexico City, Monterrey, Guadalajara, Querétaro, Puebla, and Aguascalientes), in order to establish a reference point to better understand the results.

3.1. Panel Data Analysis

In the first phase, this study applies panel data techniques and multivariate regression analysis to examine the association between smart city operation over time, as well as ICT infrastructure and contextual factors, and the FS of Mexican local governments that are instituting smart city initiatives. Figure 3 shows the panel data model specification.
Mexico was selected for this study because it is a developing country with a fiscal federalist arrangement. In addition, the measurements and financial information necessary to analyze the FS framework for all the local governments in the country were available. Although the study is not adopting the set of indicators from the family of ISO standards for smart cities, some of their dimensions and indicators, as applied in the present study, are similar and compatible. The data for this study encompassed three fiscal years (i.e., 2014, 2016, and 2018). In Mexico, the fiscal year for all levels of government runs from January to December (12 months). We reviewed city plans and available official reports and documents about the ICT infrastructure of 1723 municipalities in Mexico, to identify the presence of smart city initiatives. The features chosen for the smart cities considered in this study were the following: smart cards for urban mobility, the smart use of public spaces and buildings, applications and devices for public services provision to citizens, online or web-enabled government services and tax processes, broadband technologies for extending Internet access to the general public, smart traffic-light systems, building street infrastructure with smart materials and designs, solar cell systems for saving the energy consumption of government offices, the video-monitoring of criminal activity, emergency response systems, the telemonitoring of students in schools and patients in hospitals, and smart garbage collection systems. Only 89 municipalities were coded as municipalities with some degree of implementation of the different technologies and applications mentioned above, in order to be considered smart cities.
The decision to use panel data analysis was made because it allowed the researchers to control for individual and time heterogeneity within municipal governments over time. The panel data model operationalized Hendrick’s model by incorporating the five indicators of the financial performance of a municipal government of the first sphere as the dependent variables, with the various indicators for ICT infrastructure and the contextual factors of the second sphere as the independent variables. As in many other studies using statistical models, the coefficients show association or correlation, but not causality. To assess the FS of the smart city projects, this study proposed five indicators representing the four dimensions of the financial condition of local governments: cash solvency, budget solvency, long-run solvency, and service-level solvency. Table 1 describes the financial dimensions, indicators, and interpretations of FS for smart cities. The panel data model utilized dichotomous variables for each year of smart city operation, to capture the association between smart city operation over time and each of the dimensions of financial condition. The panel data model also utilized a set of variables from the social, economic, and demographic contexts of Hendrick’s model. A summary of the variables used is presented in Table 2. Seven panel data models were estimated: five panel data models were computed for each indicator of FS using a fixed-effects specification, and two panel data models were estimated for random effects.
The panel data set included 1723 municipal governments with balanced observations, with data in each year, creating a total of 5169 observations. Considering the objective of analyzing the association between ICT infrastructure and financial performance over time, a fixed-effect regression was specified to examine the results within and among the groups. This specification explored the relationship between the predictor and outcome variables within the local government and over the years by controlling for the individual and time-invariant characteristics that might influence/bias the results. The equation for the panel data model was:
F S i t = β 1 S M A R T   C I T Y i t + β 2 I C T i t + β 4 S E C o n t e x t i t + α i + μ i t
where:
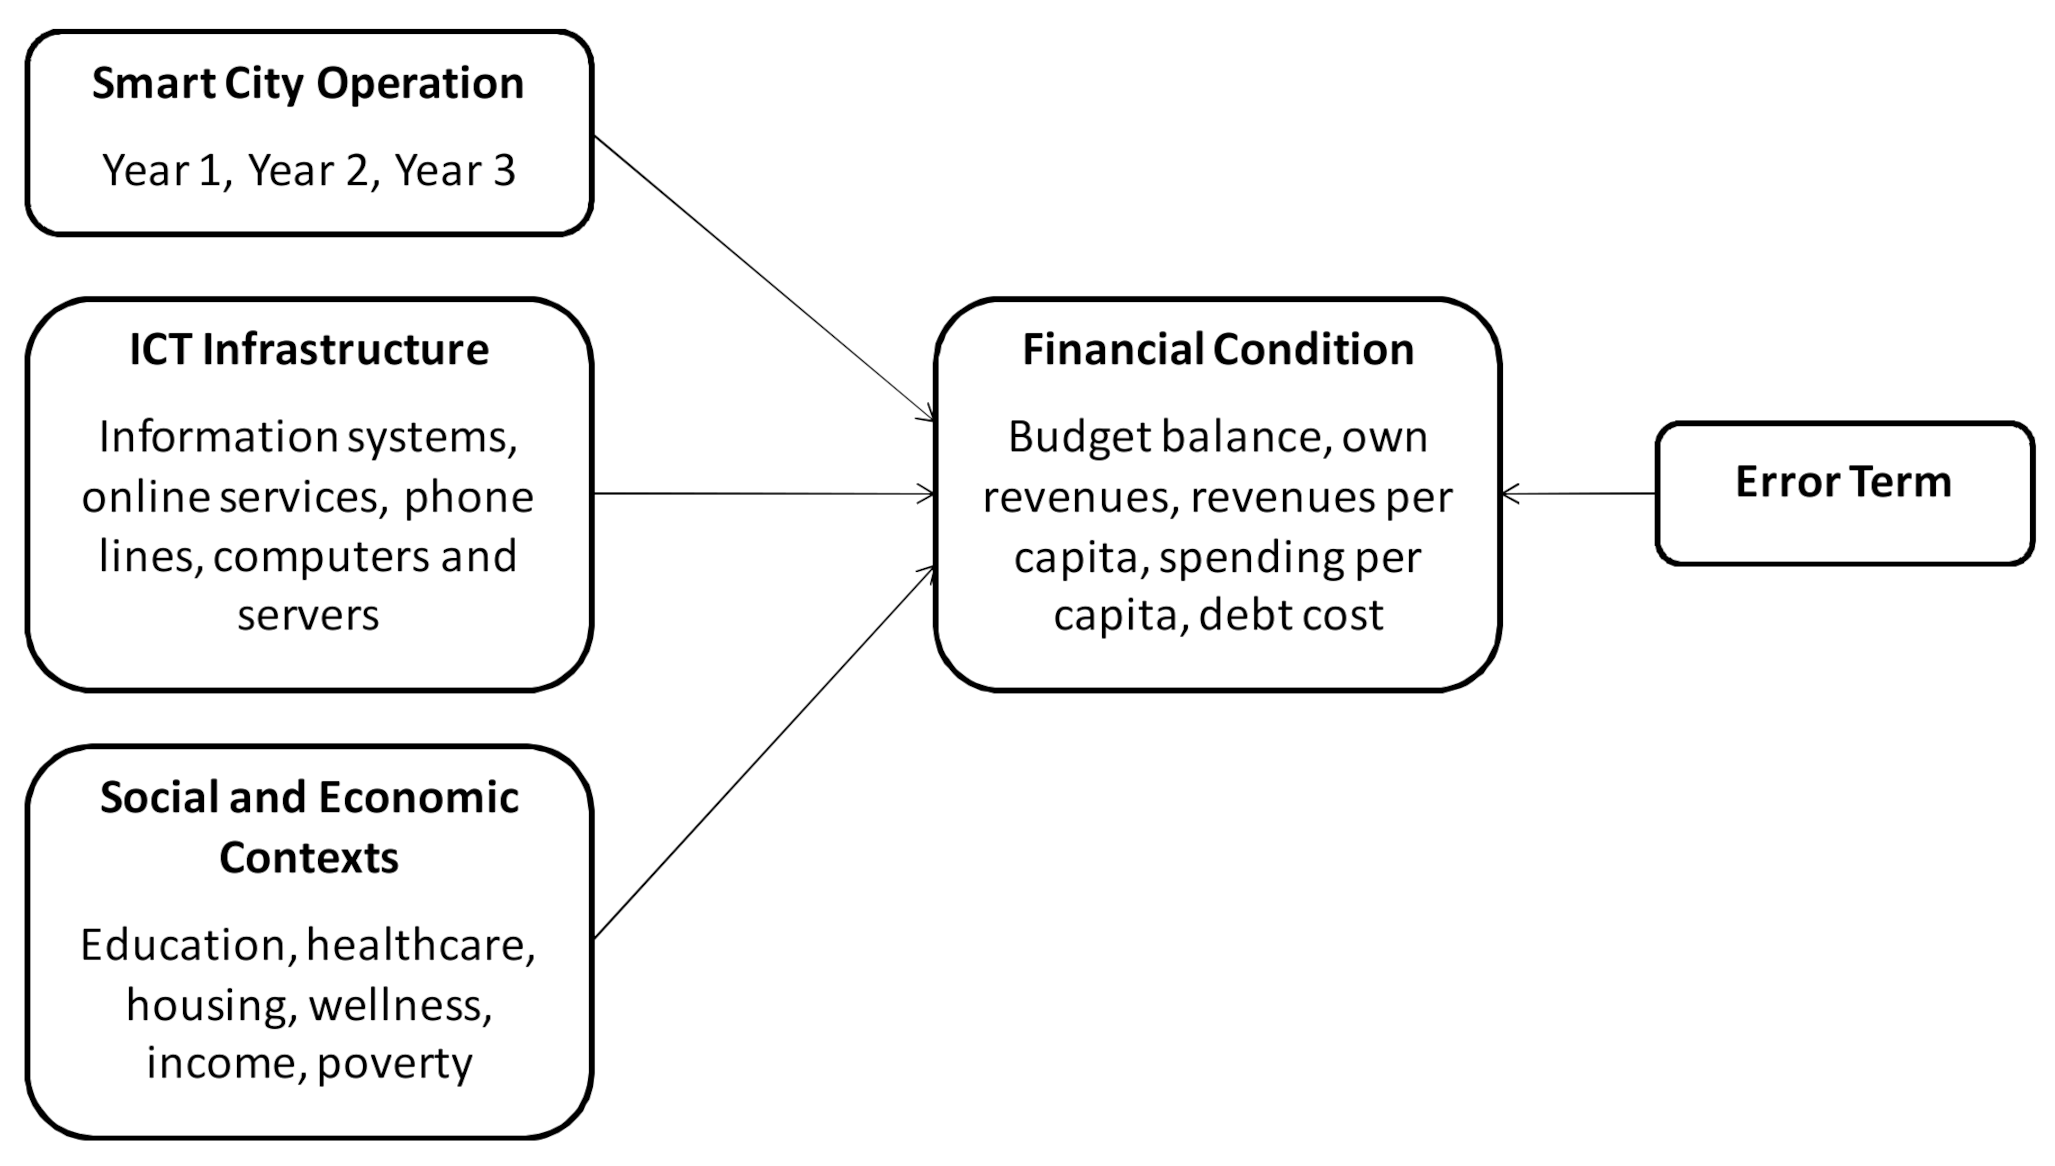
  • FSit = Financial sustainability (i.e., the dependent variable) measured by five indicators;
  • SMART CITYit = Year of smart city operation (2014, 2016, or 2018);
  • ICTit = ICT infrastructure measured using seven indicators;
  • SEContextit = Social and economic context measured by seven indicators;
  • αi (i = 1…n) = Unknown intercept for each municipality (n entity-specific intercepts);
  • μit (i = 1…n) = The error term.
Five financial indicators were used to represent the four dimensions of the financial condition of local governments (see Table 1). For the presence of a smart city initiative in operation over time, the city plans of each municipality were reviewed and coded for each of the years (i.e., 2014, 2016, 2018). For each year, the municipal government was coded “1” if the city plan stated explicitly that it was operating a smart city initiative, and “0” otherwise. The ICT infrastructure of the municipal government was operationalized using seven indicators meant to capture technological assets: (1) the number of information systems, (2) the number of online services offering information, (3) the number of online services offering interactions, (4) the number of online services offering transactions, (5) the number of phone lines per 10,000 inhabitants (including landlines and cellphone lines), (6) the number of computers per 10,000 inhabitants, and (7) the number of servers per 10,000 inhabitants. These indicators were extrapolated from the official statistics provided by the municipal governments. A set of seven indicators were used to capture the different aspects of contextual factors across municipalities: social wealth, economic wealth, and employment (see Table 2).
The interpretation of the signs and magnitudes of the coefficients for the contextual factors is complex and requires further investigation, but the systemic perspective of the FS framework suggests that contextual factors impact the financial performance of the municipalities through different mechanisms. For example, one mechanism is the level of social wealth, measured in terms of access to education, health care, and housing of the population in the community, which, in some way, influences the financial performance of the government. Another mechanism is that the levels of economic wealth, measured in terms of personal income or the conditions of poverty of the population in the community, affects the financial performance of the government. Finally, the level of employment is related to the capacity of the population in the community to face their financial obligations, among them their local tax contributions.
The results of seven panel data models are summarized in Table 3. For the model’s fit and the validity of the fixed-effects specification, the R2, F, and Hausman tests were estimated and are presented at the end of Table 3. The R2 and F indicate that a large quantity of data is represented by the panel data specification. The Hausman test indicated that the panel data models for the financial dimensions of spending per capita and the debt cost required a random effects specification.

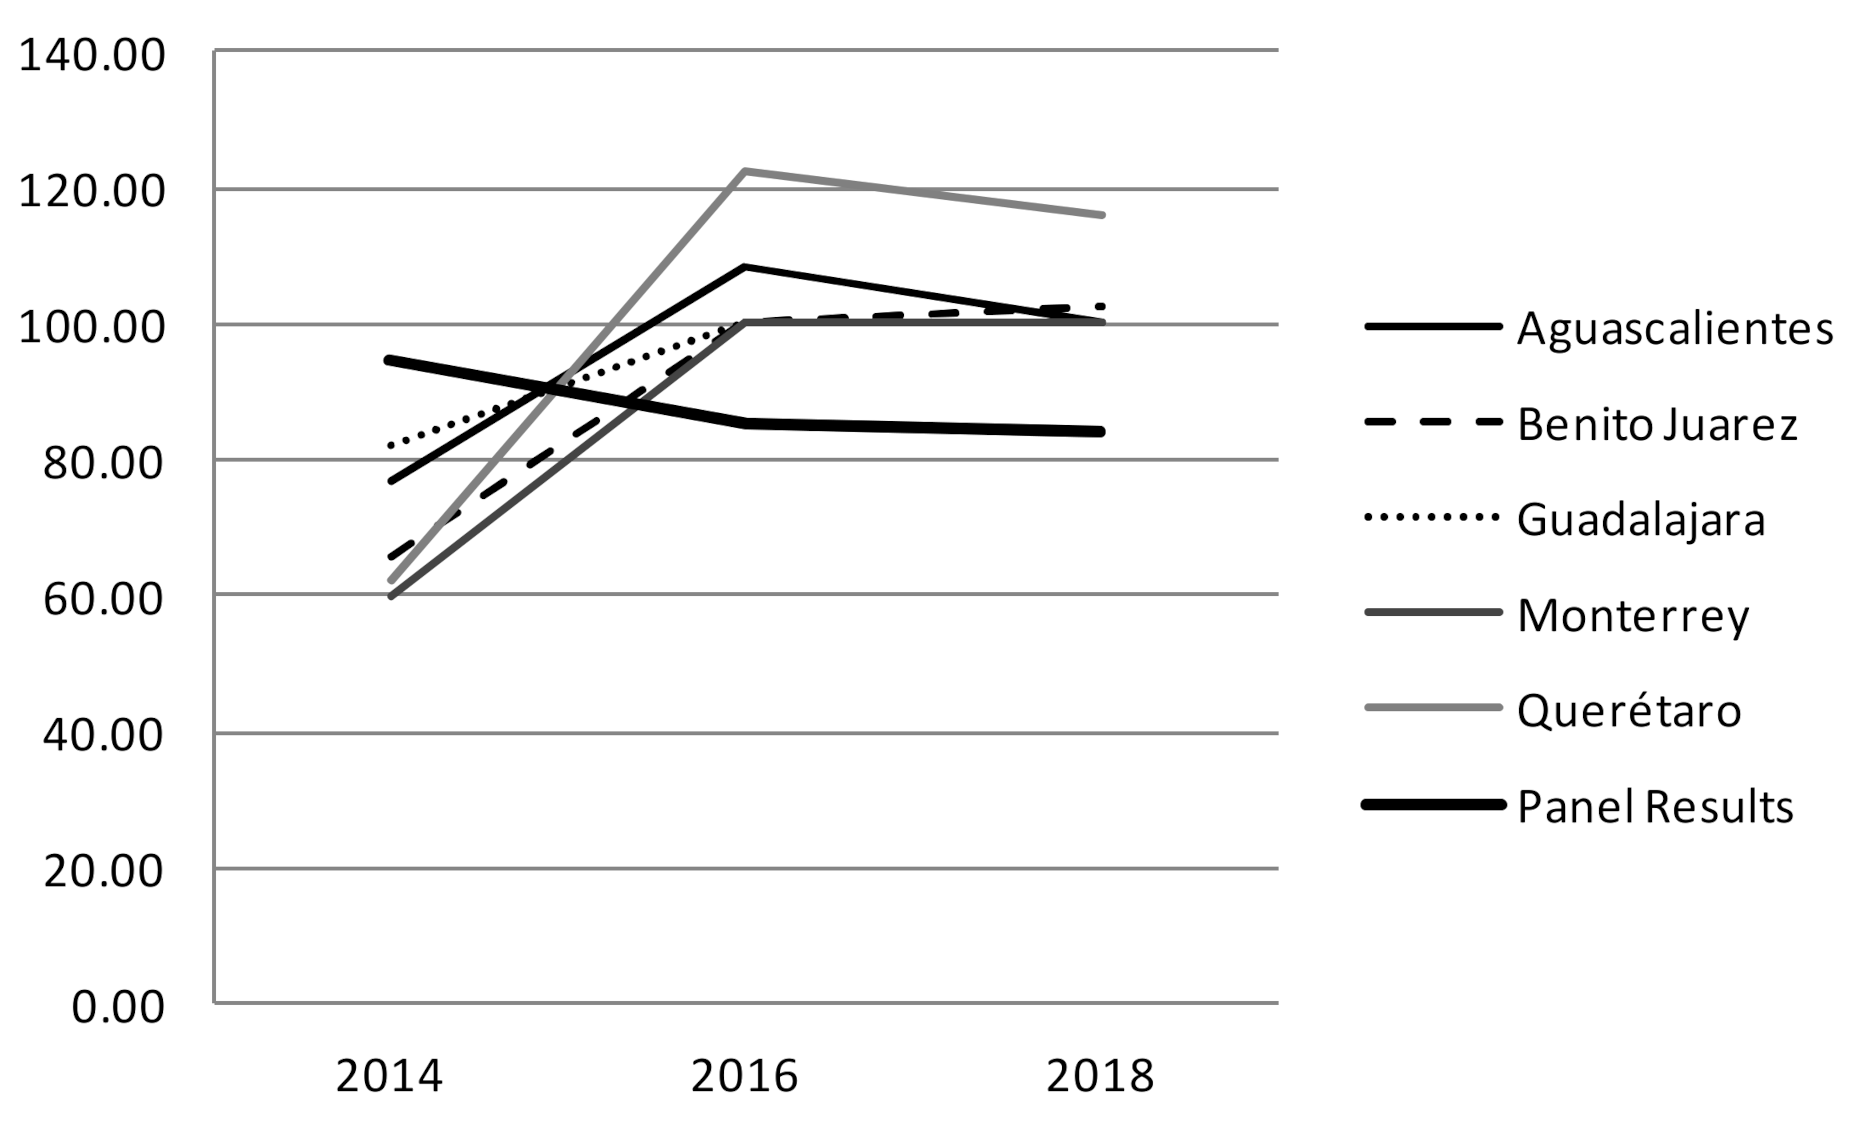
3.2. Comparison with Well-Known Smart City Examples

In order to establish a reference point to understand the results of the panel data analysis, in the second phase of this study, we compare the average of all municipalities, in terms of key financial variables, with Mexican cities that have been previously identified as smart. During the past 10 years, only a few examples of smart cities have stood out in Mexico (i.e., Mexico City, Monterrey, Guadalajara, Querétaro, Puebla, and Aguascalientes). Other local governments of all sizes are adopting different ICT tools and applications that could be categorized as elements of the smart city, but these have not been explicitly identified as smart cities using the ISO standards. In fact, Matus Ruiz and Ramirez Autrán (2016) [1] identified diverse types of emerging technologies and practices within the smart city concept that have been adopted by municipal governments in Mexico and Latin America, including the features discussed above.
We refer to a smart city as being one that is planned, developed, and implemented by the municipal government, which is responsible for the legal and strategic frameworks and operates this type of initiative. For Mexico City, we selected the municipality of Benito Juarez, which has integrated smart city features since 2014 (for more details of this project, please refer to the city plan of Benito Juarez: http://www.data.seduvi.cdmx.gob.mx/portal/docs/programas/PDDU_Gacetas/2015/PDDU_ALVARO-OBREG%C3%93N.pdf (accessed on 18 March 2022)). In 2018, the municipal government of Monterrey officially launched a master plan to implement smart light systems, the smart use of public spaces and buildings, and several ICT-enabled applications for public services (for more details of this project, please refer to the city plan of Monterrey: http://portal.monterrey.gob.mx/transparencia/.2_marco_programatico_presupuestal.html (accessed on 18 March 2022)). The government of Guadalajara has promoted a smart city initiative related to implementing digital solutions for public services delivery, managing public infrastructure, and emphasizing the creation of innovative and entrepreneurial networks in the city (for more details of this project, please refer to the city plan of Guadalajara: https://transparencia.guadalajara.gob.mx/sites/default/files/PMDGGuadalajara2018-2021.pdf (accessed on 18 March 2022)). The municipality of El Marques in Queretaro was launched as a smart city project in 2014. The project is known as Ciudad Maderas and contains 400 hectares of housing complexes, technology companies, educational institutions, shopping centers, hotels, a hospital, an ecological zone, and a church (for more details of this project, please refer to the city plan of El Marques: http://www.elmarques.gob.mx/inf_consulta/PLAN_MUNICIPAL_DE_DESARROLLO_EL_MARQUES_2015_2018.pdf (accessed on 18 March 2022)). This project is isolated from the rest of the city and is focused on smart buildings, smart garbage collection systems, public internet hotspots, and smart energy-saving systems. Finally, the municipal government of Aguascalientes has conducted a smart city project since 2016, but many ICT applications were adopted as early as 2010 for managing public services and infrastructure and enhancing Internet access for its citizens (for more details of this project, please refer to the city plan of Aguascalientes: https://eservicios2.aguascalientes.gob.mx/NormatecaAdministrador/archivos/MUN-12-22.pdf (accessed on 18 March 2022)).

4. Analysis and Results

This section presents the main results of our analysis. The presentation follows the order of our research questions, rather than the two phases described in Section 3. In fact, phase two is used only to answer the first research question, and questions two and three are answered using the panel data analysis only. Panel data models were computed for each of the following indicators of FS (see Table 3): budget balance (budget solvency), own revenues (cash solvency), revenues per capita (service-level solvency for revenue), spending per capita (service-level solvency for spending), and debt cost (long-run solvency). A Hausman test was conducted, and the results indicated that the fixed effects specification was appropriate for the dataset in the case of budget balance, own revenues, and revenues per capita. For the spending per capita and debt cost, panel data models using random effects were computed, based on the Hausman test results. However, it is also important to mention that the coefficients and their sign directions and magnitudes did not change drastically when using one specification or the other. For the budget balance, own revenues, and spending per capita, the R2 values between groups were large and significant (above 90%). This means that a large amount of variance in the dataset is represented in these panel data models.

4.1. Are Smart Cities Too Expensive in the Long Term?

The panel data analysis showed significant results for smart city initiatives over time, related to the financial dimensions of budget balance and own revenues. Budget balance captured the dimension of budget solvency as the percentage of total spending supported financially by total revenues. This indicator registered an average of 86.83% of total spending. This means that for every Mexican peso spent by the government, only 87 cents of this are financially supported by its total revenues (13 cents need to be financed by debt or by additional funds from other government transfers). For this dimension, a percentage equal to or higher than 100% indicated solid budget solvency. Conversely, a percentage of less than 100% indicated unstable budget solvency. The coefficients for 2014, 2016, and 2018 for smart cities were significant and indicated a negative trajectory over time. Figure 4 shows a graphical comparison over time between the average budget balance of all municipal governments (from the results of the panel data analyses) and our five representative examples of smart cities. These comparisons are useful because the five examples are widely acknowledged as smart cities within the Mexican context.
On average, municipalities that were implementing smart city projects presented a positive impact on the budget balance, with a coefficient of +4.39% at the 0.01 level of significance in the first year (2014). This result means that municipal governments usually presented a better financial scenario at the beginning of the smart city initiative, on average, than in the subsequent years of the project. This initial financial situation turned negative for the budget balance in the following years (2016 and 2018), with coefficients of −5.11 and −6.45 percentage points at the 0.001 level of significance. By comparing the five examples with the general average, the budget balance results for smart cities showed another pattern, characterized by an increase in the first year, followed by reductions in the last year (2018). This comparison of budget balance patterns presents some evidence that smart city projects are associated with a negative impact on the financial dimension of budget solvency over time.
The indicator for own revenues captures the dimension of cash solvency and represents the ability of the government to pay its immediate obligations with its own revenues (not including public debt or restricted transfers from federal or state governments). This indicator shows an average of 83.17% of total revenues. For this dimension, a percentage above the average represents a more solid and sustainable financial condition. The coefficients for 2014, 2016, and 2018 were significant and indicated a negative trajectory over time. Figure 5 shows a graphical comparison over time between the average of the own revenues of all municipal governments and our five representative examples of smart cities. On average, the municipalities that were implementing smart city projects in the first year (2014) saw a positive impact on their ability to generate their own revenues, such as taxes and fees, with a coefficient of +7.44 percentage points at the 0.001 level of significance. This situation turned negative for this financial indicator in the following years (2016 and 2018), with coefficients of −9.65 and −10.17 at the 0.001 level of significance. In the five representative examples, own revenues showed a similar pattern, with a decreasing trajectory characterized by an increase in the first year, followed by a decrease in the last years. The patterns of these five representative examples of smart cities could be seen as evidence that having a smart city initiative is related to some negative impacts on the financial condition of municipalities.
The two indicators for the dimension of service-level solvency (revenues per capita and spending per capita) show similar trajectories. These indicators attempt to capture the ability of the city government to meet citizens’ demands for services with levels of revenue or spending. For these indicators, higher than average values in the dataset indicate solid service-level solvency. Revenues per capita and spending per capita are the basic indicators most commonly used to compare financial performance across local governments with different population sizes. The indicator of revenue per capita captures the ability of a government to collect the necessary revenues for its operation at the level of an individual taxpayer, while the indicator of spending per capita portrays the ability of the government to maintain the level of public service provision at the level of an individual citizen or beneficiary subject.
Figure 6 and Figure 7 depict the comparison between the panel data results and our five representative examples. Although the panel data results present inadequate levels of significance for the indicator of revenue per capita, they show a decreasing tendency from a coefficient of −7.88 Mexican pesos for 2014, to −706.70 and −677.51 Mexican pesos for 2016 and 2018, respectively. Similarly, the panel data results are not statistically significant for the indicator of spending per capita, but they also show a somewhat decreasing tendency, from a coefficient of −337.89 pesos for 2014, to −440.55 and −324.45 pesos for 2016 and 2018, respectively.
With respect to the comparison between our five representative examples and the general average for all municipal governments, the analysis showed two patterns. The first pattern showed that the municipalities of El Marques in Queretaro, Benito Juarez in Mexico City, and Monterrey show increasing tendencies for the indicator of revenues per capita (the first two cities, with increasing and remarkable trends, and Monterrey with a more moderate trajectory), while the examples of Aguascalientes and Guadalajara showed decreasing tendencies over time. In the case of the indicator of spending per capita, only Guadalajara shows a moderate negative tendency, while the rest of the municipalities presented positive increases with regard to this indicator. The patterns of these five representative examples of smart cities offer a potential association between an increase in ICT infrastructure, possibly dedicated to previously announced smart city projects, and a negative impact on the financial dimension of service-level solvency.
The indicator of debt cost captures the dimension of long-run solvency as the ability of the government to meet the long-term spending commitments of public debt (see Figure 8). This indicator measures the percentage of total spending dedicated to meeting financial debt obligations. For this indicator, lower values than average in the dataset indicate solid long-run solvency, while higher values suggest otherwise. The pattern of behavior over time for this indicator, when using the panel data results, suggests a strong increase at the beginning of the smart city project, with the slow pace of recovery in the following years. The coefficient for 2014 was +3.41 percentage points at the 0.0001 level of significance, in contrast with the coefficients for 2016 and 2018, with −0.89 and −0.85 percentage points, respectively (both with low levels of significance). This pattern of debt cost over time shows a potential association with the financial debt burden that smart city projects may impose on municipal governments at the initial stages. Different patterns exist across the panel data results and our five smart city representative examples. Guadalajara and Benito Juarez presented low levels of debt costs at the beginning, with higher levels in the last year. Queretaro showed a constant growth of debt cost over time, while Aguascalientes and Monterrey indicated an increase in the middle year (2016).
The pattern over time for the cost of public debt varied across the examples; however, on average, the results of the panel data analysis showed an important increase in debt costs in the initial year, with subsequent moderate reductions over time. These patterns of debt cost over time possibly indicate that smart city initiatives are associated with some financial impact on the debt cost at some point during the duration of the smart city project: at the beginning, in the middle, or at the end of the initiative.
In summary, the panel data results suggest that smart city projects that began in 2014 are associated on average with solid and statistically significant coefficients related to budget balance and own revenues in the first year of the smart city projects: +4.39 and +7.44 percentage points, respectively. However, it is also observable that this positive financial scenario weakened over time, with negative coefficients in these financial indicators for 2016 and 2018. The financial indicators for revenues per capita and spending per capita also presented a similar association with negative coefficients over time, although these additional results are not statistically significant. The panel data results for the financial dimension of debt cost suggest that municipal governments usually initiate their smart city projects along with substantial increases in debt costs that subsequently decrease over time. Based on this association, the implementation and operation of smart city projects may represent a potential undermining effect on the ability of municipal governments to face their financial obligations in the short and long terms.

4.2. Are Investments in ICT Infrastructure Associated with the Financial Performance of Governments?

Smart city projects usually involve substantial investments in ICT infrastructure. This section examines the relationship between an increase in ICT infrastructure and the dimensions of financial sustainability over time. The results indicate that an increase in ICT infrastructure, such as information systems, online services, phone lines, computers, and servers has a positive and statistically significant relationship with budget balance (budget solvency) and own revenues (cash solvency) on average. The interpretation of these results could be that these ICT investments present improvements to the ability of governments to face short-term financial obligations (cash solvency) with their own revenues. This situation will eventually lead to budgetary surplus scenarios at the end of the fiscal year (budget solvency).
The following are some examples of ICT investments with statistically significant coefficients related to budget balance and own revenues. In terms of budget balance, online services enabling transactions showed, on average, a larger positive coefficient (+0.0189 percentage points at the 0.001 level of significance) than other types of online services, such as online services enabling information or interactions (+0.0006 and +0.0027, respectively). In a similar manner, phone lines per 10,000 inhabitants presented, on average, a larger positive coefficient (+0.0146 at the 0.10 level of significance) than other types of ICT infrastructure, such as information systems, computers, and servers per 10,000 inhabitants (+0.0024, +0.0081, and +0.0085, respectively). Own revenues (cash solvency) were also impacted positively by online services, enabling interactions and transactions with coefficients of +0.0032 and +0.0081 at the 0.05 level of significance, while phone lines per 10,000 inhabitants positively influenced cash solvency, with a coefficient of +0.0217 at the 0.001 level of significance.
Examples with similar patterns of coefficients in other financial dimensions existed, but they were not statistically significant. The results of ICT infrastructure on revenues per capita (service-level solvency) showed positive but not statically significant coefficients across online services offering information, interactions, and transactions: +7.02, +8.64, and +36.26, respectively. The association of ICT infrastructure with revenue per capita was also positive but was not statistically significant across different types of ICT, such as the number of information systems (+9.40), phone lines per 10,000 inhabitants (+249.70), computers per 10,000 inhabitants (+63.32), and servers per 10,000 inhabitants (+1071.13). Interestingly, the relationship of ICT infrastructure with spending per capita were negative but not statistically significant for online services enabling interactions and transactions (−9.43 and −38.14, respectively) and the number of information systems (−1.28). These results suggest that ICT infrastructure is related to the ability of governments to meet citizens’ demands for services with the current levels of revenue and spending. Although these results are not statistically significant, they show a potential association of different technological infrastructures with the governments’ financial condition that needs further investigation.
In the case of debt cost (long-term solvency), the results showed an interesting pattern. Although the results of the coefficients were not statistically significant, the coefficients by type of ICT infrastructure presented positive coefficients for the number of information systems, online services enabling information and interactions, and servers per 10,000 inhabitants, but presented negative coefficients for online services enabling transactions, phone lines, and computers per 10,000 inhabitants. In summary, the results described and discussed in this section suggest different relationships between various types of online services and technologies (i.e., information systems, phones, computers, servers) and FS indicators. There is evidence that the different types of ICT infrastructure and online services are associated with the financial condition of the government. Public managers are encouraged to conduct financial analyses of the city’s long-term capital decisions over time to consolidate a more solid smart city strategy.

4.3. Does Context Influence the Financial Performance of Governments?

The results of the panel data analysis showed that contextual factors did impact the financial performance of municipalities through different mechanisms. In this study, the contextual factors that are related to the financial condition of municipal governments were categorized through three mechanisms: social wealth, economic wealth, and employment in the municipality.
The category of social wealth was represented by the percentage of the population with access to education, health care, and housing. For budget balance (budget solvency), only the coefficient for the percentage of the population with access to education was statistically significant at the 0.05 level (+0.0730). Based on the statistically significant results, access to education is expected not only to improve social wealth but also to increase the chances of an improvement to the budget solvency of municipal governments. The financial dimension of own revenues (cash solvency) presented coefficients with similar sign directions, but they were not statistically significant. For the dimension of service-level solvency (revenues per capita and spending per capita), the coefficients for the percentage of the population with access to health care and housing were statistically significant, but with opposite directions (negative for health care and positive for housing). These results indicated that maintaining health care access to a population represented, on average, a financial burden to municipal governments and their citizens, while increasing housing access could increase municipal revenues and, subsequently, available spending for local programs. Finally, the percentage of the population with access to health care and housing was both positive and statistically significant for the cost of debt, meaning that maintaining health care and housing access for the population increases, on average, the debt cost (long-term solvency).
Income per capita and the percentage of the population in a condition of poverty and/or receiving the minimum income or less for living are indicators that represent the level of economic wealth in the municipality. For budget balance (budget solvency), the results of the panel data analysis showed that the coefficients for the population who earned the minimum salary or less and were in conditions of poverty were statistically significant, but with opposite sign directions: +0.0828 at the 0.01 level of significance and −0.1043 at the 0.001 level of significance, respectively. For the dimension of own revenues (cash solvency), the results of the coefficients were similar in sign directions and size magnitudes: +0.0954 at the 0.001 level of significance and −0.1058 at the 0.001 level of significance, respectively. The coefficient for income per capita for this financial dimension was marginal but was positive and statistically significant at the 0.05 level. In terms of revenues per capita and spending per capita, the results indicated that the coefficients of the percentage of the population in/under the minimum income and income per capita were statistically significant, but with opposite sign directions. For example, the coefficients for revenues per capita were: −3881.45 at the 0.001 level of significance and +0.22 at the 0.001 level of significance, respectively. These results suggest that the level of income of the population is positively related to the levels of revenues and spending for municipal governments, but the percentage of the population in a condition of poverty reduced the ability of the municipal governments to obtain the necessary revenues to meet their financial obligations. Finally, no effects were seen on the financial dimension of debt cost, probably because most of the resources to reduce poverty came from the federal government. Overall, these results indicate that the portion of the population in a condition of poverty negatively influenced the cash and budget solvencies of municipal governments, while the proportion of the population under the minimum income is negatively related to the levels of revenues and spending of the municipalities. As expected, these results show that the level of poverty is negatively associated with the financial performance of municipal governments.
The level of employment in the municipality was captured by the percentage of the population without access to social security, which is strongly related to formal employment. The coefficients of this indicator for the financial dimensions of budget balance (budget solvency) and own revenues (cash solvency) were negative and statistically significant: −0.0367 at the 0.10 level and −0.0498 at the 0.001 level, respectively. However, the coefficients of this indicator for revenues and spending per capita were positive and statistically significant at the 0.001 level: +2813.57 and +3079.17, respectively. Finally, the coefficient for this indicator, as it related to the financial dimension of debt cost, was negative and statistically significant at the 0.01 level of significance: −0.0210. Together, these results suggest that more formal jobs in the community that provided access to social security represented a financial burden in terms of cash solvency, budget solvency, and debt cost solvency, but it positively improved the levels of revenues and spending for municipal governments.
In summary, maintaining access to vital services, such as education, health care, and housing, plus levels of poverty and employment, influenced the FS of the municipal government through different mechanisms that require further investigation. This study contributes to the current literature by providing initial evidence about the association of these contextual factors to the FS.

5. Discussion and Conclusions

Based on the results of the panel data analysis, this study found evidence that technology-intensive initiatives, such as smart cities, and some contextual factors of the municipality, such as the level of poverty, access to specific public services (i.e., health care, housing), and the level of employment, are negatively related to FS over time. In other words, when a project is more technologically intense and its context is more complex, it is expected to be more expensive in the long term.
Research on smart cities has increasingly emphasized the importance of adopting a more holistic approach for evaluating smart city projects, considering not only data and technology but also contextual factors, such as social, economic, political, governance, and financial aspects [40,44]. However, very few studies have pointed out the need for financial models in smart cities [8,43]. In fact, the existing models and indicators of FS have highlighted the economic dimensions of smart city projects [40,41], but have only superficially explained the financial conditions of this type of project over time [2,7,43,44].
This study attempts to start filling this gap through a panel data analysis that shows preliminary evidence of the effects of smart city operations, ICT infrastructure, and different contextual factors on the FS of municipal governments. The results suggest that smart city operations over time and the ICT infrastructure have a statistically significant association with the FS of municipal governments. In addition, access to education, health care, and housing and the levels of poverty and employment are associated with different dimensions of the financial performance of municipal governments.
The association between ICT infrastructure and the dimensions of FS suggests two patterns. The first pattern revealed that the relationship across the types of online services varies across budget balance (budget solvency) and own revenues (cash solvency). A larger positive and statistically significant association existed for transactional online services than for other service types. For example, online services enabling transactions increased budget solvency by an additional 1.83 percentage points more than online services offering only information. This result was also the case for own revenues, as online services enabling transactions increased own revenues by an additional 0.81 percentage points more than online services offering only information. In these examples, the budget balance and level of own revenues are positively associated with transactional online services rather than online services that provided information only. Future research about the impact of ICT infrastructure and its different forms should consider these potential effects on the FS of local governments. These studies need to focus not only on the increase of ICT infrastructure and/or the return of the ICT investment from a financial point of view but also to take the perspective of social benefits (positive externalities).
The second pattern showed that the type of technology enabling the digitalization process of public services is related to the financial performance of municipal governments. The results showed that only the indicator of the number of phone lines per 10,000 inhabitants was positive and statistically significant in the financial dimension of budget balance (budget solvency) and own revenues (cash solvency). However, the question of to what extent each type of technology enables a financially sustainable condition remains relevant to practitioners and researchers. In this study, no final conclusions are presented, but different relationships are shown between the financial dimensions and different technologies: phone lines, computers, and servers. In practice, conducting ICT investments and operating each of these technological infrastructures to support public services represents different challenges.
The results of this study are critical for the Mexican context since many municipal governments are investing large amounts of resources in ICT equipment to strengthen their call centers for emergency and non-emergency services, 911 and 311, respectively. Consistent with our results, Chatfield and Reddick (2018) [71] conducted a case study of a US city government’s use of big data analytics to enhance customer agility in 311 on-demand services. Their study found that investment in certain types of ICT infrastructures and their subsequent assimilation of big data technologies impacted the internal process-level’s strategic alignment across different areas within the municipal government. Therefore, we argue that investments in ICT infrastructure could be better understood if framed using financial analysis and other techniques to assess the benefits and public value of these long-term decisions for ICT investments and spending.
In general, the association of ICT infrastructure with financial conditions was negative at the initial stages of implementation and positive in the long run. This phenomenon seems to indicate that investments in ICT infrastructure by governments are, on average, a long-term process that influences the financial performance of governments, inferring potential positive and negative returns on investment over time that need further investigation. This finding was consistent with previous statements in the literature that warned that smart city projects are too expensive and potentially not sustainable financially for some city governments [43]. In fact, Bifulco, Tregua, Amitrano, and D’Auria (2016) [72] pointed out that, in order to increase opportunities for long-term success related to smart city projects, it is necessary to develop new models integrating institutional, organizational, technological, and contextual factors into more comprehensive and integrative perspectives that might be considered for improving existing financial sustainability tools around the world, such as the Sustainability Framework 2.0. of the IFAC, or the Fiscal Sustainability Report elaborated by the European Commission [73,74]. We argue that FS should be a critical component of these integrative frameworks.
Based on this study, FS seems to be a useful perspective to better understand smart city projects from a financial perspective over time. However, other financial analytical tools and frameworks, such as a cost-benefit analysis, return on investment, public value assessment, and stakeholder analysis, could also be useful when attempting to build a more integrative perspective and to improve the short- and long-term evaluations of smart city projects. Future research should take a holistic approach toward an assessment of smart city initiatives that clearly includes FS. Finally, this study uses data exclusively for Mexican municipalities, which could be seen as an important research limitation, given that the selection of examples was conducted within a single socio-cultural environment. Therefore, we suggest that an idea for future research could be to expand the research to include other national contexts with different characteristics.

Author Contributions

Conceptualization, G.P.-C. and J.R.G.-G.; methodology, G.P.-C. and J.R.G.-G.; formal analysis, G.P.-C. and J.R.G.-G.; data curation, G.P.-C. and J.R.G.-G.; writing—original draft preparation, G.P.-C. and J.R.G.-G.; writing—review and editing, G.P.-C. and J.R.G.-G. All authors have read and agreed to the published version of the manuscript.

Funding

This research received no external funding.

Institutional Review Board Statement

Not applicable.

Informed Consent Statement

Not applicable.

Data Availability Statement

The data supporting the results and generated during the research can be requested to authors.

Conflicts of Interest

The authors declare no conflict of interest.

References

  1. Matus Ruiz, M.; Ramírez Autrán, R. (Eds.) Ciudades Inteligentes en Iberoamérica; Ejemplos de Iniciativas Desde el Sector Privado, la Sociedad Civil, el Gobierno y la Academia; INFOTEC Centro de Investigación e Innovación en Tecnologías de la Información y Comunicación: Ciudad de México, Mexico, 2016. [Google Scholar]
  2. Gasco-Hernandez, M. Criterios para Evaluación de Buenas Prácticas en el Ámbito del uso de las Tecnologías de la Información y las Comunicaciones (Criteria to Assess Good Practices Related to the Use of Information and Communication Technologies); Fundació Pi i Sunyer: Barcelona, Spain, 2009. [Google Scholar]
  3. Lombardi, P.; Giordano, S.; Farouh, H.; Yousef, W. Modelling the smart city performance. Innov. Eur. J. Soc. Sci. Res. 2012, 25, 137–149. [Google Scholar] [CrossRef]
  4. Neirotti, P.; De Marco, A.; Cagliano, A.C.; Mangano, G.; Scorrano, F. Current trends in Smart City initiatives: Some stylised facts. Cities 2014, 38, 25–36. [Google Scholar] [CrossRef] [Green Version]
  5. Cabaleiro, R.; Buch, E.; Vaamonde, A. Developing a Method to Assessing the Municipal Financial Health. Am. Rev. Public Adm. 2013, 43, 729–751. [Google Scholar] [CrossRef]
  6. Navarro-Galera, A.; Rodríguez-Bolívar, P.; Alcaide-Muñoz, L.; López-Subires, M.D. Measuring the financial sustainability and its influential factors in local governments. Appl. Econ. 2016, 48, 3961–3975. [Google Scholar] [CrossRef]
  7. Giffinger, R. Smart City Concepts: Chances and Risks of Energy Efficient Urban Development. In Smart Cities, Green Technologies, and Intelligent Transport Systems. In Proceedings of the International Conference on Smart Cities and Green ICT Systems, SMARTGREENS 2015, VEHITS 2015, Lisbon, Portugal, 20–22 May 2015; Springer: Cham, Switzerland, 2016; pp. 3–16. [Google Scholar]
  8. Timeus k Vinaixa, J.; Pardo-Bosch, F. Creating business models for smart cities: A practical framework; Special issue: Management, Governance and Accountability for Smart Cities and Communities. J. Public Manag. Rev. 2020, 22, 726–745. [Google Scholar] [CrossRef] [Green Version]
  9. Adams, C.A.; Muir, S.; Hoque, Z. Measurement of Sustainability Performance in the Public Sector, Sustainable Accountable. Manag. Policy J. 2014, 5, 46–67. [Google Scholar]
  10. ESA. European System of Accounts 2010; Eurostat European Commission, Publications Office of the European Union: Luxembourg, 2013. [Google Scholar]
  11. IFAC. Reporting on the Long-Term Sustainability of an Entity’s Finances; IFAC: New York, NY, USA, 2013. [Google Scholar]
  12. IMF. Government Finance Statistics Manual 2014 (GFSM 2014); International Monetary Fund: Washington, DC, USA, 2014. [Google Scholar]
  13. UN. System of National Accounts 2008 (SNA 2008); United Nations: New York, NY, USA, 2009; Available online: https://unstats.un.org/unsd/nationalaccount/docs/sna2008.pdf (accessed on 12 May 2022).
  14. Dameri, R.P.; Rosenthal-Sabroux, C. Smart City and Value Creation. In Smart City. How to Create Public and Economic Value with High Technology in Urban Space; Dameri, R.P., Rosenthal-Sabroux, C., Eds.; Springer International Publishing: Cham, Switzerland, 2014. [Google Scholar]
  15. Chapman, J.I. State and Local Fiscal Sustainability: The Challenges. Public Adm. Rev. 2008, 68, S115–S131. [Google Scholar] [CrossRef]
  16. Castelnovo, W.; Misuraca, G.; Savoldelli, A. Smart Cities Governance: The Need for a Holistic Approach to Assessing Urban Participatory Policy Making. Soc. Sci. Comput. Rev. 2016, 34, 724–739. [Google Scholar] [CrossRef]
  17. Caird, S.P.; Hallett, S.H. Towards evaluation design for smart city development. J. Urban Des. 2019, 24, 188–209. [Google Scholar] [CrossRef]
  18. Batty, M. Smart cities of the future. Eur. Phys. J. Spec. Top. 2012, 214, 481–515. [Google Scholar] [CrossRef] [Green Version]
  19. Anthopoulos, L.; Tsoukalas, I.A. The implementation model of a digital city. J. e-Gov. 2005, 2, 91–110. [Google Scholar]
  20. Yovanof, G.S.; Hazapis, G.N. An architectural framework and enabling wireless technologies for digital cities & intelligent urban environments. Wirel. Pers. Commun. 2009, 49, 445–463. Available online: https://link.springer.com/article/10.1007/s11277-009-9693-4 (accessed on 12 May 2022).
  21. Kanter, R.M.; Litow, S.S. Informed and Interconnected: A Manifesto for Smarter Cities; Working Paper; Harvard Business School General Management Unit: Boston, MA, USA, 2009; pp. 9–141. Available online: https://www.hbs.edu/faculty/Pages/item.aspx?num=36185 (accessed on 12 May 2022).
  22. Lindskog, H. Smart communities initiatives. In Proceedings of the 3rd ISOneWorld Conference, Las Vegas, NV, USA, 14–16 April 2004; Available online: http://www.heldag.com/articles/Smart%20communities%20april%202004.pdf (accessed on 12 May 2022).
  23. Noori, N.; de Jong, M.; Janssen, M.; Schraven, D.; Hoppe, T. Input-Output Modeling for Smart City Development. J. Urban Technol. 2021, 28, 71–92. [Google Scholar] [CrossRef]
  24. Trencher, G.; Karvonen, A. Stretching “smart”: Advancing health and well-being through the smart city agenda. Local Environ. 2019, 24, 610–627. [Google Scholar] [CrossRef]
  25. Giffinger, R.; Fertner, C.; Kramar, H.; Kalasek, R.; PichlerMilanoviü, N.; Meijers, E. Smart Cities: Ranking of European Medium-Sized Cities; Centre of Regional Science (SRF), Vienna University of Technology: Vienna, Austria, 2007; Available online: http://www.smart-cities.eu/download/city_ranking_final.pdf (accessed on 12 May 2022).
  26. Bosch, P.; Jongeneel, S.; Rovers, V.; Neumann, H.M.; Airaksinen, M.; Huovila, A. CITYkeys Indicators for Smart City Projects and Smart Cities; CityKeys, European Commission: Brussels, Belgium, 2017; Available online: http://nws.eurocities.eu/MediaShell/media/CITYkeysD14Indicatorsforsmartcityprojectsandsmartcities.pdf (accessed on 25 January 2018).
  27. Hollands, R.G. Will the real smart city please stand up? Intelligent, Progressive, or Entrepreneurial? City 2008, 12, 303–320. [Google Scholar] [CrossRef]
  28. Komninos, N. Intelligent Cities and Globalization of Innovation Networks; Taylor & Francis: London, UK, 2008. [Google Scholar]
  29. Landry, C. The Creative Centre; Earthscan: Londres, UK, 2008. [Google Scholar]
  30. Pereira, G.V.; Luna-Reyes, L.F.; Gil-Garcia, J.R. Governance innovations, digital transformation and the generation of public value in Smart City initiatives. In Proceedings of the 13th International Conference on Theory and Practice of Electronic Governance, Athens, Greece, 23–25 September 2020; pp. 602–608. [Google Scholar]
  31. Gil, O.; Zheng, T.C. Smart cities through the lenses of public policy: The case of Shanghai. Rev. Española Cienc. Política 2015, 38, 63–84. [Google Scholar]
  32. Leydesdorff, L.; Etzkowitz, H. Can “The Public” Be Considered as a Fourth Helix in University-Industry-Government Relations? Report of the Fourth Triple Helix Conference. Sci. Public Policy 2003, 30, 55–61. [Google Scholar] [CrossRef]
  33. Toli, A.M.; Murtagh, N. The Concept of Sustainability in Smart City Definitions. Front. Built Environ. 2020, 6, 77. [Google Scholar] [CrossRef]
  34. Oberti, I.; Pavesi, A.S. The triumph of the smart city. TECHNE J. Technol. Archit. Environ. 2013, 5, 117–122. Available online: https://oaj.fupress.net/index.php/techne/article/view/4300 (accessed on 12 May 2022).
  35. Caragliu, A.; Del Bo, C.; Nijkamp, P. Smart cities in Europe. J. Urban Technol. 2011, 18, 65–82. [Google Scholar] [CrossRef]
  36. Aurigi, A.; Odendaal, N. From “Smart in the Box” to “Smart in the City”: Rethinking the Socially Sustainable Smart City in Context. J. Urban Technol. 2020, 28, 55–70. [Google Scholar] [CrossRef]
  37. Carli, R.; Dotoli, M.; Pellegrino, R.; Ranieri, L. Measuring and managing the smartness of cities: A Framework for classifying performance indicators. In Proceedings of the 2013 IEEE International Conference on Systems, Man, and Cybernetics, Manchester, UK, 13–16 October 2013. [Google Scholar]
  38. Monfaredzadeha, T.; Krueger, R. Investigating Social Factors of Sustainability in a Smart City. Procedia Eng. 2015, 118, 1112–1118. [Google Scholar] [CrossRef] [Green Version]
  39. Castillo, H.; Price, A.; Moobela, C.; Mathur, V. Assessing urban social sustainability: Current capabilities and opportunities for future research. Int. J. Environ. Cult. Econ. Soc. Sustain. 2007, 3, 39–48. [Google Scholar] [CrossRef]
  40. Martin, C.H.; Evans, J.; Karvonenc, A. Smart and sustainable? Five tensions in the visions and practices of the smart-sustainable city in Europe and North America. Technol. Forecast. Soc. Chang. 2018, 133, 269–278. [Google Scholar] [CrossRef]
  41. Monfaredzadeh, T.; Berardi, U. Beneath the smart city: Dichotomy between sustainability and competitiveness. Int. J. Sustain. Build. Technol. Urban Dev. 2015, 6, 140–156. [Google Scholar] [CrossRef]
  42. Haarstad, H. Constructing the sustainable city: Examining the role of sustainability in the ‘smart city’ discourse. J. Environ. Policy Plan. 2017, 19, 423–437. [Google Scholar] [CrossRef]
  43. Komninos, N. Smart City Governance and Financing. 2013. Available online: http://innovatv.it/video/2807981/nicos-komninos/finanziare-le-smart-city-soluzioni-confronto#.VLpqsv45DIU (accessed on 25 June 2015).
  44. Shen, L.Y.; Jorge Ochoa, J.; Shah, M.N.; Zhang, X. The application of urban sustainability indicators—A comparison between various practices. Habitat Int. 2011, 35, 17–29. [Google Scholar] [CrossRef]
  45. Cocchia, A. Smart and Digital City: A Systematic Literature Review. In Smart City. How to Create Public and Economic Value with High Technology in Urban Space; Dameri, R.P., Rosenthal-Sabroux, C., Eds.; Springer International Publishing: Cham, Switzerland, 2014. [Google Scholar]
  46. Albino, V.; Berardi, U.; Dangelico, R.M. Smart cities: Definitions, dimensions, performance, and initiatives. J. Urban Technol. 2015, 22, 3–21. [Google Scholar] [CrossRef]
  47. Da Silva de Santana, E.; Nunes, E.; Santos, L.B. The use of ISO 37122 as standard for assessing the maturity level of a smart city. Int. J. Adv. Eng. Res. Sci. 2018, 5, 309–315. [Google Scholar] [CrossRef]
  48. Huovilaa, A.; Bosch, P.; Airaksinen, M. Comparative analysis of standardized indicators for smart sustainable cities: What indicators and standards to use and when? Cities 2019, 89, 141–153. [Google Scholar] [CrossRef]
  49. Berne, R.; Schramm, R. The Financial Analysis of Governments; Prentice Hall: Englewood Cliffs, NJ, USA, 1986. [Google Scholar]
  50. Hendrick, R. Assessing and measuring the fiscal health of local governments. Focus on Chicago suburban municipalities. Urban Aff. Rev. 2004, 40, 78–114. [Google Scholar]
  51. Rodríguez Bolívar, M.P. Financial Sustainability in Public Administration. A synthesis of the Contributions for Improving Financial Sustainability. In Financial Sustainability in Public Administration; Rodríguez, M.P., Ed.; Palgrave Macmillan: Cham, Switzerland, 2017. [Google Scholar]
  52. Norcross, E.; Gonzalez, O. Ranking the States by Fiscal Condition; Mercatus Research, Mercatus Center at the George Mason University: Arlington, VA, USA, 2017. [Google Scholar]
  53. Wang, X.H.; Dennis, L.; Tu, Y.S. Measuring Fiscal Condition: A Study of US States. Public Budg. Financ. 2007, 27, 1–21. [Google Scholar] [CrossRef]
  54. Montesinos, V.; Dasí, R.M.; Brusca, I. A Framework for Comparing Financial Sustainability in EU Countries: National Accounts, Governmental Accounting and te Challenge of Harmonization. In Financial Sustainability of Public Sector Entities; Caruana, J., Brusca, I., Caperchione, E., Cohen, S., Cohen, F.M., Eds.; The Relevance of Accounting Frameworks; Palgrave MacMillan: Cham, Switzerland, 2019. [Google Scholar]
  55. Groves, S.M.; Valente, M.G.; Schulman, M. Evaluation Financial Condition: A Handbook for Local Government; International City/County Management Association (IMCA): Washington, DC, USA, 2003. [Google Scholar]
  56. Kavanagh, S.; Pisano, M.; Tang, S.Y.; McGrath, M.F.; Linkhart, D.; Hudson, M.; Colon, E. Financial Sustainability Index: A Self Assessment Tool for Financial Sustainability; Working Paper WP17MP2; Lincoln Institute of Land Policy: Cambridge, MA, USA, 2017; Available online: https://www.gfoa.org/sites/default/files/pisano_wp17mp2_0.pdf (accessed on 15 July 2019).
  57. McDonald, B. Measuring the Fiscal Health of Municipalities; Working Paper WP17BM1; Lincoln Institute of Land Policy: Cambridge, MA, USA, 2017. [Google Scholar]
  58. Aquino, A.C.; Cardoso, R.L. Accounting framework (re)interpretation to accommodate tensions from financial sustainability competing concepts. In Financial Sustainability of Public Sector Entities. The Relevance of Accounting Frameworks; Caruana, J., Brusca, I., Caperchione, E., Cohen, S., Manes Rossi, F., Eds.; Palgrave MacMillan: Cham, Switzerland, 2019; pp. 83–102. [Google Scholar]
  59. De Aquino, A.C.; Cardoso, R.L. Financial resilience in Brazilian municipalities. In Governmental Financial Resilience: International Perspectives on How Local Governments Face Austerity; Ileana Steccolini, I., Singh Jones, M.D., Saliterer, I., Eds.; Emerald Publishing Limited: Bingley, UK, 2017; Volume 27. [Google Scholar]
  60. Lima, D.V.D.; Aquino, A.C.B.D. Financial resilience of municipal civil servants’ pension funds. Rev. Contab. Finanças 2019, 30, 425–445. [Google Scholar] [CrossRef]
  61. Gupta, S.; Keen, M.; Shah, A.; Verdier, G. Digital Revolutions in Public Finance; International Monetary Fund: Washington, DC, USA, 2017. [Google Scholar]
  62. Ndou, V. E-Government for Developing Countries: Opportunities and Challenges. Electron. J. Inf. Syst. Dev. Ctries 2004, 18, 1–24. [Google Scholar] [CrossRef]
  63. Alawadhi, S.; Aldama-Nalda, A.; Chourabi, H.; Gil-Garcia, J.R.; Leung, S.; Mellouli, S.; Nam, T.; Pardo, T.A.; Scholl, H.J.; Walker, S. Building understanding of smart city initiatives. In Proceedings of the EGOV 2012, LNCS 7443, Kristiansand, Norway, 3–6 September 2012; Scholl, H.J., Janssen, M., Wimmer, M., Moe, C.E., Flak, L.S., Eds.; IFIP International Federation for Information Processing: Laxenburg, Austria, 2012; pp. 40–53. [Google Scholar]
  64. Leon, N. Attract and connect: The 22@Barcelona innovation district and the internationalization of Barcelona business. Innov. Organ. Manag. 2008, 10, 235–246. [Google Scholar] [CrossRef]
  65. INEGI. State and Municipal Government’s Public Finances Dataset; Instituto Nacional de Estadística y Geografía (INEGI): Aguascalientes, Mexico, 2021. Available online: https://www.inegi.org.mx/temas/finanzas/#Tabulados (accessed on 12 May 2022).
  66. CONAPO. Population Projections at the Municipal Level Dataset; Consejo Nacional de Población (CONAPO): Mexico City, Mexico, 2021. Available online: https://www.gob.mx/conapo/documentos/proyecciones-de-la-poblacion-de-los-municipios-de-mexico-2015-2030?idiom=es (accessed on 12 May 2022).
  67. INEGI. Municipal Government Census Dataset; Instituto Nacional de Estadística y Geografía (INEGI): Aguascalientes, Mexico, 2015. Available online: https://www.inegi.org.mx/programas/cngmd/2015/ (accessed on 12 May 2022).
  68. INEGI. Municipal Government Census Dataset; Instituto Nacional de Estadística y Geografía (INEGI): Aguascalientes, Mexico, 2017. Available online: https://www.inegi.org.mx/programas/cngmd/2017/ (accessed on 12 May 2022).
  69. INEGI. Municipal Government Census Dataset; Instituto Nacional de Estadística y Geografía (INEGI): Aguascalientes, Mexico, 2019. Available online: https://www.inegi.org.mx/programas/cngmd/2019/ (accessed on 12 May 2022).
  70. CONEVAL. Social and Poverty at the Municipal Level Dataset; Consejo Nacional de Evaluación de la Política de Desarrollo Social (CONEVAL): Mexico City, Mexico, 2021; Available online: https://www.coneval.org.mx/Medicion/Paginas/Pobreza-municipal.aspx (accessed on 12 May 2022).
  71. Chatfield, A.T.; Reddick, C.G. Customer agility and responsiveness through big data analytics for public value creation: A case study of Houston 311 on-demand services. Gov. Inf. Q. 2018, 35, 336–347. [Google Scholar] [CrossRef]
  72. Bifulco, F.; Tregua, M.; Amitrano, C.C.; D’Auria, A. ICT and sustainability in smart cities management. Int. J. Public Sect. Manag. 2016, 29, 132–147. [Google Scholar] [CrossRef]
  73. IFAC. Sustainability Framework 2.0. Professional Accountants as Integrators; International Federation of Accountants (IFAC): New York, NY, USA, 2012. [Google Scholar]
  74. EC. Fiscal Sustainability Report 2018; European Commission: Brussels, Belgium, 2018; Available online: https://ec.europa.eu/info/publications/economy-finance/fiscal-sustainability-report-2018_en (accessed on 12 May 2022).
Figure 1. The family of ISO standards for the smart city. Source: authors’ own elaboration, based on [46,47,48].
Sustainability 14 06055 g001
Figure 2. A systematic perspective of FS. Source: authors’ own elaboration, based on Hendrick’s dimensions of financial health (2004) [50].
Sustainability 14 06055 g002
Figure 3. Panel data model specification. Source: authors’ own elaboration.
Sustainability 14 06055 g003
Figure 4. Budget balance. Source: authors’ own elaboration.
Sustainability 14 06055 g004
Figure 5. Own revenues. Source: authors’ own elaboration.
Sustainability 14 06055 g005
Figure 6. Revenues per capita. Source: authors’ own elaboration.
Sustainability 14 06055 g006
Figure 7. Spending per capita. Source: authors’ own elaboration.
Sustainability 14 06055 g007
Figure 8. Debt cost. Source: authors’ own elaboration.
Sustainability 14 06055 g008
Table 1. Financial dimensions and indicators of FS for smart cities.
DimensionFinancial IndicatorDefinitionInterpretation
Cash solvency: Ability of government to pay its immediate obligations with its own revenues (not including restricted transfers)Own revenues(Tax revenues + unrestricted revenues + other own revenue)/(Total revenues − financing − initial balance)Higher values than average indicate solid cash solvency.
Budget solvency: Degree to which a government will end the fiscal year with a surplus or deficit (overall balance)Budget balanceTotal revenues/Total expensesA ratio equal to or greater than 1 indicates solid budget solvency. A ratio of less than 1 indicates unstable budget solvency.
Long-run solvency: Ability of government to meet long-term spending commitments of public debtDebt cost or debt obligation to total spending ratioDebt cost/Total spendingLower values than average indicate solid long-run solvency
Service-level solvency: Ability to meet citizens’ demands of services with actual levels of spendingRevenues per capitaTotal revenues/PopulationHigher values than average indicate solid service-level solvency
Spending per capitaTotal spending/PopulationHigher values than average indicate solid service-level solvency
Source: authors’ own elaborations, with available financial and budgeting data at the municipal level in Mexico.
Table 2. Summary of variables and sources.
DimensionVariableObsMeanStd. Dev.MinMax
Financial conditionBudget balance 151690.86830.28670.09222.5319
Own revenues 151690.83170.25720.09221
Revenues per capita 251695067.77038.128.9331,823.0
Spending per capita 251695634.17370.979.4309,883.1
Debt cost 151690.01710.034900.4834
Smart city operationYear 2014 as smart city51690.05170.221301
Year 2016 as smart city51690.01720.130101
Year 2018 as smart city51690.01720.130101
ICT infrastructureNumber of information systems 351691.88066.0822046
Number of online services offering information 351690.75123.0370024
Number of online services enabling interactions 351690.14511.2526024
Number of online services enabling transactions 351690.03730.4372015
Phone lines per 10,000 inhabitants 351690.05230.4532012.4611
Computers per 10,000 inhabitants 351690.17130.9297017.9464
Servers per 10,000 inhabitants 351690.00480.079503.3326
Social and economic contextsPercentage of pop. with education deficiencies 421310.22060.109100.6780
Percentage of pop. without health care access 421310.14910.085100.6797
Percentage of pop. without social security access 421310.66020.19460.06021
Percentage of pop. with adequate housing access 421310.14220.138500.9252
Percentage of pop. under minimum income to guarantee basic wellness 421310.56000.215901
Income per capita 421312968.52030.0330.650,374.0
Percentage of pop. in poverty 421310.61650.34490.00001.8901
Source: authors’ own elaborations, based on 1 INEGI (2021) [65]; 2 CONAPO (2021) [66]; 3 (INEGI, 2015; 2017; 2019) [67,68,69]; 4 CONEVAL (2021) [70].
Table 3. Panel data models’ results.
Fixed EffectsRandom Effects
Budget BalanceOwn
Revenues
Revenues per CapitaSpending per CapitaDebt
Cost
Spending per CapitaDebt
Cost
Year 2014 as a smart city0.0439 ***0.0744 ****−7.88−337.890.0341 ****−346.640.0339 ****
Year 2016 as a smart city−0.0511 ***−0.0965 ****−706.70 *−440.55−0.0089−697.14 *−0.0091
Year 2018 as a smart city−0.0645 ****−0.1017 ****−677.51−324.45−0.008572.84−0.0061
Information systems0.0024 ****0.0029 ****9.40−1.280.0001−6.040.0000
Online services offering information0.00060.00007.024.150.00001−4.06−0.0001
Online services enabling interactions0.00270.0032 **8.64−9.430.0007−16.720.0006
Online services enabling transactions0.0189 ****0.0081 **36.26−38.14−0.0024−58.74−0.0027
Phone lines per 10,000 inhabitants.0.0146 *0.0217 ****249.70187.32−0.0001170.82−0.0003
Computers per 10,000 inhabitants0.00810.003363.32124.26−0.0015105.67−0.0018
Servers per 10,000 inhabitants0.00850.03191071.13768.840.0031785.200.0032
Percentage of pop. w/educ. access0.0730 **0.0294579.45248.03−0.0132258.12−0.0129
Percentage of pop. w/health care access−0.0410−0.0338−4370.73 ****−4497.92 ****0.0334 ****−4705.58 ****0.0305 ***
Percentage of pop. w/housing access−0.0213−0.00031224.47 **1534.36 ***0.0149 *1401.25 ***0.0140 *
Percentage of pop. under min. income0.0828 ***0.0954 ****−3881.45 ****−4188.98 ****0.0126−4349.00 ****0.0116
Income per capita0.0000020.000002 **0.22 ****0.20 ****0.0000010.21 ****0.000001 *
Percentage of pop. in poverty−0.1043 ****−0.1058 ****301.39741.23−0.0118737.03−0.0125
Percentage of pop. with no access to social security−0.0367 *−0.0498 ****2813.57 ****3079.17 ****−0.0210 ***3328.71 ****−0.0192 ***
Constant0.9034 ****0.8741 ****4033.27 ****4268.03 ****0.0268 ****4352.74 ****0.0291 ****
Number of observations (groups)2131 (3)2131 (3)2131 (3)2131 (3)2131 (3)2131 (3)2131 (3)
R2 within/between0.1125/0.99210.2394/0.99920.1097/0.63990.1131/0.98300.1202/0.18470.1094/0.88720.1174/0.1348
F(28, 2100) (Prob. > F)9.54 (0.0000)23.61 (0.0000)9.24 (0.0000)9.57 (0.0000)10.25 (0.0000)348.34 (0.0000)277.22 (0.0000)
F(2, 2100) (Prob. > F)1225.4 (0.00)2230.0 (0.0000)85.82 (0.0000)15.86 (0.0000)5.13 (0.0060)n.a.n.a.
Hausman test (Prob. > Chi2(27))4304.15 (0.0)20,951.44 (0.0)270.70 (0.0000)34.08 (0.1638)10.30 (0.9984)n.a.n.a.
Source: author’s own elaborations, based on STATA estimates. Levels of significance: * 0.10; ** 0.05; *** 0.01; **** 0.001.
Publisher’s Note: MDPI stays neutral with regard to jurisdictional claims in published maps and institutional affiliations.

