Article

Planning, Optimisation and Evaluation of Small Power-to-Gas-to-Power Systems: Case Study of a German Dairy

by
Lucas Schmeling
1,2,*,†,
Alexander August Ionnis Buchholz
3,
Hilmer Heineke
3,
Peter Klement
2,
Benedikt Hanke
2 and
Karsten von Maydell
2
1
KEHAG Energiehandel GmbH, Im Technologiepark 4, 26129 Oldenburg, Germany
2
German Aerospace Center (DLR), Institute of Networked Energy Systems, Carl-von-Ossietzky-Str. 15, 26129 Oldenburg, Germany
3
New Power Pack GmbH, Kopernikusstraße 23, 49377 Vechta, Germany
*
Author to whom correspondence should be addressed.
Current address: Lintas Green Energy GmbH, Alter Stadthafen 3b, 26122 Oldenburg, Germany.
Sustainability 2022, 14(10), 6050; https://doi.org/10.3390/su14106050
Submission received: 17 March 2022 / Revised: 1 May 2022 / Accepted: 10 May 2022 / Published: 16 May 2022
(This article belongs to the Special Issue Hydrogen Energy Systems for Energy Storage Applications)

Abstract

:
In the course of the energy transition, distributed, hybrid energy systems, such as the combination of photovoltaic (PV) and battery storages, is increasingly being used for economic and ecological reasons. However, renewable electricity generation is highly volatile, and storage capacity is usually limited. Nowadays, a new storage component is emerging: the power-to-gas-to-power (PtGtP) technology, which is able to store electricity in the form of hydrogen even over longer periods of time. Although this technology is technically well understood and developed, there are hardly any evaluations and feasibility studies of its widespread integration into current distributed energy systems under realistic legal and economic market conditions. In order to be able to give such an assessment, we develop a methodology and model that optimises the sizing and operation of a PtGtP system as part of a hybrid energy system under current German market conditions. The evaluation is based on a multi-criteria approach optimising for both costs and CO2 emissions. For this purpose, a brute-force-based optimal design approach is used to determine optimal system sizes, combined with the energy system simulation tool oemof.solph. In order to gain further insights into this technology and its future prospects, a sensitivity analysis is carried out. The methodology is used to examine the case study of a German dairy and shows that PtGtP is not yet profitable but promising.

1. Introduction

The supply of electricity and heat to businesses is changing. Driven by climate change and the finite nature of fossil resources, the expansion of renewable energy generation is leading to a strong decentralisation of energy production. Companies no longer obtain energy exclusively via national energy grids from large power plants but generate electricity, e.g., with photovoltaic (PV) systems on their own roofs. In order to be able to optimally cover the demand for energy at any time, different energy generators and storage facilities are combined to form so-called hybrid energy system (HES) [1]. These can be defined as systems combining “two or more energy conversion devices (e.g., electricity generators or storage devices), or two or more fuels for the same device, that when integrated, overcome limitations that may be inherent in either” [1].
A classic hybrid system, for example, is the combination of a PV system and battery storage. Here, the limitation due to the volatility of the PV power generation is complemented by the intermediate storage in the battery. Battery storage systems are short-term storage devices that store electricity for only a few hours or days due to their usually low storage capacity and energy density. However, in order to make better use of the locally generated electricity, the surplus summer generation from renewable sources would have to be made usable in late winter via a long-term storage facility.
A promising form of long-term storage for excess local electricity is the power-to-gas-to-power (PtGtP) technology [2,3], in which electricity is converted into hydrogen via an electrolyzer (ELY), stored in a hydrogen storage (HS) and, if required, converted back into electricity via a fuel cell (FC).
In politics, the topic of hydrogen has taken on an important role in the decarbonisation of the economy. In the context of the G20 summit in Japan (2019), the International Energy Agency has published a report to show the current status of hydrogen and provide recommendations and guidelines for its future development [4]. The report notes that clean hydrogen is currently experiencing political and economic momentum, and that the number of strategies and projects around the world is increasing dramatically. The report concludes that the technology needs to be expanded and costs reduced in order for hydrogen to be used on a large scale.
Each country is pursuing different strategies and intermediate steps to achieve long-term decarbonisation. Some countries’ strategies, such as those of the EU, are based on the assumption that hydrogen will be produced entirely from renewable energies [5,6]. In addition, countries such as Germany aim to import renewably-produced hydrogen from countries with more hours of sunshine—for example, Africa—in order to meet future demand [7]. Other countries such as China are equally striving to produce green and blue hydrogen [8,9].
However, the question must be asked how mature the systems already are for use, what the market chances of such systems look like today, and when a nationwide installation of such systems can be expected. The scientific literature on this is still relatively sparse and has so far focused primarily on the development of the technical components and integration into off-grid systems. For the market ramp-up of PtGtP, there is a lack of detailed analysis of both the valid legal framework and the resulting economic and environmental friendliness. However, this can and must of course be done in close dependence with the technological performance and thus, as a first step, with a realistic techno-economic model of such an HES. In order to address this research gap in more detail and thus provide a better insight into the market ramp-up, we examine the case of a dairy under German conditions that come as close as possible to actual conditions. We initially focus on a small PtGtP system in combination with a common HES. Our intention is to enter the market with a small system as an add-on option to existing systems and thus achieve significant economic and ecological advantages. The main contributions of the publications can therefore be summarised as follows:
  • Identification of the relevant current economic and regulatory market conditions in Germany;
  • Technical modelling of a PtGtP plant based on data sheets of different manufacturers;
  • Linking of all relevant technical components in an established open-source energy system modelling tool (oemof.solph);
  • Development of a multi-criteria and objective evaluation metric for assessing the use of PtGtP in existing HES;
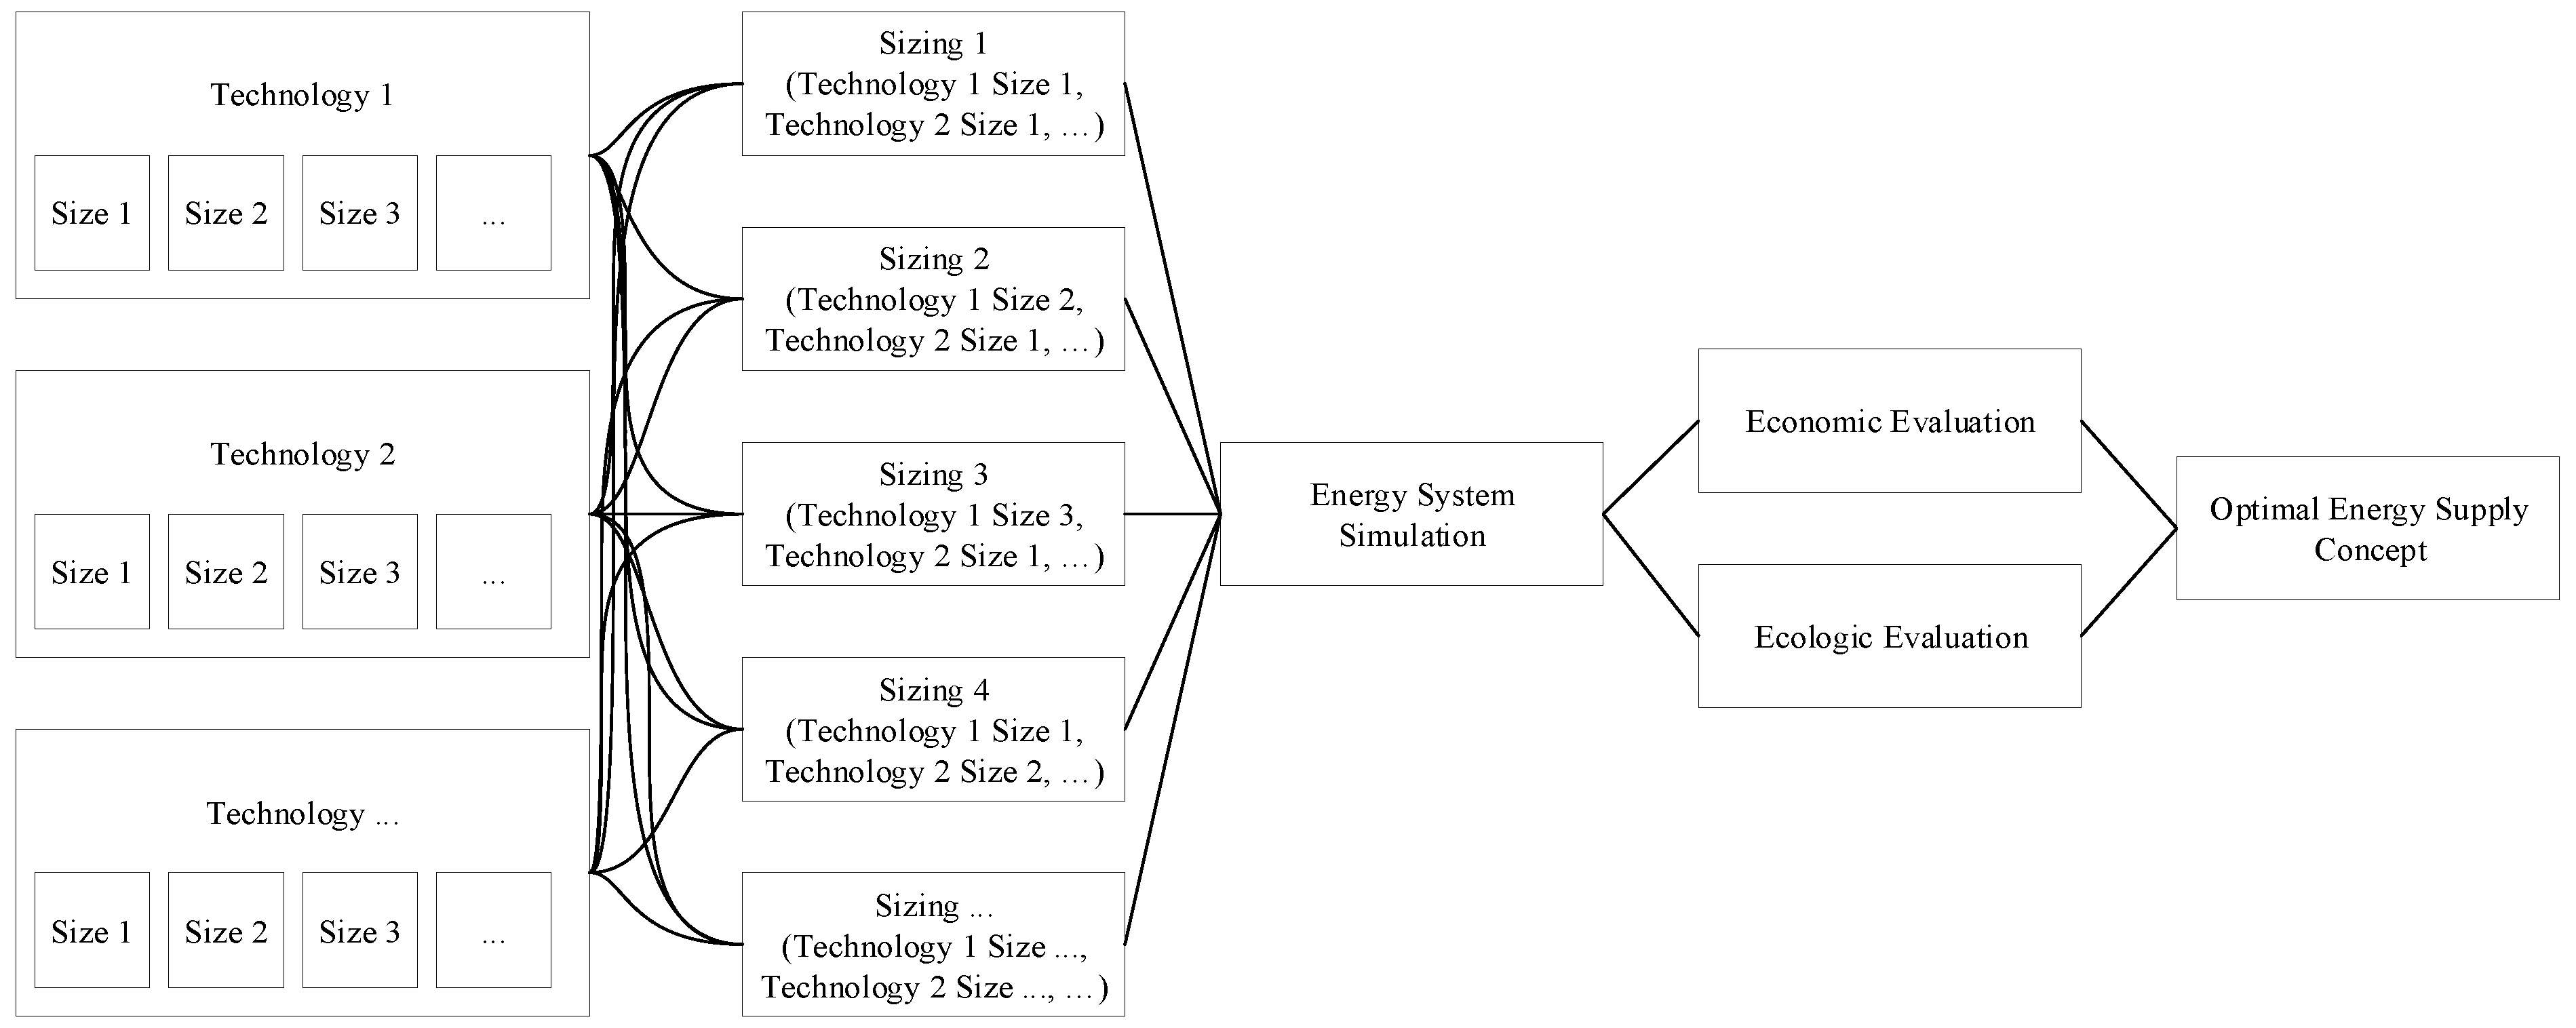
  • Optimal sizing of all relevant technologies for a case study with a brute force approach;
  • Analysis of future viability using a sensitivity analysis.
For our study, we proceed as follows: first of all, Section 2 presents a detailed literature review of the current state of research on HESs using hydrogen. In Section 3, an energy system simulation and optimal sizing framework are presented. This framework is used in Section 5 to analyse the case study of a dairy in Oldenburg, Germany, which is briefly introduced in Section 4. The results are discussed in Section 6, and the next steps are summarised in Section 7.

2. Related Work

As outlined above, the integration of hydrogen-based electricity storage in HESs is currently being researched for a variety of reasons. The focus of research has shifted significantly in the last years from mainly technical proof-of-concept studies to economic feasibility and sustainability analyses and finally to analyses of market introduction. We would like to give a brief outline of the relevant literature on this topic in order to be able to frame our research interests.
Vosen and Keller [10] mentioned that the hybrid storage options, in which hydrogen and battery storage were used, were already investigated in the 1990s. In their study, they investigated the combination of PV, PtGtP (ELY, metal hydride tank and FC), and battery storage via a possible residential design in Arizona, USA. They utilise an algorithm that is programmed so that, over time, the program learns to use system resources more efficiently by adjusting the energy storage strategy to fluctuations in power generation and demand. They concluded that, using the algorithm, the cost of storing energy for the HES is 48% of the cost of a hydrogen-only storage option and 9% of the cost if the storage option were battery only. In addition, this algorithm results in cost savings of 30% of the storage components compared to a simple state of charge algorithm. They also found that the cost of storage in a DC system is 70% to 85% of the cost of an AC system. The sensitivity study shows that the greatest effects of hybrid system cost reduction are the increase in efficiency of energy conditioning and the reduction in the costs of battery, PV, HS, and energy conditioning. The algorithm uses storage components more efficiently, resulting in lower storage costs.
Bocci et al. [11] also investigated in 2011 an HES for a 100 m 2 two-person residential house in Italy (Rome), in which a combination of PV, solar thermal, and PtGtP (ELY, metal hydride tank and FC) is used. In addition, the house was newly insulated, and all electric appliances were replaced with more energy-efficient equipment. Radiators were replaced with radiant heating systems, and the existing heat pump was replaced with an absorber, as the global efficiency for cooling needs in summer was higher than that of the PV and heat pump combined with solar thermal and an absorber. The study shows that it is possible to reduce the maximum electrical and thermal output as well as the total energy consumption to one third. The hydrogen supply should be a safe and reliable power supply system. While the installation costs are 10 times higher than those for batteries or generators, this system is well suited for long-term storage.
Another algorithm that minimizes the total system costs based on various assumptions is used by Gillessen et al. [12], who conducted a case study for a hybrid ELY/battery system in the range of 0.5–3 MW directly coupled to a large PV power plant without grid connection. They investigated the hydrogen production costs of alkaline ELY with different battery types (lithium-ion, vanadium redox flow, zinc–bromine redox flow). They concluded that batteries can adequately support ELY operation but are associated with higher hydrogen production costs and are not competitive compared to the installation of additional ELY capacity or electricity savings. However, if 100% renewable energy is desired, the installation of a hybrid battery system with a mixture of different battery types is desirable as it is more cost effective for storage than a solution with only one battery type. The factors that result in this benefit include the ratio of battery capacity to performance and the associated differences in performance and the capacity-specific investment of the different battery types.
Nguyen et al. [13] investigate the energy supply of a wastewater treatment plant. Electricity is generated by PV and wind turbines and may be stored temporarily in a battery storage and PtGtP system if necessary. They use economic, environmental, and reliability indicators for optimisation. They applied the fuzzy-TOPSIS optimisation methodology to six different configurations and found that this storage combination resulted in a satisfactory reliability value with good emissions and costs.
As an alternative to the battery as short-term storage, a supercapacitor can also be used. This is what Luta and Raji [14] investigate using an industrial consumer in South Africa without a grid connection. For this purpose, they use the HOMER PRO software, which allows such systems to be modelled and evaluated easily. The main supplier, with over 98%, is the PV plant buffered by the supercapacitor, while only 2% comes from the FC. However, the hydrogen system, especially the storage, accounts for a large part of the costs. Through a sensitivity analysis, they underline the conclusion that it is mainly the cost of the hydrogen system that is problematic.
Further alternative storage technologies for renewable energies are investigated by Yazdani et al. [15]. They are investigating compressed and liquid air as well as hydrogen storage. They use it to store 8 hours of production from a large wind farm and compare the energy used. Here, the hydrogen storage has the highest energy efficiency.
Similar topics on HES with PtGtP can be found in further literature [16,17,18,19,20]. In the past, authors focused heavily on technical feasibility and optimisation. They pursued the operating strategy of covering the demand in a self-sufficient manner. They largely agreed that hydrogen, in combination with other technologies, makes the overall system more energy-efficient and is very well suited as a long-term storage medium. However, it was often pointed out that such systems are currently associated with very high additional costs, which, according to the authors, should change in the near future through market penetration, political will, and technical development.
This paper therefore asks the question whether this point has already been reached under the current German market conditions, or how far away it still is. This question is presented and examined using the example of a dairy, but the approach could also be applied to other nations and industries. Furthermore, the effects on the emissions of this consumer are estimated. The hope is that climate-damaging emissions can be saved through more efficient local energy use. We focus on relatively small PtGtP systems, in which we see several advantages: on the one hand, we think that a small, and thus optimally utilised, system can have the greatest effect and thus convince potential users to install larger systems in the long run. On the other hand, we believe that such systems make sense as add-ons to existing HES in order to make them more flexible. Therefore, the space requirement must be as small as possible (here, no more than a small shipping container). Finally, well-established individual components are already available in this power class, which should reduce costs and improve availability.

3. Methodology

HESs are complex in both planning and operation. Detailed analyses and methodologies are required to achieve an overall system behaviour that is worthwhile for the stakeholders involved [21]. According to Schmeling et al. [22], the general planning process for distributed energy supply solutions is divided into four phases.
The planning process starts with the determination of the objectives to be pursued (Targeting). These can be of a technical, economic, or ecological nature and have to be quantifiable and comparable. In the second phase (Synthesis), all necessary and conceivable technologies are connected to the consumer in unspecified sizes, resulting in a so-called superstructure. In the third phase (Design), different sizes and combinations of technologies are tested in the superstructure in order to minimise or maximise the previously defined objectives. In this process, it is decided which technologies from the superstructure are useful or not. The final step (Operation) is to define the operational management of the system actually installed on site and to ensure that the system runs as optimally and reliably as possible.
We focus on the first three phases, as these can give us a realistic assessment of the current market situation. The operational phase can only be evaluated and demonstrated on a real system, which of course requires a successful outcome of the first three phases. The first three phases are explained below.

3.1. Targeting

Optimality is always in the eye of the beholder but must be precisely defined for a successful, objective evaluation of technical systems [22]. The associated decision-making problem often cannot be broken down to a single factor, but there are different perspectives [23]. For HESs in particular, there is usually a conflict of objectives between costs, environmental impact, and technical feasibility, which have to be considered together but are usually impossible to directly compare. This problem can be addressed by carrying out a multi-objective optimisation (MO) [13,24,25].
In general mathematical terms, the subsequent MO problem can be described as follows [26]:
min F x = f 1 x , f 2 x , . . . f N x : x X
where x describes a possible solution vector of the solution space X R M with M different degrees of freedom, which is mapped to N different objectives using function F : R M R N  [26]. Whether minimisation or maximisation is carried out is irrelevant, as min F x = max F x .
In the end, MO seeks solutions that are in one way or another better than alternative solutions; i.e., it is not possible to improve one objective function without simultaneously worsening another [27]. Such a solution is called Pareto optimal. Mathematically, this means that for a conceivable solution x ^ X , there is no other solution x X for which f ( x ) f ( x ^ ) in the case of a minimisation. The totality of all Pareto optimal solutions form the Pareto front, which in its completeness is the optimal solution of the MO. Within the context of the research question, the Pareto front contains all optimally sized energy systems and is thus the basis for the subsequent decision-making process.
As described, the integration of a PtGtP system is expected to have both economic and ecological advantages. Therefore, the following objectives, which are common in the evaluation of HESs, are used for the further investigation: the annuity according to VDI 2067 [28] and the CO2 emission. These are motivated and specified in more detail below.

3.1.1. Economic Evaluation

The goal of companies usually is to generate as much profit as possible at low cost [29]. From a business management point of view, it is important to cover both the company’s energy requirements and to achieve this at the lowest possible cost [30].
In order to keep the calculation of the techno-economic evaluation of the supply concepts as simple and comparable as possible, the calculation in this paper is based on the annuity method of the German engineering standard VDI 2067 [28]; the following formulae are derived straight from this standard. The annuity is a repeated annual payment of equal amount, which is required to pay off a system over an observation period. The period under consideration in this case is set at 20 years, as this corresponds to the expected useful life of the PtGtP system. The expenses are divided into capital-related costs ( A N , K ), demand-related costs ( A N , V ), operation-related costs ( A N , B ), and other costs ( A N , S ). In addition, the revenues from the sale of energy or from the use of government support measures are added to the calculation and are included in the revenues ( A N , E ). The annual annuity ( A N ) is calculated from the difference between the revenues and the sum of all cost categories:
A N = A N , E ( A N , K + A N , V + A N , B + A N , S )
The annuities of the individual cost categories X result from the costs of the first year A X 1 multiplied by an annuity factor a and a price dynamic cash value factor b X , which in turn depends on an interest factor q and a price change factor r:
A N , X = A X 1 · a · b X = A X 1 · q T · ( q 1 ) q T 1 · 1 r X q T q r X
According to this method, the energy supply solution with the highest annuity should be realised. In the industry, energy is usually considered a necessary part of the production process, which is why it is not explicitly remunerated, unlike in the housing sector. This usually results in negative annuities, the highest of which is then preferred.

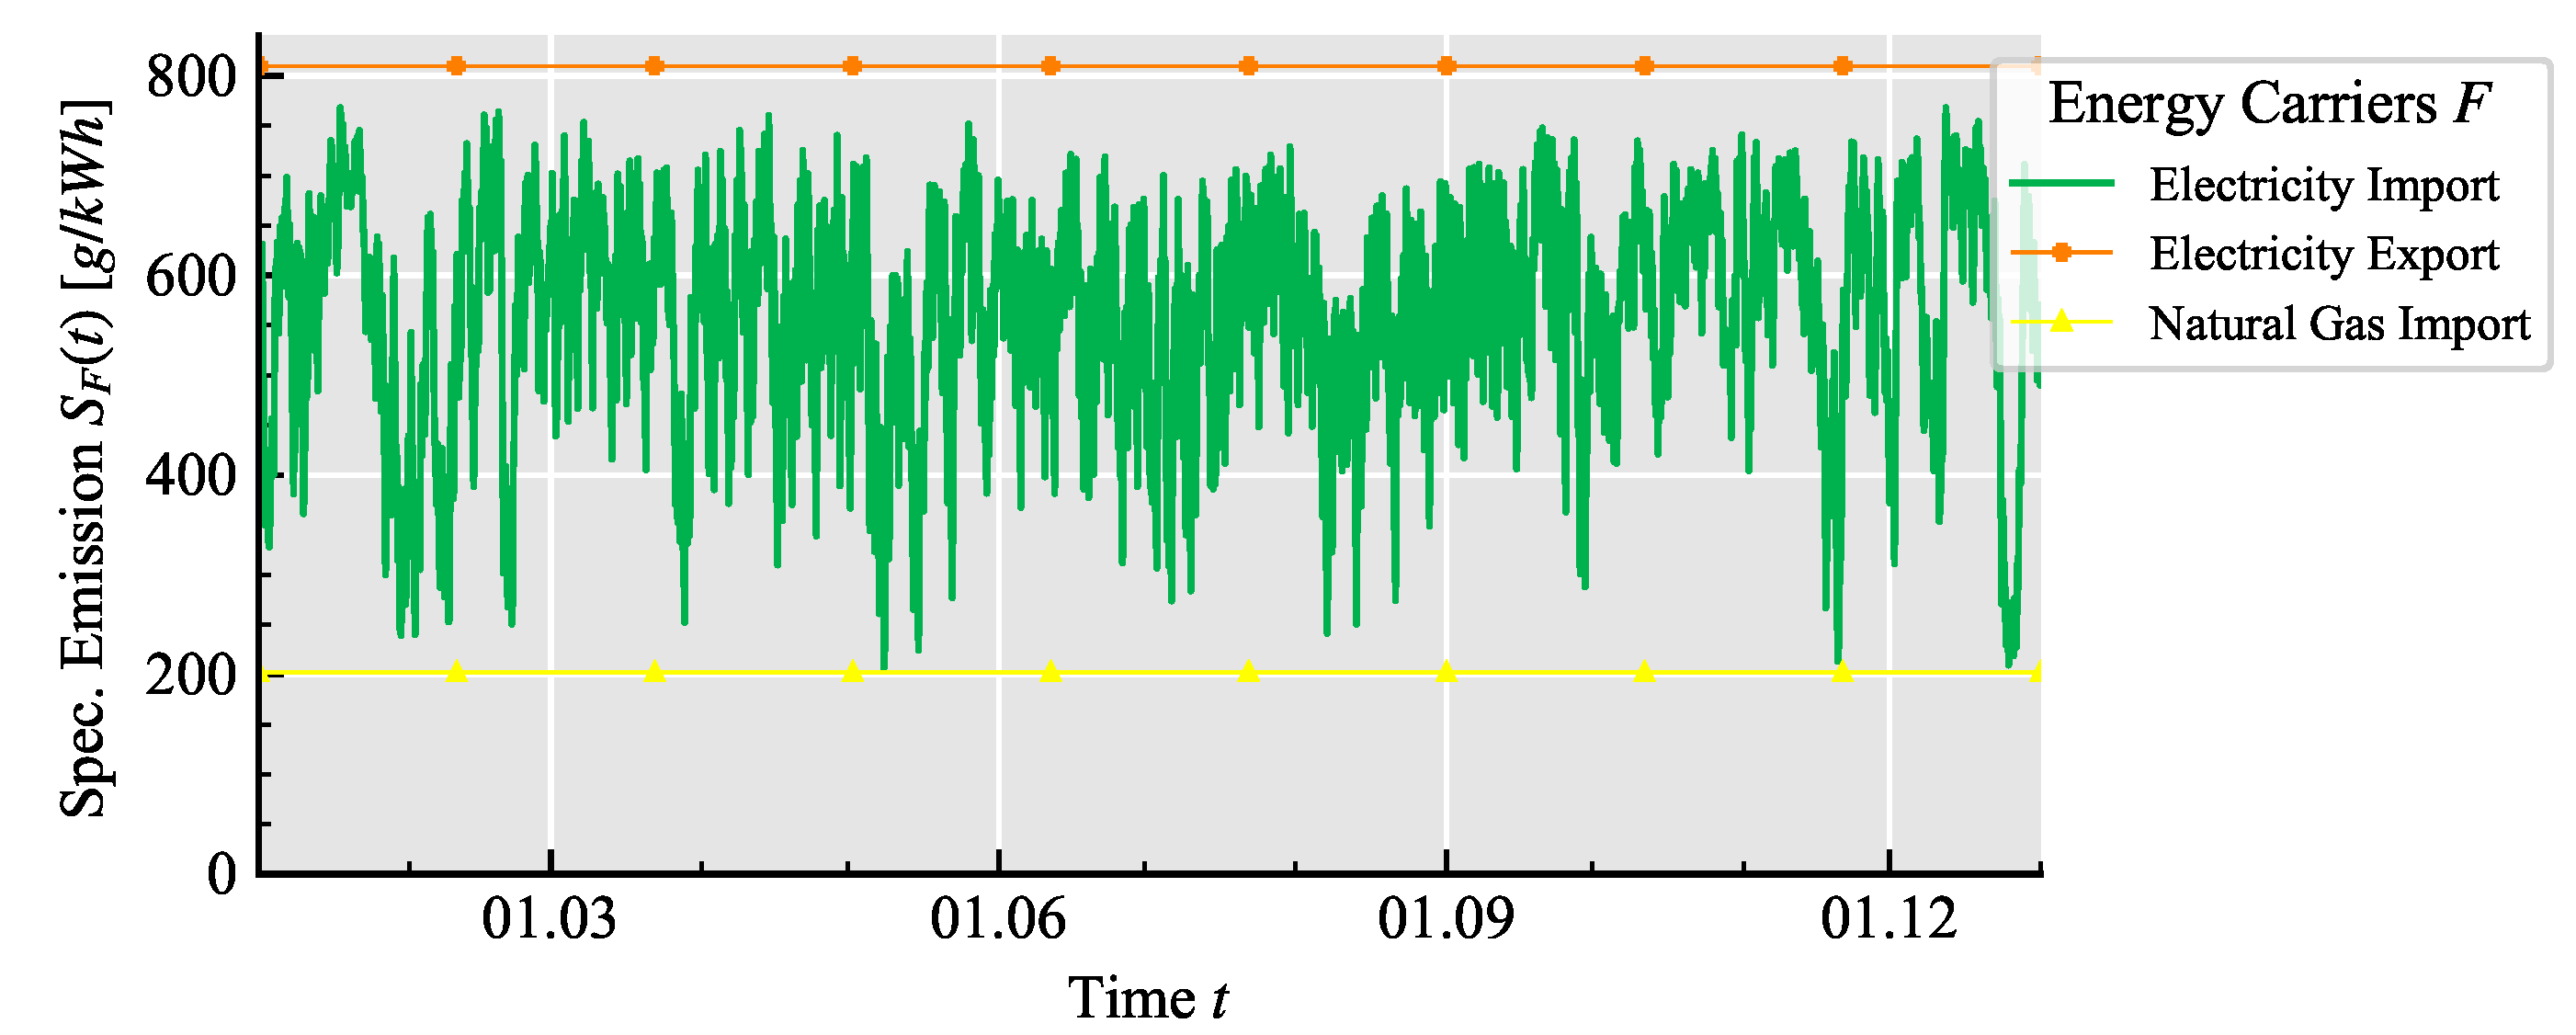
3.1.2. Ecological Evaluation

In recent years, environmental awareness has become increasingly important for people in Germany [31]. At the same time, the economic valuation of greenhouse gas emission is receiving more attention. CO2 is mainly produced in the energy production process, which is passed along the supply chain to the final consumer. In order to achieve the climate targets, CO2 balancing is necessary as it gives consumers or planners of HESs the opportunity to design climate-friendly behaviours [32].
The CO2 emission of the energy supply solution is calculated using a balancing boundary approach as described by Wehkamp et al. [33]. Boundaries are drawn around the supply object and specific emission intensities (CO2 emission per kWh ) are assigned to energy carriers flowing either into or out of the system, which are in this case natural gas (NG) (only in) and electricity (in and out). Solar radiation as the energy carrier of PV is assumed to be emission-free, just like environmental heat. Since it is assumed in the following that hydrogen is neither exported nor imported, it is not to be considered as an energy carrier in this regard. Thus, only the operating phase of the system is considered here; emissions from the construction or demolition of the system are not taken into account. An emission intensity of 202 g CO2/ kWh is applied for NG [34]. For electricity purchase E Elec ( t ) , which has a time-varying composition of different energy sources with different emission intensities, a flow tracing method is used to calculate hourly emissions  S Elec ( t ) [35,36]. In turn, CO2 is credited by feeding electricity E Feed ( t ) into the public grid [37]. It is not the average German electricity mix that is displaced, but rather the marginal power plant [38]. The value of the emission is defined as the marginal emission, which when averaged over one year gives the displacement mix. This indicates the amount of CO2 per unit of energy that does not have to be emitted at another place due to the substitution of the marginal power plant by the grid feed-in by the HES. According to a forecast from 2014, the displacement mix in Germany is expected to be 810 g CO2/ kWh in 2020 [39]. A more accurate and up-to-date value cannot be found here due to the complexity of the European energy market. For this reason, no temporal progression can be assumed here; however, the variability should also be significantly lower here, as the marginal power plants are usually base-load power plants.
Thus, the following formula is used to calculate the annual CO2 emission C Total of the energy supply solution:
C Total = t = 0 T 202 g C O 2 k W h · E NG ( t ) + S Elec ( t ) · E Elec ( t ) 810 g C O 2 k W h · E Feed ( t )
The relevant emission intensities throughout the year are shown in Figure 1.

3.2. Synthesis

In the next phase, the superstructures, i.e., the choice of technology and the connections between the technologies, are defined. The superstructure of the energy supply solution to be planned is then divided into different scenarios in order to be able to compare the effects of the innovative PtGtP plants with a state-of-the-art system.

3.2.1. Scenario 1

Figure 2 shows an energy supply concept that has been implemented in many industrial projects in Germany in recent years [40,41]. It therefore serves as a reference for the innovative additional use of PtGtP. The scenario includes a PV system, a battery storage, as well as a condensing boiler and a combined heat and power (CHP) with a mid-term thermal energy storage (TES). Via access to the public electricity and NG grids, the necessary energy resources are available to the consumer. Depending on the market situation, electricity from PV and CHP can be used internally or fed into the grid. In addition, electricity from PV can be temporarily stored in the battery storage. The boiler is primarily used to cover the thermal load peaks that cannot be covered by the CHP. In addition, it serves as a backup should the CHP fail completely. The TES is used exclusively by the CHP. This leads to a decoupling of the electricity and heat generation, so that the CHP can run cost-optimised until the TES is completely filled.
The system is thus a perfect example of an HES. It combines the use of different technologies and energy sources, making it possible to choose the most suitable option at any given time in order to meet the required energy demand in the best possible way.

3.2.2. Scenario 2

In Figure 3, the hydrogen path, i.e., an ELY, compressed gas storage as HS and a FC, is added to the energy supply concept of scenario 1. In the model, it is allowed that the ELY can receive electricity from the different power sources. The ELY does not draw electricity from the battery, as German energy law makes it difficult in this configuration (cf. § 61l German renewable energy sources act (EEG)). The hydrogen generated by the ELY has a pressure of 20 bar . It is fed into the HS tank without further compression and, if necessary, is used to generate electricity via the FC. The waste heat from the ELY and the FC is transferred to the heating system via heat exchangers to increase the overall efficiency and to use the TES to decouple electricity and heat generation. If the heat cannot be consumed, it is released into the air via a recooling system, which is exclusively used by the PtGtP system.

3.3. Design

There are various ways to determine how the optimum system configuration has to be designed for a given superstructure. In engineering, various methods and rules of thumb are known regarding how to successfully design certain systems according to experience. In such complex systems as the one described here, however, there are often no empirical values, and the conventional tools (mostly Microsoft Excel) are not sufficient to conduct reliable analysis. Therefore, it is necessary to find new methods that provide reliable results even in such systems. The process developed for this purpose is based on the modelling of the supply concept in a simulation software, which is then used to evaluate various technology combinations, known as optimal sizing [42]. In this way, the best possible combination and size of the technologies considered can be found that meet the previously defined objectives. The schematic process can be seen in Figure 4 and is explained below.

3.3.1. Optimal Sizing

In the scientific literature, various optimisation algorithms are used to dimension energy generation and storage technology. A detailed tabular overview of optimal sizing methodologies of on and off-grid HES can be found at Schmeling et al. [43]. A clear distinction can be made between single objective optimisation algorithms, which can usually be relatively simple, and multiobjective optimisation algorithms, which are more complex in their operation and resource requirements. A distinction can likewise be made between linear optimisers, which are used to solve highly simplified mathematical models, and non-linear optimisers, which can optimise models that are much closer to reality [44]. Because an MO is supposed to be carried out as close to reality as possible, the choice of a suitable approach is rather complex.
In addition, for most of the methods available for solving such problems, all components (degrees of freedom) must be modelled continuously in variable sizes so that it is possible for the optimiser to explore the search space continuously. This in turn proves to be difficult in practice, since no continuous plant sizes with standardised properties can be realised, but each manufacturer offers components in fixed sizes and different properties.
Since we want to be as close as possible to the components that are actually available, a brute force approach is chosen, which does not use intelligent optimisation algorithms to select the sizes but examines all conceivable sizes and combinations, regardless of their feasibility. In this way, the various components can be modelled as closely as possible to the manufacturer’s technical specifications, but the computational effort of the simulation is significantly higher. Such an approach is possible here because the choice of technologies and also their size represent a relatively small solution space, which can be solved using modern computer technology and simulation tools.

3.3.2. Energy System Simulation

There are several studies concerning simulation software whose main task is to determine the optimal dispatch strategy for the combination of different energy-generating, storing, and consuming devices. Connolly et al. [45] compared 37 programmes in 2010 to investigate the integration of renewable energies into different energy systems. The aim was not to find the perfect software but to get an overview of the software and its individual advantages. Sinha and Chandel [46] examined 19 programmes using a hybrid, distributed energy supply concept. They came to the conclusion that, depending on the software, there are considerable differences in the simulation results. Schmeling et al. [47] developed a comparison methodology of different commercial simulation tools and find in the exemplary application to nine different tools that there are varying recommendations depending on the application case.
The software oemof.solph [48] is used for this publication. This open source tool offers the freedom to define new, innovative components, such as the PtGtP system, and to connect them with existing components such as CHP and battery storage. It also offers various options for defining high-resolution input data and analysing the results in detail. It is being continuously developed by a broad community and has already found application in a wide range of research questions (e.g. [49,50]).
In oemof.solph, energy systems are represented as a directed graph, where the vertices represent either components (sources, sinks, technologies) or buses, which manage the resource flows between the components. The edges are directed and represent resource flows between certain components and buses. This graph is then translated to a mixed integer linear programming (MILP) problem using pyomo [51] that can be solved numerically by various solvers [52]. The objective is to minimise the costs caused by energy flows in the system while covering all energy demands. We therefore cannot, as in many other studies, present the operating strategy graphically, as this is calculated and optimised dynamically at each point in time. In this way, it is possible to exchange system components or framework conditions very easily.
Technologies such as transformers have inflows and outflows, e.g., the consumption of gas from a gas bus to a gas turbine, which then feed electrical energy into an electricity bus. Parameters such as efficiency can be used to determine the ratio of inflow and outflow. Sinks only have inflows and can represent consumers, e.g., electricity consumption in households. Sources include wind energy or PV systems, but also raw materials, and only have outflows. A graphical representation of the oemof.solph model used for scenario 2 can be found in Figure 5.

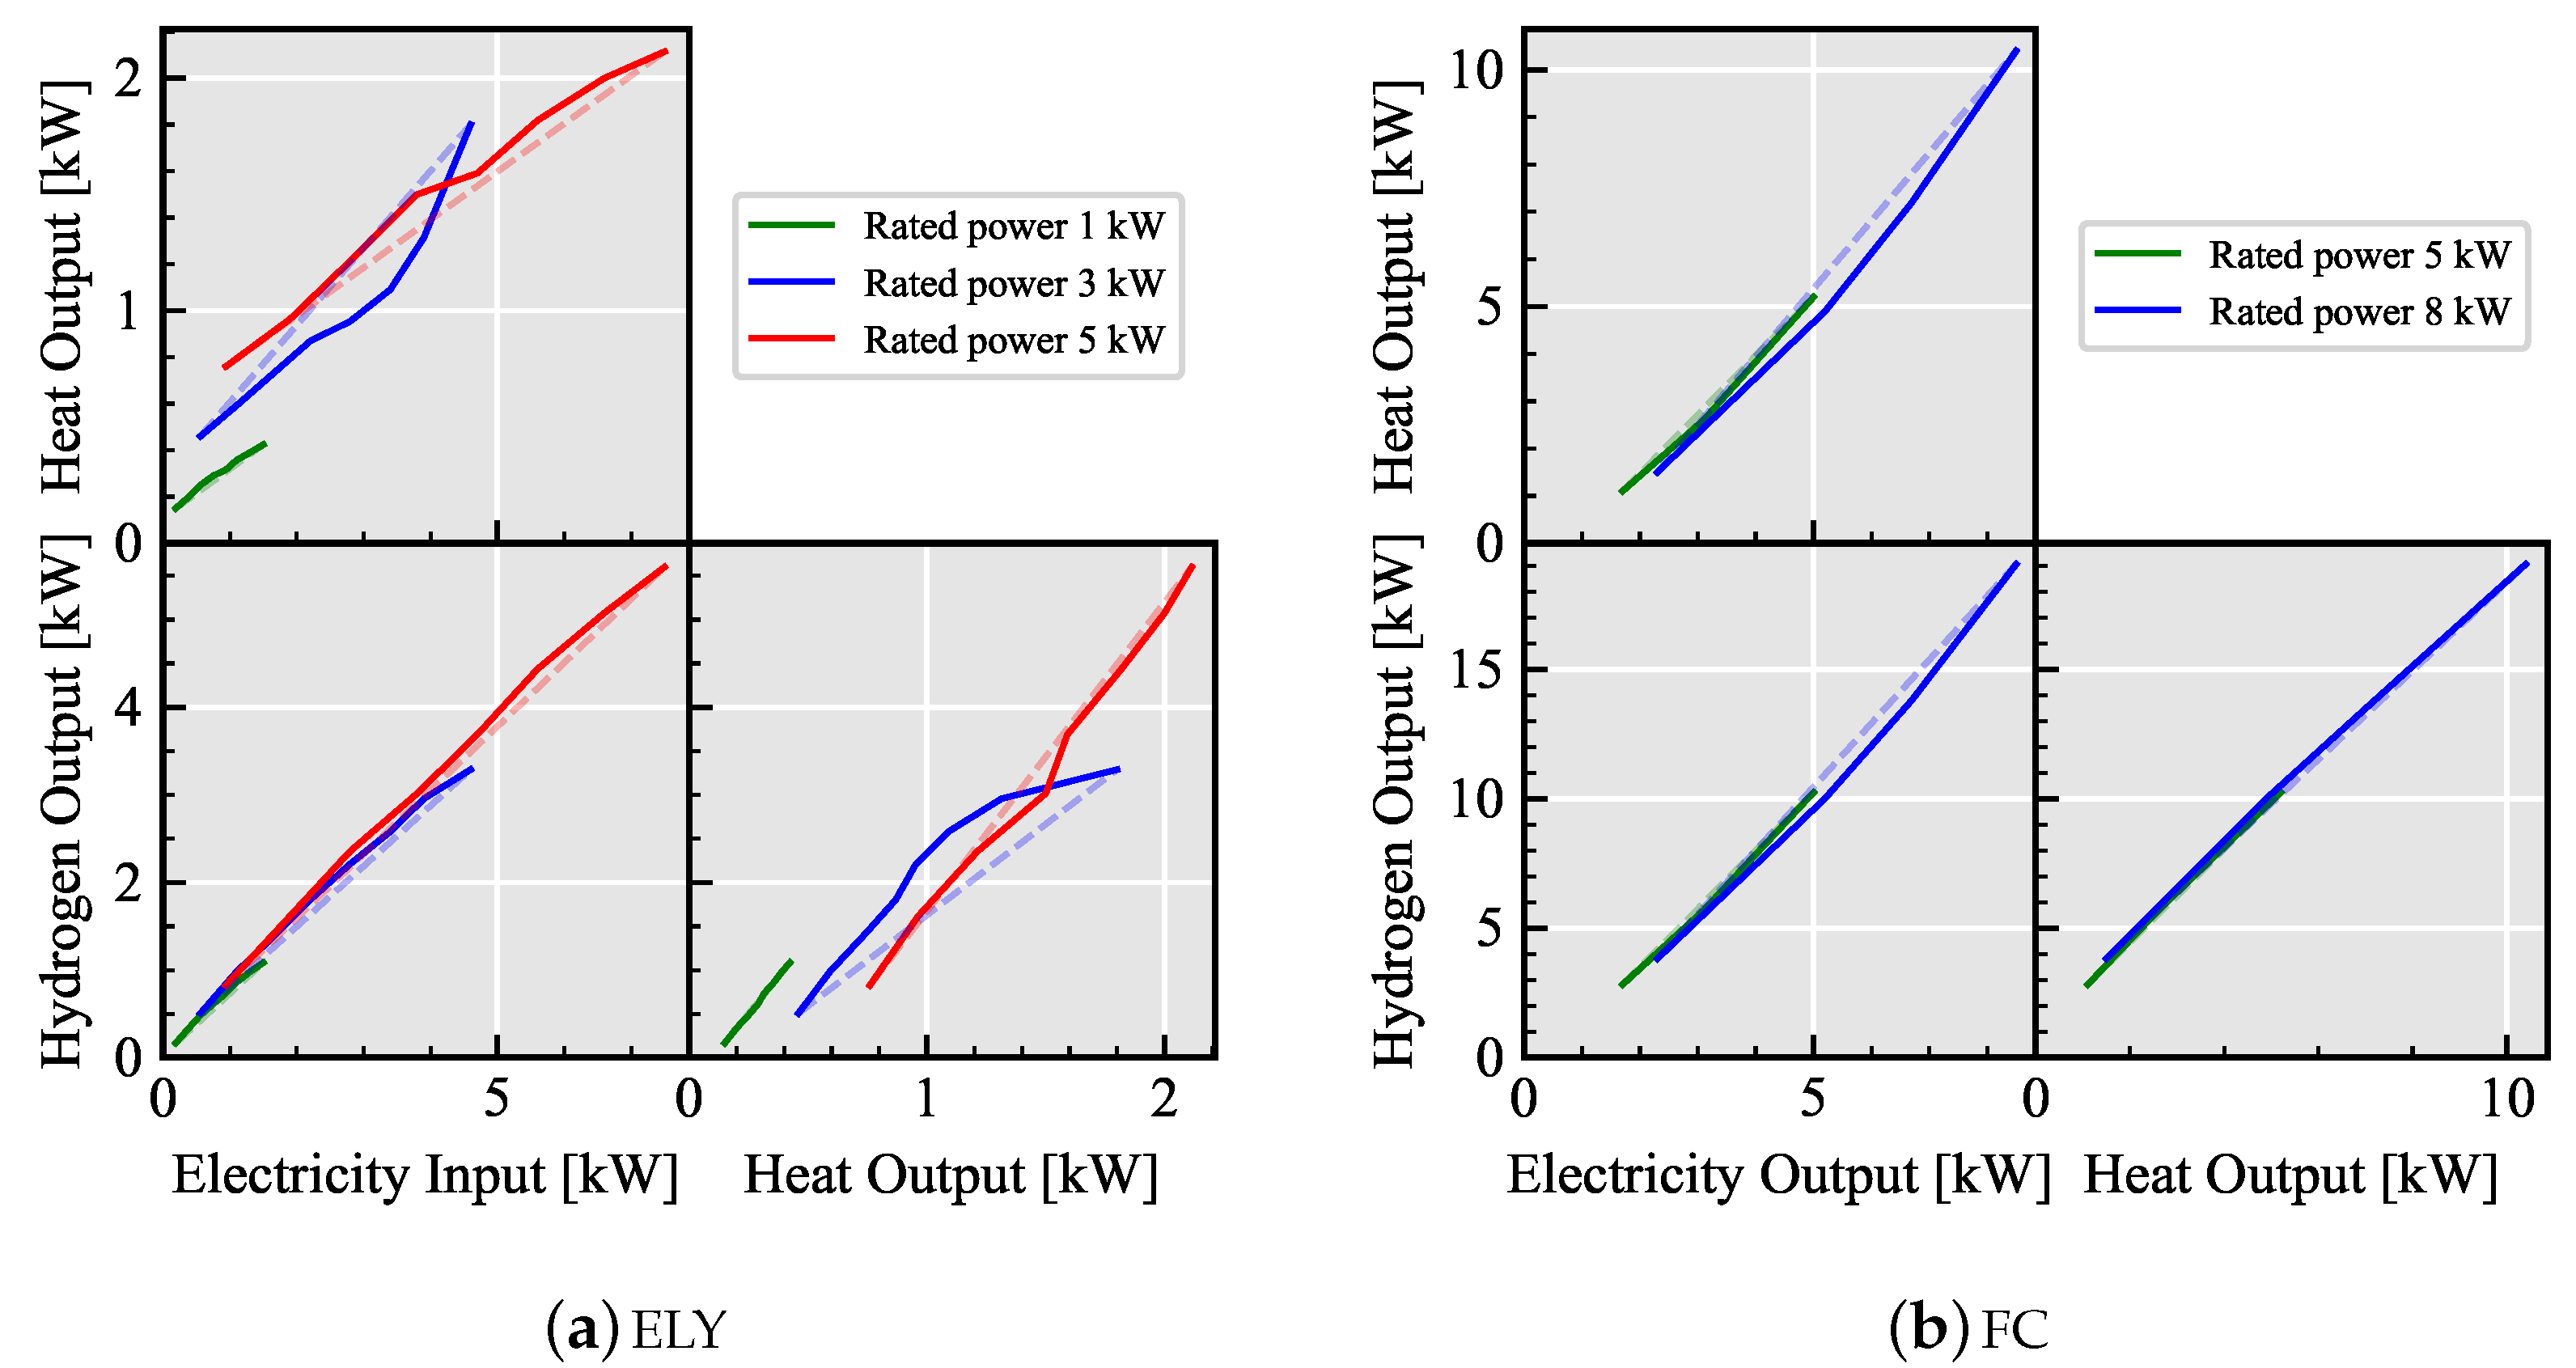
3.3.3. Modelling the Hydrogen Technologies

As mentioned in Section 3.3.2, the technologies in oemof.solph are modelled as vertices of the energy system graph. This chapter explicitly explains the procedure for modelling the hydrogen technologies, i.e., ELY, HS, and FC. All other components used are established technologies, and their modelling was carried out with usual processes in oemof.solph and is therefore not further presented here.
There are different types for both ELY and FC, which offer different advantages and disadvantages depending on the application. For the intended stationary use in industry, proton exchange membrane (PEM) technology is used for both components of the plant. On one hand, the PEM ELY has the advantages of having no danger of oxygen contamination when operating it under low partial loads and better management of fluctuating power generation than alkaline ELY. On the other hand, PEM has a significantly higher energy density (i.e., less floor space required and less material used) as well as greater modularity (e.g., with regard to the caustic preparation of the alkaline electrolysis plants). The PEM FC is uncomplicated in terms of its handling and is particularly suitable for a distributed energy supply, since the power output can be controlled with great dynamics [53].
The intended application is in very small performance classes so that the PtGtP system can be optimally integrated in small and medium-sized companies. For ELY, plants up to 5 kW el are used; for FCs, up to 8 kW el . These were obtained from appropriate manufacturers, and the data sheets were analysed accordingly. The data sheets are, of course, based on experiments as well as on the manufacturer’s experience and are therefore particularly valuable for the intended examination under realistic conditions. The most relevant parameters are the electrical input and output, the thermal output, as well as the hydrogen production (ELY) and the hydrogen consumption (FC), respectively, both at full load, minimum partial load, and intermediate points. The resulting characteristic curves of hydrogen technologies can be found in Figure 6. As a good approximation, a linear behaviour between full load and minimum partial load is assumed. When modelling the two technologies, the oemof.solph CHP model (GenericCHP) with limited partial load behaviour (back_pressure=True) is chosen. Details on the modelling can be found in [54,55].
Gas tanks are used as HS which have a storage capacity per tank of 12.6   m 3 each. The HS is modelled in oemof.solph as a generic storage (GenericStorage). The hydrogen is generated by the ELY, which is fed into the hydrogen storage tank without further pressure increase, and thus without any inflow losses. The FC is operated at the same pressure, which is why there are no outflow losses either. The storage capacity can be calculated by simple physics [56] and results in 670 kWh per tank at the set 20 bar . Compressing the gas would increase the energy content, but it would also significantly increase the electricity demand, which is why we do not consider it here. Instead, several tanks can be placed next to each other and the energy content scaled in this way. According to the manufacturer, the diffusion of the hydrogen through the wall is negligible, meaning that the storage losses can be assumed to be zero.

4. Case Study

In order to be able to make a statement about the usefulness of the use of PtGtP under the current German market conditions, the method described above is used to examine an industrial consumer. The assumptions of the targeting and synthesis phase are adopted, and the optimisation of the design phase is illustrated.
In order to design and optimise this energy system, it is necessary to have detailed information on the energy demand of the energy supply object as well as the prices and remunerations that are applicable under the local energy law for the different energy flows.

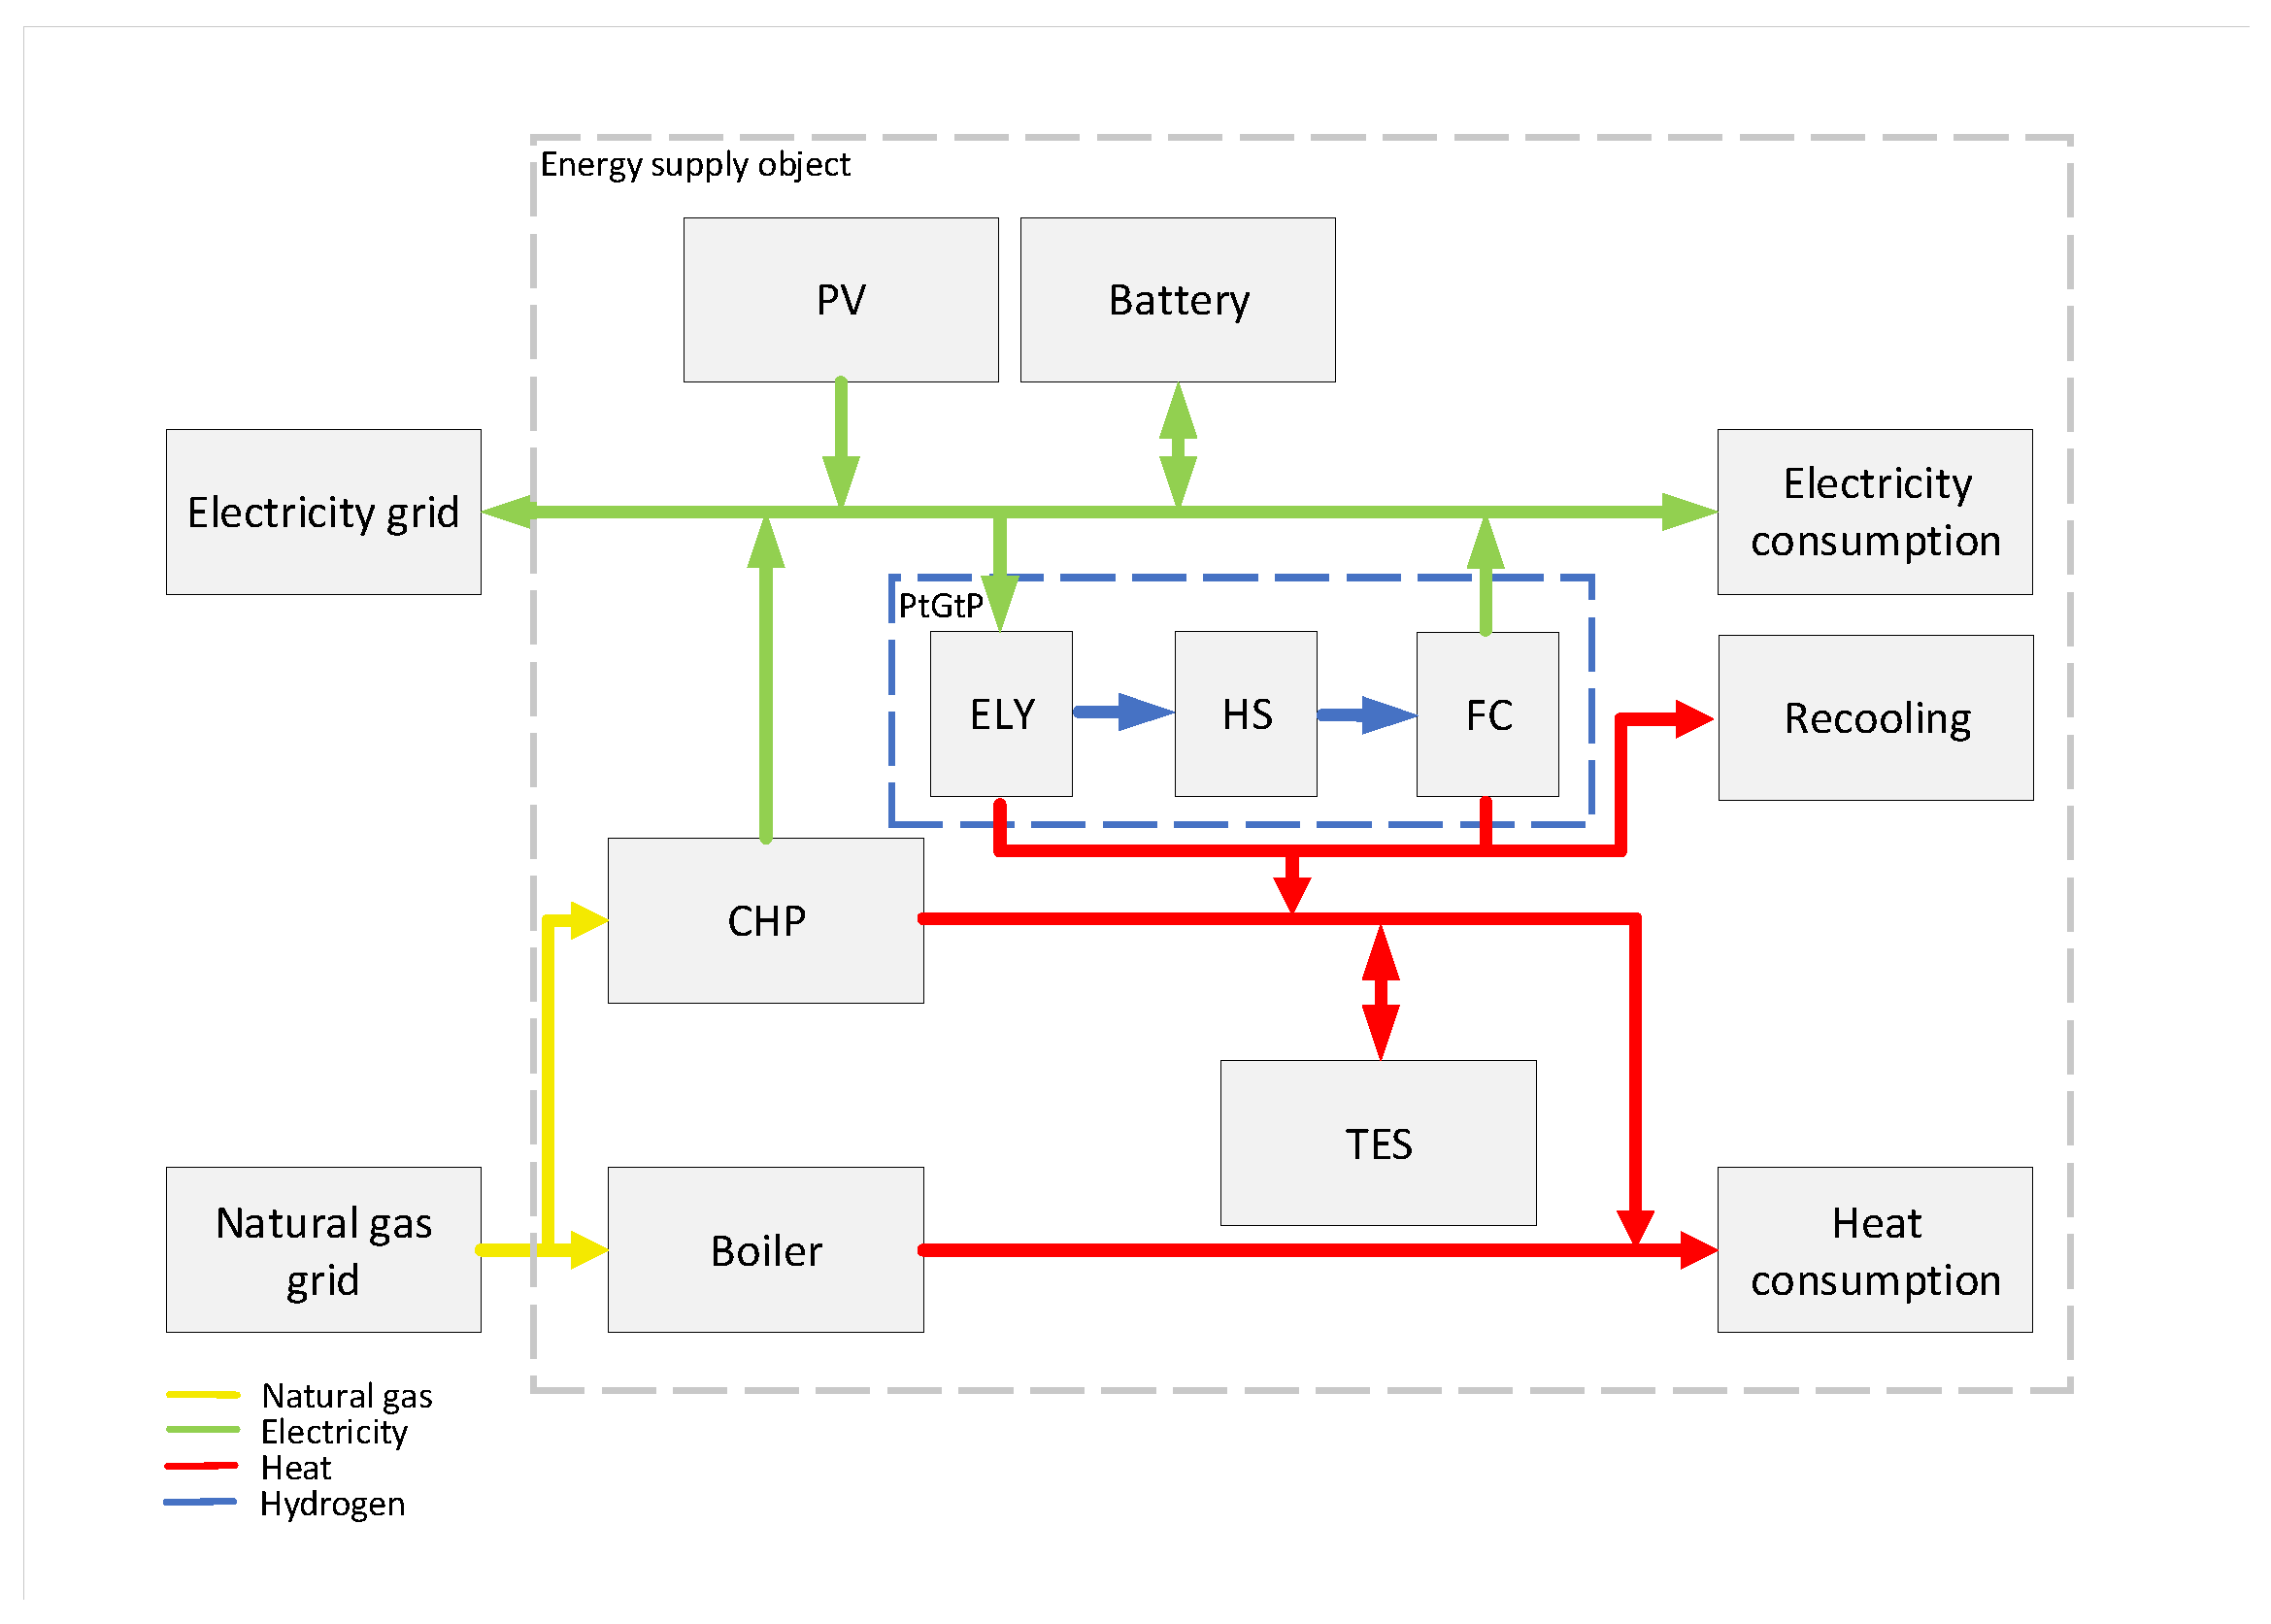
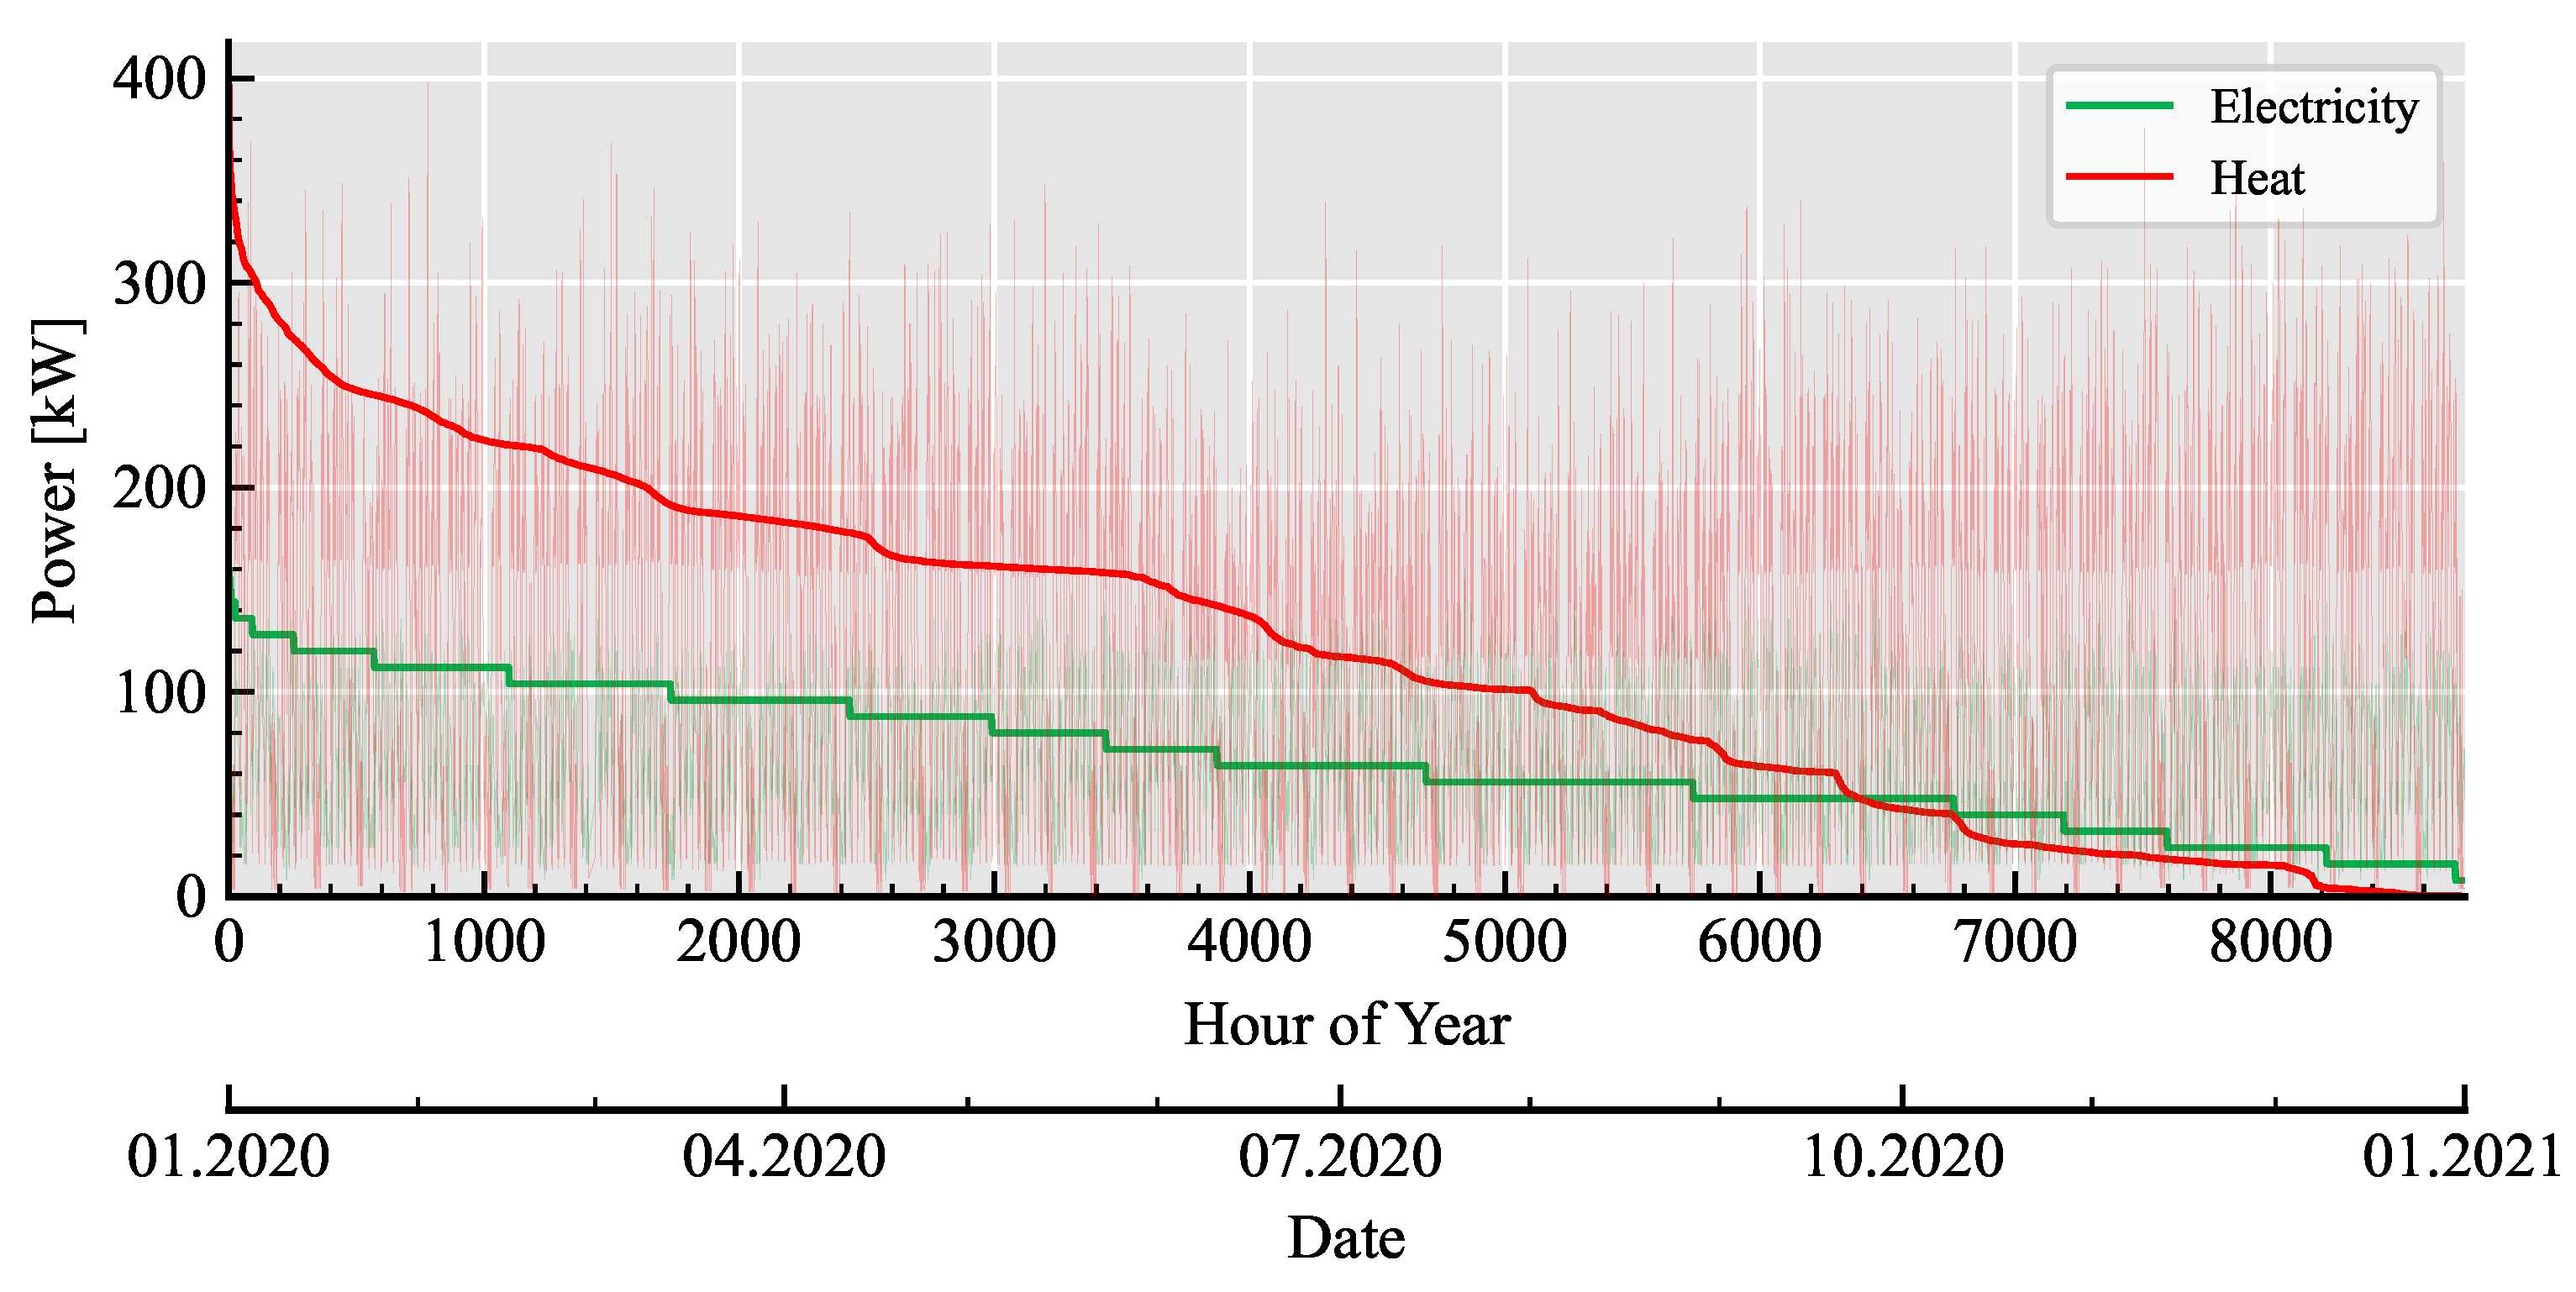
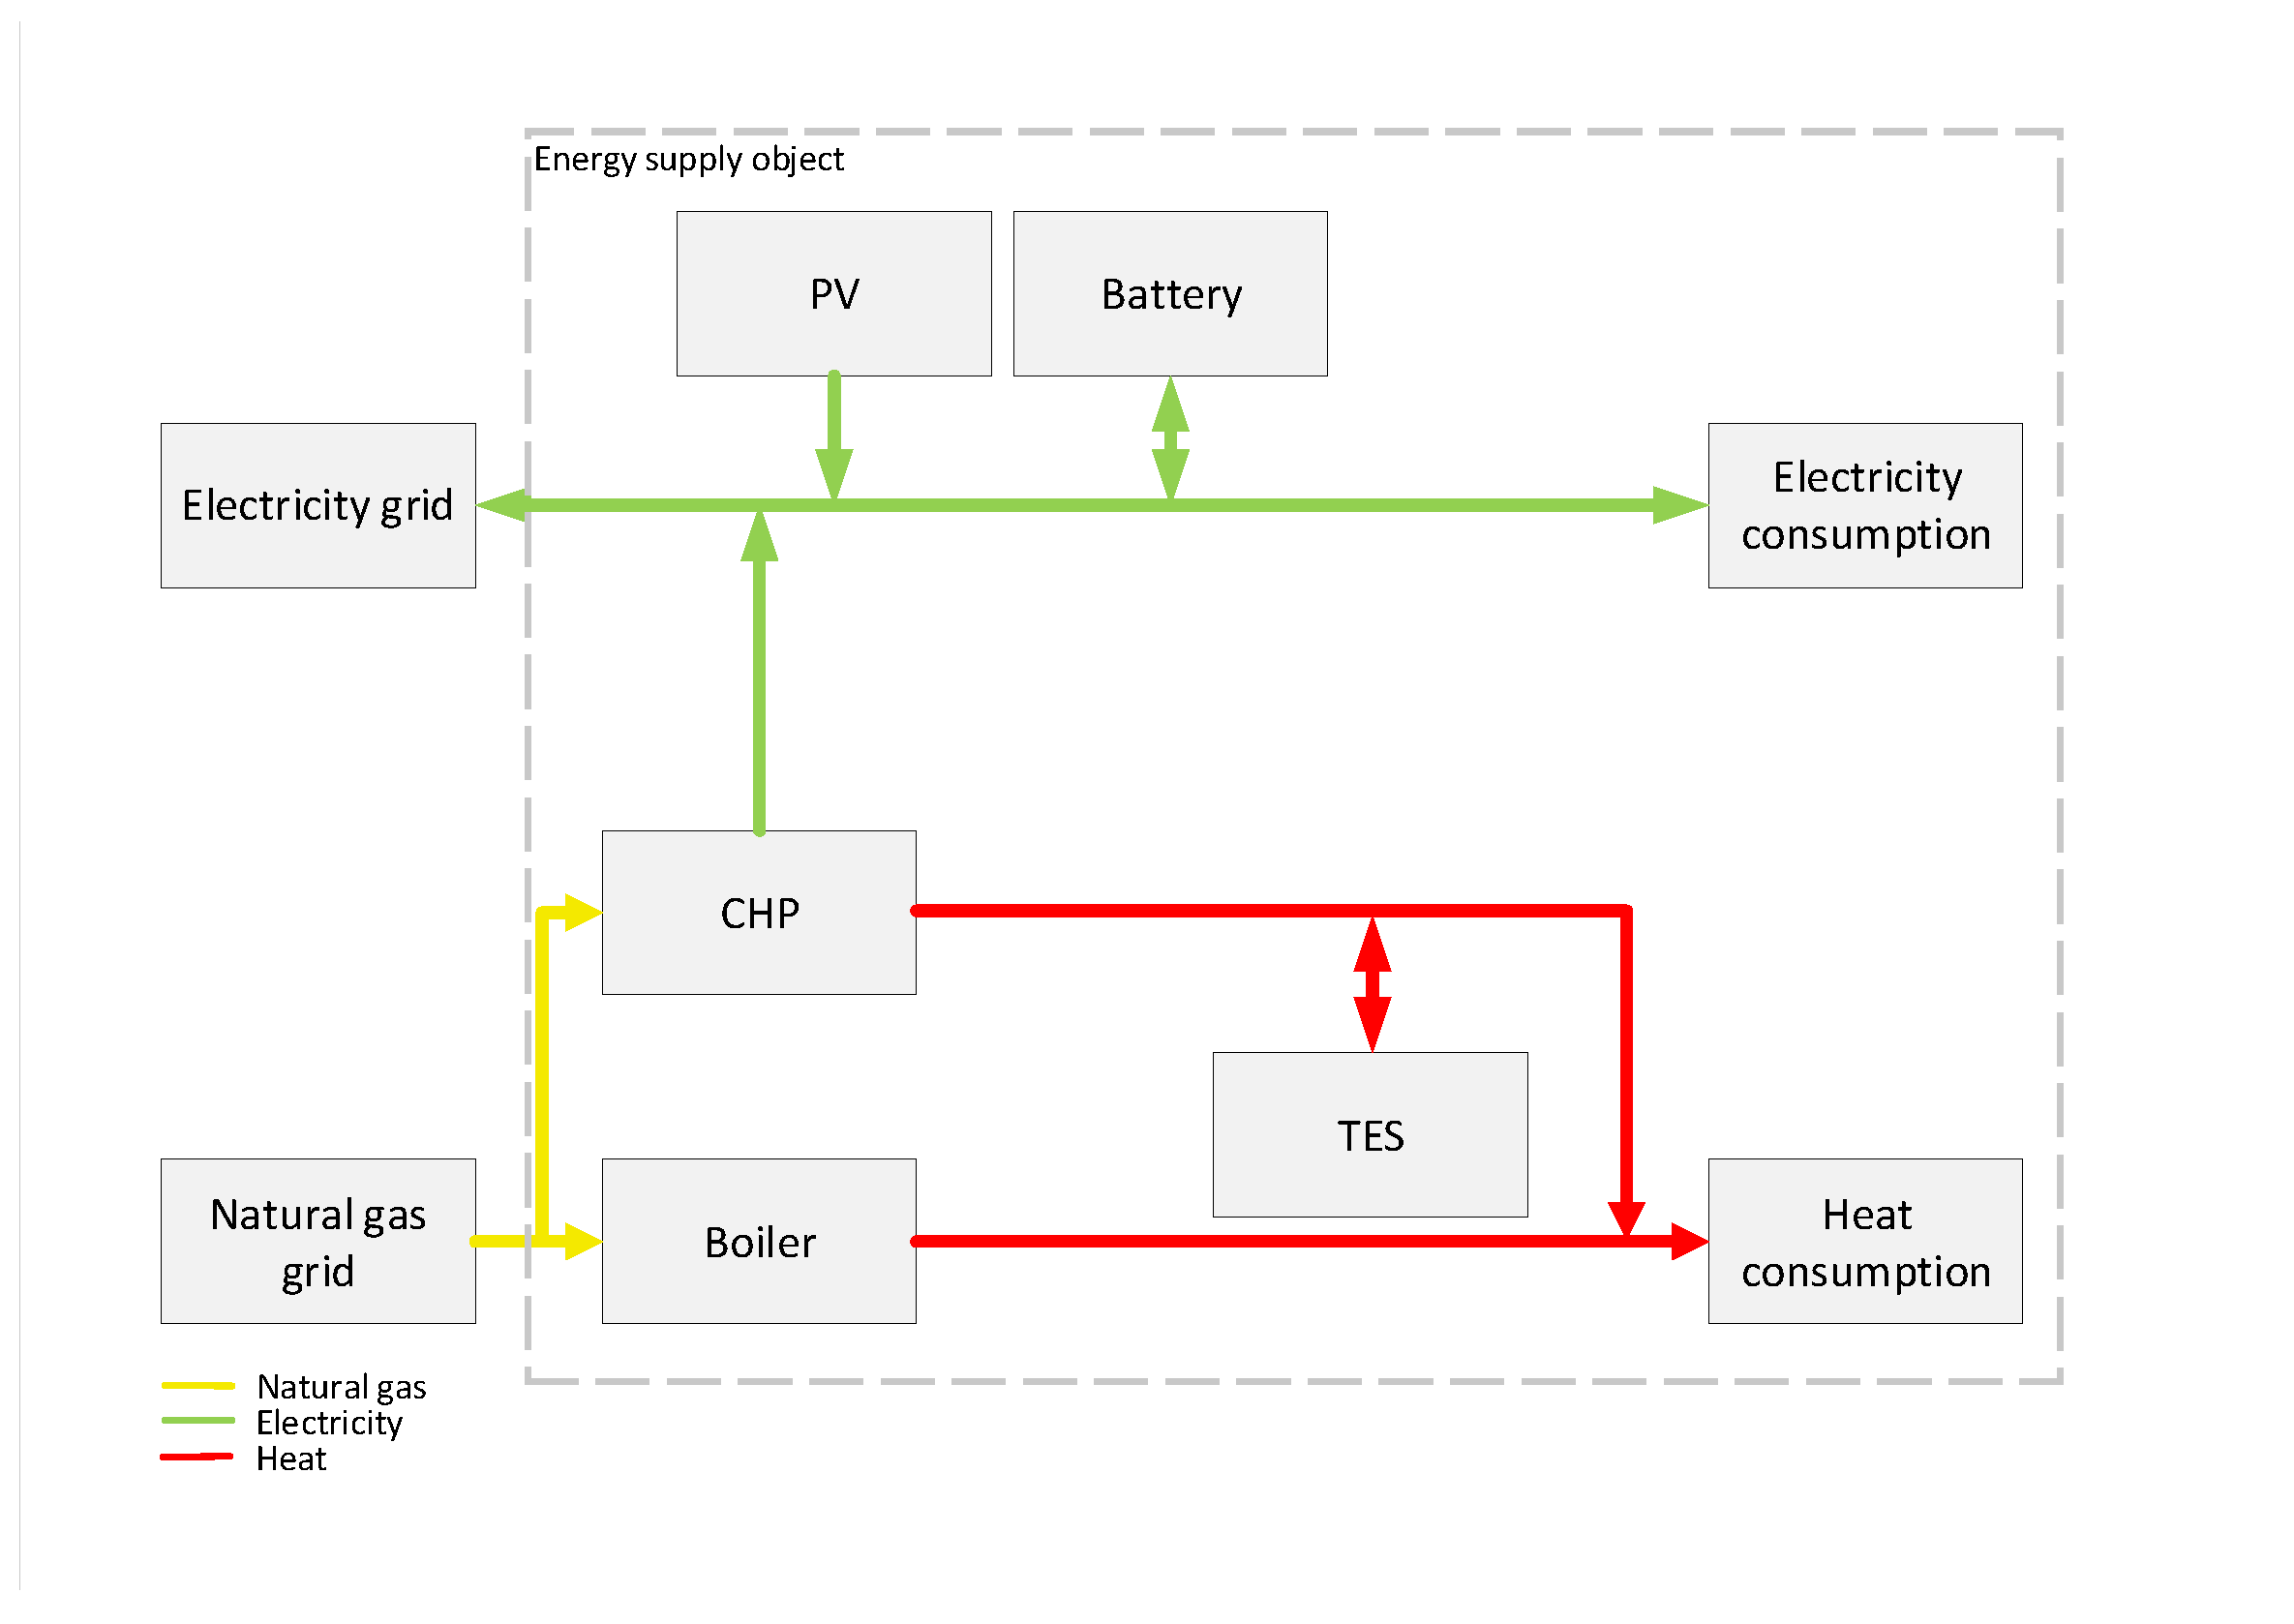
4.1. Energy Supply Object

A dairy is used as a case study, for which a location in Oldenburg, north-west Germany, is assumed. It is a medium-sized company that is organised as a cooperative and employs about 40 people. Milk is processed into various products such as butter, cream, and yogurt, for which electricity and heat are required in various places. In addition, several offices are supplied.
Electricity demand profiles are available as quarter-hourly data ( 599 MWh ) and heat demand profiles as hourly data ( 1050 MWh ) for 2016, which are projected to 2020. The graphic evaluation of the energy demand is shown in Figure 7. On the load profile (in the background), it is clearly visible that both electricity and heat are demanded relatively constantly over the year. The load duration curve (in the foreground) represents the power demand in dependence on the utilisation time and is often used for the capacity planning of generation plants. Here, it can be seen that the electricity and heat demand must be provided in a wide range of capacities, whereby the heat demand usually exceeds the electricity demand. Such a configuration is very well suited for hybrid, CHP-based supply concepts.
For the installation of PV, the roof area of a gabled roof with a maximum of 200 m 2 at 30° inclination facing south is available. This corresponds to a maximum installed capacity of approximately 40 kW p . The other system technologies are installed collectively in a machine room, so no further transmission losses have to be considered. Other electricity generating technologies such as wind power are not an option at this location due to neighbouring buildings. All data for modelling are taken from real plant data sheets. However, the exact manufacturers cannot be named for non-disclosure reasons.
On the basis of this information, the maximum sizes of the variable technologies are defined, which can be seen in Table 1. For all plants except the PtGtP plant, zero is assumed as the minimum size in both scenarios. For the PtGtP plant in scenario 2, the minimum plant sizes are defined as the smallest possible value, so their presence is forced in order to see the effects of hydrogen integration. As mentioned, the boiler is also used as a backup for the CHP and must therefore be able to serve the maximum thermal load. Its size is therefore not optimised but instead determined based on this load plus a safety margin. On the electricity side, the grid connection is designed for the maximum electrical load with the same argument. This means that, in an emergency, the system can always be supplied with energy in this very stable and safe way and there are no interruptions in production.
This then results in 6 CHP × 5 PV × 4 TES × 5 battery × 3 ELY × 2 HS × 2 FC = 7200 different energy systems using all possible technology combinations in scenario 2, which then have to be simulated and evaluated accordingly. However, there were also some energy systems that could not be calculated because they are not technically possible. For example, a large CHPs must be equipped with a TES. These energy systems are therefore discarded in simulation. The same applies to storage technologies whose producer is missing. Thus, if no CHP and PV is planned, there is also no TES or battery storage needed.

4.2. Energy Prices, Taxes, and Allowances

In order to be able to determine the costs of the energy supply solutions in the simulations, the energy flows between the vertices have been assigned with prices, taxes, and remuneration. These are based on the German legislation and market situation as of 2020. Electricity and NG prices in Germany vary from region to region due to different grid usage fees and concession fees; here, those of Oldenburg are chosen, which are relatively inexpensive compared to the rest of Germany. The procurement of residual electricity is considered to be purchased entirely on the German spot market, the EPEX SPOT, and there are no long-term supply contracts. These variable procurement costs make the HES particularly advantageous, as it can react dynamically to external incentives. NG, on the other hand, is purchased at an annual fixed price, as spot market procurement is very unusual and not easy to implement due to the metering infrastructure. Table 2 shows the prices or remuneration of the technologies’ links to each other in the supply object.

5. Results

In the following, the methodology developed is applied to the case study shown. The dispatch optimisation of the individual plants with oemof.solph is first demonstrated, followed by the optimal sizing of the relevant components. In order to verify the assumptions of the model and to be able to make good recommendations for action, a sensitivity analysis is carried out as a final step.

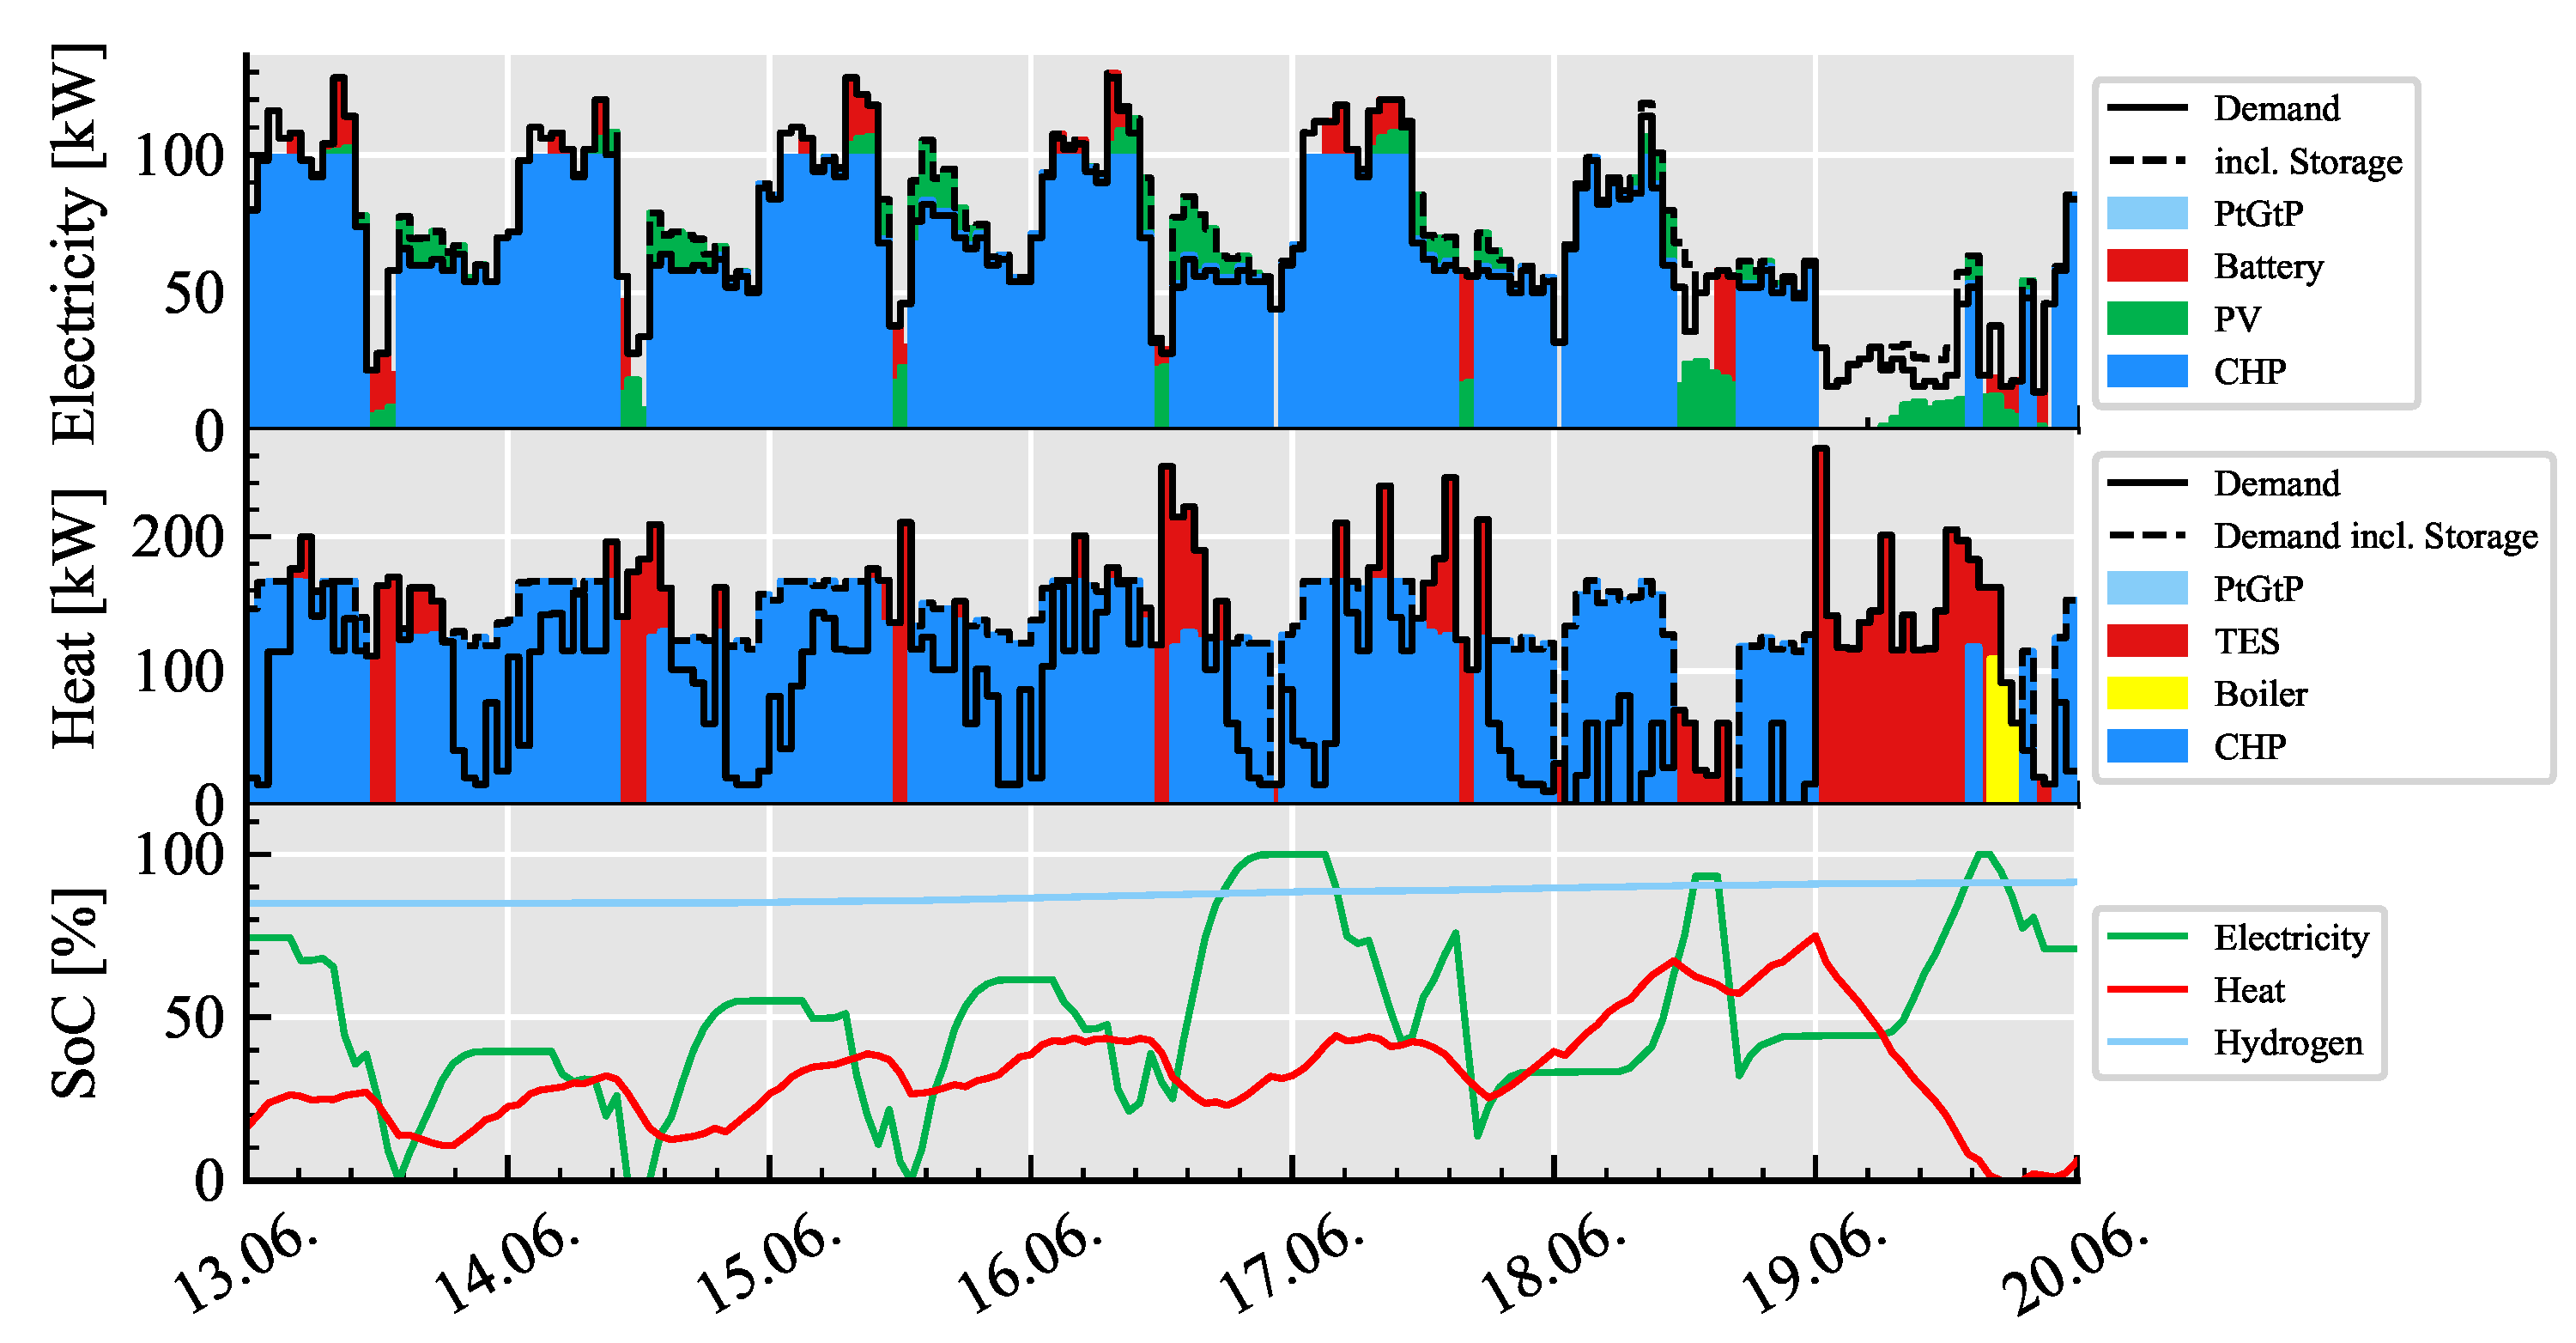
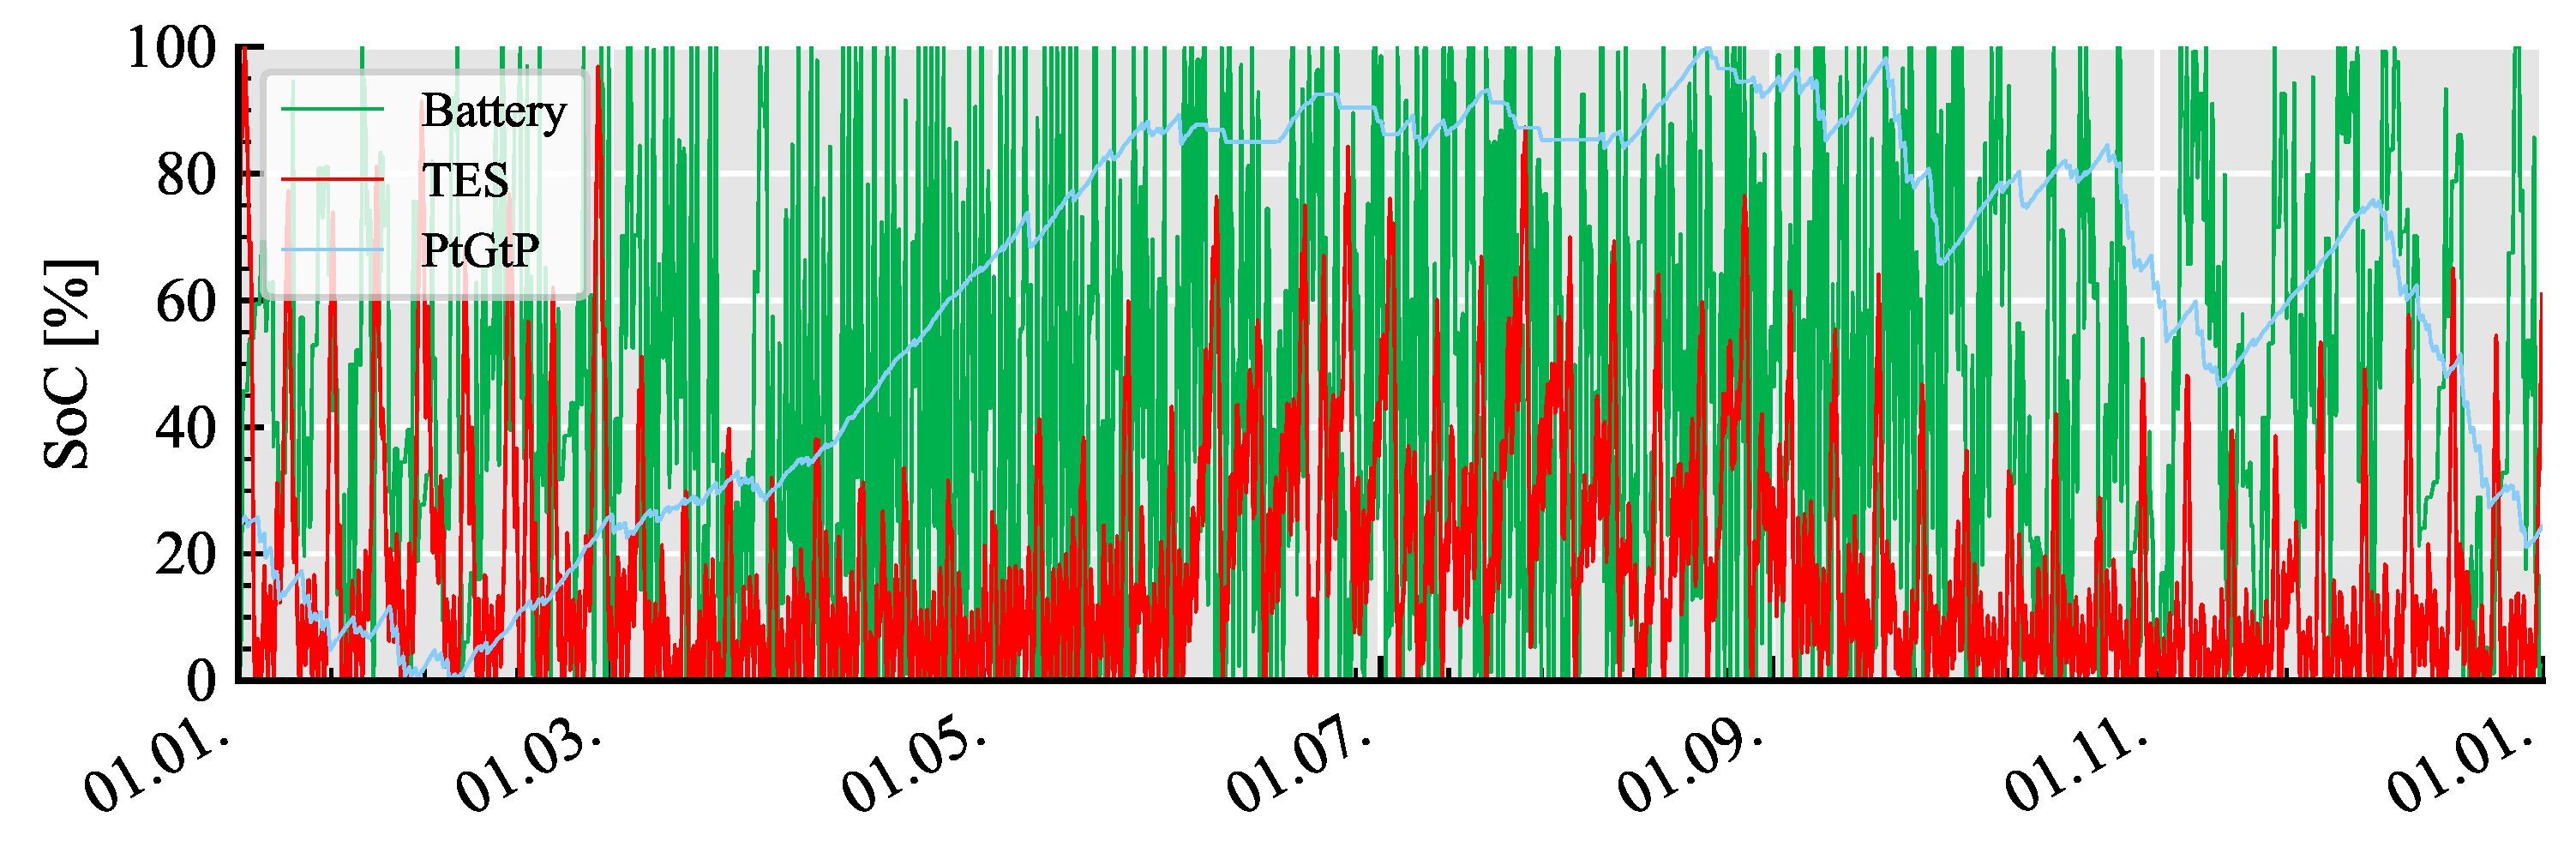
5.1. Optimal Dispatch

The simulation per system configuration is run for one year and then evaluated with the objectives introduced in Section 3.1. The schedules are selected in such a way that the costs for the operator are kept to a minimum over the period under consideration.
Figure 8 exemplifies the behaviour of the technologies for one week. The entire variety of technological possibilities for energy supply is used, whereby the CHP clearly takes over the main part. During working hours, which have high heat and power requirements, the CHP operates depending on the electricity demand. Surplus heat is stored in the TES. On the electricity side, the CHP is completed by the PV and the battery, meaning that the whole system does not need to draw or feed in electricity at most times. During the night and at weekends, the heat and electricity demand drops and the CHP switches off due to its limited partial load capacity. Thermally, the TES then becomes the main source of heat and, as soon as it is empty in a few hours, so does the boiler. Electrically, these low-demand periods are partly filled by the battery, but there are still times when electricity has to be drawn from the grid. However, due to the chosen optimisation approach, these are usually cheap times on the energy markets, when there is a great deal of renewable energy in the grid. The storage systems, as already mentioned, show steady use. The electricity storage system mainly bridges midday PV surges for the night. The TES shows a similar behaviour for the CHP heat but additionally manages to shift heat from the working week to the weekend due to its larger storage volume. The PtGtP is charged very regularly in this early summer week and increases significantly in filling level over the week. It is fed by both PV and CHP when they need additional flexibility. The system does not play a crucial role but still helps to provide (technical) advantages in the interaction of all technologies.
Figure 9 shows the state of charges (SOCs) of electricity, heat, and hydrogen storage systems over the full period of one year for the same exemplary system setup. A clearly different basic behaviour of the various storage systems can be seen here: the battery storage system serves as a short-term storage system and, as already seen in Figure 8, is used, for example, to save excess PV electricity during the day into the night hours. In contrast, the thermal storage is used as medium-term storage to absorb excess CHP heat at the weekend or in the night hours and save it for load peaks during production, so that the boiler can be avoided. Hydrogen storage, for its part, fulfills its task as long-term storage and helps to transfer the summer PV surpluses into the winter. The systems thus complement each other and do not compete with each other. What is particularly exciting and promising here is to see that the PtGtP is actually used very regularly. Due to the selected optimal dispatch algorithm, this only happens when its operation represents an actual added economic value during operation. It can therefore already be stated at this point that the hydrogen storage system can achieve cost advantages in operation.

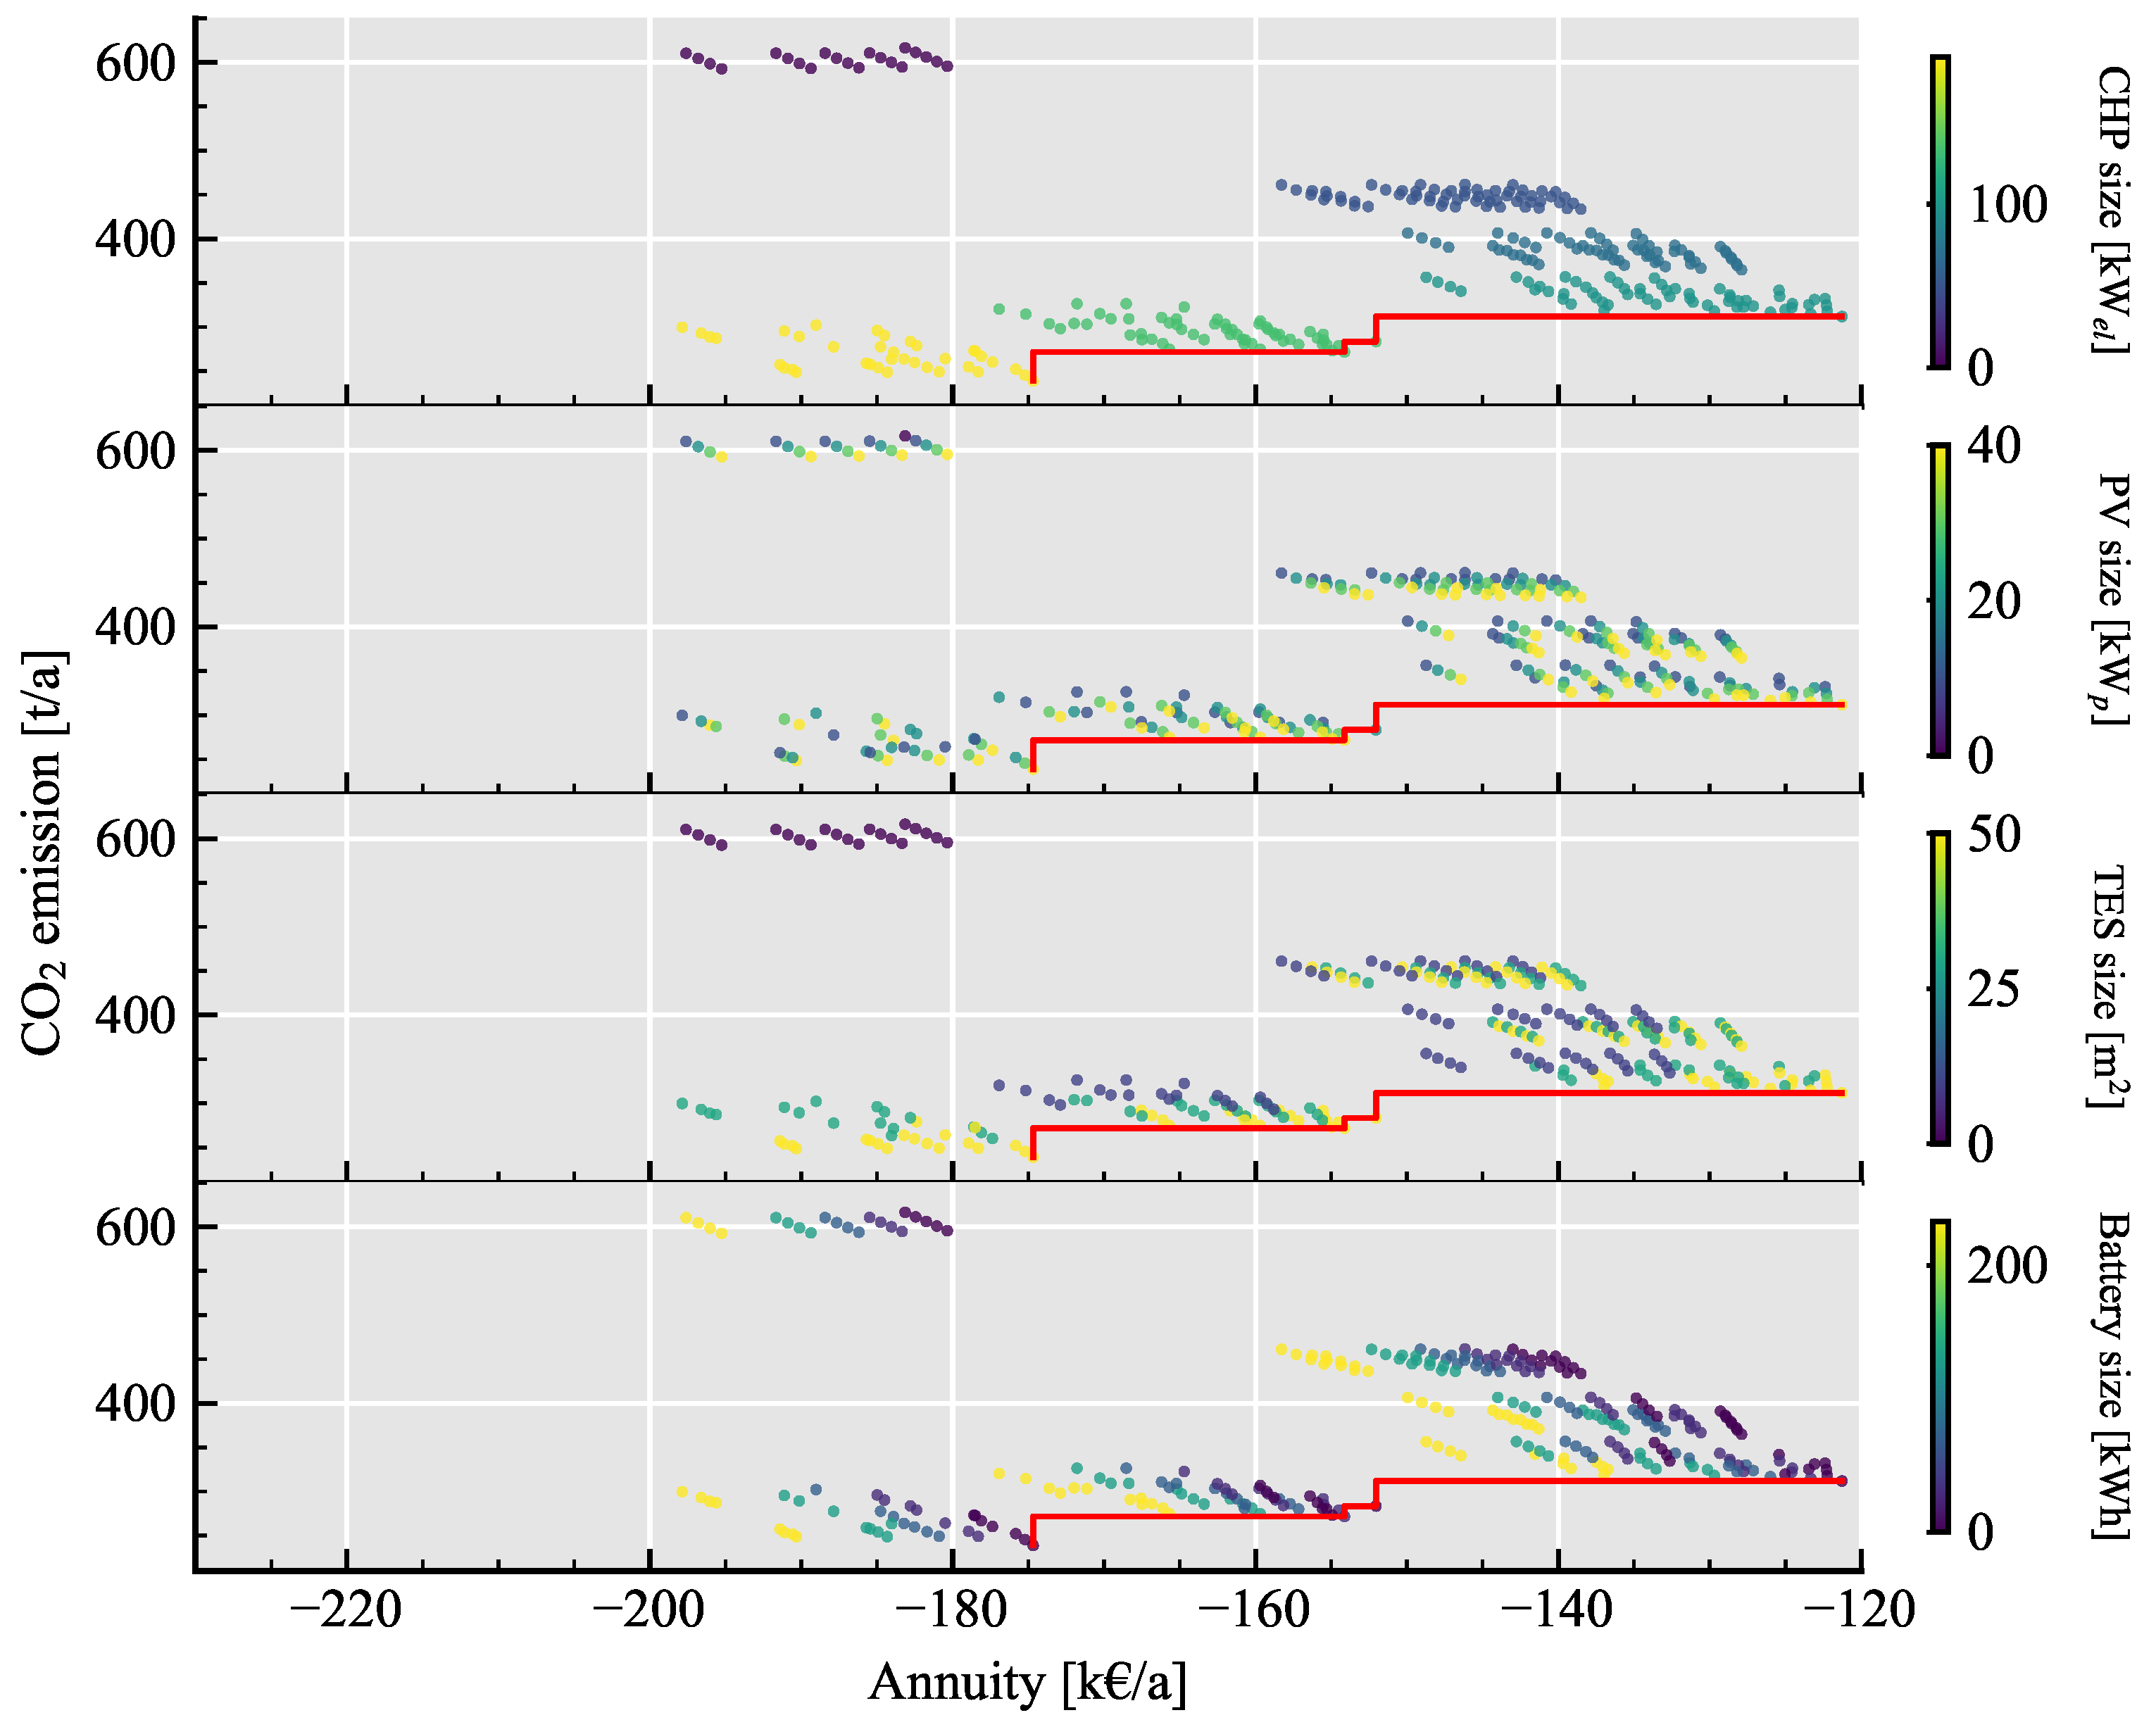
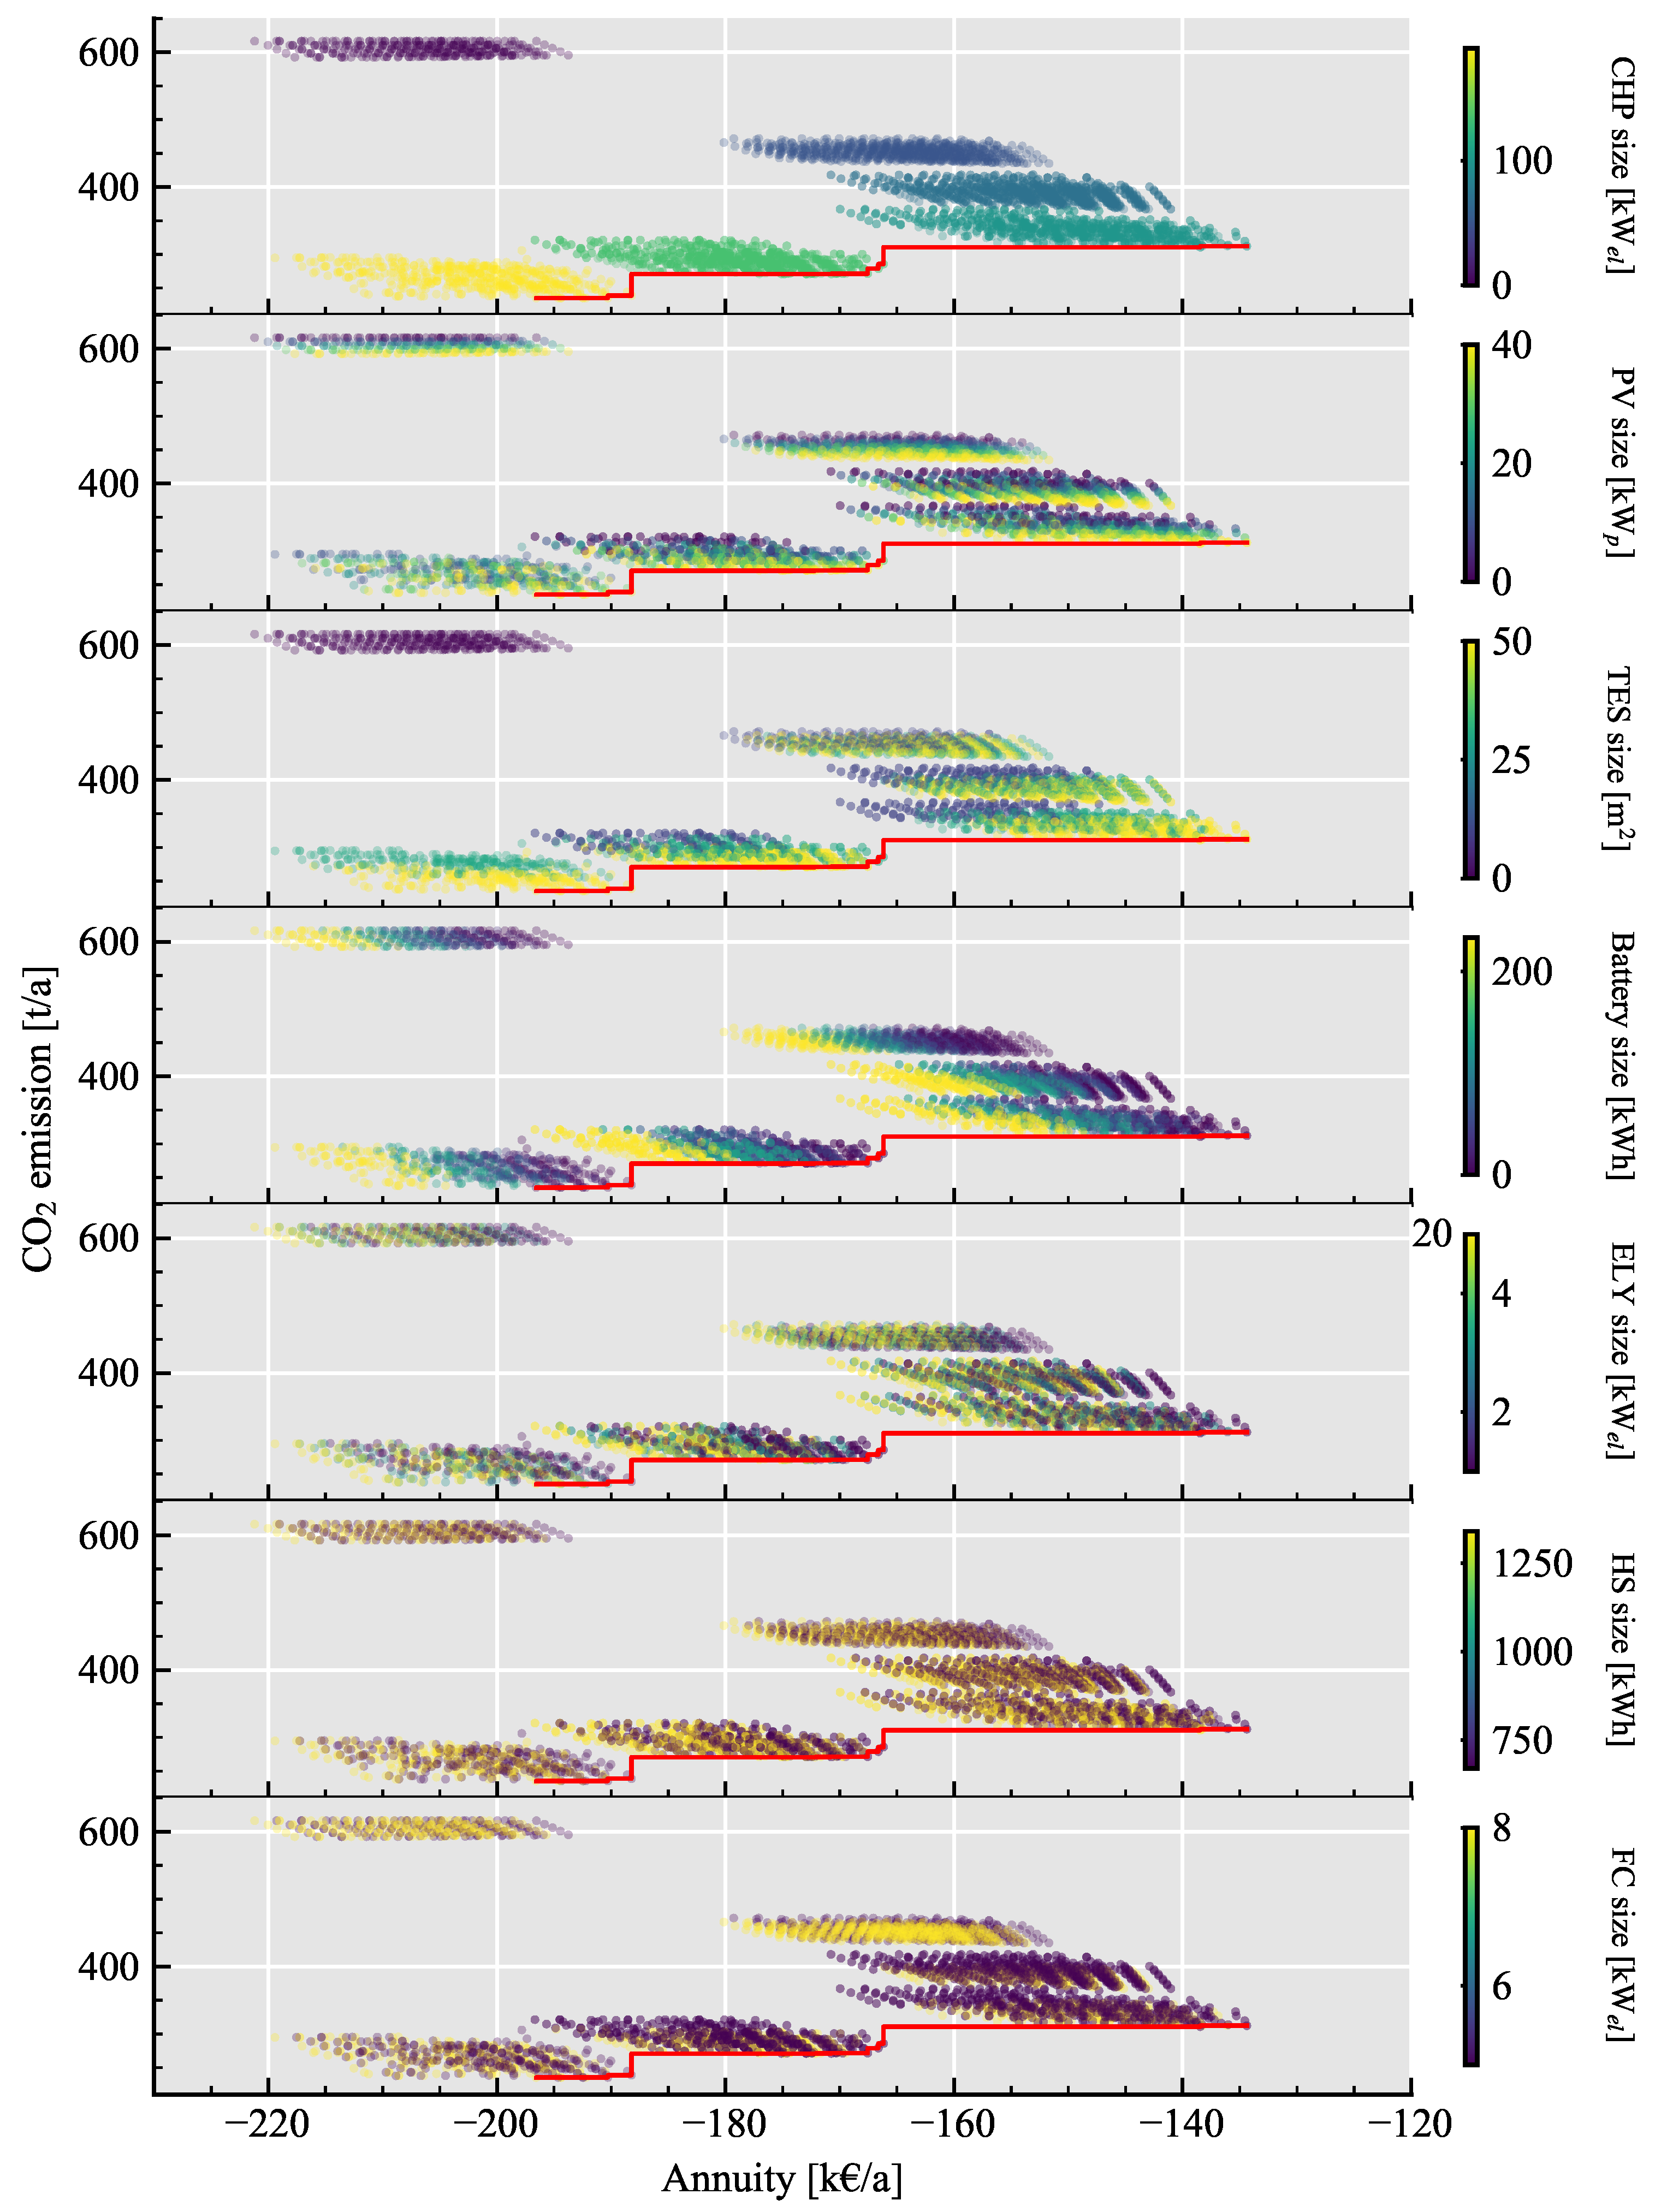
5.2. Multiobjective Optimal Sizing

As described in Section 3.3.1, the technology sizes are changed in the course of the optimisation, meaning that different combinations of the technologies are iterated. A maximum computing time of 2.5 h per sizing was set, which was rarely reached. In addition, different sizing calculations were computed in parallel on different CPU threads, which was easily possible due to the chosen brute force approach. The complete optimisation of both scenarios needs about 140 h or 6 days on a modern desktop PC.
The results of this MO can now first be examined as a scatter plot of the two target dimensions and with regard to the influence of the different technology sizes. The Pareto front, which includes all optimal energy system alternatives, is particularly relevant here. The graphical representation for scenario 1 can be found in Figure 10, while that for scenario 2 can be seen in Figure 11. The technology sizes are shown as colour codes, and for each technology there is a separate diagram. The Pareto front is shown as a red line in each graph. In addition, the Pareto optimal configurations are summarised in Table 3 forming a multi criteria decision matrix.
For scenario 1 (Figure 10) we see that the CHP has by far the largest impact in both dimensions and that large clusters of these energy systems form. Here, no CHP is the worst choice in economic and environmental terms (upper left corner). By increasing the CHP size, the point cloud moves towards the bottom right. This means that the energy supply concept becomes cheaper and emits less CO2. After a system size of 99 kW el , this behaviour changes, at least in economic terms. A further improvement in emissions is then only possible with rising costs, and a broad Pareto front forms. A larger PV plant also (almost) always leads to an improvement in both dimensions, even if the effects are significantly smaller here. Here, the tipping point of an overly large system does not seem to be reached due to the limited roof area. The larger the CHP becomes, the more important a larger TES seems to be, which seems logical. Here, bigger seems to be overall better, even if the improvement stagnates at some point. Only four of those systems are actually Pareto optimal. These include systems with large PV installations, large TESs, and no to small batteries. The saving of one tonne of CO2 costs 732€/ t to 1061€/ t , which seems rather high. The German Federal Environment Agency estimates the societal climate costs of a tonne of CO2 in 2020 at 195€/ t [57]. Implementing the more climate-friendly and thus more expensive solutions therefore does not seem advisable today.
The course of scenario 2 (see Figure 11) looks very similar to scenario 1. By adding the hydrogen technologies, the point clouds are correspondingly larger, since the combination possibilities are much more extensive. Nothing changes in the conclusions about the technologies that have already been examined in scenario 1. The graphically visible effects of the PtGtP system are rather small. As a tendency, it can be noted that the economic efficiency tends to worsen with larger system components, but the emissions hardly change. A closer look at the decision matrix confirms this observation. Adding even a small PtGtP plant to the optimal systems from scenario 1 significantly worsens the annuity, but the emissions remain almost the same. The additional costs for the hydrogen system are approximately 13,000€/ a to 22,000€/ a , which corresponds to a cost increase of approximately 11%.

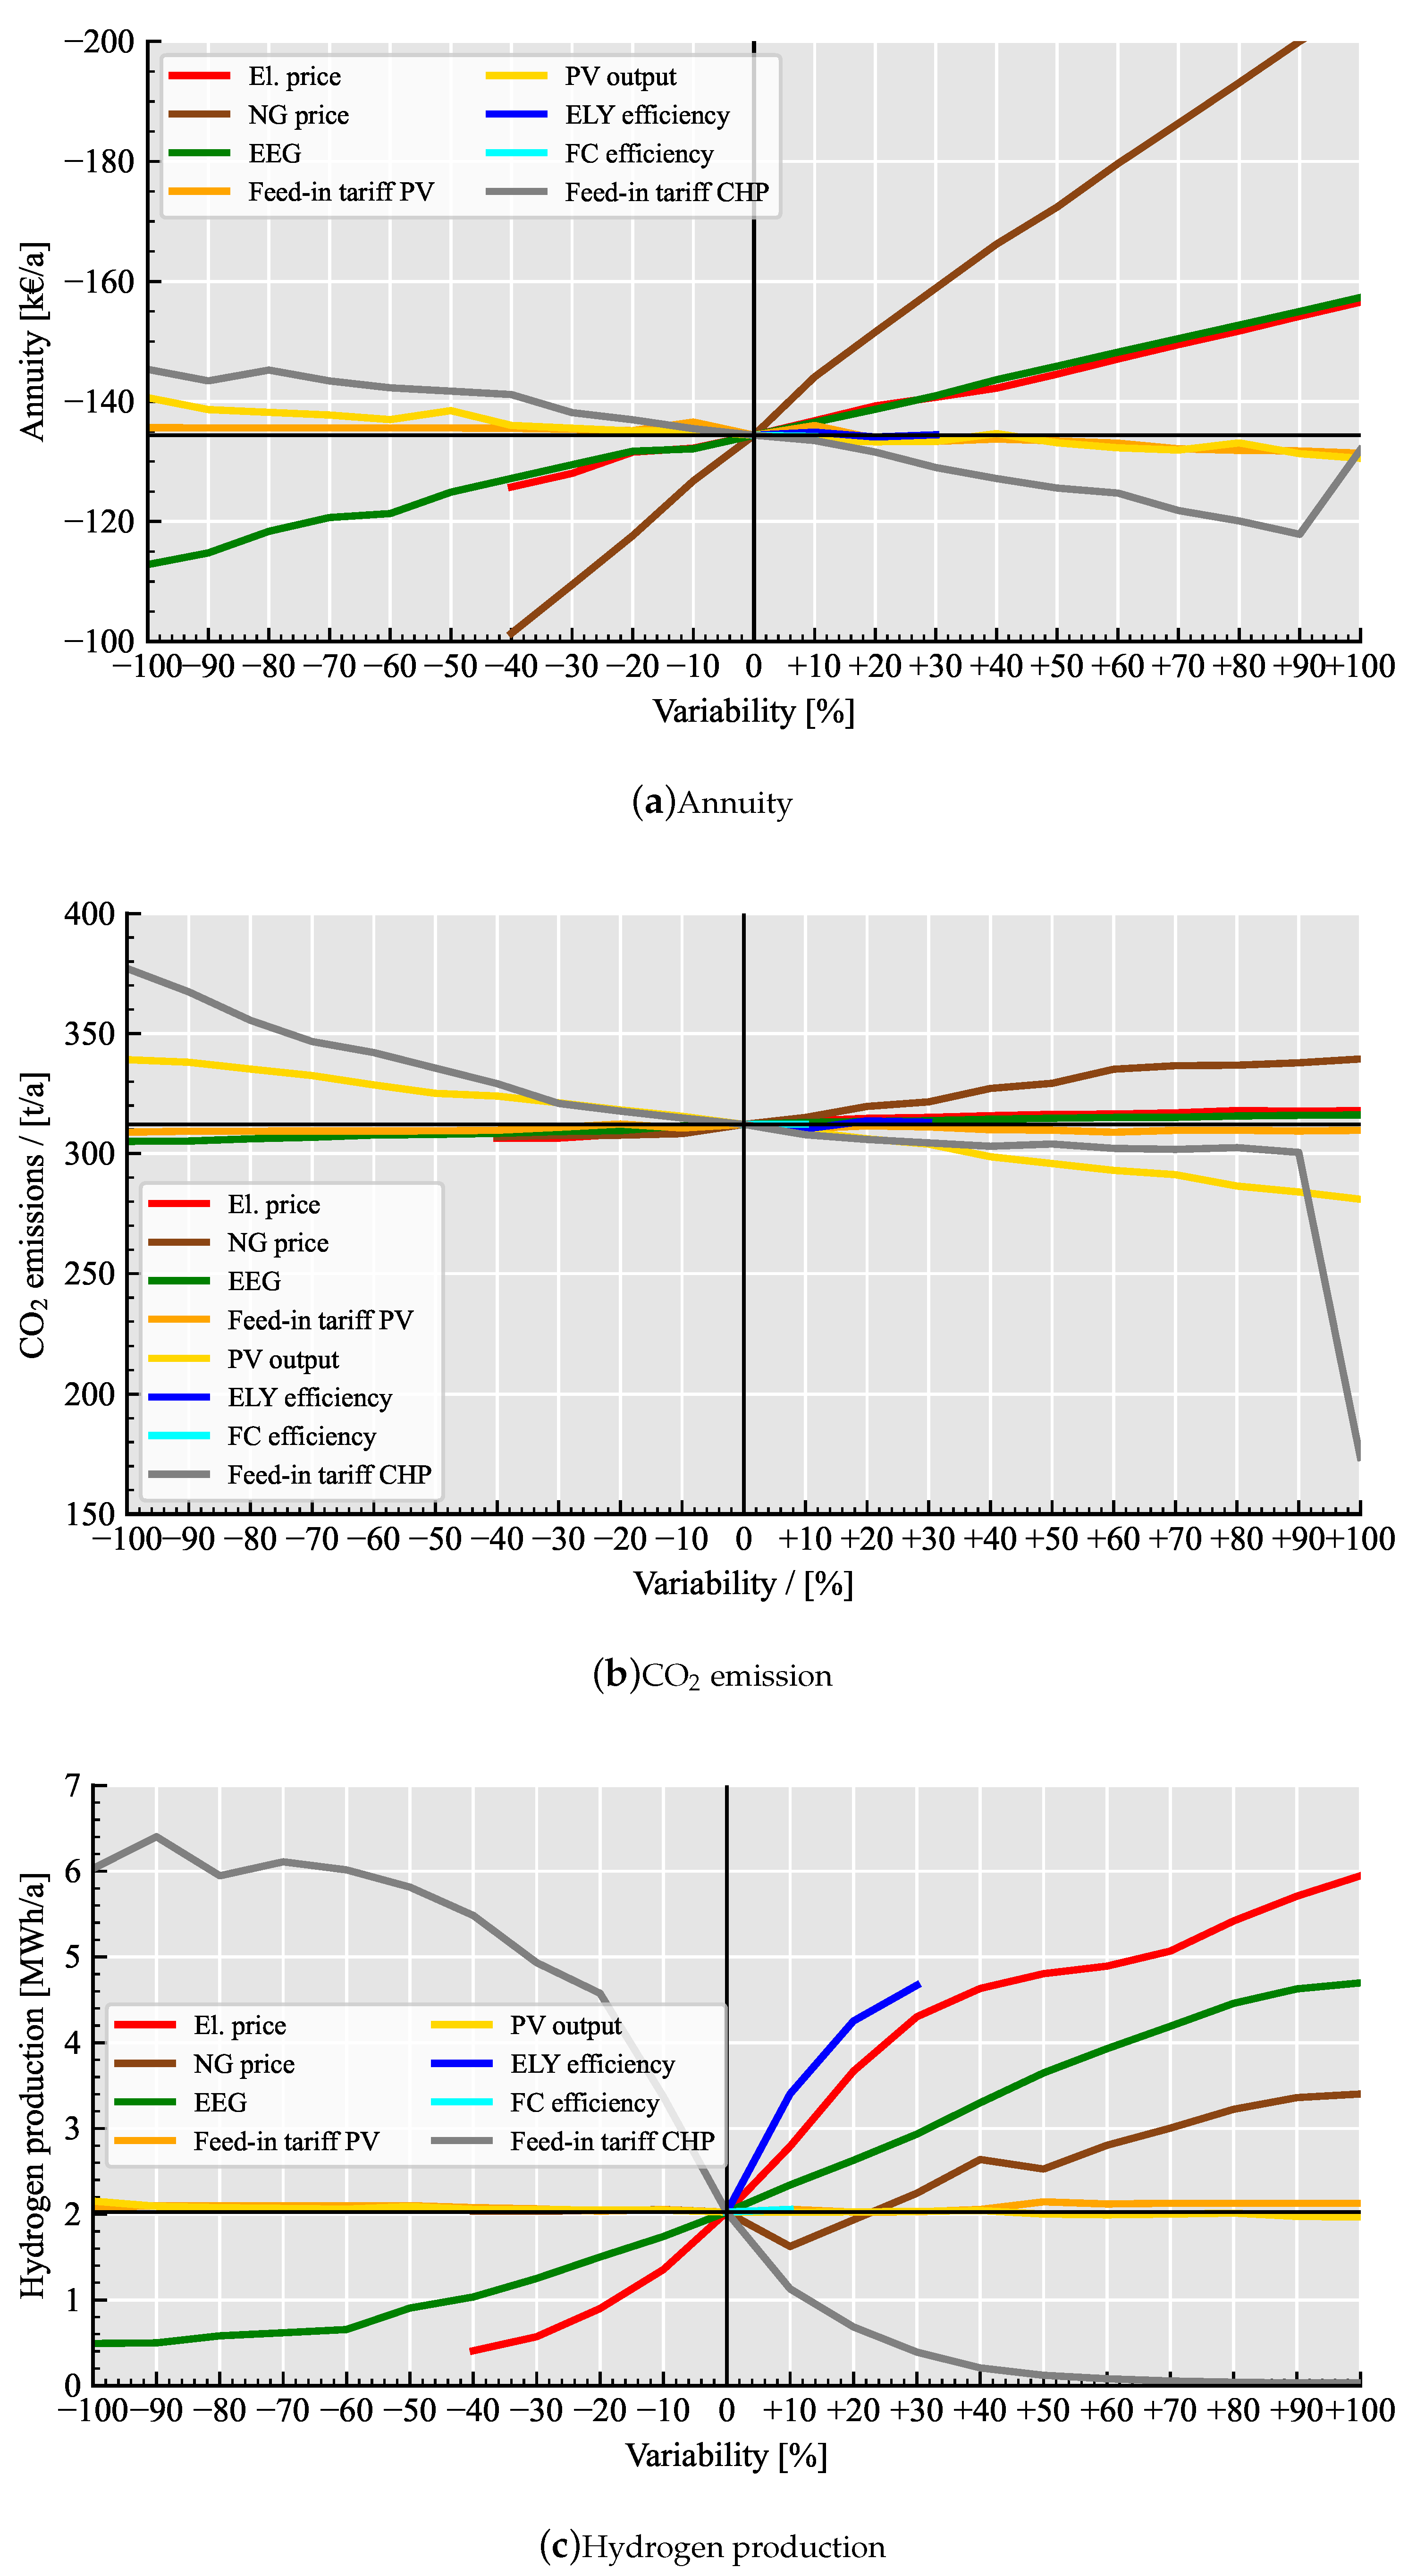
5.3. Sensitivity Analysis

A key challenge for any company is to make decisions in the face of uncertainty, which can turn out to be either an opportunity or a risk for them. An unpredictable future and its consequences are difficult to assess. If decisions are to be made, appropriate methods must be used to determine sound estimates and trade-offs between the effects on the company [58].
As shown in Section 5.2, the installation of a PtGtP system is neither ecologically nor economically advantageous from today’s perspective. However, the question arises as to which framework conditions would have to change in order for such a system to become more sensible. In order to gain a better insight into this, a sensitivity analysis is carried out in the following. Sensitivity analysis is a method to quantify the influence of various uncertain parameters on the performance of a complex system [59]. In the literature (cf. [60,61,62]), it is used to understand, for example, the impact of changing energy prices on the economic viability of a supply concept and thus to develop appropriate countermeasures and make risk-minimising decisions. Likewise, this method can be used to investigate, as in our case, which parameters would have to change and to what extent in order to make a project successful. For this purpose, one of the uncertain input parameters is varied in several steps, while the others are kept constant. The system results can then be shown as a function of these changes and compared between the parameters.
We have identified the following parameters (in bold) as particularly relevant and uncertain for the success of a PtGtP solution. Electricity and NG prices depend not only on very volatile international trading markets but also, and above all, on national legislation and therefore change frequently and with little predictability. This includes not only procurement prices but also subsidies for feeding locally generated electricity into the grid (PV and CHP feed-in tariff). In Germany, the EEG levy, used to fund renewable energy subsidies, is a matter of great debate. This levy has risen sharply in recent years and is payable, for example, on electricity generated in-house as well. In addition to these more energy-economic factors, this section also looks at advances in energy technology, especially efficiency improvements in ELY and FC and changes in PV electricity production, as would be possible, for example, by relocating.
For the sensitivity analysis, the technologies of the most economical solution of scenario 2 are used (CHP 99 kW el , PV 40 kW p , TES 50 m 3 , battery 0 kWh , ELY 1 kW el , HS 670 kWh , FC 5 kW el ). The statements for this system should, on the one hand, be the most relevant and, on the other hand, their basic statement should be transferable to all systems. The identified parameters are varied in a range of 100 % to 100%. Parameters for which this makes no physical or economic sense (e.g., the increase in FC efficiency) are varied correspondingly less. Figure 12 shows the results of the sensitivity analysis as an impact on the annuity, the emissions, and the amount of hydrogen produced as a function of the identified parameters.
With regard to the annuity, it can be seen that the most sensitive parameter is the NG price. The increase is relatively constant and primarily affects the operating behaviour of the CHP. At the same time, the boiler is also operated minimally more. If the NG price rises, the annuity increases considerably, and CO2 emissions rise by around 30 t / a . Hydrogen production is initially reduced when the price of NG rises by 10% because less CHP electricity flows to the ELY. If the price of NG falls, the annuity decreases significantly, but nothing changes in terms of CO2 emissions and hydrogen production. This is due to the fact that the operating behaviour of the CHP unit has not changed in terms of NG consumption, and only the reduction in the price of NG makes up this difference in annuity.
The price curve of electrical energy is significantly flatter than that of NG. As the electricity price increases, the amount of electricity imported slowly decreases, making the dairy more self-sufficient. Therefore, hydrogen production continues to rise as the ELY is supplied with more PV and CHP electricity. If the price of electricity falls, less and less PV and CHP electricity is used for hydrogen production as the costs of purchasing electricity from the grid are lower than the intermediate storage of local electricity in hydrogen. This leads to a little more CO2 being emitted.
The course of the EEG levy is similar to the electricity price in terms of annuity and CO2 emissions. When the EEG is reduced, the purchase of electricity from the grid again becomes cheap, and the intermediate storage of electricity thus becomes obsolete. The amount of electricity flowing from the CHP and PV to the ELY decreases slowly as the electricity is fed into the public grid instead. This in turn leads to higher CO2 emissions. If the EEG is completely omitted, a large part of the PV electricity is fed into the grid. If, on the other hand, the EEG increases, more CHP and PV electricity will be used for hydrogen production.
The variability of the PV output has little effect on the annuity. The increase in PV output leads to an increase in the amount of electricity fed into the public grid and thus to a slight increase in the remuneration. In addition, the feed-in to the grid reduces the emission values. It has hardly any influence on the production of hydrogen.
The reduction of the PV feed-in tariff has a similarly low effect to the change in production volume. The incentive to feed PV electricity into the public grid gradually decreases. In the end, PV electricity is used almost exclusively for self-consumption. This increases the amount of CHP electricity that is fed into the public grid. The emission values hardly change. It also has hardly any effect on hydrogen production. On one hand, a little more PV electricity is used for hydrogen production, while on the other hand, less CHP electricity is used for this purpose.
The variation of the CHP feed-in tariff has a large impact on the emission value and on hydrogen production but little impact on the annuity. Instead, when CHP feed-in tariff is reduced, more CHP electricity is used for hydrogen production, which is discontinuous from below 20 %. In addition, the amount of electricity generated by the CHP unit is reduced, which means that less electricity is fed into the grid, thus increasing the emission value. If, however, the CHP feed-in tariff increases, the amount of electricity from the CHP to the ELY decreases, and less hydrogen is produced. In addition, the amount of electricity from the CHP unit that is fed into the electricity grid gradually increases. If the CHP feed-in tariff increases by 100%, the entire CHP electricity flows into the electricity grid, meaning that a high CO2 credit takes place at the same time. However, in order to be able to cover the electricity demand, large amounts of electricity are drawn from the public grid, meaning that the annuity increases again.
Changing the efficiency of the ELY has no effect on annuity or emissions. However, the lossless system (+30%) variation) has the highest increase in hydrogen production of the systems studied
The increase in FC efficiency from 90% to 100% again has hardly any effect on annuity and emissions. Interestingly, however, there is no increase in hydrogen production here.

6. Discussion and Outlook

As shown in the results discussed in the previous chapter, the planning of distributed energy supply concepts using PtGtP as seasonal storage is multi-layered and complex. The presented planning tool using an energy system simulation and multi-criteria decision tools can be seen as a helpful supplement in the market establishment of such systems.
With the help of these tools, we were able to show that, for our case study, under the current German framework conditions, the construction of an PtGtP, even a small one, is neither economically nor ecologically profitable and that the systems of PV and CHP currently established on the market are the most worthwhile (cf. Figure 10 and Figure 11). While the PtGtP can deliver real economic value in operation, the current investment costs in such a system are far too high. Unfortunately, the system cannot yet deliver any added value ecologically in operation, as the electricity grid is still heavily supplied by fossil fuels, and local storage therefore does not necessarily mean a reduction in emissions. If the construction and demolition of the plants had also been taken into account in the ecological assessment, the result would have been even worse. However, we suggest that such systems should not only be considered from a hard economic and ecological point of view, but also from a marketing and long-term sustainability point of view, which would make an investment more likely today. However, these objectives are significantly more complex to quantify and are therefore part of further investigation.
We were able to show through our research that the combination of different storage technologies with different time horizons and efficiencies during operation can fulfill their intended tasks well in order to keep the local system efficient and optimal (cf. Figure 9). The energy simulation shows very well how in hybrid, sector-coupled systems, the energy-generating and energy-storage plants complement each other depending on the market situation and framework conditions in order to generate an advantage for companies, benefitting from the national regulatory framework.
Nevertheless, the results of this simulation should be treated with caution, as a number of simplifications have been made, which in the end are decisive for real operation. On the thermal side, the system only calculates energy quantities in kWh without considering the actual restrictions caused by different temperatures in the supply and return flow. Likewise, only hourly averages are simulated, but the system behaviour within these time steps can deviate massively and have a negative influence on the system. Furthermore, the simulation always assumes a perfectly predictable future, where weather changes and stock exchange prices are always known, which simplifies the use of seasonal storage tremendously. For the use of such a system in the field, an intelligent and dynamic energy management system is therefore indispensable.
By adding a sensitivity analysis to the methodology, more in-depth findings can be derived, including specific recommendations for action. For the case study, it can be seen that an increase in the efficiency of technical installations has a relatively small effect. On the other hand, the use of PtGtP can be specifically promoted by a clever change in the political framework conditions.
However, even these statements only represent half the truth, since in this classical sensitivity analysis, it was assumed that only one parameter changes at a time. In the real market, for example, an increase in the price of NG also directly changes the price of electricity, and the abolition of the EEG levy would also lead to a reduction in the PV feed-in tariff. However, when looking at the results of hydrogen production, it is clear that several, well-aligned changes would be needed to achieve a significant effect.
For example, a Monte Carlo Simulation could be used for this purpose, in which a large number of different scenarios could be built and analysed using statistical future models of the parameters and their correlation [61,63]. This would give more reliable and better information on the systems’ performance, as it would provide a large amount of information and reflect realistic modelling. A major disadvantage, however, would be the high computational time and the high modelling effort.
Directly considering the uncertainties in the optimal sizing would be even better. Appropriate approaches to this already exist in the literature (e.g., [64,65]), but they require even more resources and are more modelling-intensive. The choice of a possible optimisation approach is therefore very diverse and depends to a large extent on the objective, the availability of data and resources, and the project status. The optimisation method used here, although not entirely new and not particularly efficient, provides very reliable, realistic, and detailed results. By choosing an extremely simple optimal sizing algorithm and an open source tool for optimising plant operation, the basic structure can be transferred to other regions and countries without restrictions and with only slight modifications. Limitations only arise when the choice of technology would become too large, which would be made possible with more efficient optimisation tools (e.g., genetic algorithms) or a simplification of the technical models.

7. Conclusions

This publication presented a planning tool for hybrid, distributed energy systems and assessed the installation of PtGtP systems using an industrial case study. Based on the current German market conditions, it was investigated whether such a system in combination with an established PV, battery and CHP combination offers economic or ecological advantages.
After detailed literature research on the integration of hydrogen technologies in energy systems, a novel methodology for the overall planning process of HES was explained. A brute force optimal sizing approach based on energy system simulation and modelling of real system components available on the market was used. This was applied to the case study of a dairy for which the German legal framework valid in early 2020 was assumed to apply. Over an observation period of 10 a , different technology sizes were iterated, and the Pareto optimal solutions with regard to economic and ecological objectives were determined. A sensitivity analysis was conducted to determine the future opportunities and risks of hydrogen technology. For this purpose, uncertain parameters were identified and individually varied.
It has been shown that HESs provide worthwhile added values for companies in terms of economic efficiency and emission values. A CHP unit, especially, has a considerable positive influence on economic and ecologic dimension. The use of a small PtGtP plant, on the other hand, is not worthwhile under the current German framework conditions and for the case study used. This is due on the one hand to high investment costs, and on the other hand to cheap energy imports and high feed-in tariffs. However, it is foreseeable that this statement could be revised in the short term due to legal changes and the current development of energy prices.

Author Contributions

Conceptualisation and methodology, L.S.; software, L.S. and A.A.I.B.; validation, L.S.; formal analysis, A.A.I.B. and L.S.; data curation, A.A.I.B. and L.S.; writing—original draft preparation, L.S. and A.A.I.B.; writing—review and editing, P.K. and B.H.; visualisation, L.S.; supervision, H.H., P.K., B.H. and K.v.M.; project administration, L.S., H.H. and P.K.; funding acquisition, H.H., P.K., B.H. and K.v.M. All authors have read and agreed to the published version of the manuscript.

Funding

This research was funded by the Federal Ministry for Economic Affairs and Climate Action (BMWK) and the Federal Ministry of Education and Research (BMBF) of Germany in the project ENaQ (project number 03SBE111).

Data Availability Statement

The data presented in this study are available on request from the corresponding author. The data are not publicly available due to non-disclosure reasons.

Acknowledgments

The authors thank all the other ENaQ project partners for support, inspiration, and fruitful discussions. We would also like to thank the dairy for providing the required data on energy consumption and the PtGtP manufacturers for providing the data sheets and answering our questions. Finally, a special thanks is due to Cody Hancock (DLR), who proofread the manuscript.

Conflicts of Interest

The authors declare no conflict of interest.

Abbreviations

The following abbreviations are used in this manuscript:
CHPcombined heat and power
EEGGerman renewable energy sources act
ELYelectrolyzer
FCfuel cell
HEShybrid energy system
HShydrogen storage
MILPmixed integer linear programming
MOmulti-objective optimisation
NGnatural gas
PEMproton exchange membrane
PtGtPpower-to-gas-to-power
PVphotovoltaic
SOCstate of charge
TESthermal energy storage

References

  1. Manwell, J.F. Hybrid Energy Systems. Encycl. Energy 2004, 3, 215–229. [Google Scholar] [CrossRef]
  2. Sterner, M.; Stadler, I. Energiespeicher—Bedarf, Technologien, Integration; Springer: Berlin/Heidelberg, Germany, 2017. [Google Scholar] [CrossRef]
  3. Zapf, M. Stromspeicher und Power-to-Gas im Deutschen Energiesystem: Rahmenbedingungen, Bedarf und Einsatzmöglichkeiten; Springer: Berlin/Heidelberg, Germany, 2017. [Google Scholar] [CrossRef]
  4. International Energy Agency (IEA). The Future of Hydrogen: Seizing Today’s Opportunities; OECD: Paris, France, 2019. [Google Scholar]
  5. Floristran, A.; Brahy, N.; Kraus, N.; Skiker, S.; Damman, S.; Hayter, D.; Nozharova, D. HyLaw—EU Policy Paper; European Commission: Brussels, Belgium, 2019. [Google Scholar]
  6. Fuel Cells and Hydrogen 2 Joint Undertaking. Hydrogen Roadmap Europe: A Sustainable Pathway for the European Energy Transition; Publications Office of the European Union: Luxembourg, 2019. [Google Scholar]
  7. FuelCellsWorks. Germany: Hydrogen Partnership with Africa Begins. 2020. Available online: https://fuelcellsworks.com/news/germany-hydrogen-partnership-with-africa-begins/ (accessed on 16 March 2022).
  8. Liu, Z.; Kendall, K.; Yan, X. China Progress on Renewable Energy Vehicles: Fuel Cells, Hydrogen and Battery Hybrid Vehicles. Energies 2019, 12, 54. [Google Scholar] [CrossRef] [Green Version]
  9. The Energy and Resources Institute; National Centre for Climate Change Strategy and International Cooperation; Central University of Finance and Economics; Zhejiang University; United Nations Development Programme; Shakti Sustainable Energy Foundation. Low Carbon Development in China and India; The Energy and Resources Institute: New Delhi, India, 2016. [Google Scholar]
  10. Vosen, S.; Keller, J. Hybrid energy storage systems for stand-alone electric power systems: Optimization of system performance and cost through control strategies. Int. J. Hydrogen Energy 1999, 24, 1139–1156. [Google Scholar] [CrossRef]
  11. Bocci, E.; Zuccari, F.; Dell’Era, A. Renewable and hydrogen energy integrated house. Int. J. Hydrogen Energy 2011, 36, 7963–7968. [Google Scholar] [CrossRef]
  12. Gillessen, B.; Heinrichs, H.U.; Stenzel, P.; Linssen, J. Hybridization strategies of power-to-gas systems and battery storage using renewable energy. Int. J. Hydrogen Energy 2017, 42, 13554–13567. [Google Scholar] [CrossRef]
  13. Nguyen, H.T.; Safder, U.; Nhu Nguyen, X.Q.; Yoo, C. Multi-objective decision-making and optimal sizing of a hybrid renewable energy system to meet the dynamic energy demands of a wastewater treatment plant. Energy 2020, 191, 116570. [Google Scholar] [CrossRef]
  14. Luta, D.N.; Raji, A.K. Optimal sizing of hybrid fuel cell-supercapacitor storage system for off-grid renewable applications. Energy 2019, 166, 530–540. [Google Scholar] [CrossRef]
  15. Yazdani, S.; Deymi-Dashtebayaz, M.; Salimipour, E. Comprehensive comparison on the ecological performance and environmental sustainability of three energy storage systems employed for a wind farm by using an emergy analysis. Energy Convers. Manag. 2019, 191, 1–11. [Google Scholar] [CrossRef]
  16. Cilogulları, M.; Erden, M.; Karakilcik, M.; Dincer, I. Investigation of hydrogen production performance of a Photovoltaic and Thermal System. Int. J. Hydrogen Energy 2017, 42, 2547–2552. [Google Scholar] [CrossRef]
  17. Guinot, B.; Champel, B.; Montignac, F.; Lemaire, E.; Vannucci, D.; Sailler, S.; Bultel, Y. Techno-economic study of a PV-hydrogen-battery hybrid system for off-grid power supply: Impact of performances’ ageing on optimal system sizing and competitiveness. Int. J. Hydrogen Energy 2015, 40, 623–632. [Google Scholar] [CrossRef]
  18. Eriksson, E.; Gray, E. Optimization and integration of hybrid renewable energy hydrogen fuel cell energy systems—A critical review. Appl. Energy 2017, 202, 348–364. [Google Scholar] [CrossRef]
  19. Firtina-Ertis, I.; Acar, C.; Erturk, E. Optimal sizing design of an isolated stand-alone hybrid wind-hydrogen system for a zero-energy house. Appl. Energy 2020, 274, 115244. [Google Scholar] [CrossRef]
  20. Bakhtiari, H.; Naghizadeh, R.A. Multi–criteria optimal sizing of hybrid renewable energy systems including wind, photovoltaic, battery, and hydrogen storage with ε–constraint method. IET Renew. Power Gener. 2018, 12, 883–892. [Google Scholar] [CrossRef]
  21. Pfenninger, S.; Hawkes, A.; Keirstead, J. Energy systems modeling for twenty-first century energy challenges. Renew. Sustain. Energy Rev. 2014, 33, 74–86. [Google Scholar] [CrossRef]
  22. Schmeling, L.; Schönfeldt, P.; Klement, P.; Wehkamp, S.; Hanke, B.; Agert, C. Development of a Decision-Making Framework for Distributed Energy Systems in a German District. Energies 2020, 13, 552. [Google Scholar] [CrossRef] [Green Version]
  23. Løken, E. Use of multicriteria decision analysis methods for energy planning problems. Renew. Sustain. Energy Rev. 2005, 11, 1584–1595. [Google Scholar] [CrossRef]
  24. Wang, Y.; Wang, X.; Yu, H.; Huang, Y.; Dong, H.; Qi, C.; Baptiste, N. Optimal design of integrated energy system considering economics, autonomy and carbon emissions. J. Clean. Prod. 2019, 225, 563–578. [Google Scholar] [CrossRef]
  25. Di Somma, M.; Yan, B.; Bianco, N.; Graditi, G.; Luh, P.B.; Mongibello, L.; Naso, V. Operation optimization of a distributed energy system considering energy costs and exergy efficiency. Energy Convers. Manag. 2015, 103, 739–751. [Google Scholar] [CrossRef]
  26. Ngatchou, P.N.; Zarei, A.; Fox, W.L.J.; El-Sharkawi, M.A. Pareto Multiobjective Optimization. In Modern Heuristic Optimization Techniques; Lee, K.Y., El-Sharkawi, M.A., Eds.; John Wiley & Sons, Inc.: Hoboken, NJ, USA, 2008; pp. 189–207. [Google Scholar] [CrossRef]
  27. Orner, M. Nutzungsorientierte Auslegung des Antriebsstrangs und der Reichweite von Elektrofahrzeugen; Springer Fachmedien: Wiesbaden, Germany, 2018. [Google Scholar] [CrossRef]
  28. Verein Deutscher Ingenieure. VDI 2067—Economic Efficiency of Building Installations: Fundamentals and Economic Calculation; Beuth-Verlag: Berlin, Germany, 2012. [Google Scholar]
  29. Brealey, R.A.; Myers, S.C.; Allen, F. Principles of Corporate Finance; The McGraw-Hill Irwin Series in Finance, Insurance, and Real Estate; McGraw-Hill Education: Maidenhead, UK, 2014. [Google Scholar]
  30. Heuck, K.; Dettmann, K.D.; Schulz, D. Elektrische Energieversorgung: Erzeugung, Übertragung und Verteilung Elektrischer Energie für Studium und Praxis; Springer Vieweg: Wiesbaden, Germany, 2013. [Google Scholar] [CrossRef]
  31. Rubik, F.; Müller, R.; Harnisch, R.; Holzhauer, B.; Schipperges, M.; Geiger, S. Umweltbewusstsein in Deutschland 2018: Ergebnisse Einer Repräsentativen Bevölkerungsumfrage; Bundesministerium für Umwelt, Naturschutz und Nukleare Sicherheit/Umweltbundesamt: Berlin/Dessau-Roßlau, Germany, 2019. [Google Scholar]
  32. Peters, G.P. Carbon footprints and embodied carbon at multiple scales. Curr. Opin. Environ. Sustain. 2010, 2, 245–250. [Google Scholar] [CrossRef]
  33. Wehkamp, S.; Schmeling, L.; Vorspel, L.; Roelcke, F.; Windmeier, K.L. District Energy Systems: Challenges and New Tools for Planning and Evaluation. Energies 2020, 13, 2967. [Google Scholar] [CrossRef]
  34. Bundesamt für Wirtschaft und Ausfuhrkontrolle. Merkblatt zu den CO2-Faktoren: Energieeffizienz in der Wirtschaft—Zuschuss und Kredit; Bundesamt für Wirtschaft und Ausfuhrkontrolle: Eschborn, Germany, 2019. [Google Scholar]
  35. Tranberg, B.; Corradi, O.; Lajoie, B.; Gibon, T.; Staffell, I.; Andresen, G.B. Real-time carbon accounting method for the European electricity markets. Energy Strategy Rev. 2019, 26, 100367. [Google Scholar] [CrossRef]
  36. Windmeier, K.L. Länderspezifische Berechnung der Spezifischen C02-Emissionen des Stromverbrauchs im Europäischen Verbundnetz; Internship Report; University of Bremen and KEHAG Energiehandel: Bremen/Oldenburg, Germany, 2019. [Google Scholar]
  37. Gröger, M.; Berking, D.; Ludwig, A.; Bruckner, T. Kraft-Wärme-Kopplung und Solarthermie: Konkurrenzeffekte beim integrierten Einsatz. In Proceedings of the 8th Internationale Energiewirtschaftstagung der TU Wien, Vienna, Austria, 13–15 February 2013. [Google Scholar]
  38. Von Roon, S.; Huck, M. Merit Order des Kraftwerkparks; Forschungsstelle für Energiewirtschaft: Munich, Germany, 2010. [Google Scholar]
  39. Klotz, E.M.; Koepp, M.; Peter, F.; Thamling, N.; Wünsch, M.; Ziegenhagen, I.; Eikmeier, B.; Fette, M.; Janßen, K.; Jochem, E.; et al. Potenzial- und Kosten-Nutzen-Analyse zu den Einsatzmöglichkeiten von Kraft-Wärme-Kopplung (Umsetzung der EU-Energieeffizienzrichtlinie) Sowie Evaluierung des KWKG im Jahr 2014; Bundesministerium für Wirtschaft und Energie: Berlin, Germany, 2014. [Google Scholar]
  40. Kneiske, T.M.; Braun, M. Flexibility potentials of a combined use of heat storages and batteries in PV-CHP hybrid systems. Energy Procedia 2017, 135, 482–495. [Google Scholar] [CrossRef]
  41. Shah, K.K.; Mundada, A.S.; Pearce, J.M. Performance of U.S. hybrid distributed energy systems: Solar photovoltaic, battery and combined heat and power. Energy Convers. Manag. 2015, 105, 71–80. [Google Scholar] [CrossRef] [Green Version]
  42. Prakash, P.; Khatod, D.K. Optimal sizing and siting techniques for distributed generation in distribution systems: A review. Renew. Sustain. Energy Rev. 2016, 57, 111–130. [Google Scholar] [CrossRef]
  43. Schmeling, L.; Schönfeldt, P.; Klement, P.; Vorspel, L.; Hanke, B.; von Maydell, K.; Agert, C. A generalised optimal design methodology for distributed energy systems. TexhRxiv 2022. Preprint. [Google Scholar] [CrossRef]
  44. Miettinen, K. Nonlinear Multiobjective Optimization; Springer: New York, NY, USA, 1998. [Google Scholar] [CrossRef]
  45. Connolly, D.; Lund, H.; Mathiesen, B.V.; Leahy, M. A review of computer tools for analysing the integration of renewable energy into various energy systems. Appl. Energy 2010, 87, 1059–1082. [Google Scholar] [CrossRef]
  46. Sinha, S.; Chandel, S.S. Review of software tools for hybrid renewable energy systems. Renew. Sustain. Energy Rev. 2014, 32, 192–205. [Google Scholar] [CrossRef]
  47. Schmeling, L.; Klement, P.; Erfurth, T.; Kästner, J.; Hanke, B.; von Maydell, K.; Agert, C. Review of different Software Solutions for the holistic Simulation of distributed hybrid Energy Systems for the commercial Energy Supply. In Proceedings of the 33rd European Photovoltaic Solar Energy Conference and Exhibition, Amsterdam, The Netherlands, 25–29 September 2017; Smets, A., Taylor, N., Helm, P., Eds.; 2017; pp. 1994–1998. [Google Scholar] [CrossRef]
  48. Krien, U.; Schönfeldt, P.; Launer, J.; Hilpert, S.; Kaldemeyer, C.; Pleßmann, G. oemof.solph—A model generator for linear and mixed-integer linear optimisation of energy systems. Softw. Impacts 2020, 6, 100028. [Google Scholar] [CrossRef]
  49. Hilpert, S. Effects of Decentral Heat Pump Operation on Electricity Storage Requirements in Germany. Energies 2020, 13, 2878. [Google Scholar] [CrossRef]
  50. Boysen, C.; Kaldemeyer, C.; Hilpert, S.; Tuschy, I. Integration of Flow Temperatures in Unit Commitment Models of Future District Heating Systems. Energies 2019, 12, 1061. [Google Scholar] [CrossRef] [Green Version]
  51. Hart, W.E.; Laird, C.; Watson, J.P.; Woodruff, D.L. Pyomo—Optimization Modeling in Python; Springer Optimization and Its Applications; Springer: Boston, MA, USA, 2012; Volume 67. [Google Scholar] [CrossRef]
  52. Hilpert, S.; Kaldemeyer, C.; Krien, U.; Günther, S.; Wingenbach, C.; Plessmann, G. The Open Energy Modelling Framework (oemof)—A new approach to facilitate open science in energy system modelling. Energy Strategy Rev. 2018, 22, 16–25. [Google Scholar] [CrossRef] [Green Version]
  53. Töpler, J.; Lehmann, J. Wasserstoff und Brennstoffzelle; Springer: Berlin/Heidelberg, Germany, 2017. [Google Scholar] [CrossRef]
  54. Mollenhauer, E.; Christidis, A.; Tsatsaronis, G. Evaluation of an energy- and exergy-based generic modeling approach of combined heat and power plants. Int. J. Energy Environ. Eng. 2016, 7, 167–176. [Google Scholar] [CrossRef] [Green Version]
  55. Salgado, F.; Pedrero, P. Short-term operation planning on cogeneration systems: A survey. Electr. Power Syst. Res. 2008, 78, 835–848. [Google Scholar] [CrossRef]
  56. Kurzweil, P.; Dietlmeier, O.K. Elektrochemische Speicher; Springer Fachmedien: Wiesbaden, Germany, 2018. [Google Scholar] [CrossRef]
  57. Matthey, A.; Bünger, B. Methodenkonvention 3.0 zur Ermittlung von Umweltkosten: Kostensätze; Umweltbundesamt: Dessau-Rosslau, Germany, 2018. [Google Scholar]
  58. Gleißner, W. Grundlagen des Risikomanagements im Unternehmen: Controlling, Unternehmensstrategie und wertorientiertes Management; Management Competence, Vahlen: Munich, Germany, 2011. [Google Scholar] [CrossRef]
  59. Saltelli, A.; Tarantola, S.; Campolongo, F.; Ratto, M. Sensitivity Analysis in Practice: A Guide to Assessing Scientific Models, reprinted, ed.; Wiley: Chichester, UK; Weinheim, Germany, 2007. [Google Scholar] [CrossRef]
  60. Abdollahi, G.; Sayyaadi, H. Application of the multi-objective optimization and risk analysis for the sizing of a residential small-scale CCHP system. Energy Build. 2013, 60, 330–344. [Google Scholar] [CrossRef]
  61. Arnold, U.; Yildiz, Ö. Economic risk analysis of decentralized renewable energy infrastructures—A Monte Carlo Simulation approach. Renew. Energy 2015, 77, 227–239. [Google Scholar] [CrossRef]
  62. Ristimäki, M.; Säynäjoki, A.; Heinonen, J.; Junnila, S. Combining life cycle costing and life cycle assessment for an analysis of a new residential district energy system design. Energy 2013, 63, 168–179. [Google Scholar] [CrossRef]
  63. Urbanucci, L.; Testi, D. Optimal integrated sizing and operation of a CHP system with Monte Carlo risk analysis for long-term uncertainty in energy demands. Energy Convers. Manag. 2018, 157, 307–316. [Google Scholar] [CrossRef]
  64. Giannakoudis, G.; Papadopoulos, A.I.; Seferlis, P.; Voutetakis, S. Optimum design and operation under uncertainty of power systems using renewable energy sources and hydrogen storage. Int. J. Hydrogen Energy 2010, 35, 872–891. [Google Scholar] [CrossRef]
  65. Coppitters, D.; De Paepe, W.; Contino, F. Robust design optimization and stochastic performance analysis of a grid-connected photovoltaic system with battery storage and hydrogen storage. Energy 2020, 213, 118798. [Google Scholar] [CrossRef]
Figure 1. Time series of relevant emission intensities. All are constant except for electricity imports, which fluctuate due to the changing composition at the national level.
Sustainability 14 06050 g001
Figure 2. Scenario 1 with PV, battery, CHP, TES, and boiler. This is a common, distributed supply concept used by companies in Germany today and therefore serves as a reference.
Sustainability 14 06050 g002
Figure 3. Scenario 2 additionally with an ELY, HS, and FC (PtGtP). The aim is to investigate whether the addition of the PtGtP plant provides an advantage over scenario 1.
Sustainability 14 06050 g003
Figure 4. Procedure for determining the optimum sizes of the system. For this purpose, all possible system combinations are first simulated and then evaluated on the basis of the two objectives in order to be able to compare them holistically.
Sustainability 14 06050 g004
Figure 5. oemof.solph graph to simulate scenario 2, where buses are represented as ovals, sources and sinks as trapezoids, technologies as rectangles, and storage systems as cylinders. The nomenclature distinguishes between conversion technologies (t_), storages (s_), demands (d_), external markets (m_), and the necessary busses (b_). From this type of representation, it is thus easy to see the possibilities and directions of energy flows as well as the positioning of key sources, transformers, and sinks. Components to be optimally sized in the following are marked with a red outline.
Sustainability 14 06050 g005
Figure 6. Characteristic curves of the ELY (a) and FC (b) based on the manufacturers’ data sheets. For reasons of simplification, a linear behaviour between maximum and minimum load is assumed for the simulation, which is shown as dashed lines in the background.
Sustainability 14 06050 g006
Figure 7. Energy demand as load curve and load duration curve of the dairy in 2020.
Sustainability 14 06050 g007
Figure 8. Exemplary presentation of dispatch optimisation for a one week (Monday–Sunday) timeframe and an exemplary system setup (CHP 99 kWel, PV 40 kWp, TES 10 m3, battery 131 kWh, ELY 1 kWel, HS 1340 kWh, FC 5 kWel). Electricity consumption and production (top), heat consumption and production (middle) and the SOC of all storages (bottom) are shown.
Sustainability 14 06050 g008
Figure 9. Visualisation of the SOC as filling level in percent of the storage systems used during the investigated year for the system configuration used in Figure 8.
Sustainability 14 06050 g009
Figure 10. Illustration of the results of scenario 1 as a scatter diagram. It shows the Pareto front (red) between annuity and CO2 emission. The colour codes show the dependency on the technology size, and each technology has its own graph.
Sustainability 14 06050 g010
Figure 11. Illustration of the results of scenario 2 as a scatter diagram. It shows the Pareto front (red) between annuity and CO2 emission. The colour codes show the dependency on the technology size, and each technology has its own graph.
Sustainability 14 06050 g011
Figure 12. Sensitivity analysis of various system variables using the previously defined degrees of freedom.
Sustainability 14 06050 g012
Table 1. Discrete sizes used in optimisation of the technologies. These correspond to the actual products of selected manufacturers.
TechnologyPerformance Spectrum
Boiler/ kW th 500
CHP/ kW el 0, 50, 70, 99, 134, 190
PV/ kW p 0, 10, 20, 30, 40
TES/ m 3 0, 10, 30, 50
Battery/ kWh 0, 30, 70, 131, 233
ELY/ kW el 1, 3, 5
HS/ kWh 670, 1340
FC/ kW el 5, 8
Table 2. Price range of the technology paths in ct / kWh of the dairy as of January 2020. These are given as a price range, since in the course of the simulations, the prices change constantly depending on how, for example, the day-ahead price changes. The technologies on the left are listed as sources, and those on the top as sinks. Fields that are physically impossible are greyed out, and those that are unregulated are highlighted in white and marked with a minus. Connections that are technically possible but are disregarded for this study are marked with an X. Revenues are positive and expenditures negative.
SinkElec. gridBatteryPtGtPEl. cons.CHPBoilerTh. cons.
Source
Elec. grid X−21.43 to 3.97−23.48 to 1.92
PV10.06 to 10.2700−2.70
BatteryX X−2.70
PtGtP−10.49 to 13.01X −2.70 -
NG grid −5.95 to −4.59−5.95 to −4.59
CHP−9.83 to 21.01 0 to 4.00−2.70 to 1.30 0
Boiler 0
Table 3. Multi-criteria decision matrix of the two scenarios. Shown are the Pareto optimal system configurations sorted by ascending costs and descending emissions.
CHPPVTESBatteryELYHSFCAnnuityCO2 Emission
kW el kW p m 3 kWh kW el kWh kW el / a t / a
Scenario 19940500---−121,263312
13420500---−152,043283
134405030---−154,122272
19040500---−174,683239
Scenario 2994050016705−134,384312
9940500113405−138,463311
1343030016705−166,177286
1344030016705−166,628279
13440503016705−167,556271
1344050036705−170,751271
13440500113408−172,152271
1904050016705−188,228239
1904050036705−190,295235
1904050016708−192,218235
1904050056705−192,457235
19040500513408−196,565235
Publisher’s Note: MDPI stays neutral with regard to jurisdictional claims in published maps and institutional affiliations.

