Article

Decentral Production of Green Hydrogen for Energy Systems: An Economically and Environmentally Viable Solution for Surplus Self-Generated Energy in Manufacturing Companies?

Fraunhofer Institute for Casting, Composite and Processing Technology IGCV, Am Technologiezentrum 10, 86159 Augsburg, Germany
*
Authors to whom correspondence should be addressed.
Sustainability 2023, 15(4), 2994; https://doi.org/10.3390/su15042994
Submission received: 19 December 2022 / Revised: 31 January 2023 / Accepted: 2 February 2023 / Published: 7 February 2023
(This article belongs to the Special Issue Hydrogen Energy Systems for Energy Storage Applications)

Abstract

:
Power-to-X processes where renewable energy is converted into storable liquids or gases are considered to be one of the key approaches for decarbonizing energy systems and compensating for the volatility involved in generating electricity from renewable sources. In this context, the production of “green” hydrogen and hydrogen-based derivatives is being discussed and tested as a possible solution for the energy-intensive industry sector in particular. Given the sharp, ongoing increases in electricity and gas prices and the need for sustainable energy supplies in production systems, non-energy-intensive companies should also be taken into account when considering possible utilization paths for hydrogen. This work focuses on the following three utilization paths: “hydrogen as an energy storage system that can be reconverted into electricity”, “hydrogen mobility” for company vehicles and “direct hydrogen use”. These three paths are developed, modeled, simulated, and subsequently evaluated in terms of economic and environmental viability. Different photovoltaic system configurations are set up for the tests with nominal power ratings ranging from 300 kWp to 1000 kWp. Each system is assigned an electrolyzer with a power output ranging between 200 kW and 700 kW and a fuel cell with a power output ranging between 5 kW and 75 kW. There are also additional variations in relation to the battery storage systems within these basic configurations. Furthermore, a reference variant without battery storage and hydrogen technologies is simulated for each photovoltaic system size. This means that there are ultimately 16 variants to be simulated for each utilization path. The results show that these utilization paths already constitute a reasonable alternative to fossil fuels in terms of costs in variants with a suitable energy system design. For the “hydrogen as an energy storage system” path, electricity production costs of between 43 and 79 ct/kWh can be achieved with the 750 kWp photovoltaic system. The “hydrogen mobility” is associated with costs of 12 to 15 ct/km, while the “direct hydrogen use” path resulted in costs of 8.2 €/kg. Environmental benefits are achieved in all three paths by replacing the German electricity mix with renewable energy sources produced on site or by substituting hydrogen for fossil fuels. The results confirm that using hydrogen as a storage medium in manufacturing companies could be economically and environmentally viable. These results also form the basis for further studies, e.g., on detailed operating strategies for hydrogen technologies in scenarios involving a combination of multiple utilization paths. The work also presents the simulation-based method developed in this project, which can be transferred to comparable applications in further studies.

Graphical Abstract

1. Introduction and Motivation

Manufacturing companies in Germany face major challenges in the area of energy supply. One of these challenges relates to the significant increase in energy prices for industrial companies in recent years. The average electricity price for new industry contracts has risen from 8.98 ct per kWh in 2012 to 54.90 ct/kWh in the second half of 2022 [1]. Gas procurement prices reached 4 ct per kWh in 2021, which is almost twice the price of previous years [2] for the majority of companies. This price has increased further in the wake of political developments in 2022 [3]. Another major challenge faced by companies is their efforts to make a significant contribution to achieving climate targets. The industrial sector has to reduce greenhouse gas emissions to 118 Mt CO2-eq by 2030, starting from 186 Mt CO2-eq. in 2020. This represents 20 percent of Germany’s reduction goal of 375 Mt CO2-eq. for all sectors in this period [4]. Along with solutions such as electrification, the use of “green” hydrogen represents an important means of tackling the challenges of energy price increases and decarbonization targets. In this context, hydrogen is considered “green” if it is produced via electrolysis using renewable electricity and, consequently, with low CO2 emissions [5].
Germany currently produces and uses around 19 billion Nm³, i.e., around 60 TWh, of hydrogen annually. For the most part, this hydrogen is used by the chemical and refinery industries, especially in the production of ammonia and methanol. The hydrogen required for this is mainly produced via steam reforming, which results in high specific CO2 emissions. To decarbonize the industry sector, such processes will have to switch to “green hydrogen”, i.e., hydrogen produced through processes with low CO2 emissions, such as electrolysis using renewable electricity. Recent studies have shown that the demand for hydrogen in Germany will increase to between 90 and 110 TWh by 2030. To facilitate this, electrolysis capacities of up to 5 GW must be built up, with a focus on use in the industry and transportation sectors [6].
The term “power-to-X” is frequently used in scientific papers, technological reports and studies in this context. It is defined as “the conversion and storage of electrical energy into an energy carrier (gas, fuel or raw material) or a product (basic material, feedstock)” [7]. As an important form of power-to-X technology, the production of hydrogen and hydrogen-based variants forms the core of numerous international energy transition roadmaps, such as the “Technology Roadmap: Hydrogen and Fuel Cells” produced by the International Energy Agency [8] or the “Hydrogen Roadmap for Germany” developed by the Fraunhofer Institutes ISI and ISE [9]. Consequently, it is an important component of visions for future energy systems that use renewable sources only [10]. In 2020, the Federal Republic of Germany presented its National Hydrogen Strategy. This strategy highlights the importance of green hydrogen as a raw material in sectors such as the chemical and steel industries and as a versatile energy carrier for hydrogen-based mobility, as a fuel, and for long-term storage in fuel cell applications [11]. It is plain that plans are in place to use hydrogen to help achieve decarbonization goals.
While hydrogen is frequently used as a material, e.g., in the chemical industry, the use of green hydrogen as an energy carrier in non-energy-intensive industry companies has yet to be investigated in depth. According to a study by the Association of German Chambers of Industry and Commerce, more than half of German companies have a renewable self-generation system, e.g., a photovoltaic system, or are planning to set one up in the near future [12]. On-site electrolyzers that run on the renewable energy a company generates itself could help manufacturing businesses save on energy costs and reduce CO2 emissions. These arrangements also give companies a tool for managing fluctuating weather-dependent feed-in processes and enable them to become even more self-sufficient by converting the electricity they generate into hydrogen. This may result in reduced electricity purchasing due to reverse power generation and reduced gas purchasing, as natural gas can be replaced with hydrogen where technical limitations allow. It also increases companies’ resilience to uncertainties regarding future market and technology developments. This is because the companies can store the hydrogen on a medium- and long-term basis and use it as a process gas or an energy carrier, for example, for reconversion in fuel cells. It could also serve as fuel for hydrogen-powered vehicles or the site’s thermal energy supply.
However, there are some obstacles that could hinder decentralized hydrogen production. From the company’s point of view, it is necessary to examine to what extent the electrolyzers can be supplied with energy generated on site and how the amortization of the investment will be offset by the profitability of possible applications. The correct dimensioning of the plants, e.g., regarding the electrolyzer, fuel cell, and hydrogen storage, is vital for economic efficiency and subject to complex interrelations with the existing system during design. For companies that do not yet use hydrogen as a material at their sites, the gas must be newly introduced as an energy carrier. This results in significant interactions with the existing energy system, for example, through the use of battery storage. The decision to invest in such systems must take into account the long time periods involved and the uncertainties associated with the price developments for electricity, gas, and the relevant technologies.
Hydrogen’s economic and environmental potential as a means of energy storage for production companies was investigated in the project “H2StorFa—Decentral use of hydrogen as energy storage in factory sites”, which was funded by the Bavarian Research Foundation. The project team explored possible options for producing hydrogen via a decentralized model, as well as different paths for using it in energy systems. For this purpose, real energy data from two manufacturing companies was used for simulation studies. The results were then evaluated from an economic and environmental point of view. The project started in September 2021 and ran for six months. It focused on the following hydrogen utilization paths: “hydrogen as an energy storage system that can be reconverted into electricity”, “hydrogen mobility” for company vehicles, and “direct hydrogen use” for technical applications at manufacturing companies [13].
This article presents the approach taken in this project and its results, starting with the current technological state of the art in Section 2. Section 3 then explains both the scientific principles underlying the research conducted in the project and the overall method, while the modeling and simulations are presented in Section 4. The results of the simulation studies and the economic and environmental evaluation are introduced and discussed in Section 5. Section 6 presents the conclusions drawn from the project and prospects for further research. The results described in the article are important for the assessment of hydrogen production and its utilization in the energy systems of manufacturing companies. The method presented for designing industrial energy systems represents a novel approach due to its specific focus on hydrogen technologies and its detailed consideration and comparison of the costs and greenhouse gas emissions incurred.

2. State of the Art

As mentioned in the introduction, investment decisions involve long timeframes and are subject to complex and interrelated factors. As such, simulating possible variants of a site’s energy supply system with different technology dimensions is a useful decision-making tool. The simulation results must be evaluated from an economic and environmental perspective in order to meet the requirements for reducing costs and greenhouse gas emissions. Consequently, this section will address contemporary approaches for simulating energy supply systems in manufacturing companies and and examine them in terms of suitability (Section 2.1). This will be followed by a review of currently available studies on the production of hydrogen and its use in energy systems, with a focus on decentralized approaches in the industry sector (Section 2.2). The aim of this section is thus to determine the current state of the art regarding simulation methods and to analyze use cases in the industry sector with a view to identifying areas where action is required (Section 2.3) for the present work.

2.1. Designing Industrial Energy Supply Systems

Simulations can be used to analyze design and operation variants for possible energy supply systems in different scenarios. There is a wide range of available software solutions for simulating energy systems. However, when using them, it is necessary to apply a methodical approach that has been specifically developed for the problem in question. Consequently, in the following, existing methods are examined and assessed with regard to their suitability for hydrogen-based energy supply systems in manufacturing companies and for conducting a subsequent economic and environmental evaluation.
Ringkjøb et al. [14] present a review of tools for modeling energy and electricity systems, together with an assessment of their general principles, spatiotemporal resolution, and technological and economic features. In this study, hydrogen is explicitly mentioned as a possible energy storage medium, and some of the tools analyzed have the technical feature that is needed to model the necessary components. In addition to tools, there are also approaches for modeling and optimizing energy systems. DeCarolis et al. [15] present a best practice approach based on a literature review and collective experience. This study outlines critical steps in the modeling process and provides suggestions for formulating research questions, spatiotemporal boundaries, conducting the analysis, etc. However, rather than company energy systems, it focuses on large-scale public supply grids. The integration of hydrogen into energy systems has already been considered in publications such as those by Gou et al. [16] and Fu et al. [17]. However, in the former, hydrogen is only used as a storage technology when there is surplus wind energy. The hydrogen generated in these cases is then used as fuel outside of the system boundaries. The work of Fu et al. describes an energy system model that integrates electricity, heat, transportation, and hydrogen and examines the impact of various hydrogen production technologies on multi-energy systems. The model developed in this work is used to optimize decarbonization strategies for the whole energy system. However, the study only considers the greenhouse gases directly emitted during energy production for the technologies. It does not take into account the indirect emissions that occur during plant construction or energy transmission, although these can have a major impact on overall greenhouse potential.
In their study, Ince et al. present a review of the modeling and simulation of power-to-X systems. The authors do mention industrial use cases, but their focus is on energy-intensive industries, such as the cement and chemical sectors [18]. Imdahl et al. [19] developed a method for modeling energy system behavior, which can be used to assess the technical feasibility, costs, and economic impact of investments in hydrogen technology for factories. As such, this approach is primarily suited to calculating performance metrics for comparing system variants.
Schulz et al. [20] present key technologies for on-site power generation at manufacturing companies. They also describe an approach for modeling and dimensioning the technologies. This approach is based on a hybrid optimization methodology aimed at minimizing the total cost of supplying the required energy. Other important indicators for evaluating system designs include the power generation technologies’ self-consumption and self-covering rates. However, the approach does not account for the specific requirements of hydrogen technologies and utilization and the study does not include a detailed evaluation of the impact the designed energy systems would have on greenhouse gas emissions.
Kuhlmann & Bauernhansl [21] present a method for designing energy systems for manufacturing companies, which must be applied during the early stages of factory planning. It is based on a system dynamics approach, which makes it possible to account for interactions with the volatile energy market and external disruptions. In this method, individual machines are turned into system objects and connected to energy pools that enable energy exchanges between system objects. The system dynamics model created in this way is suitable for simulating the impact of energy-related measures. A multi-criteria system describes the energy system behavior in terms of parameters relating to layout, energy, and cost, for example. This method was developed for energy flows in general and does not explicitly address hydrogen technologies. The ecological and environmental evaluation of the system variants is implied but not explained in the procedure. Kuhlmann [22] does present a method for designing changeable energy systems for factories; however, hydrogen technologies and environmental assessment are not the subject of that paper.
Thiede et al. [23] introduce a model for simulating energy flows in manufacturing systems. The model can be broken down into a process module, a production planning and control (PPC) module, and technical building services (TBS) modules. The process module and PPC module represent actual production machines, processes, and the configuration of capacity planning and machine assignment. Meanwhile, the TBS modules can be used to represent facilities such as compressed air, room heating, and cooling water. These TBS modules do not explicitly address the specific requirements of hydrogen components and how they interact with other systems.
In a recent publication, Schmeling et al. [24] present an approach for sizing and operating the equipment for a hydrogen-based electricity storage system. A brute-force optimal design approach is used in combination with energy simulation software to determine the system size. The evaluation is based on the costs and CO2 emissions incurred by the system. This method comes close to the need addressed in the present work, but it focuses exclusively on power-to-gas-to-power (PtGtP) applications with electrolyzers and fuel cells. It does not address other possible applications for manufacturers, such as mobility and fuel substitution.
In summary, simulation tools with the technical features required for mapping hydrogen technologies are available and there are multiple simulation methods that can be used to design and evaluate energy systems. Specific approaches for manufacturing companies have also been developed, thus laying a good foundation for the work conducted in this study. However, the approaches are often designed for general energy flows and do not specifically take hydrogen technologies into account, or not in sufficient depth. Usually, a single hydrogen application is considered, such as PtGtP. As such, research is required to develop a higher-level simulation-based approach that maps different technology variants, together with their respective operating strategies, price scenarios, and other external factors. In light of the challenges for companies mentioned in Section 1, the method must also include a subsequent evaluation of costs and CO2 emissions and make it possible to calculate and evaluate different hydrogen applications.

2.2. Investigation of Hydrogen Applications

To further expand the use of green hydrogen and hydrogen technologies in Germany, the German Federal Ministry of Digital Affairs and Transport (BMDV) launched the “HyLand” initiative in 2019. Its aim is to establish a transnational hydrogen economy in Germany [25]. Many region-specific initiatives have been launched as a consequence, such as “Energy Region Staßfurt 2020” [26] and “Energy Region East Harz” [27]. These focus on establishing energy supply systems based on renewable sources and integrating various sectors into a single regional energy scheme.
In addition to regional projects, the initiative has also given rise to projects on using hydrogen as an energy carrier to supply electricity and heat to residential buildings. Examples include the project “Living Laboratory—Living H2” [28] and the study by Khalid et al. [29]. The projects aim to use hydrogen as a seasonal energy storage by employing technologies such as electrolyzers, hydrogen storage, and fuel cells in combination with photovoltaic and lithium-ion (li-ion) battery storage systems. Meanwhile, “HYPOS LocalHy” is focused on the use of hydrogen in decentralized urban energy systems [30]. The project team also developed and evaluated a hydrogen electrolysis test plant. The fields of application are wide-ranging and include hydrogen mobility, reconverting hydrogen to electricity, and making use of the oxygen that is generated as a by-product of electrolysis. Bhandari & Shah [31] analyze the possibility of using decentrally produced hydrogen as an energy carrier for the German city of Cologne. They conclude that proton exchange membrane (PEM) electrolyzers have very high potential when it comes to competing with conventional hydrogen production. Their methodology is based on a simple model for designing systems and calculating the levelized cost of hydrogen (LCOH) by adjusting input parameters for each location in the world. The methodical approach to designing a system for producing, storing, and using hydrogen is not tailored to the specific requirements of manufacturing companies. The cost evaluation can therefore only be transferred to a limited extent. The study did not include an environmental calculation and evaluation.
In the context of industry applications for green hydrogen, researchers are focusing mainly on the possibility of using hydrogen as a material to decarbonize energy-intensive industrial sectors. In a review of hydrogen production pathways and associated technologies, Dawood et al. [32] list a number of papers on sectors such as fertilizer production, petrochemical refining, metal work, and food processing. Meanwhile, Griffiths et al. [33] present a review of hydrogen-based industrial decarbonization. They conclude that green hydrogen is one of the few options available for decarbonizing many industry sectors, especially those working with chemical conversions. Qazi [34] also addresses several energy-intensive industries in a review of the challenges and opportunities associated with future hydrogen applications. However, this review does not explicitly examine the manufacturing sector in depth.
Imdahl et al. [19] give an overview of hydrogen applications as energy carriers in factories, together with a rough estimation of their environmental potential and technical feasibility. For this purpose, they developed a method for modeling and evaluating factory systems and applied it in a case study. They evaluated a use case from the electronics industry, whereby hydrogen served as a source for decentralized power and heat generation. Other applications are also outlined in this study, but not considered in depth.
Roth et al. [35] investigate the environmental and economic potential of replacing natural gas with hydrogen, biomethane, and synthetic methane in an industrial heat treatment system at a massive forming company. Although the production and use of hydrogen at the site is taken into account, the researchers only performed a static balancing of energy flows. The study does not consider any other applications beyond using hydrogen as a substitute for natural gas. Meanwhile, Schmeling et al. [24] apply their method for designing and operating PtGtP systems to a dairy in Germany; the results are not yet profitable, but they are promising. It is necessary to analyze the use of electrolyzers and fuel cells in other manufacturing company use cases and investigate other hydrogen applications apart from PtGtP.
In summary, various studies have been conducted on the use of hydrogen as an energy carrier in a regional context or for residential buildings. Projects relating to the industry sector mainly focus on the possibility of using hydrogen as a material in energy-intensive branches. A number of studies analyze a single utilization path for hydrogen on the basis of an industrial use case. These studies cannot be transferred completely to the question at hand. In contrast to regions, residential applications, and the energy-intensive industry sector, manufacturing companies have their own characteristics that require specific consideration. These include, for example, their consumption load profiles, which are based on the shift model and are less continuous than in the energy-intensive industry sector. Furthermore, manufacturing companies can sometimes generate more energy than they consume at their sites, because the installed capacity of their on-site generation facilities is quite high and their consumption loads are relatively small. As such, they require specific medium- and long-term storage solutions. This means there is a need to study how the production and storage of hydrogen and different hydrogen utilization paths could fit into future energy systems for manufacturing companies.

2.3. Need for Research

The state of research in the field of industrial energy supply systems can be described as advanced. This is because costs are creating a high level of demand for optimization in regard to technology sizing and operations. As described in Section 1, new challenges are currently arising due to ongoing energy price increases and the simultaneously growing need to decarbonize the energy supply. In this context, power-to-X approaches involving the production of green hydrogen and its use in the energy system are the focus of much attention, especially in regional energy systems and the energy-intensive industry sector. A research gap has been identified in terms of the potential that these approaches hold for manufacturing companies, with their specific constraints and opportunities. In summary, this gives rise to two areas where action is needed:
  • A specific method has to be developed to model, simulate, and conduct economic and environmental evaluations of different energy supply system variants with hydrogen production and utilization at manufacturing companies.
  • This method should be applied to relevant use cases based on representative company data in order to determine whether hydrogen production and utilization offers transferable economic and environmental potential for manufacturing companies.
The following section explains the underlying scientific principles, which were applied based on the research goal. It also gives an overview of the simulation-based method developed in this work.

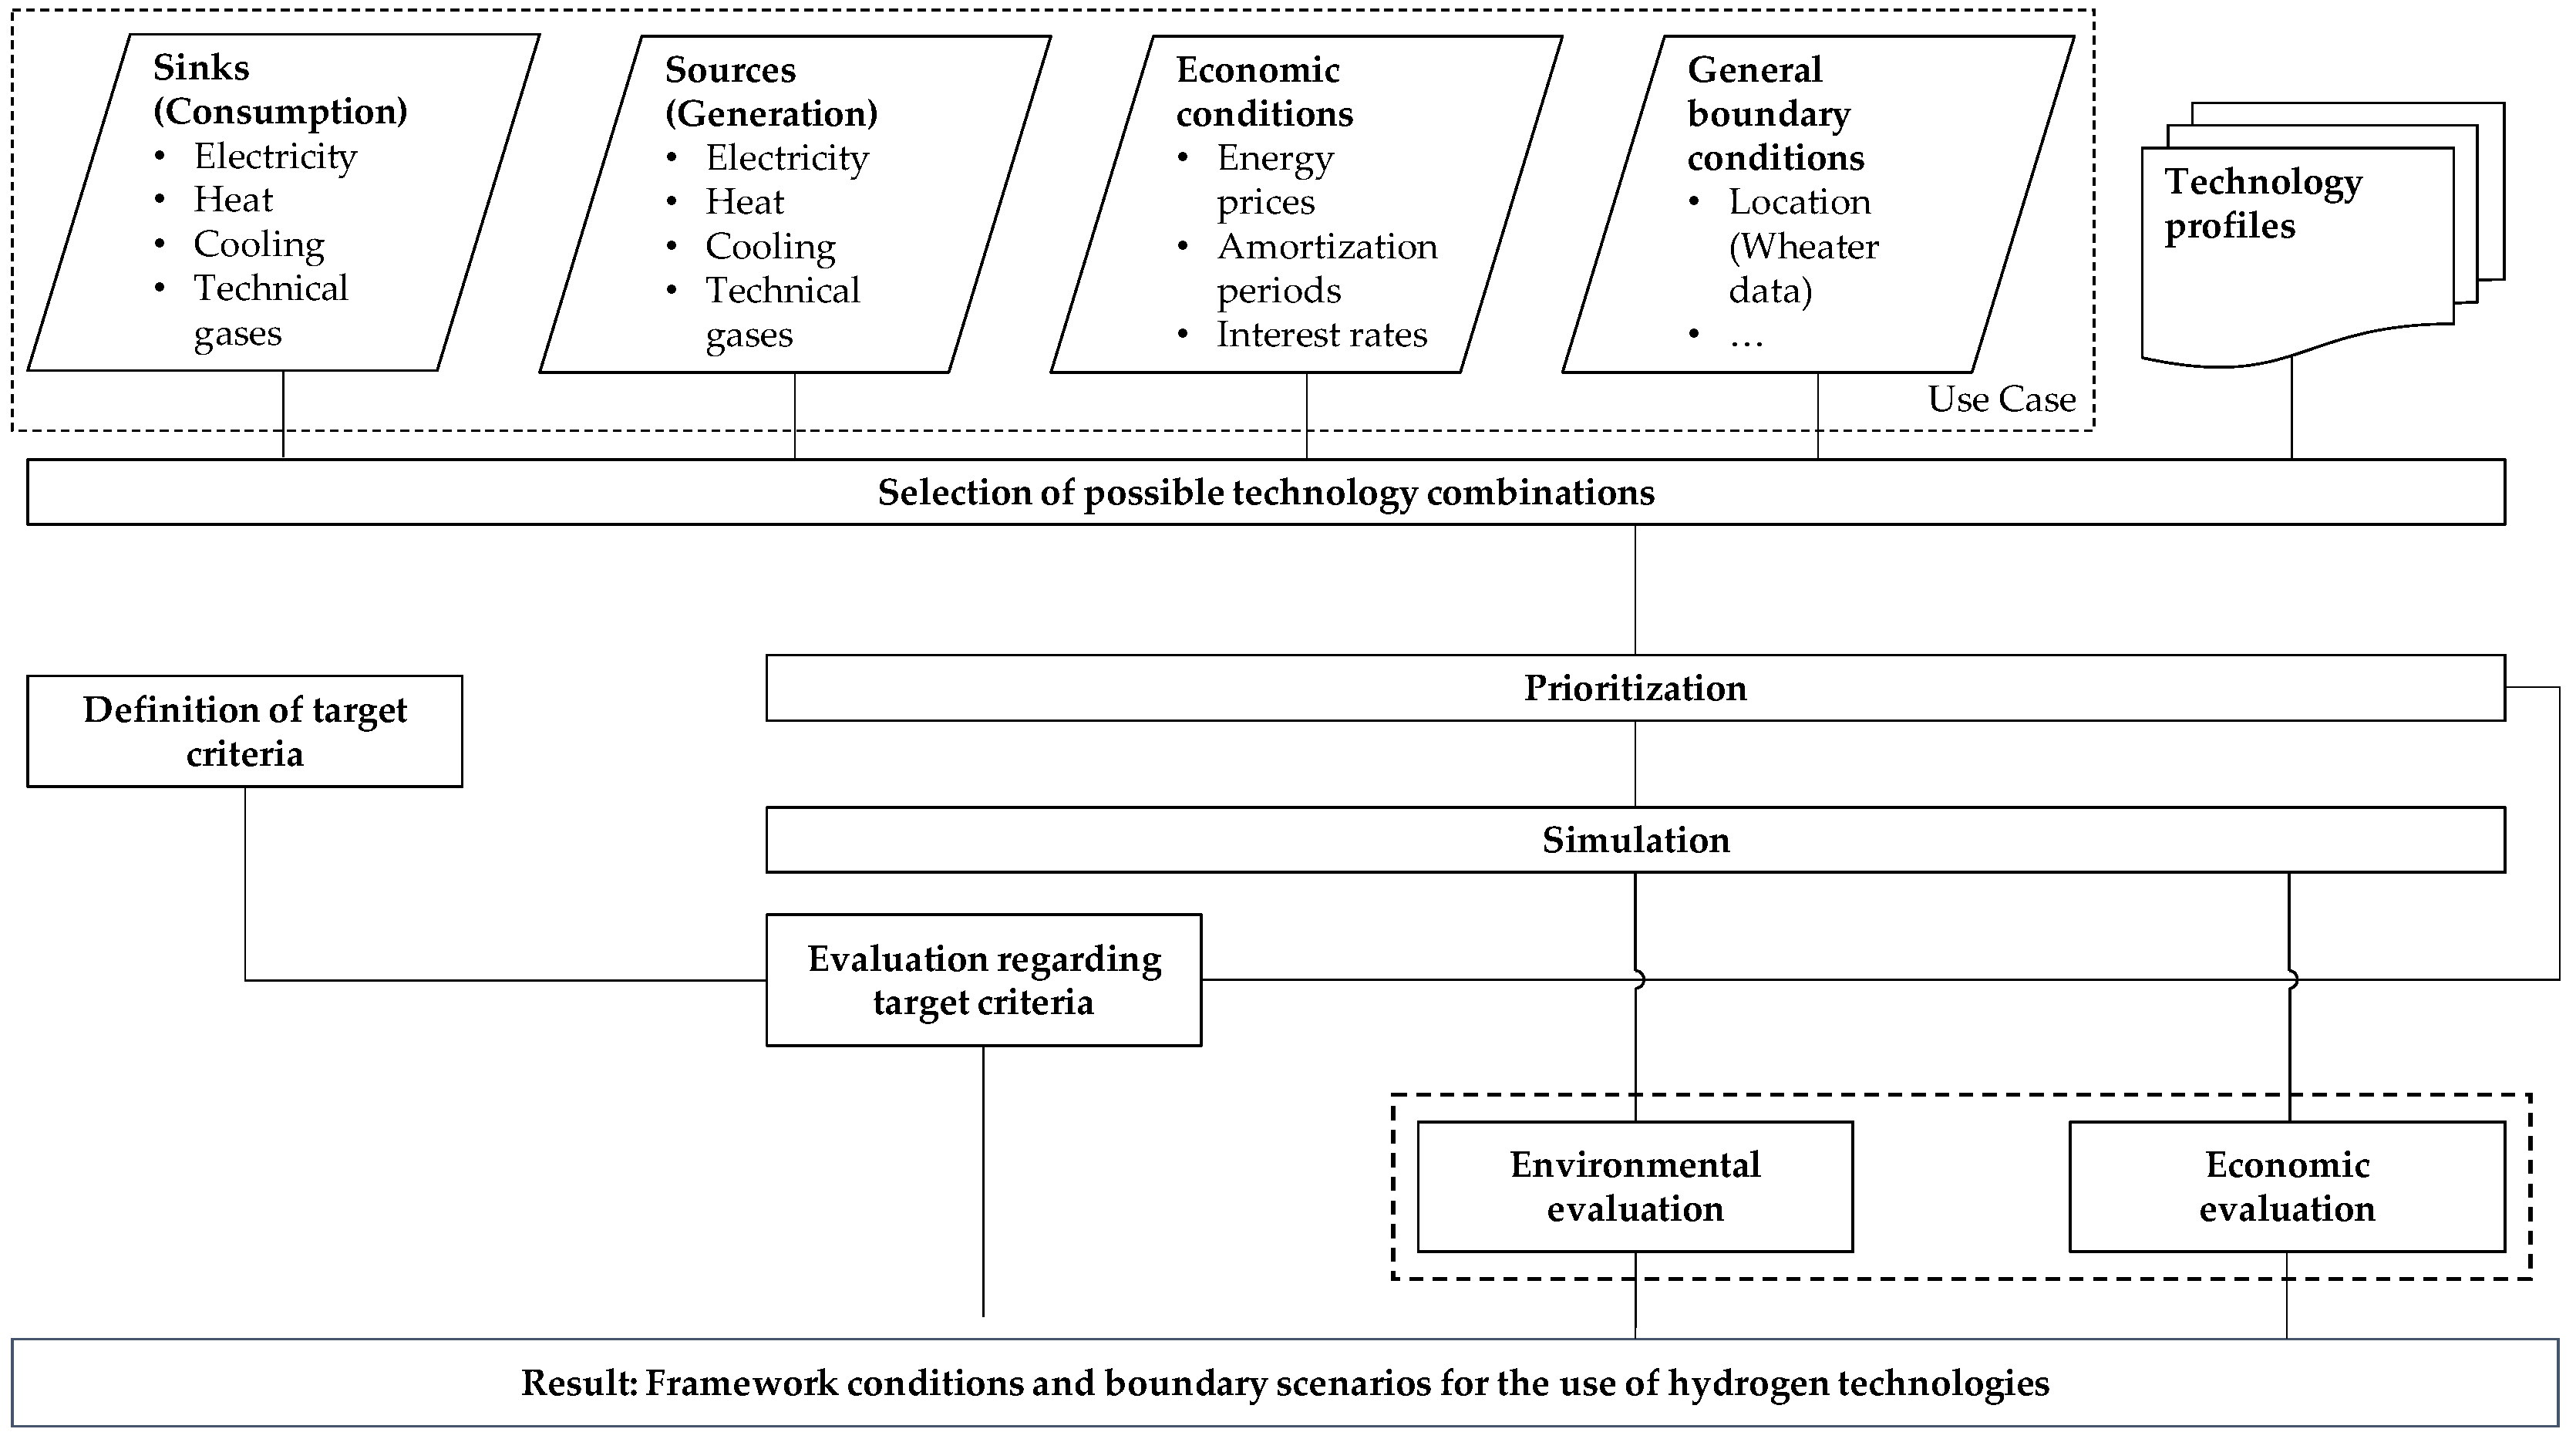
3. Scientific Approach and Simulation-Based Method

The aim of this work is to develop a method for designing energy supply models for industrial production sites and to apply these models in order to evaluate potential hydrogen production routes and applications. The scope for this method must include system component selection and dimensioning based on use cases. In addition, this study will determine the key figures and associated metrics for evaluating these models and consider suitable applications for them.
For the development of a suitable method, an inductive approach was chosen. Here, “inductive” is to be understood in the sense of “leading from individual to general” [36]. In the context of this paper, the choice of an inductive approach means that a more general method is formulated based on the process followed and results generated when resolving problems from use cases. To provide a suitable starting point for this approach, a simulated use case was created by combining real technology and energy data from two participating manufacturers. This strategy was chosen so that the method developed would be as generally applicable as possible. By contrast, developing a method using one specific use case would have restricted the potential value of the results. A plant manufacturer and an injection molding parts manufacturer provided the input data for energy supply technologies, energy consumption, energy generation, and general economic and operating conditions.
This information served as a basis for creating models for simulating the dynamic behavior of industrial energy supply systems. The models were then used to examine multiple configuration variants for energy system component dimensioning along three hydrogen utilization paths. The hydrogen technology components in the modeled energy systems were sized in an iterative process. This involved optimizing the self-consumption rate of the system for numerous different peak photovoltaic power values. These starting values were determined through research and expert interviews with companies involved in the project. These companies included manufacturers and suppliers of fuel cells, electrolyzers, and hydrogen storage systems, as well as filling station operators. Finally, the energy simulation results for the models were evaluated in terms of economic and environmental performance.
The steps involved in achieving these results can be summarized in a generally applicable method for designing industrial energy supply models that include hydrogen technologies. An overview of this method is given in Figure 1. It can be used with any energy system simulation tool that has similar functionalities to the one presented in this paper.
This method includes the following main steps:
  • Collection of input data from the use case, e.g., energy and media consumption, on-site energy generation, general and economic boundary conditions
  • Definition of relevant energy and media supply technologies
  • Definition of target criteria for dimensioning the technology model
  • Definition and selection of technology combinations
  • Simulation and dimensioning of components
  • Evaluation
In Steps 1 and 2, both sinks and sources include electricity, heat, cooling, and technical gases. This structure has been applied in order to guarantee a high level of general applicability, even in specialized use cases. It also allows the user to take process by-products into account. For example, the conversion of nitrogen from a liquid to a gas, which frequently occurs in industrial nitrogen applications, requires enthalpy intake and may therefore provide process cooling energy.

4. Modeling and Simulation

The following sections contain definitions and explanations of general conditions such as system boundaries and the assumptions that had to be made in the modeling and simulation processes. According to the expert interviews, the highest-priority goal in the use of hydrogen technologies is increasing self-consumption rates through long-term storage and electricity reconversion. This key indicator was selected over other metrics, such as energy self-sufficiency. The self-consumption rate refers to the ratio of self-generated energy that is actually consumed energy to the total amount of self-generated energy. In the simulations, a target value of 100% was set for self-consumption rates. The system boundaries were defined on the basis of energy flows from the production systems examined within the study. Only on-site energy supply systems were modeled and subsequently simulated. The production system receiving this supply was modeled as a black box using the electrical consumption load profile only.

4.1. Utilisation Paths

Hydrogen can be used as an energy carrier in many different sectors; for example, mobility, heating, or power generation. After discussions with various industrial companies, the following paths were identified as relevant for this work:
  • Hydrogen as an energy storage medium for electricity
  • Hydrogen production via electrolysis using electricity from photovoltaic (PV) systems
  • Hydrogen storage in pressurized storage tanks
  • Hydrogen utilization for power generation in fuel cells to cover phases of low PV power generation
2.
Hydrogen mobility
  • Hydrogen production via electrolysis using electricity from photovoltaic (PV) systems
  • Hydrogen compression to 400 bar
  • Use of compressed hydrogen for mobility applications in passenger cars, trucks, and intralogistics vehicles (e.g., industrial trucks)
  • Calculation of mileage range that can be covered by hydrogen fuel
3.
Direct use of hydrogen, e.g., as process gas or fuel substitute
  • Hydrogen production via electrolysis using electricity from photovoltaic (PV) systems
  • No compression or storage
  • Direct use of hydrogen as a material in processes or for blending with natural gas in thermal energy production, e.g., for building heating or heat treatment processes

4.2. Simulation Models

In general, simulations allow the use of time series for consumer load profiles and input variables from the generation side. This makes it possible to represent dynamic system behavior. Simulations also allow for the specification of control-related boundary conditions such as priority rules and switch-on sequences. Automated optimization functions also support optimal component dimensioning [37].
The simulation environment chosen for this project was TOP-Energy® (Version 3.0.1.07) [37], an energy system simulation software. TOP-Energy® includes all relevant energy supply system components for factory site applications and technologies for hydrogen production and storage and hydrogen-based power generation. In general, energy system simulations offer two primary advantages: they can conduct efficient (partially) automated calculations of complex energy relationships and they can automatically account for all relevant interactions between system components. Software-based simulations also offer the possibility of performing scenario analyses with relatively little effort. By contrast, allowing for different parameter variations in manual computation would lead to high levels of computational effort. Complex calculations can be automated using simulation tools, such as the discrete-time calculation of PV power generation based on real weather data in the form of time series.
To facilitate analysis and simulation, models were built for the three utilization paths mentioned above. For utilization path 1 (hydrogen energy storage), the hydrogen technologies (electrolyzer for hydrogen production, pressurized tank for hydrogen storage, and fuel cell for reconverting hydrogen to electricity) were modeled as shown in Figure 2. The simulation software includes functions that allow users to achieve a complete energy balance for the system, while taking into account discrete-time representations of power, mass flows, and operating states.
A second shared model was built for utilization paths 2 and 3 (hydrogen mobility and direct hydrogen utilization). The only hydrogen technology involved in this case was the electrolyzer (for hydrogen production). The model did not include system components for long-term hydrogen storage and reconversion. In some utilization path simulations, the hydrogen must be compressed after electrolysis. In the mobility use case, this compression is set to 400 bar. The simulation for the direct hydrogen use path (as a raw material or blended with natural gas) did not include a compression step. In all three utilization paths or models, the usable waste heat generated in the hydrogen process chain was quantified via heat demand modules. It was then made available for subsequent evaluations concerning the monetary or ecological advantages of waste heat utilization.

4.3. Simulation Scenarios

Once the simulation models had been created based on the defined technology combinations, a procedure for dimensioning the model components was defined. This procedure made it possible to analyze different component power rating variants within the utilization paths. The dimensioning variants were defined based on the dimensions of the connected PV system and the battery storage capacities, which are linked to PV system size on the basis of given factors. The following peak PV outputs were specified for that parameter (as shown in Table 1): 300, 500, 750, and 1000 kWp. According to the technology and energy system experts involved in the projects, these values represent the usual range for manufacturing companies.
The value of 750 kWp was chosen due to the regulations of the German Renewable Energy Sources Act (Erneuerbare-Energien-Gesetz, EEG) of 2021 [38]. In this law, 750 kWp is defined as the maximum PV plant size that can be installed without incurring an obligation to participate in tendering procedures for generating PV electricity. For the dimensioning of the battery storage, technological experts recommended using the factors 0, 0.5, and 1 as the ratios between peak PV power (in kW) and battery storage capacity (in kWh). As such, a factor of 0 corresponds to a variant without battery storage. Electrolysis and fuel cell capacities underwent further variations within these basic configurations. In addition, a reference variant without battery storage and hydrogen technologies was simulated for each PV system size. This resulted in 16 variants to be simulated for each utilization path. The study did not include a reference variant with battery storage due to the characteristics of the simulated use case formulated by the application partners. The electrolyzer and fuel cell components were dimensioned with a view to maximize self-consumption rates. The plants were always dimensioned in such a way that self-consumption rates of nearly 100% were achieved. The degree of self-sufficiency and the investment costs were also included in sizing considerations. The decision to base the system dimensioning on maximum self-consumption rates resulted from the requirements expressed by the project’s application partners. Because of this specification, the nominal power ratings of the system components vary as shown in Table 1. An electrolysis efficiency rate of 74% and nominal electrical and thermal efficiency rates of 50% each for the fuel cells were set as fixed values.
Based on these nominal outputs, additional variants were created for all of the simulations using the specified factors for battery storage size. For a PV system with a peak power of 750 kWp, for example, this resulted in the following configurations:
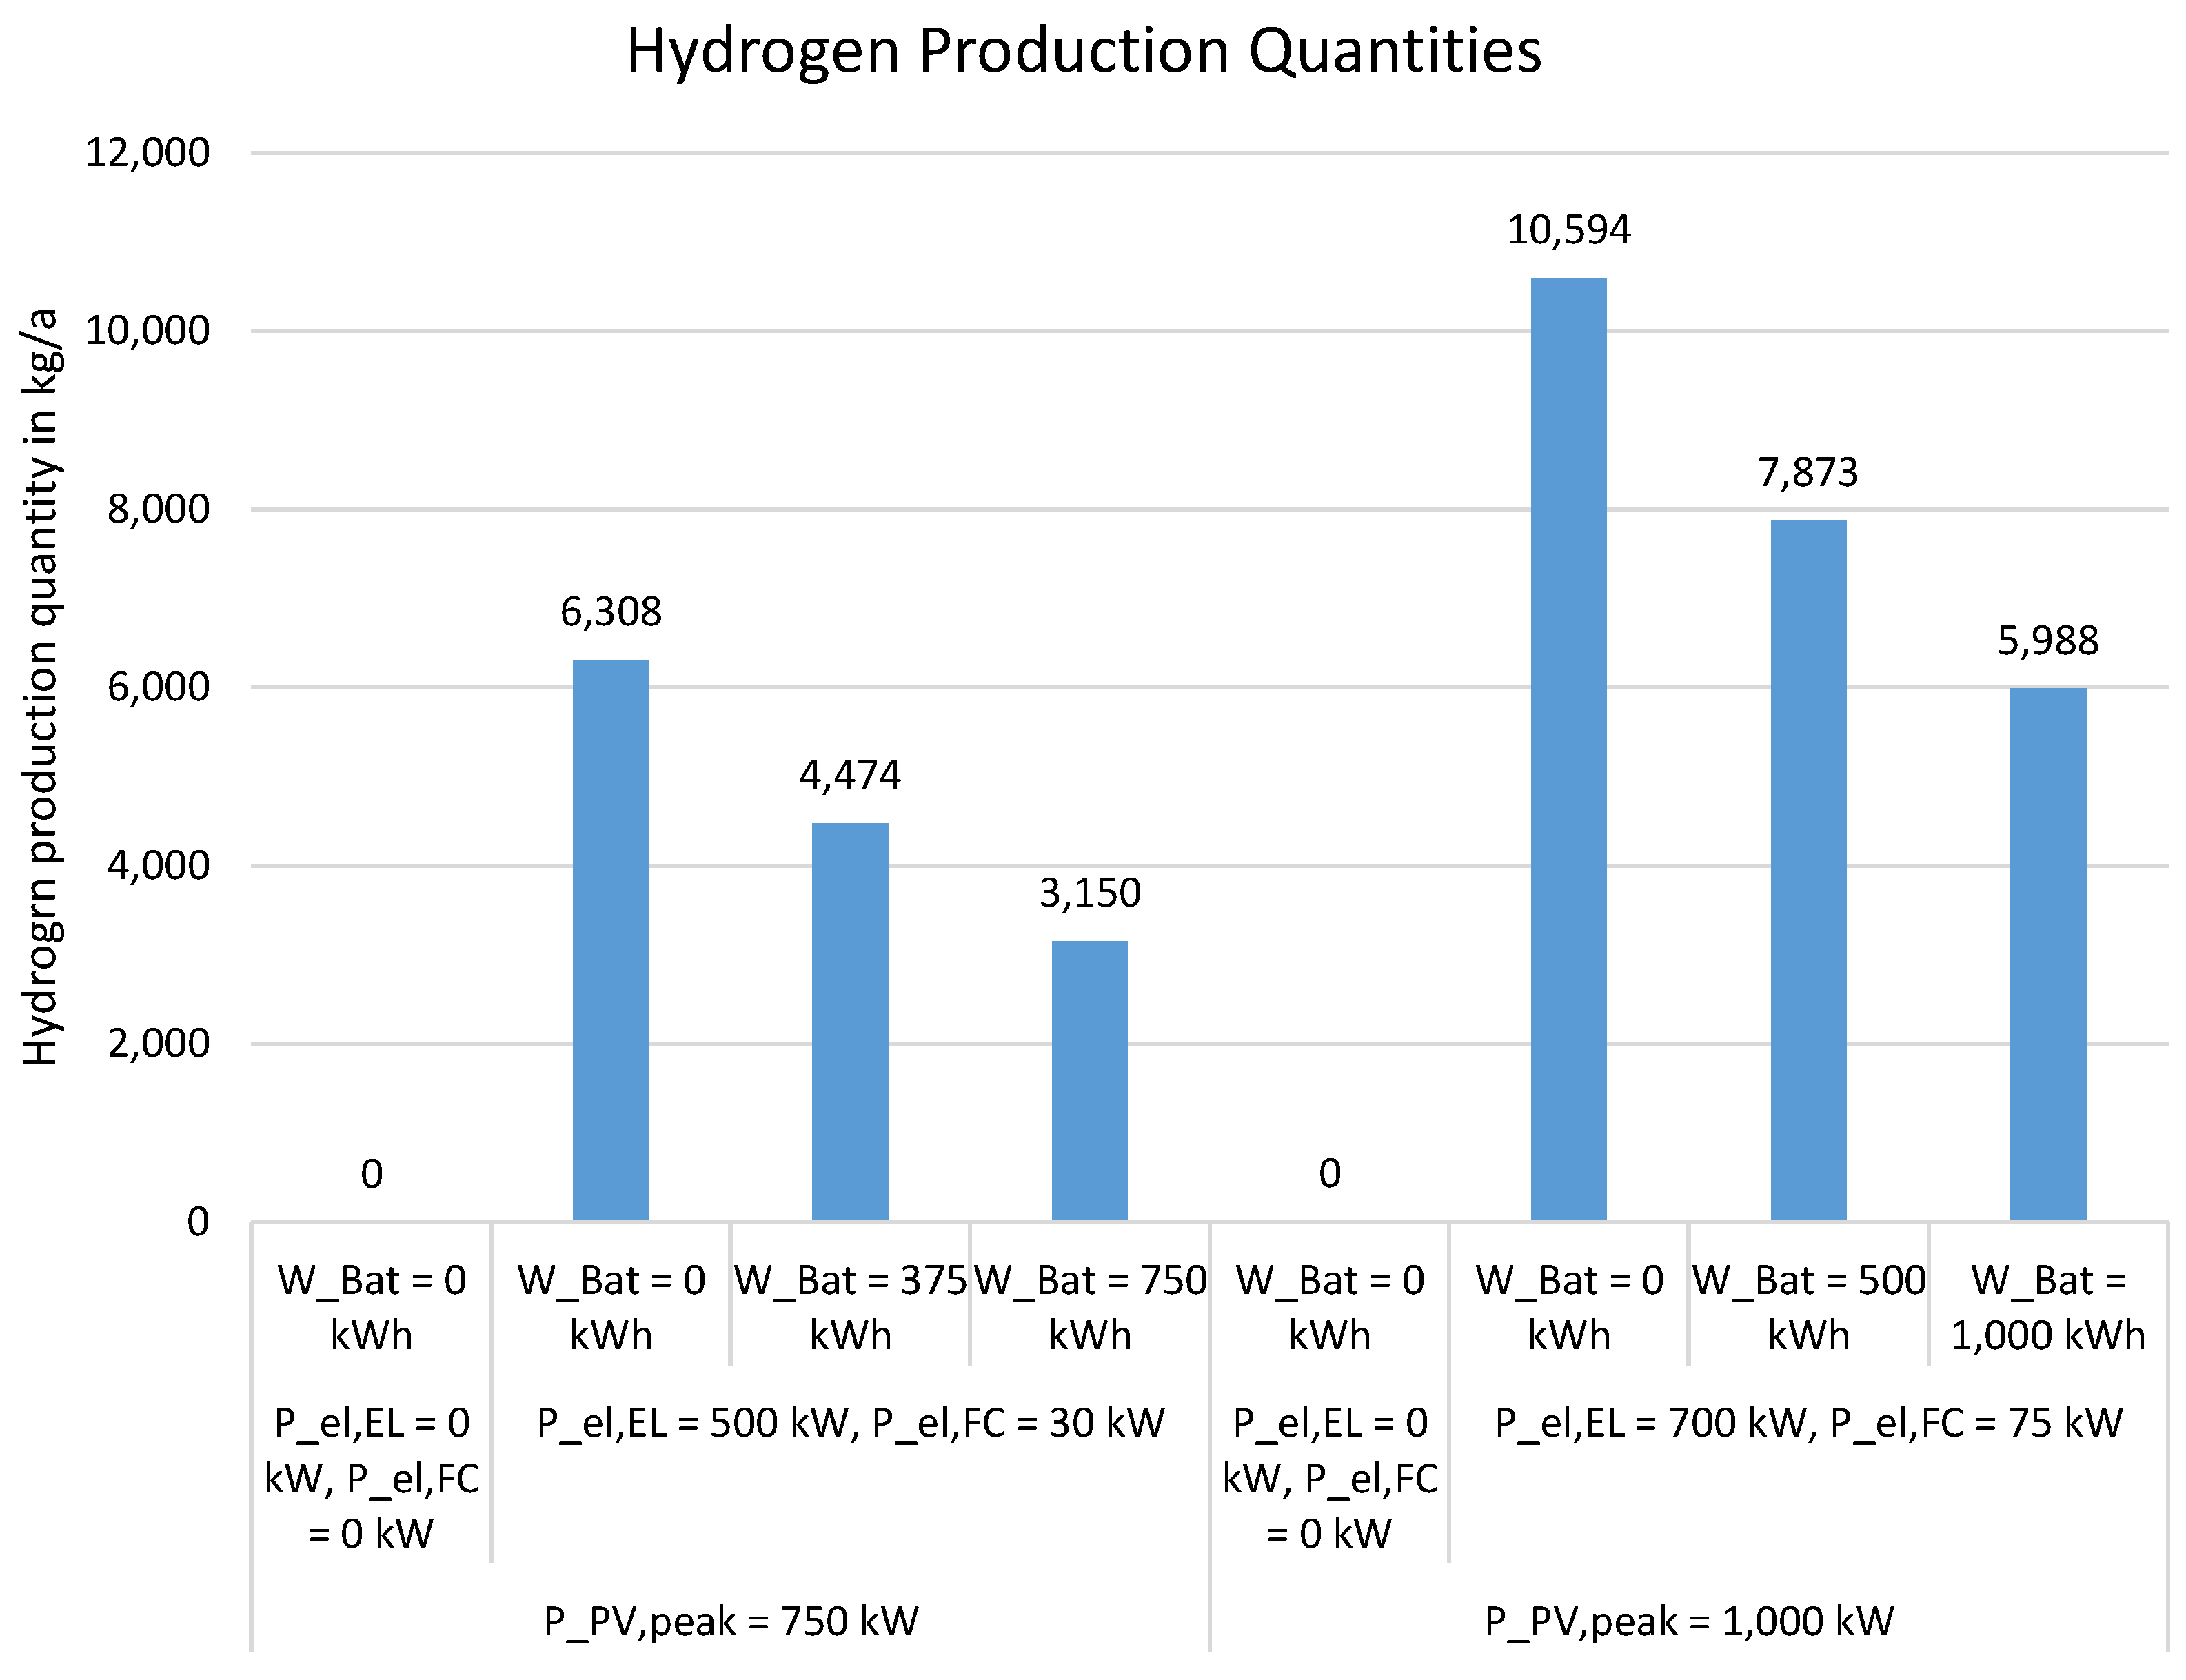
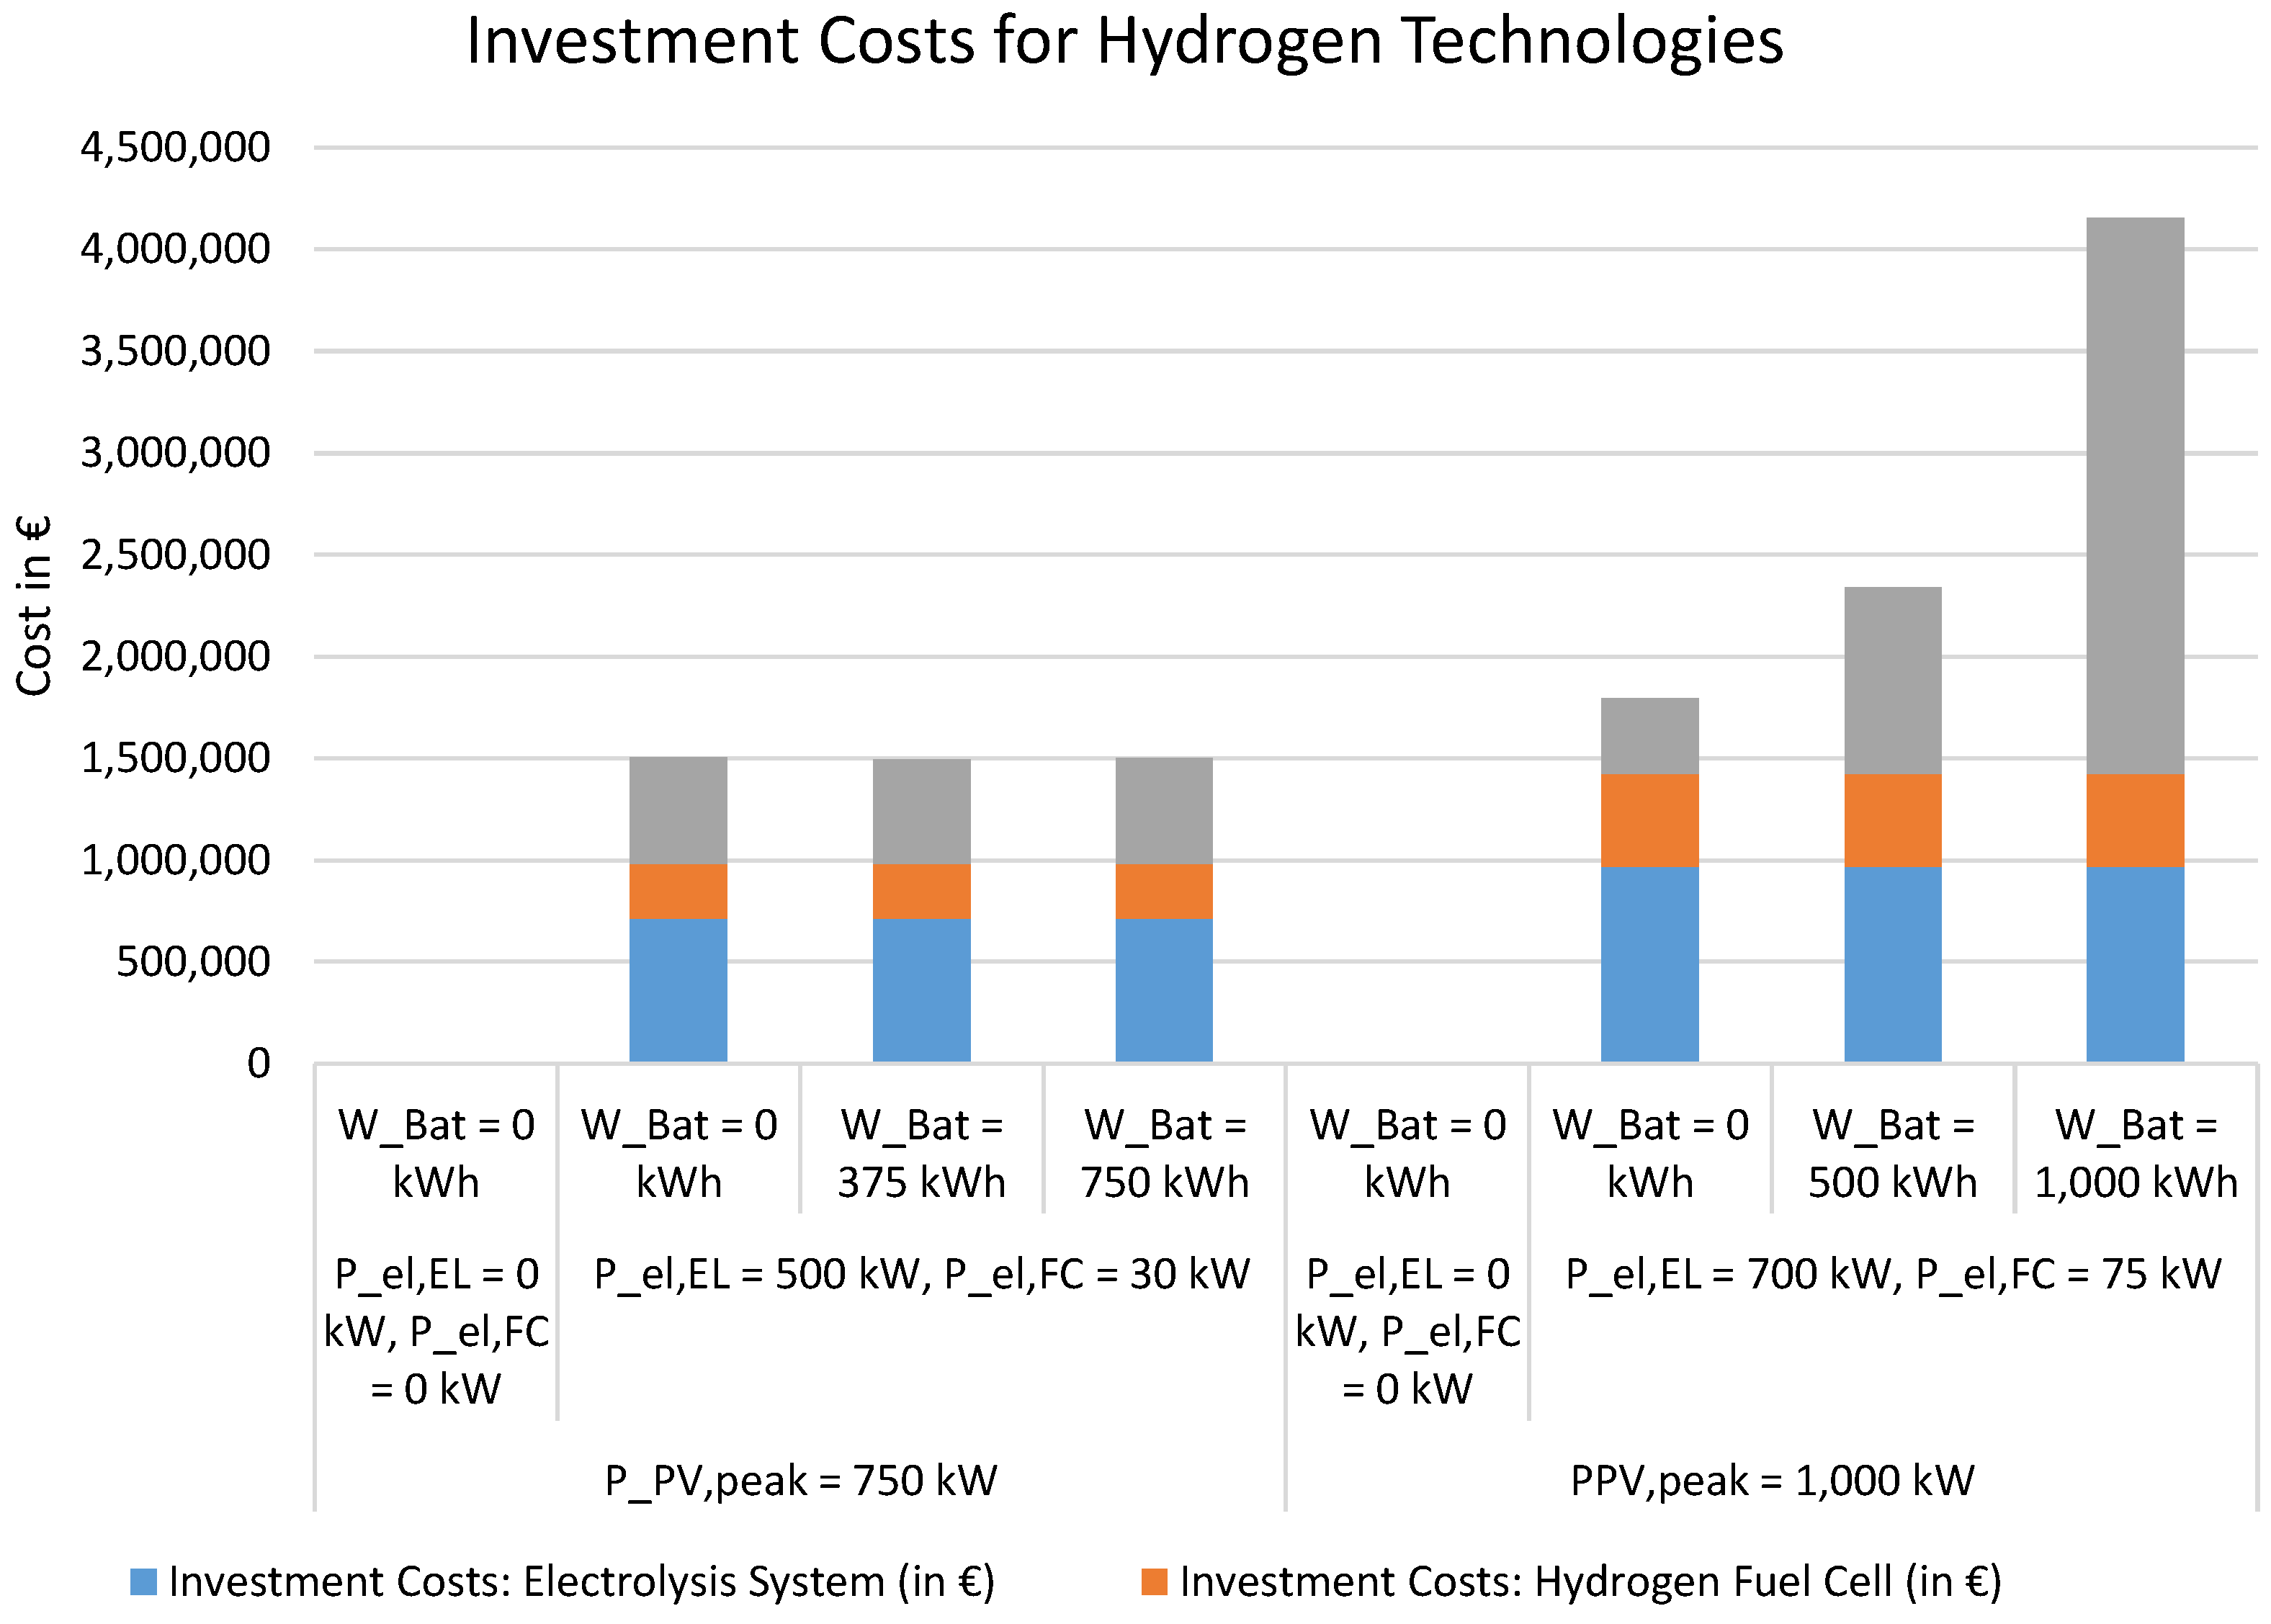
  • Reference variant without battery storage or hydrogen technologies
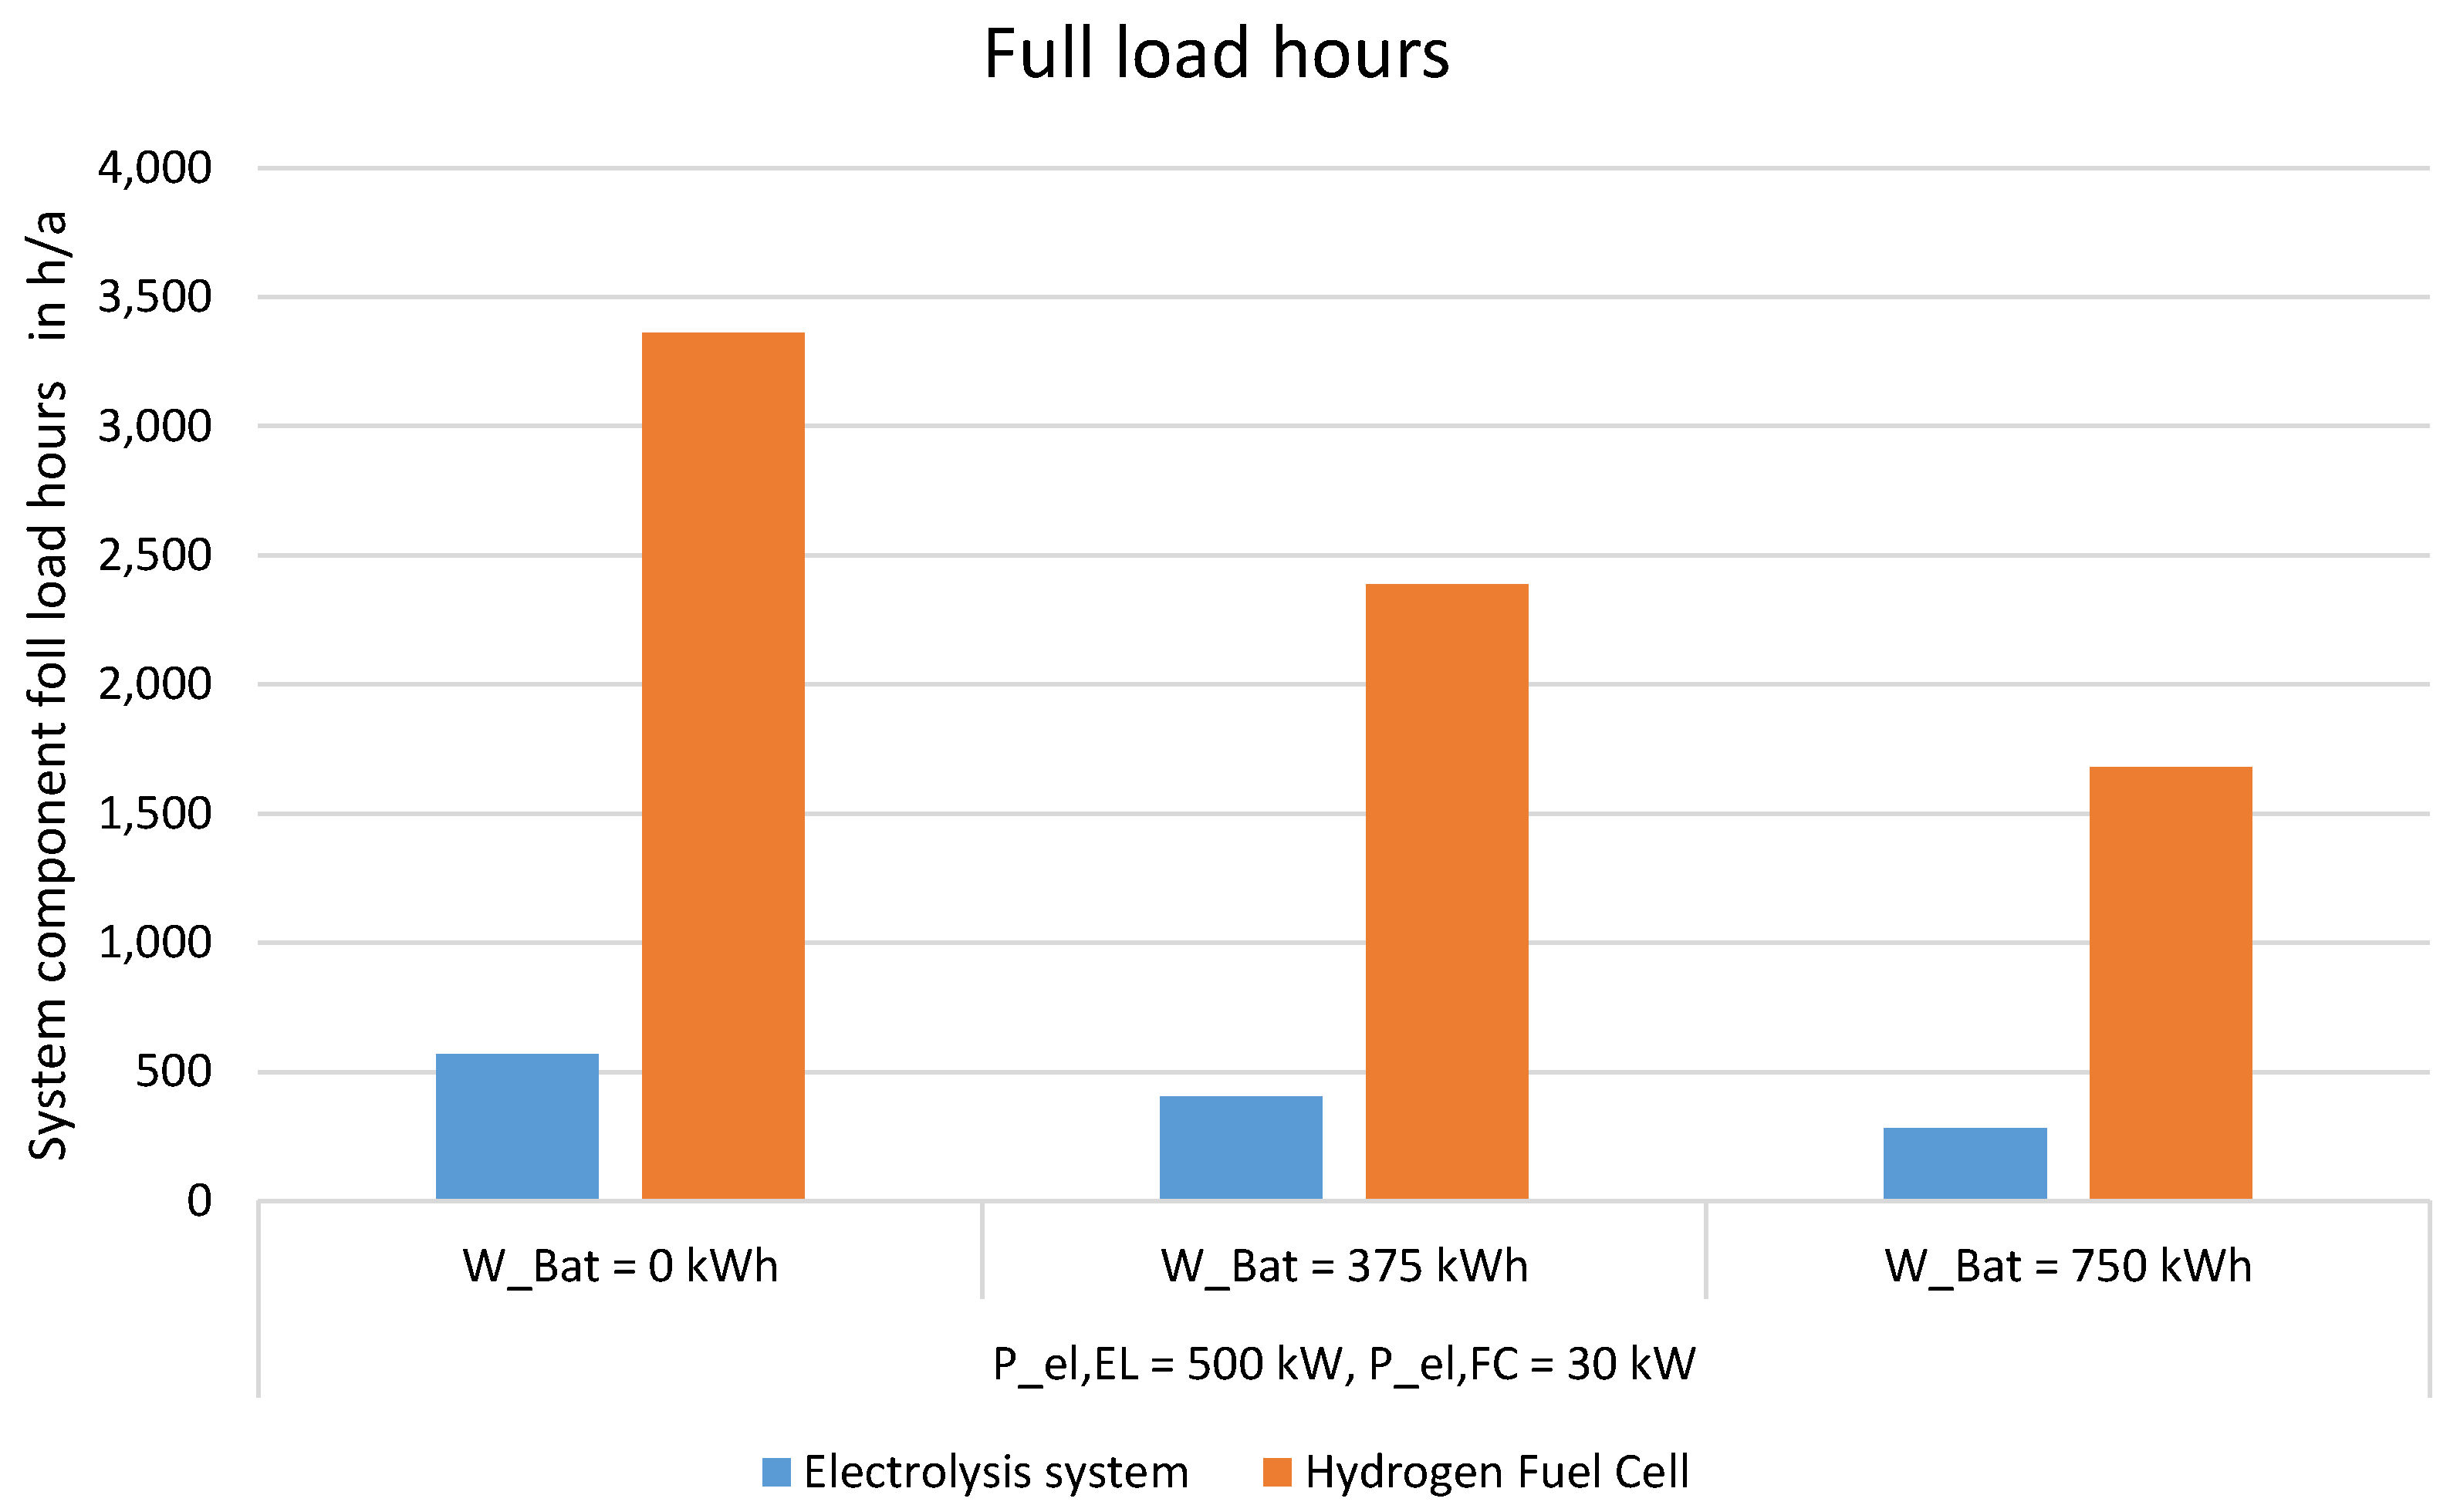
  • Variant without battery storage but with electrolyzer (nominal electrical power consumption 500 kW) and fuel cell (nominal electrical power 30 kW)
  • Variant with battery storage capacity of 375 kWh, electrolyzer (nominal electrical power consumption 500 kW), and fuel cell (nominal electrical power 30 kW)
  • Variant with battery storage capacity of 750 kWh, electrolyzer (nominal electrical power consumption 500 kW), and fuel cell (nominal electrical power 30 kW)
To determine system component operation hierarchies, switch-on sequences were specified in order to simplify complex operating strategies. Hydrogen production, for example, was placed below the coverage of electricity consumption and the use of any available battery storage but above grid feed-in in the electrical consumption hierarchy. Hydrogen production is only possible if there is free storage capacity. On the energy supply side, the battery storage was set as the preferred power source, followed by fuel cell electricity generation and the public power grid. Finally, simulation studies were carried out using the plant dimensions and the abovementioned simplified operation rules.

5. Results and Discussion

In the following chapter, the simulation results are evaluated in terms of their economic and environmental performance. In line with the study’s inductive approach, a generally applicable method for designing energy supply systems with hydrogen technologies for industrial production sites was formulated on the basis of these results (see Section 3). On-site self-consumption creates numerous benefits relating to reduced fees and levies. However, due to German energy legislation, this is only possible for electricity generation systems with power outputs of up to 750 kW. In addition, the environmental assessment was limited by the available data, meaning that it was only possible to conduct linear upscaling depending on the plant size. In consequence, the data inaccuracies in the 1000 kWp variant are too high to produce reliable results for the environmental evaluation. Therefore, the variant with a photovoltaic system rated at 1000 kWp is only used for comparison in the energy-related and economic evaluations. The visualization of the simulation results mainly focuses on variants with peak PV power outputs of 750 kWp.

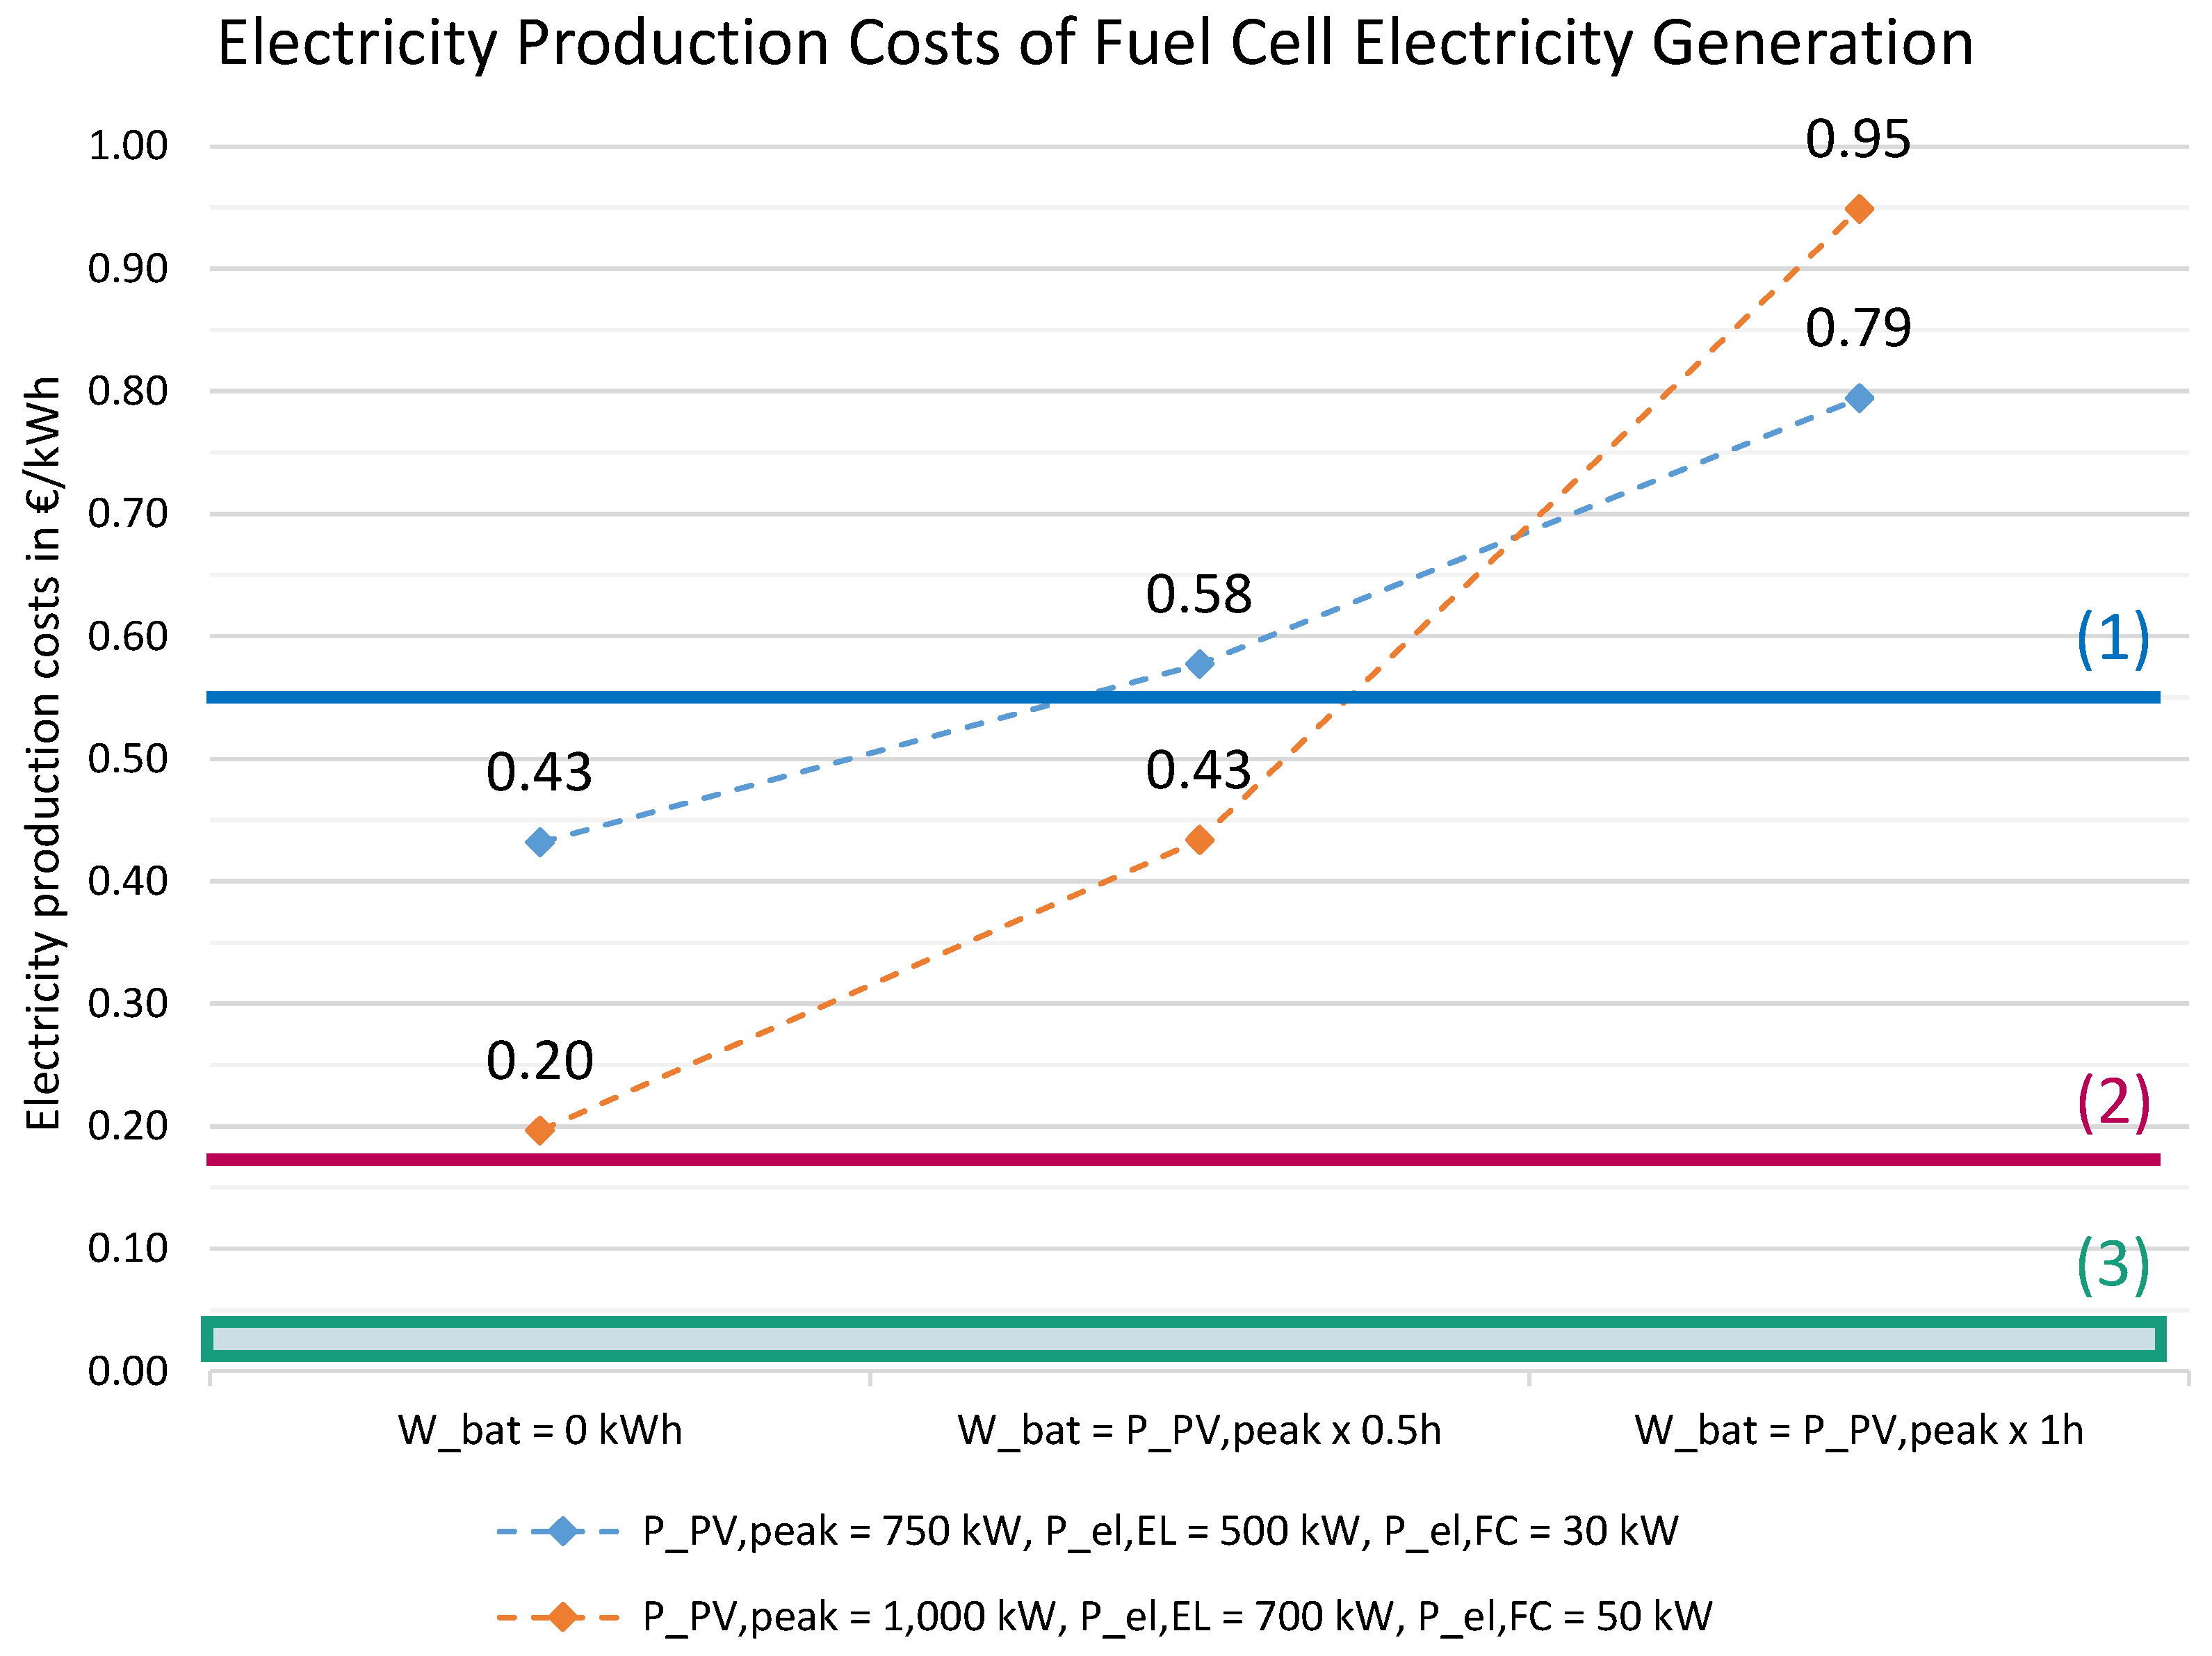
5.1. Energy-Related and Operational Evaluation

For industrial energy supply systems that use hydrogen technologies as energy storage, the interaction between battery storage systems and hydrogen generation plays a significant role. As batteries are relatively common in German companies’ energy systems [12], the effects of adding hydrogen energy storage to existing systems are very important for potential users. The following diagram shows how increasing battery storage capacities affects power supply composition for variants with peak PV outputs of 750 kWp.
Figure 3 shows a comparison of the results for variants without and with hydrogen technologies. This comparison demonstrates that, in variants without hydrogen technologies, the electrolysis system uses up all the electricity for hydrogen production that is fed into the grid. This raises the self-consumption rate to 100%. In contrast to self-generation rates, even in variants with higher peak PV power, complete electric self-sufficiency is not achieved. Table 2 lists the corresponding values that were achieved for dimensioning configurations where P_PV,peak = 750 kWp.
As battery storage capacities go up, hydrogen generation decreases. The reason for this lies in the specified turn-on sequence, which gives priority to battery storage because of its dynamic load intake abilities. Electricity self-sufficiency, however, does not change significantly, as the consumption of self-generated electricity simply shifts from hydrogen generation to battery storage. As described above, this simulation operated on the assumption that energy storage is always prioritized over electrolysis system feeding. This effect is also visible in the hydrogen generation chart in Figure 4:
As previously stated, the objective of the simulation was to maximize self-consumption rates and the system components were dimensioned accordingly. In this context, the utilization of the electrolysis system and fuel cell may provide insight into their cost effectiveness. Figure 5 shows yearly full-load hours for these technologies for variants where P_PV,peak = 750 kWp:
The yearly figures for full-load hours shown in Figure 5 are generally low, especially for the electrolysis system. This is because the simulation was aimed at maximizing self-consumption rates, which are directly influenced by the electrolysis power intake capacity. In general, this focus on maximizing self-consumption rates tends to lead to over-dimensioning. This in turn results in unfavorable utilization of the battery storage, electrolysis system, and fuel cell. As battery storage capacities increase, this effect is ever more evident in the results. A utilization-oriented approach could prevent such developments, as system component dimensioning would then be smaller.

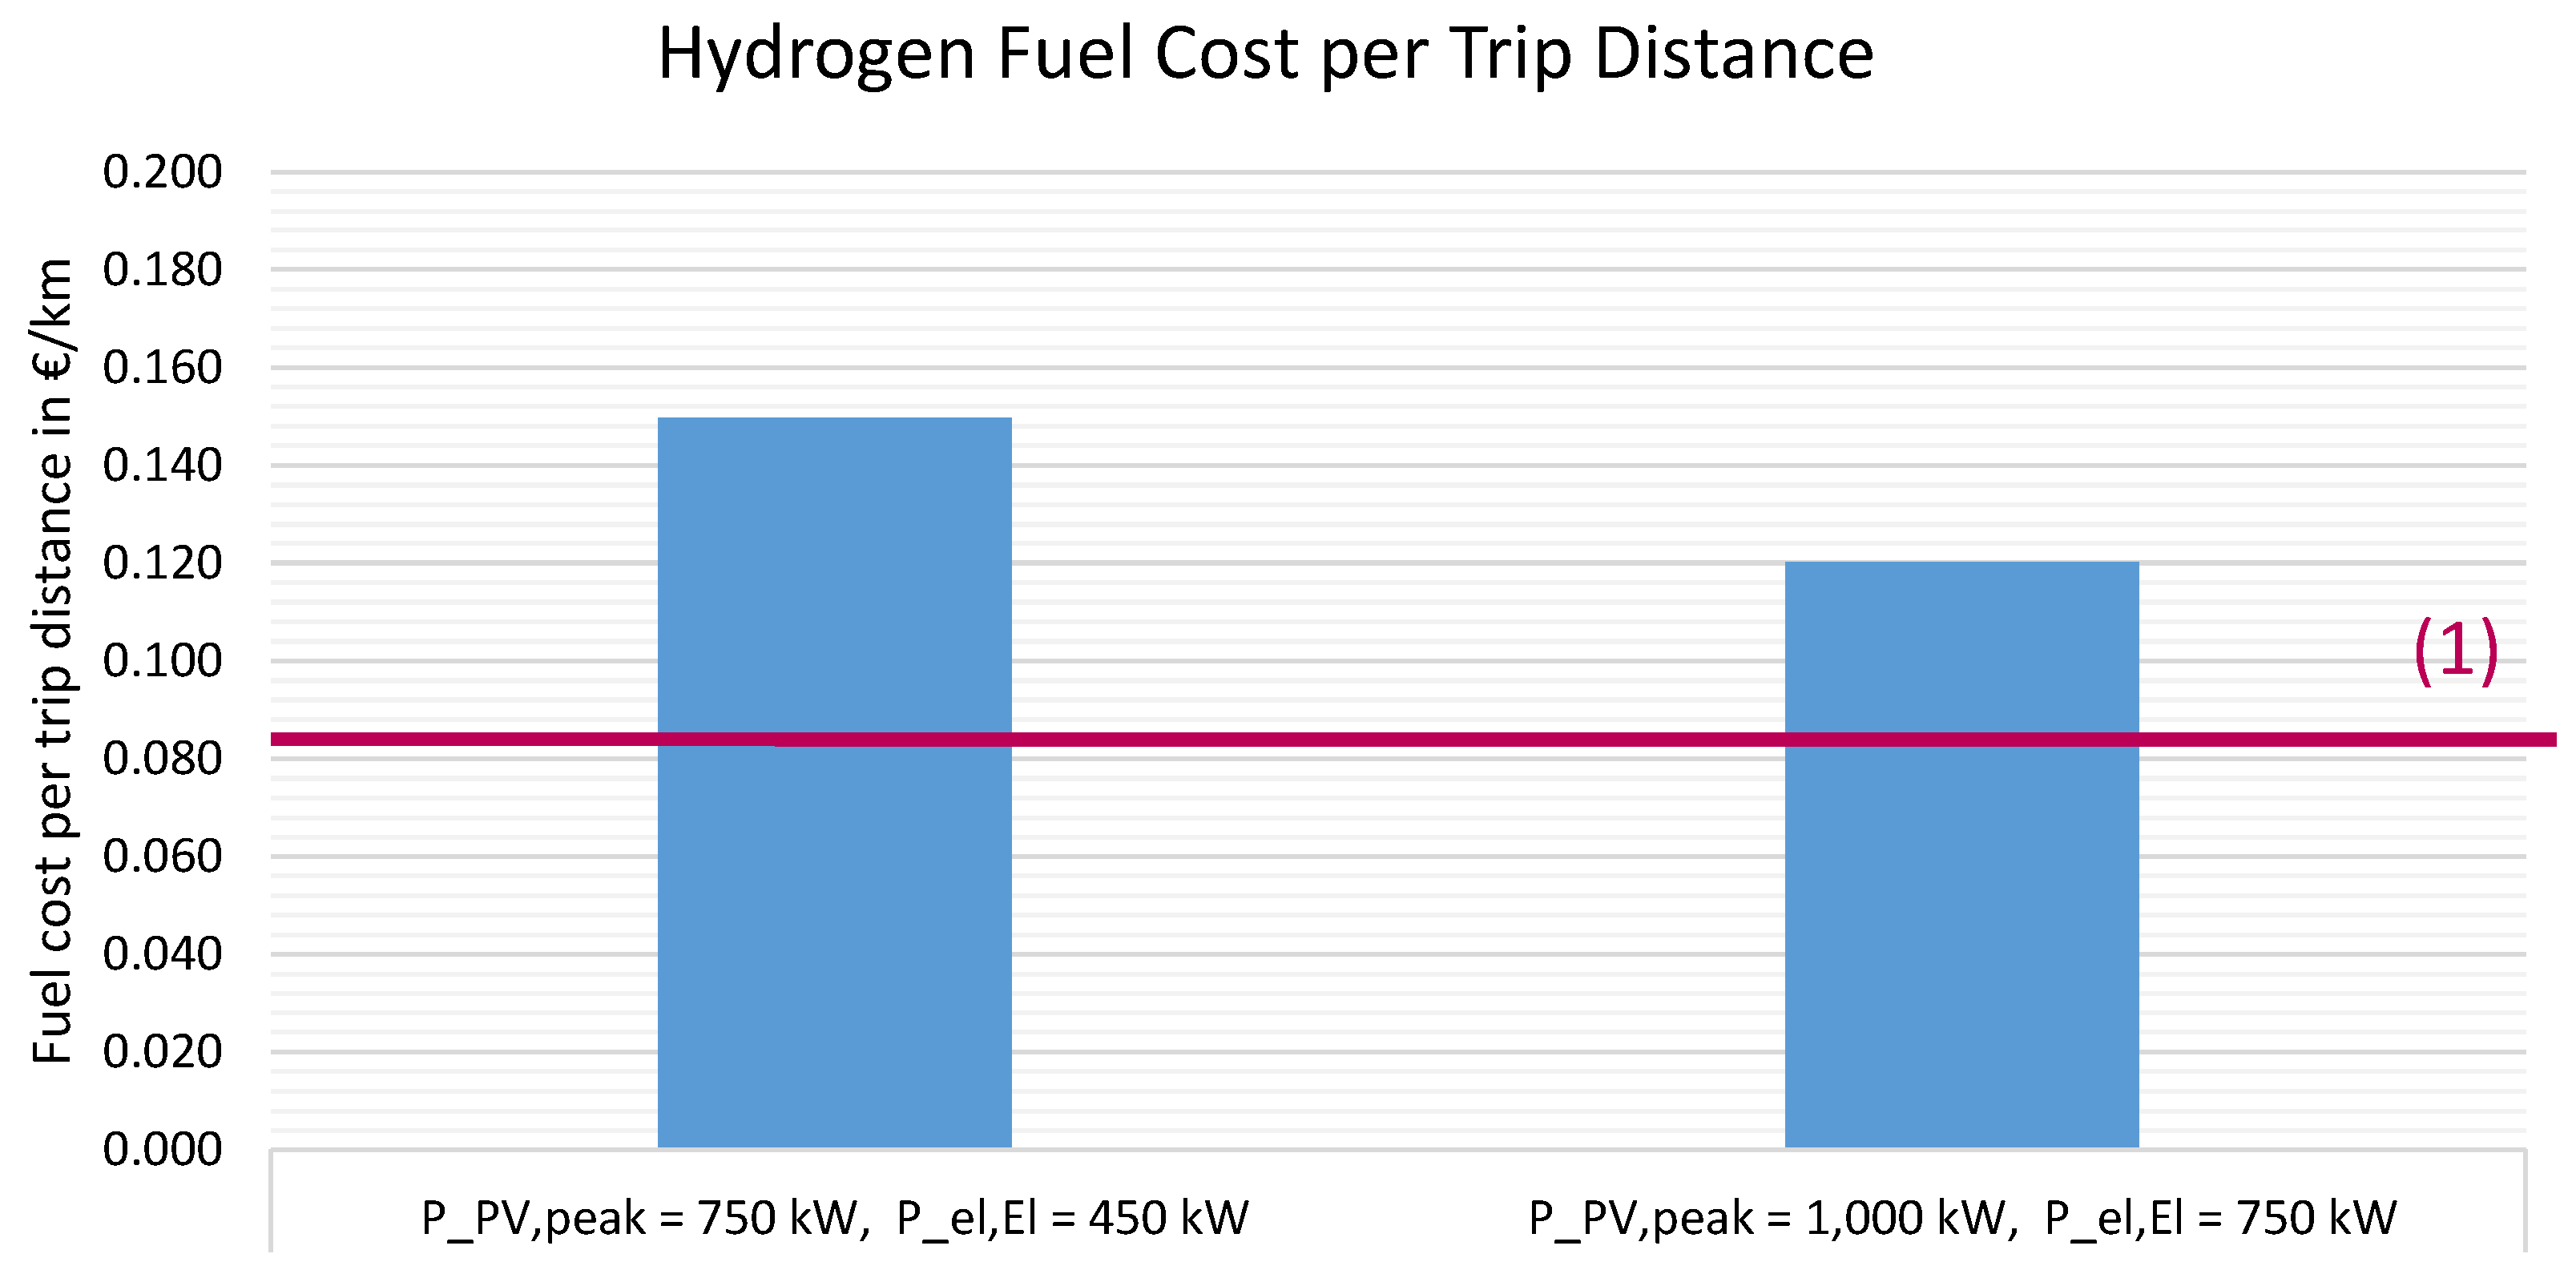
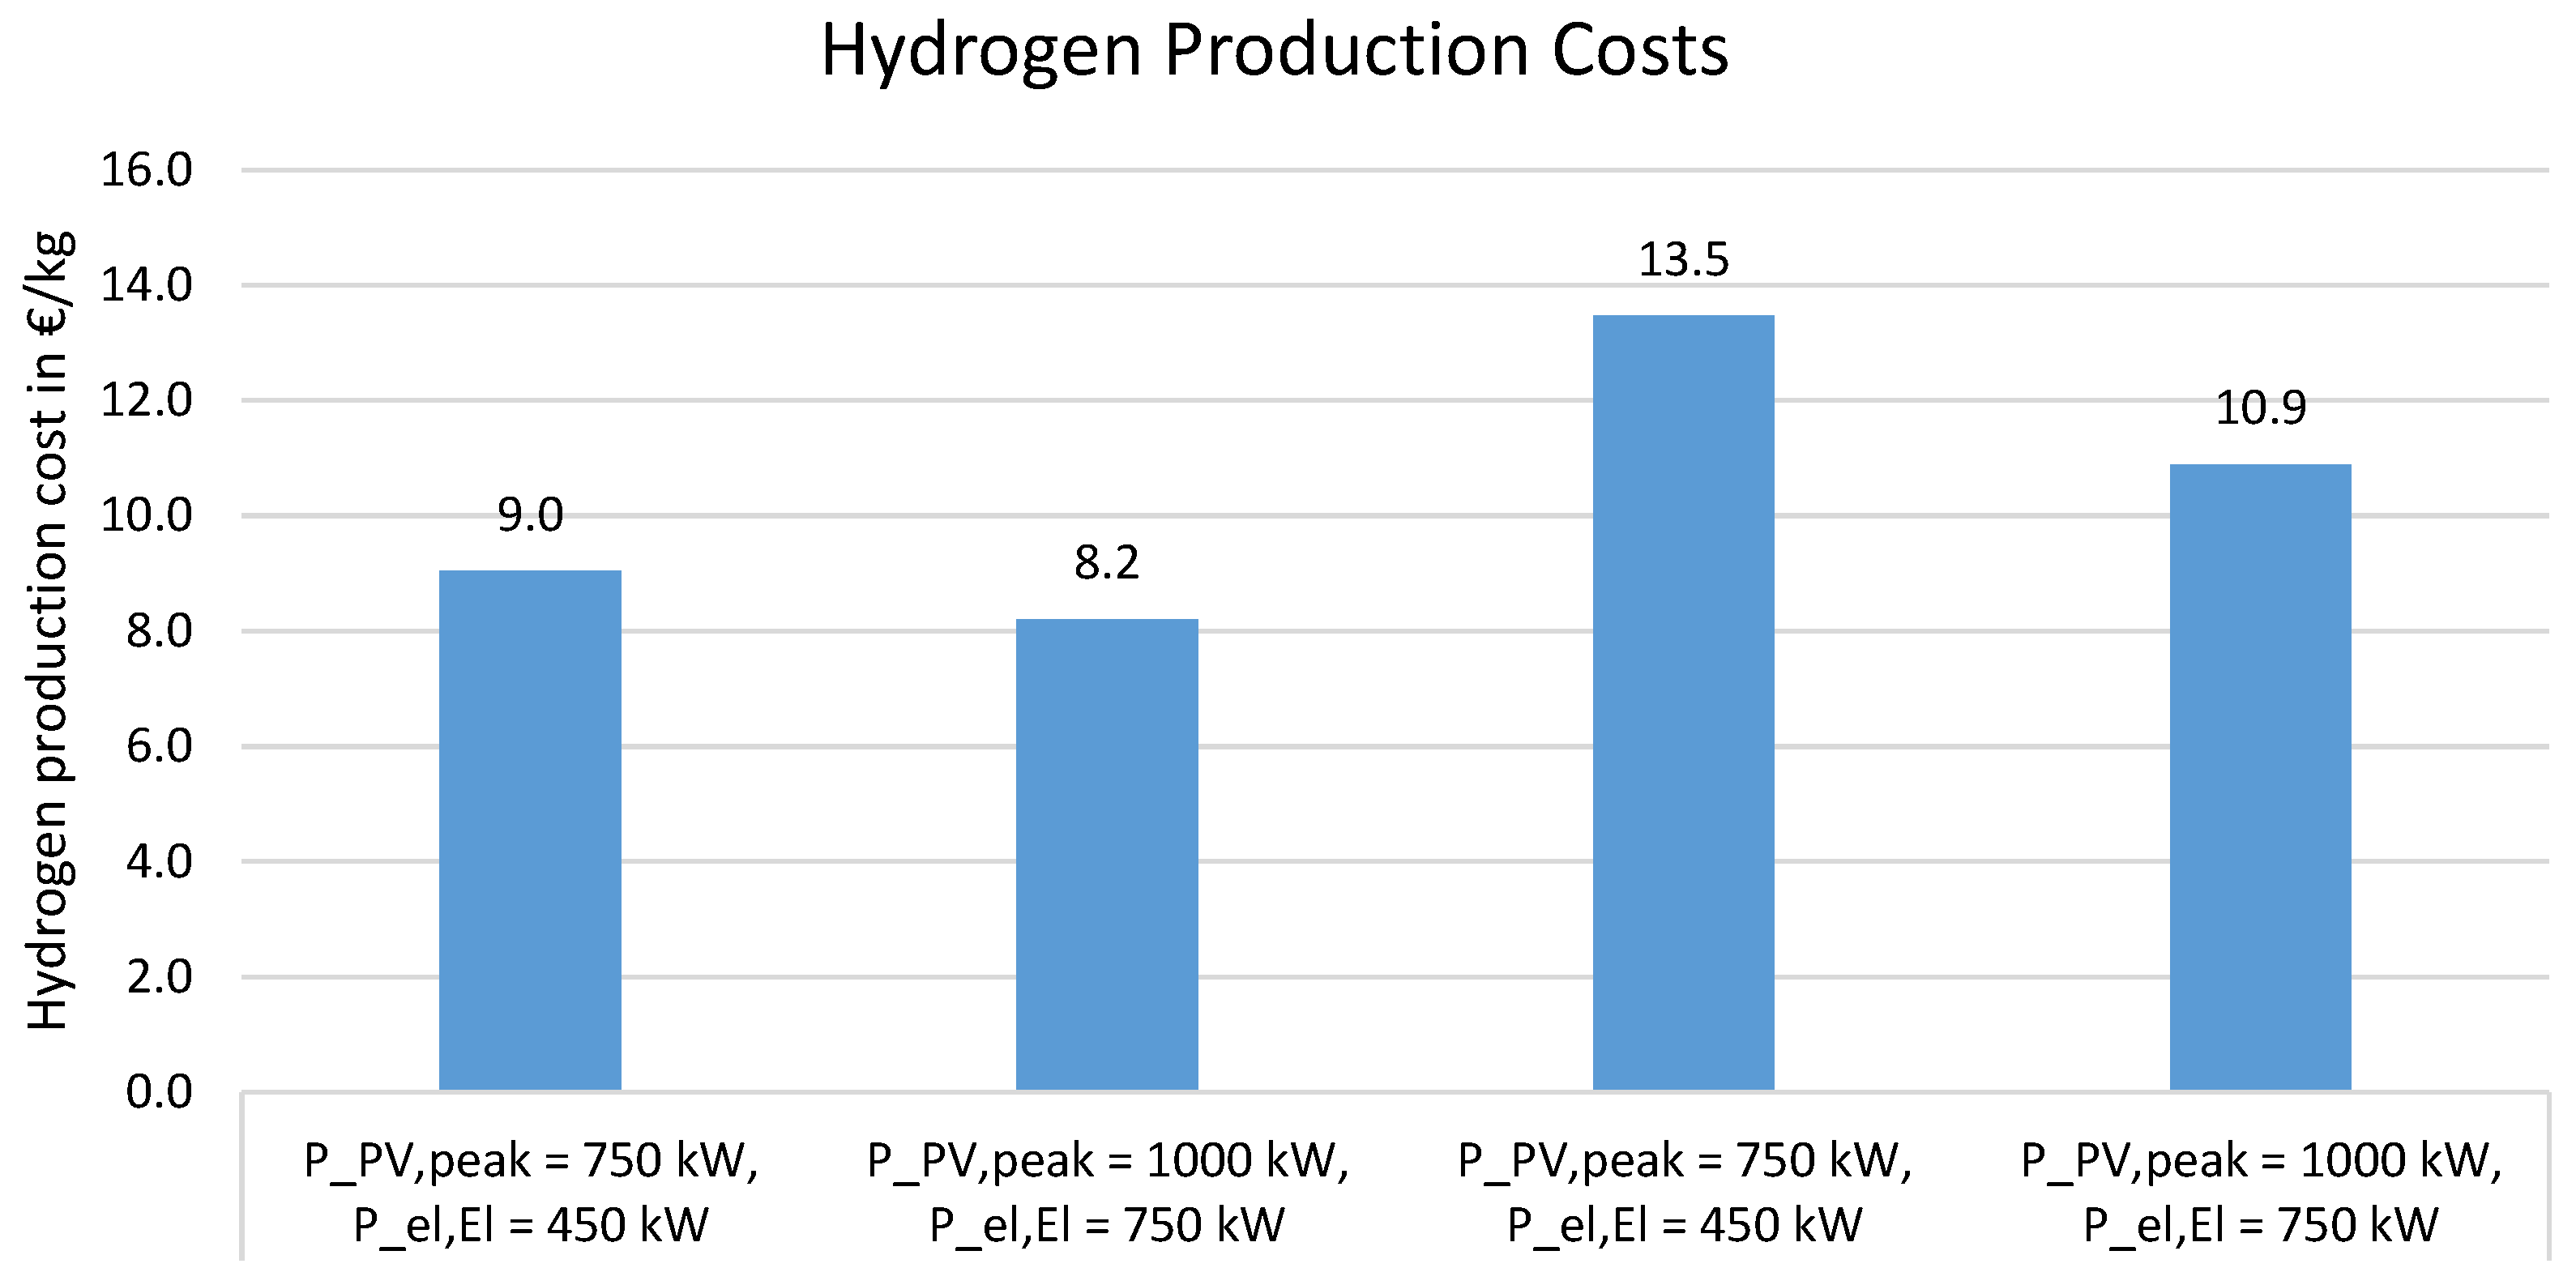
5.2. Economic Evaluation

For the economic evaluation of the use of hydrogen technologies, the change in annual costs was compared to a reference variant that did not have hydrogen technologies or additional battery storage. A combined calculation of revenue and cost components enabled a holistic analysis of the impact that using hydrogen technologies has on the economic efficiency of the energy supply models addressed in this work. The following cost and revenue components were included in the economic evaluation:
  • Change in the annuity of the investment cost: Δ K I n v , a
  • Change in annual operating cost: Δ K o p
  • Change in annual energy purchasing cost: Δ K e n
  • Change in annual revenue from feed-in of surplus electricity: Δ K e l , f e e d
  • Annual water cost for electrolysis operation: Δ K H 2 O
  • Annual revenue from sales of generated oxygen: Δ K O 2
  • Annual utilization-path-specific cost changes; for example, the change in fuel costs in the hydrogen mobility utilization path: Δ K u s e c a s e
In combination, these cost components form the following total cost equation:
K = ( K i n v × a ) + Δ K o p + Δ K e n + + Δ K e l , f e e d + Δ K H 2 O + Δ K O 2 + Δ K u s e c a s e
The difference in annual costs provides insight into the economic viability of the given scenarios and the application of hydrogen technologies. The economic evaluation of the variants can be compared against the reference case without hydrogen applications or against scenarios within the variants. Negative changes in costs are defined as revenues, while positive changes mean an increase in costs. Excerpts from the results of the economic evaluation will be presented and explained below. In particular, the investment and generation costs for fuel cell electricity and hydrogen are discussed.
Different investment cost compositions and annual cost changes resulted for the various defined plant dimensioning scenarios. Figure 6 shows an example of the investment cost composition for hydrogen technologies in configurations with peak PV outputs of 750 and 1000 kWp:
Investment costs for electrolysis and fuel cell systems do not change across variants with the same PV system size. For the variants with 750 kWp peak PV power, this also applies to the pressurized hydrogen storage. The striking increase in investment costs in the variant with a peak power of 1000 kW and a large battery with a storage capacity of 1000 kWh is due to the very high investment costs required for pressurized hydrogen storage. This is because the battery covers a high proportion of the electricity demand. The fact that the battery can replace the fuel cell as a power supply for a large part of the time means that a lot of hydrogen accumulates in the storage system seasonally (in summer), because hydrogen is converted back into electricity less frequently. This is because the underlying energy demand is identical for P_PV,peak = 750 kW and 1000 kW, as the variants are being applied to the same use case. The hydrogen storage capacity was sized according to the maximum capacity required, which is why the storage capacity is very high for this use case. Apart from cost changes, further technical and economic key indicators can be calculated, some of which are presented below. For utilization path 1 (hydrogen as energy storage), for example, production costs for the electricity generated in the fuel cell can be determined as shown in Figure 7:
When the reference lines are added to the chart, it becomes evident that the reconversion of hydrogen into electricity has higher electricity costs compared to battery system storage where the focus is not on maximizing self-consumption. The results also show that fuel cell electricity prices run higher than the price that was assumed for the simulated use case. However, compared to recent electricity prices for grid power supply, reconverting hydrogen into electricity has the potential for more economic configurations [1].
In utilization path 2 (hydrogen mobility), costs were simplified to include fuel costs only. Figure 8 shows that the values for smaller system configurations are significantly higher than the comparative values for conventional passenger cars. For diesel passenger cars, the average price for diesel fuel in 2021 was 1.399 €/L [40] and the average consumption per 100 km was 6 L. These figures result in costs of approximately 8.4 ct/km. Especially in cases where larger amounts of hydrogen are produced and used in mobility, travel costs come close to this value. At this point, it should be mentioned that due to increasing fuel prices (2.03 €/L in May 2022) [40], using hydrogen in mobility is already becoming economical. The amount of hydrogen produced and used in mobility in the most favorable scenario is 10,444 kg per year. During the calculation of additional costs for the mobility utilization path, only the electrolyzer and the compression process were taken into account. This study did not account for instances where hydrogen-powered vehicles and the corresponding refueling infrastructure may be more costly than conventional passenger cars. The evaluation of the simulation results for hydrogen mobility in utilization path 2 only considers application cases without battery storage. As before, the amounts of energy available for the different configurations are determined by their respective peak PV power rating.
Figure 9 compares the hydrogen production costs for utilization paths 2 and 3, thus demonstrating the price of the compressing the hydrogen (to 400 bar) as required in mobility applications:
The International Renewable Energy Agency (IRENA) records a generation cost range of 2.8 € to 6.2 €/kg for hydrogen without compression in 2021 [41]. As such, these values are above market prices by a margin of between 2.0 and 11.3 €/kg. The difference between these values and grey hydrogen prices in June 2022 amounted to approximately 4.9 €/kg, which falls within that range. When the values are compared to current prices for green hydrogen (e.g., 13.65 €/kg in June 2022 [41]), the simulation results show a stronger tendency toward economically viable hydrogen production. The simulation scenarios generally resulted in above-average hydrogen and electricity production costs. This was mainly due to the plant dimensions, which are not optimized for costs, but for self-consumption rates, and consequently result in over-dimensioning of components and accordingly high investment costs.
In this study, the use of hydrogen has been examined from the perspective of a simulated use case where the focus was on maximizing electricity self-consumption. Based on this analysis, it is apparent that the use of hydrogen along the defined utilization paths is not yet economically viable in most cases, particularly when compared to established technologies and supply routes.
When evaluating the results, it should be noted that the individual assumptions made in this study and the resulting restrictions have had a negative impact on the economic viability of the hydrogen technologies:
  • Generally, the output of the photovoltaic systems under consideration is too low to generate significant electricity surplus for use in electrolysis.
  • The use of power purchase agreements (PPAs) to supply more green energy from external PV or wind power capacity was not taken into account.
  • The stated goal of maximizing self-consumption rates (target: 100%) tends to lead to over-sized plants and correspondingly high investment costs. Designing the plants for maximum utilization instead of maximum self-consumption could avoid this effect.
  • The rigid switch-on sequences and priority rules specified in the simulation do not allow for optimization in terms of energy-related or technical elements when controlling the technologies.
  • As this last point implies, the development of strategies for optimized operation of hydrogen technologies in combination with battery storage should be addressed in future research.
Furthermore, combining the utilization paths could create synergies and increased amortization effects. For example, the combination of hydrogen electricity storage and hydrogen mobility could lead to a higher utilization of the electrolysis system. This could reduce the payback time. The fact that technologies’ residual and recycling values were not considered also had a negative effect on economic efficiency. It should be noted here that due to the relatively low prevalence of hydrogen technologies in the vicinity of industrial factory sites, it is not currently possible to make any meaningful statements regarding residual values and realistic life spans.
In the future, political and market developments could also lead to improvements in the economic viability of hydrogen technologies in the context of energy systems for industrial production sites. Examples of such developments include an effective general pricing system for CO2 emissions, the reduction of investment costs through subsidies, or a general price reduction caused by an increase in market volume. In addition, the ongoing increases in electricity prices may further increase the attractiveness of self-consumption and self-sufficiency. The economic performance for hydrogen technologies may also be increased by other means, for example, by taking into account additional revenue streams (such as the sale of green hydrogen in regional hydrogen markets), as much as can be done with battery storage systems. The optimization of grid charges through intensive grid use, peak load shaving, and atypical grid use and participation in the balancing power market may also have a positive effect on economic viability.

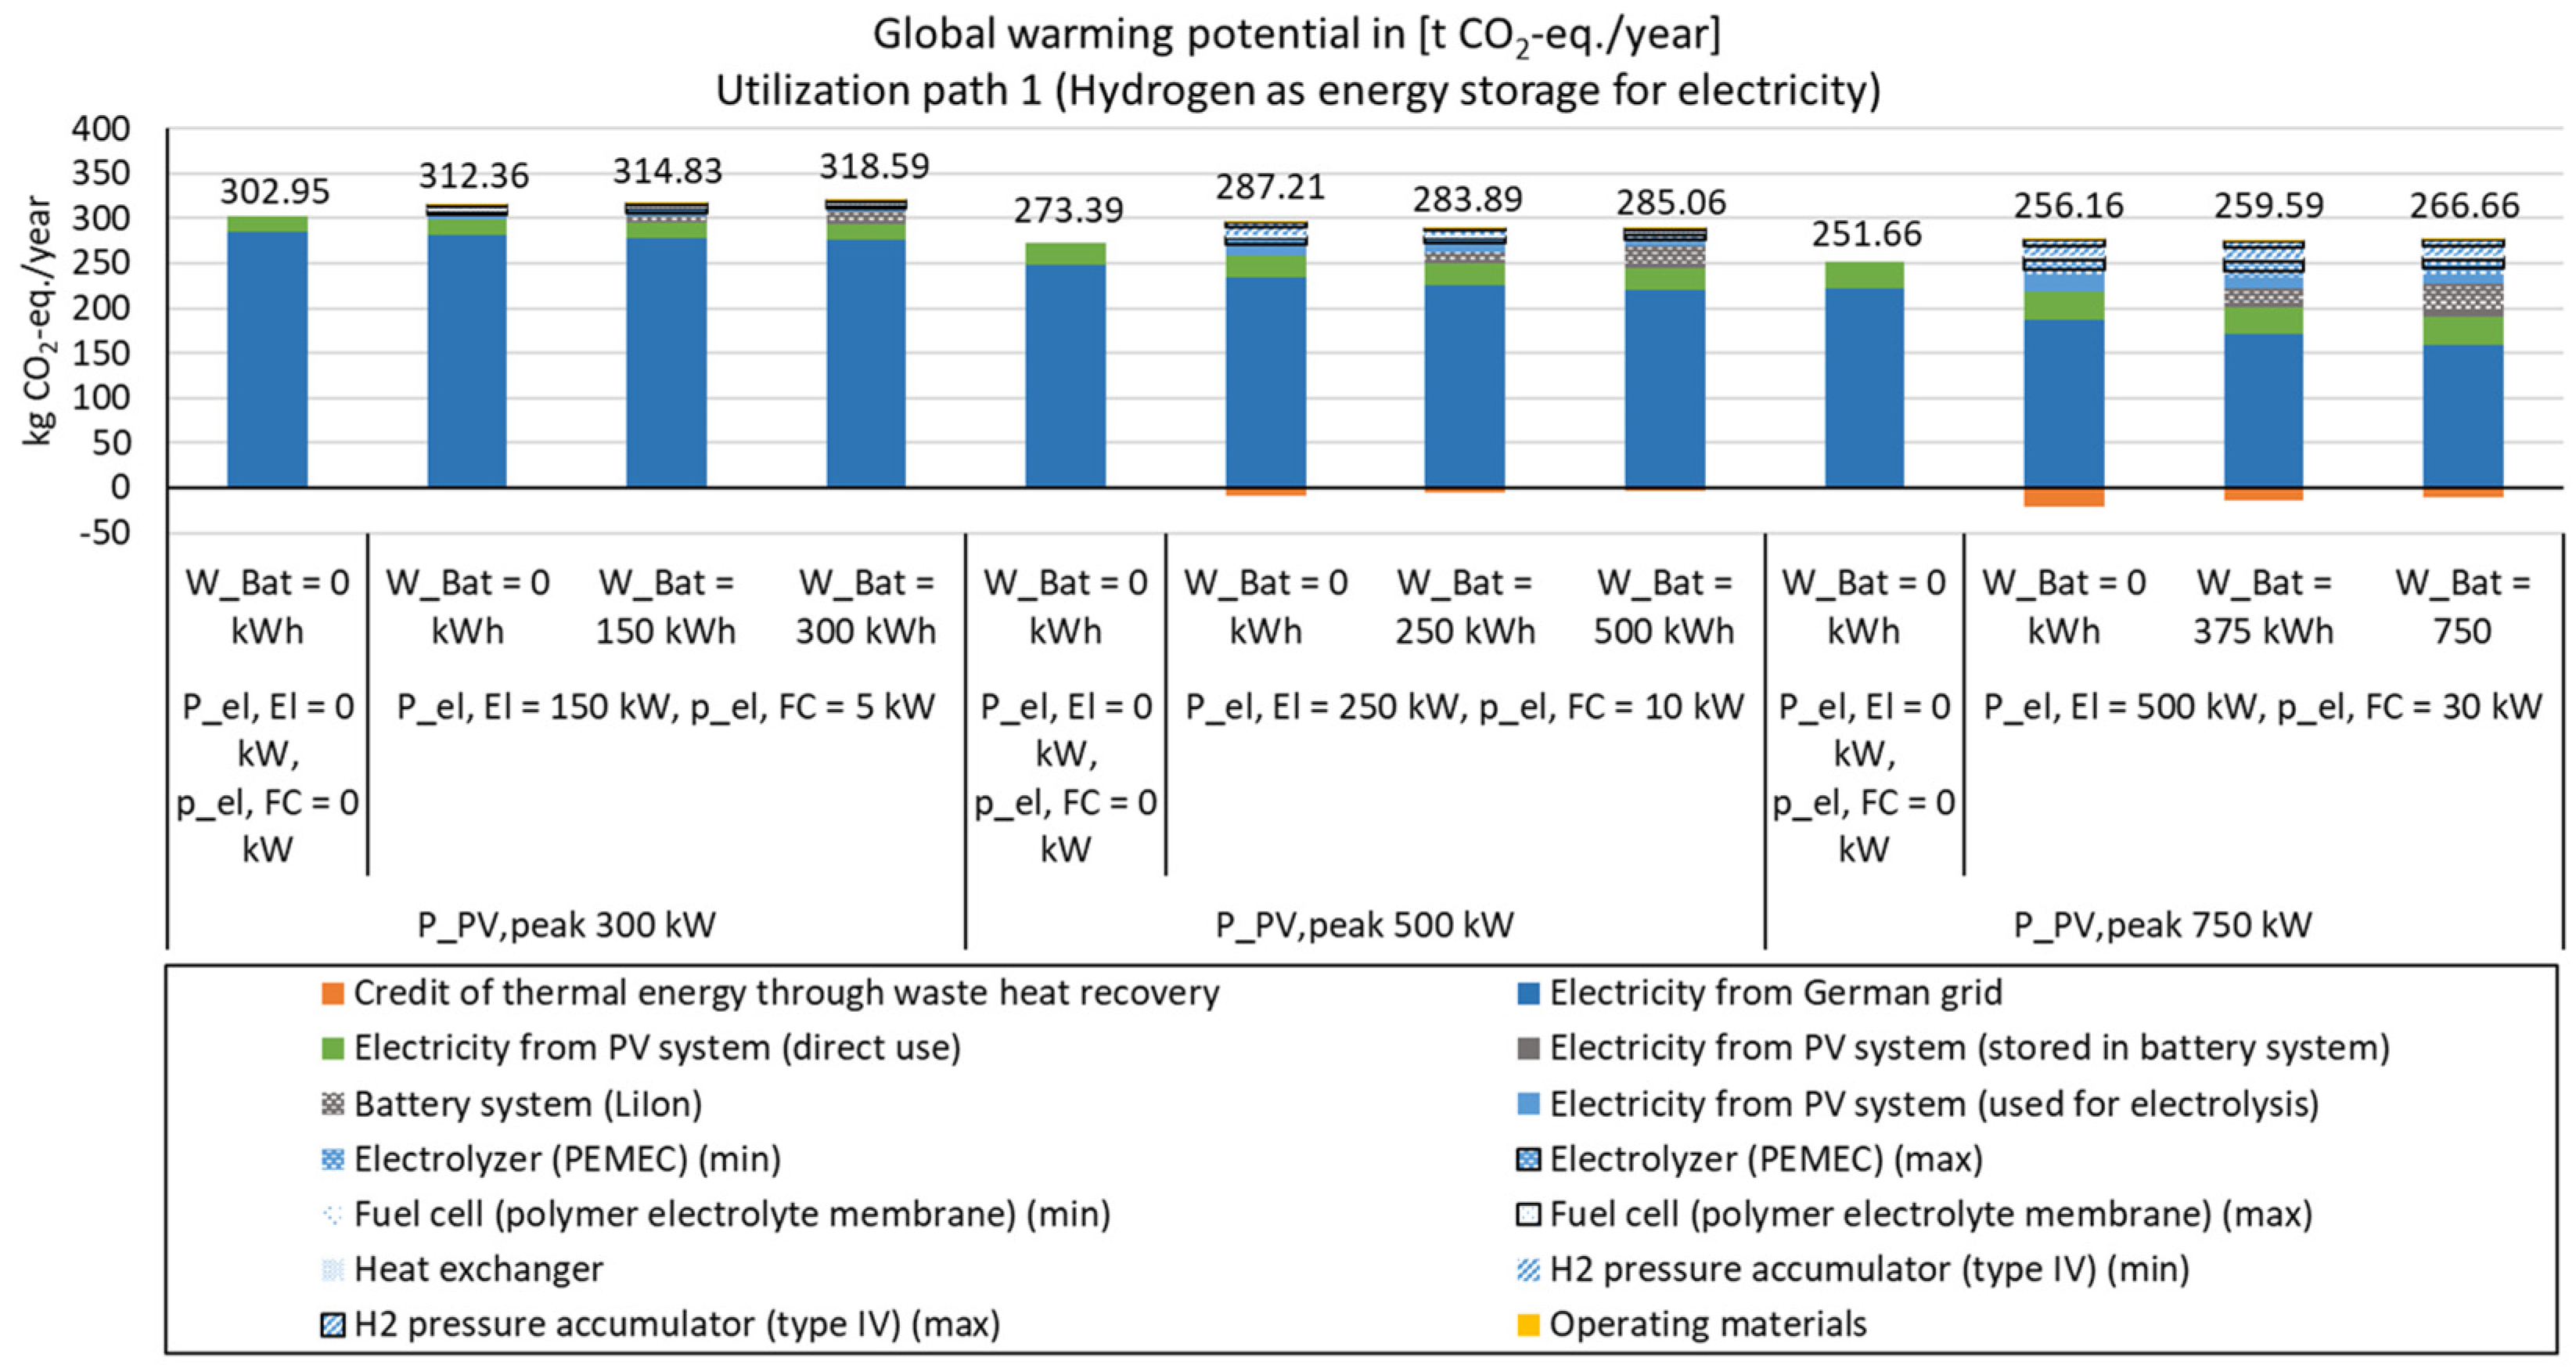
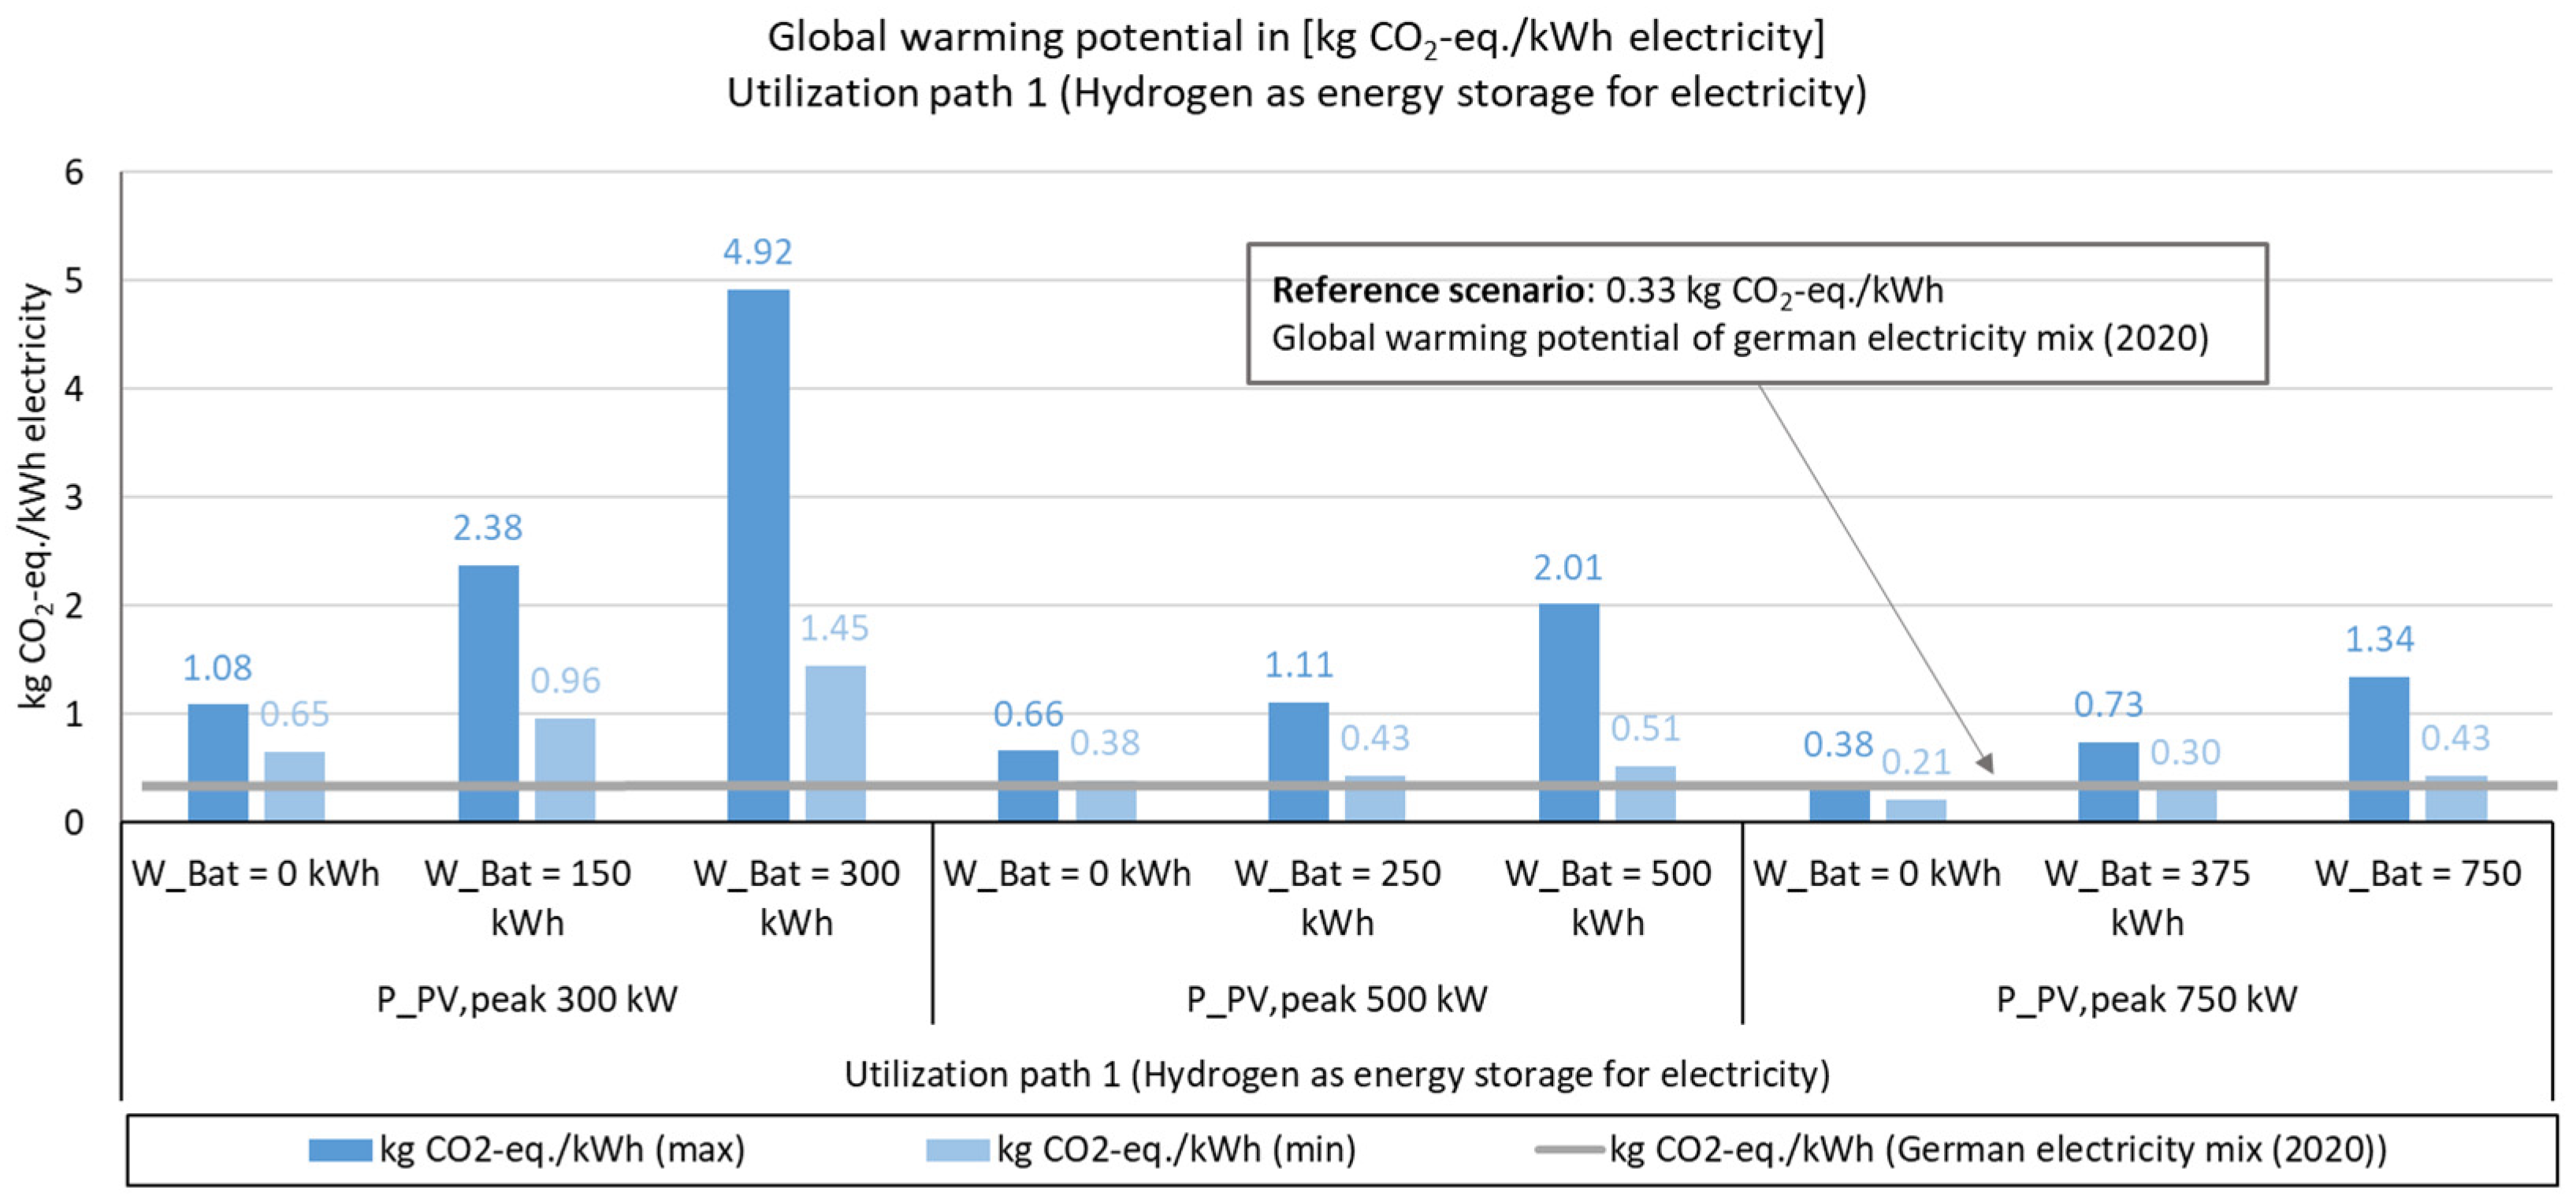
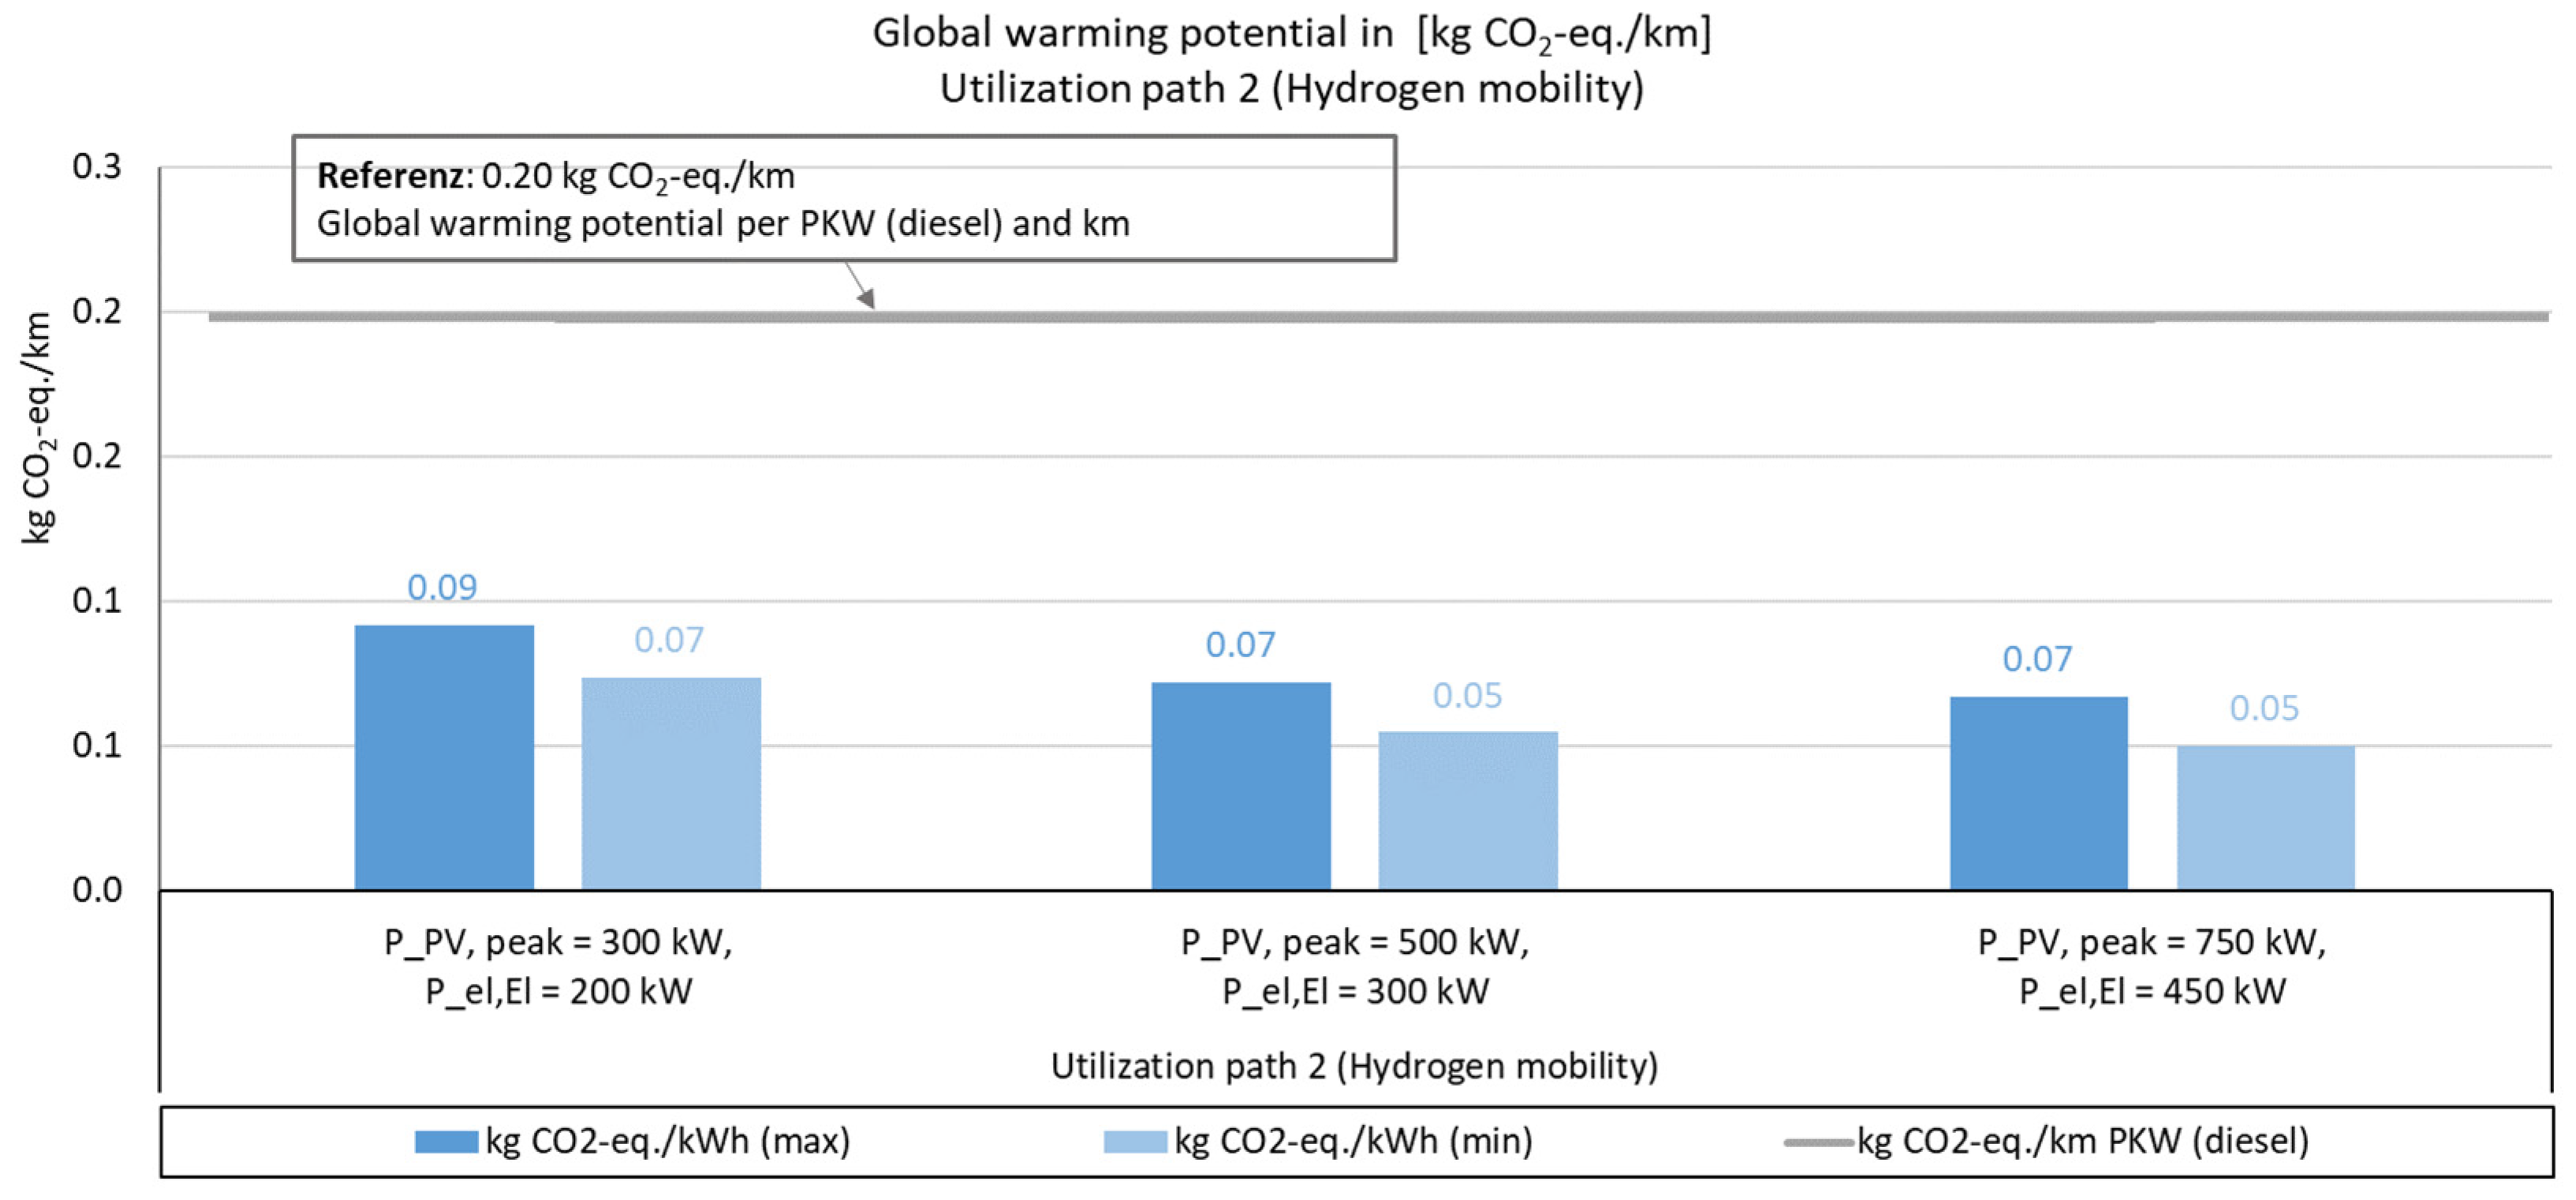
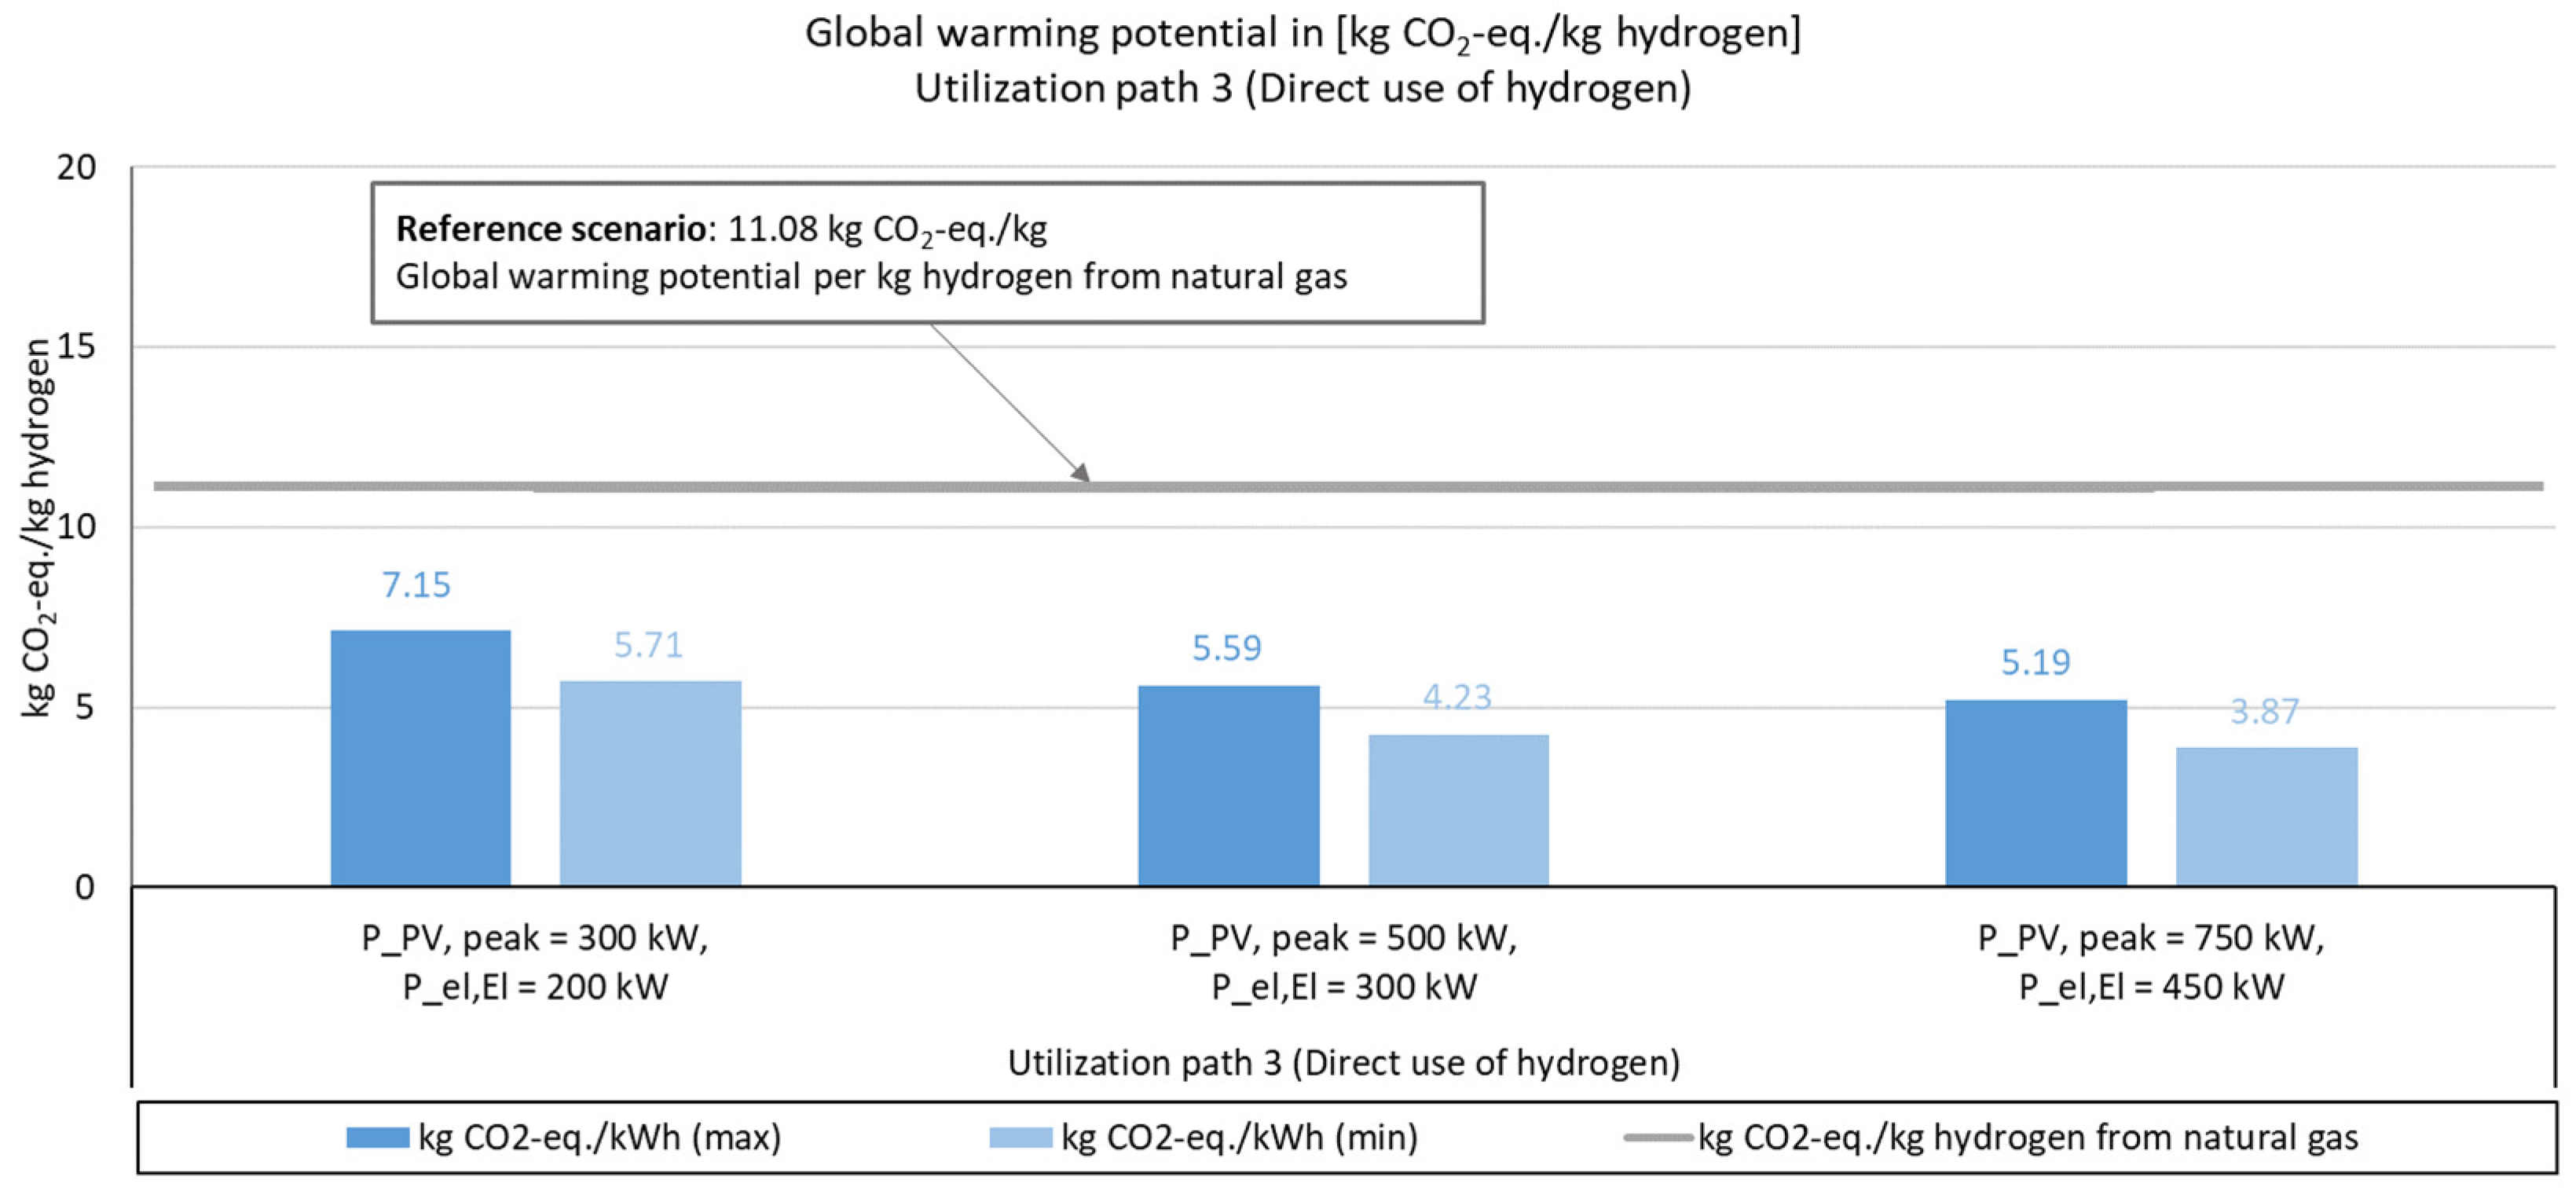
5.3. Environmental Assessment of Impact on Gobal Warming Potential

The impact that hydrogen technologies may have on the global warming potential (GWP) of industrial energy supply systems was calculated using a comparative life cycle assessment (LCA) based on the ISO standard DIN EN ISO 14040/44. As in the economic assessment, the functional unit (FE), which is the reference value for the LCA analysis, is set to one year or to one unit of product (kWh, kg, or km). The environmental assessment is focused on the energy supply system of the production facility. Other aspects of the production process, such as the production facility’s supply of media gases or direct emissions released during production, are not influenced by changes in the energy supply system. Consequently, they are not part of the scope of the investigation. The life cycle inventory data required to calculate the global warming potential was taken from two LCA databases: GaBi Professional by Sphera Solutions and ecoinvent 3.6 (e.g., provision of electrical energy, process water, and manufacturing phases of plants). Missing data was collected by means of literature research and with the help of industry partners. Nevertheless, it was not always possible to collect detailed and complete life cycle inventory data, especially for the manufacturing phase. Therefore, the life cycle inventory in these cases is either based on a bill of materials or on existing global warming potential (GWP) values from various LCA studies. These values were specified in kg CO2 eq./plant. Consequently, the level of data uncertainty for the manufacturing phase is not yet optimal. The software TOP-Energy® was used to determine the annual energy consumption of the production facility, broken down by energy source.
The total global warming potential of the energy supply system was calculated according to the following equation:
G W P t o t a l = i = 1 n G W P f a c t o r i × a i + j = 1 m G W P f a c t o r j × b j + k = 1 o G W P f a c t o r k u k
  • Total global warming potential of the energy supply model in kg CO2-eq./year: GWPtotal
  • Global warming potential of energy source i in kg CO2-eq./kWh: GWP factori
  • Global warming potential of operation material j in kg CO2-eq./kg: GWP factorj
  • Global warming potential of equipment component (production phase) k in CO2-eq./plant: GWP factork
  • Amount of energy supplied by energy source i in kWh/year: ai
  • Amount of operation material j in kg/year: bj
  • Expected durability of equipment component k in years: uk
  • Number of energy sources (e.g., electricity supplied by PV system): n
  • Number of operation materials (e.g., cooling water): m
  • Number of equipment components (e.g., li-ion battery): o
The GWP factors were calculated based on the life cycle inventory data by using the software GaBi in line with the characterization model CML 2001 August 2016. GWP factors from literature sources were also used, as in the case of the production of li-ion batteries.
Figure 10 shows the GWP for utilization path 1 (hydrogen as energy storage) in t CO2 eq/year and compares the results with the reference case (PV system without battery storage and hydrogen technologies). The three peak PV outputs 300 kWp, 500 kWp, and 750 kWp (see Table 1) were investigated in combination with varying electrolyzer and li-ion battery storage system capacities, in a similar manner to the economic evaluation. A nominal thermal (auxiliary power) and electrical (main power) efficiency of 50% is assumed for the fuel cell. As mentioned earlier, the 1000 kWp peak output was not examined due to the high levels of uncertainty regarding the data quality.
The GWP of the reference scenarios depends exclusively on an electricity supply that uses the PV system and grid purchasing as energy sources. However, for the other scenarios, both the necessary operating resources and efficiency losses due to the storage system and the manufacturing phase of the newly integrated energy supply system components were taken into account. These components include li-ion battery storage, electrolyzer, fuel cells, heat exchangers, and hydrogen pressure storage tanks. Consequently, changes are only considered in comparison to the reference system.
Using hydrogen for seasonal energy storage and a battery system for short-term energy storage allows the production system to use a higher amount of the electricity generated by the PV system. This arrangement also means that less of the electricity from the PV system is fed into the grid. As a result, companies do not have to purchase as much electricity from the grid, which leads to a reduction of the GWP. As can be seen in Figure 10, this positive effect is particularly evident in larger PV systems.
However, the positive effect is offset by the additional GWP caused by the production phase of the newly installed components. As a result, utilization path 1 has a higher total GWP than the respective reference scenarios. In the case of P_PV,peak 750, the GWP of the reference case is 251.66 t CO2 eq./year. In contrast, the W_Bat = 750 scenario has a total GWP of 266.66 t CO2 eq./year when plant manufacturing is included and 198.59 t CO2 eq./year when it is not. Due to the uncertain data situation, the GWP figure calculated for the manufacturing phase is essentially an estimation based on literature data and additional information from industry partners. For each of the additional components, i.e., the electrolyzers, fuel cells, and hydrogen pressure storage tanks, a minimum and maximum greenhouse potential figure was calculated for the manufacturing phase. As their influence on the overall balance is significant, a more detailed assessment must be carried out in the future to verify the results obtained by the environmental assessment presented in this study. In the case of the “min” scenario, a reduction of the GWP compared to the reference scenario can be achieved for the following variants: P_PV,peak 750 kW (W_Bat = 0 kWh (−5.0%); W_Bat = 750 kWh (−3.6%); and W_Bat = 1000 kWh (−0.8%)).
In addition, Figure 10 shows that when the capacity of the li-ion battery is increased, less PV electricity is stored in the form of hydrogen. Instead, the surplus is fed into the battery storage system. As a result, the self-consumption rate does not increase further, but stays at the same level. On the other hand, the larger battery storage system results in a higher impact at the production phase, which increases the energy supply system’s total GWP.
Using the waste heat emitted by the electrolyzer and fuel cell reduces the thermal energy demand covered by the gas boiler. This reduction in thermal energy demand from the gas boiler—together with the CO2-eq. avoided as a consequence—is accounted for by applying a credit to the total GWP. This credit accounts for the avoidance of CO2-eq. emissions that would have been released in the production and combustion of the natural gas to generate thermal energy. The value of the credit depends on the amount of hydrogen produced, or more precisely, on the amount of waste heat generated. Consequently, the value decreases when a larger battery storage system is used for a particular variant. This credit is shown as an orange bar section in Figure 10.
Figure 11 (the “max” and “min” scenarios) shows the total GWP for variants where electrical energy is supplied exclusively via a combination of a PV system, an electrolyzer, a fuel cell, and a hydrogen pressure storage tank. The units used in the chart are kg CO2 eq./kWh electricity. It is assumed that the fuel cell has a nominal electrical efficiency of 50%. The results have been compared against the GWP per kWh of the German electricity mix (2020).
The smallest GWP per kWh of electricity for each variation occurs when there is no battery storage system integrated into the energy supply system. In these cases, a higher share of the electricity generated by the PV system can then be held in reserve via the seasonal hydrogen storage. As a result, the additional GWP caused by the manufacturing phase of the electrolyzers, fuel cells, and hydrogen pressure storage tanks is distributed over a larger amount of regenerated energy, which lowers the impact per kWh. Furthermore, due to the higher utilization rate of the hydrogen storage components, the GWP decreases when the peak power of the PV system is increased.
In the case of the “min” scenario, a lower GWP than the German electricity mix can be achieved for a PV system size of 750 kWp. The reduction for the variant without battery storage (W_Bat = 0 kWh) is −36%. In contrast, the reduction for the variant W_Bat 375 kWh is −9%. This shows that seasonal storage of electrical energy via hydrogen represents an environmentally friendly alternative to the German electricity mix under certain conditions.
Figure 12 (“max” and “min” scenarios) shows the results of the environmental assessment for utilization path 2. The figure illustrates the total GWP per distance traveled for a hydrogen-powered passenger car in kg CO2 eq./km. These results are compared with a diesel-powered passenger car. In this case, only the share of the GWP that is generated due to the production (incl. production phase for new components) and utilization of hydrogen and diesel is taken into account. This also includes the emissions that result from the combustion of the fuel. However, in the case of the hydrogen vehicles, it is assumed that this combustion is CO2-neutral. The production, disposal, and recycling of the vehicle in question were not considered. In Figure 12, the combustion efficiency of the hydrogen-powered vehicle is compared to that of the diesel-powered vehicle based on the cars’ different ranges in km per kg of fuel. It is assumed that a hydrogen-powered can achieve 4.4 times the range per kg of fuel. This assumption is based on information provided by industry partners.
For all variations and scenarios, the hydrogen-powered car can achieve a lower GWP than the diesel-powered vehicle. In the case of the “min” scenario, the reduction falls within a range of −65% and −75%. For the “max” scenario, on the other hand, a reduction range of −55% and −65% per km can be achieved.
Finally, Figure 13 (“max” and “min” scenarios) shows the GWP for the production and storage of hydrogen via electrolysis (e-hydrogen) in kg CO2 eq./kg hydrogen (utilization path 3). These GWP values are compared to the production of fossil hydrogen from natural gas. Only the share of the GWP that is generated in producing the hydrogen (incl. the production phase for the extra components) is taken into account.
In Figure 13, it can be seen that for all variations and scenarios, hydrogen produced via electrolysis has a lower GWP per kg than fossil hydrogen produced from natural gas. For the “min” scenario, the reduction falls within a range of −49% to −65%. In the case of the “max” scenario, a reduction range of −35% to −53% per kg of hydrogen can be achieved.
In summary, it is apparent that the global warming potential of energy systems with hydrogen technologies can be reduced under certain conditions. Utilization paths 2 and 3 show the greatest potential. However, the amount of surplus PV electricity that is available for hydrogen production is an important factor. The results of the environmental evaluation show that the potential to reduce the GWP grows as the rated power of the PV system increases. Compared to the reference scenarios, such as mobility using diesel-powered vehicles, natural-gas-powered CHP, and fossil hydrogen produced from natural gas, the variants studied show a significant reduction in global warming potential. However, this does depend on the amount of hydrogen produced. On the other hand, the plant production phase has a negative effect. This is the main reason that no reduction in GWP occurs for the variants examined in utilization path 1 when compared to the reference variants. However, based on Figure 10, it is possible that a lower GWP than the German electricity mix could be achieved for large PV plant capacities (e.g., 750 kWp) if 100% of the electricity purchased from the grid were replaced by surplus PV electricity through seasonal hydrogen storage. This means that a positive environmental effect will only occur if a large amount of electricity purchased from the grid is replaced by surplus electricity from the PV system, with hydrogen acting as an energy storage medium. The reason for this is that in the process, the self-consumption rate would be greatly increased, which would in turn lead to further significant reductions in the amount of electricity purchased from the grid. As in the economic evaluation, this can be achieved by developing operating strategies for optimized operation of hydrogen technologies in combination with a battery storage system or by optimizing the component or overall energy model design. A combination of the different utilization paths could also lead to a more efficient overall model. This is the only situation in which it would be possible to achieve a lower GWP for utilization path 1 than for the reference scenario. Nevertheless, the GWP caused by the production phase of the additional plant components would still cause a major obstacle from an environmental point of view. However, since this data stems from an initial estimate based on literature, it must be reviewed and refined in collaboration with industry partners in a subsequent step. This imprecise data caused a number of restrictions; for example, it was not possible to consider economies of scale as a function of plant size. Instead, a linear increase in global warming potential per kW of plant size was assumed. In addition, it is expected that new, innovative approaches will give rise to advancements in manufacturing processes and components, which may also lead to a reduction in environmental impact.

6. Conclusions and Prospects for Further Research

6.1. Conclusions

In this work, industrial energy supply systems were developed, modeled, and simulated so that they could then be evaluated from an economic and environmental perspective. For this purpose, a method was developed in accordance with the areas where a need for action was identified. This method is specifically suited to manufacturing companies. It was applied to a use case involving actual manufacturing company data and conditions in order to determine the potential of producing hydrogen and using it in one of three possible applications.
For the utilization path “hydrogen as energy storage”, electricity production costs of between 43 and 79 ct/kWh (based on current conditions) were calculated for the variants with a peak PV power of 750 kW. If the green hydrogen is converted back into electricity in a fuel cell under certain conditions, greenhouse gas emissions can be reduced by up to 36% when compared to the reference scenario using the German electricity mix. Meanwhile, the simulations of the “hydrogen mobility” utilization path showed that hydrogen vehicles could achieve fuel costs of 12 to 15 ct/km. This indicates that this path already falls within an economically attractive range when compared to the reference costs of diesel vehicles. The calculated reduction in greenhouse gas emissions in comparison to diesel-powered cars was around 65%. Finally, the simulations for the “direct hydrogen use” path resulted in production costs as low as 8.2 €/kg and reductions in greenhouse gas emissions ranging between 35% and 65%, depending on the scenario. As such, this path is attractive from both an economic and environmental perspective.
These results demonstrate that the generation and utilization of hydrogen is a suitable energy storage option both from an economic and environmental point of view. First, however, the system dimensioning and operating strategies for the utilization paths require optimization. In addition, prices in the energy sector have increased at an even more rapid pace in recent times, and other influencing factors have also intensified. Consequently, the conclusions drawn in this work are heavily dependent on further political and market developments that may take place during the technologies’ period of use, which is likely to be long term.

6.2. Prospects for Further Research

Further research in this field could expand on and extend both the method and the potential investigation of the use cases. In addition to the specific possibilities for improving the economic and environmental evaluation listed in Section 5, there are also two more general areas where further research is required in relation to the simulation method:
  • The operating strategies of the individual plants need to be developed further, taking into account complex control options, interactions, and constraints. In this work, these strategies have only been mapped out in a rough sense in the simulation software and used for long-term periods of consideration.
  • The frequent adjustments of the components and their parameterizations in the models need to be simplified by means of interfaces between the energy management systems and other company software. On the output side, for example, interfaces between simulation data and life cycle assessment software require improvement. This would make it possible to carry out a large number of simulation studies and compare the results more efficiently.
  • Two other general areas requiring further development have been identified in the context of simulation-based evaluations of use cases:
  • The use cases are not exhaustive and could be expanded. For example, there are opportunities to use or sell the oxygen produced from electrolysis. The use of the waste heat from the electrolyzer and fuel cell should also be analyzed in more detail. Furthermore, combinations of different use cases should be analyzed for individual energy systems, such as the simultaneous use of fuel cells and mobility applications, for example. The fuel cell may also be used for emergency power supply.
  • The use cases need to be subjected to a comprehensive economic analysis. This evaluation should cover funding opportunities and price developments in relation to the technologies and regional, national, and international hydrogen markets. The results of the analysis will serve as the basis for make-or-buy decisions, as well as the self-consumption vs. the sale of energy. The electrolyzer and fuel cell can also offer flexibility for power grids, thus possibly increasing economic efficiency through additional revenues.
On-site production of green hydrogen provides a medium- and long-term storage option that can supplement short-term battery storage. The results show that if manufacturing companies incorporate hydrogen into their processes as an energy carrier, this significantly expands their scope for action in terms of energy management. In existing plants, the hydrogen utilization paths can offer more flexibility in responding to short- and medium-term influences, such as market prices, existing energy supply from renewable energy sources at the site, and deviations in the energy consumed by the production system. As many energy technologies are now available as container solutions [42,43], it is possible to expand plants as needed, provided that all required technical connections are available, e.g., power and water supply and pipe systems for transporting hydrogen and heat. This enables companies to adapt their energy systems to external influences such as price developments and the availability of energy sources and to internal developments such as adjustments in the production program or changes in the energy procurement strategy. In this way, energy supply systems will be sufficiently flexible and adaptable to meet future challenges, much like the production systems described by Wiendahl et al. [44] and Nyhuis et al. [45], for example. In light of the challenges arising in relation to energy prices and greenhouse gas emission reduction targets as described in Section 1, these measures could play an important role in maintaining the competitiveness of manufacturing companies.

Author Contributions

Conceptualization, V.K., V.E., K.A. and S.R.; Data curation, V.E.; Funding acquisition, A.H.; Methodology, V.K., V.E., K.A. and S.R.; Project administration, V.K.; Software, V.K., V.E. and K.A.; Supervision, A.H.; Validation, V.K., V.E., K.A. and S.R.; Visualization, V.K.; Writing—original draft, V.K., V.E., K.A. and S.R.; Writing—review & editing, A.H. All authors have read and agreed to the published version of the manuscript.

Funding

This research was funded by the Bavarian Research Foundation (Bayerische Forschungsstiftung, Munich, Germany), grant number AZ-1500-21.

Data Availability Statement

The authors will provide access to the data presented in this study on request. It is not publicly available due to non-disclosure reasons.

Acknowledgments

The authors would like to thank the Bavarian Research Foundation for funding the research. The results presented in this paper have been achieved in the course of the project “H2StorFa—Decentral use of hydrogen as energy storage at factory sites” (German: Dezentrale Nutzung von Wasserstoff als Energiespeicher an Fabrikstandorten). Further thanks are due to the project partners involved, as it would not have been possible to acquire the results described above without their cooperation: Bayernwerk Natur GmbH, Fronius International GmbH, H-Tec Systems GmbH, Industrie- und Handelskammer IHK Schwaben, KESSEL AG, Müller Produktions GmbH, Ostermeier H2ydrogen Solutions GmbH, Proton Motor Fuel Cell GmbH.

Conflicts of Interest

The authors declare no conflict of interest.

References

  1. BDEW Bundesverband der Energie- und Wasserwirtschaft e.V. BDEW-Strompreisanalyse Dezember 2022: Haushalte und Industrie. 2022. Available online: https://www.bdew.de/service/daten-und-grafiken/bdew-strompreisanalyse/ (accessed on 2 February 2023).
  2. Deutscher Industrie- und Handelskammertag. Hohe Strom- und Gaspreise Belasten Wirtschaft Massiv: DIHK-Unternehmensumfrage. 2021. Available online: https://www.dihk.de/resource/blob/61666/38665d703678c137fa95c8b28d8c8d3f/strom-gaspreis-umfrage-data.pdf (accessed on 21 March 2022).
  3. BDEW—Bundesverband der Energie- und Wasserwirtschaft e.V. Erdgas: Zahlen, Daten, Fakten; BDEW: Berlin, Germany, 2019. [Google Scholar]
  4. Deutscher Bundestag. Bundes-Klimaschutzgesetz: KSG; Deutscher Bundestag: Berlin, Germany, 2021. [Google Scholar]
  5. Neugebauer, R. (Ed.) Wasserstofftechnologien, 1st ed.; Springer: Berlin/Heidelberg, Germany, 2022; ISBN 978-3-662-64834-6. [Google Scholar]
  6. Deutscher Industrie- und Handelskammertag. Wasserstoff-DIHK-Faktenpapier. 2020. Available online: https://www.ihk.de/blueprint/servlet/resource/blob/4827334/91b01c35285997020b1cf61497909ce5/faktenpapier-wasserstoff-1--data.pdf (accessed on 11 November 2022).
  7. Sterner, M.; Specht, M. Power-to-Gas and Power-to-X—The History and Results of Developing a New Storage Concept. Energies 2021, 14, 6594. [Google Scholar] [CrossRef]
  8. International Energy Agency (IEA). Technology Roadmap: Hydrogen and Fuel Cells. 2015. Available online: https://iea.blob.core.windows.net/assets/e669e0b6-148c-4d5c-816b-a7661301fa96/TechnologyRoadmapHydrogenandFuelCells.pdf (accessed on 16 November 2022).
  9. Hebling, C.; Ragwitz, M.; Fleiter, T.; Groos, U.; Härle, D.; Held, A.; Jahn, M.; Müller, N.; Pfeifer, T.; Plötz, P.; et al. Eine Wasserstoff-Roadmap für Deutschland. 2019. Available online: https://www.ieg.fraunhofer.de/content/dam/ieg/documents/pressemitteilungen/2019-10_Fraunhofer_Wasserstoff-Roadmap_fuer_Deutschland.pdf (accessed on 16 November 2022).
  10. Breyer, C.; Khalili, S.; Bogdanov, D.; Ram, M.; Oyewo, A.S.; Aghahosseini, A.; Gulagi, A.; Solomon, A.A.; Keiner, D.; Lopez, G.; et al. On the History and Future of 100% Renewable Energy Systems Research. IEEE Access 2022, 10, 78176–78218. [Google Scholar] [CrossRef]
  11. Bundesministerium für Wirtschaft und Klimaschutz. Die Nationale Wasserstoffstrategie. Available online: https://www.bmwi.de/Redaktion/DE/Publikationen/Energie/die-nationale-wasserstoffstrategie.html (accessed on 13 March 2022).
  12. DIHK. Energiewende-Barometer 2021 der IHK-Organisation: Unternehmensumfrage zur Umsetzung der Energiewende, Berlin. 2021. Available online: https://www.dihk.de/resource/blob/58460/aca53bacc14cea080320089a6c57214b/energiewende-barometer-2021-data.pdf (accessed on 22 November 2022).
  13. Project H2StorFa. Available online: https://www.igcv.fraunhofer.de/de/forschung/referenzprojekte/wasserstoff_gruen_energie_industrie_h2storfa.html (accessed on 18 November 2022).
  14. Ringkjøb, H.-K.; Haugan, P.M.; Solbrekke, I.M. A review of modelling tools for energy and electricity systems with large shares of variable renewables. Renew. Sustain. Energy Rev. 2018, 96, 440–459. [Google Scholar] [CrossRef]
  15. DeCarolis, J.; Daly, H.; Dodds, P.; Keppo, I.; Li, F.; McDowall, W.; Pye, S.; Strachan, N.; Trutnevyte, E.; Usher, W.; et al. Formalizing best practice for energy system optimization modelling. Appl. Energy 2017, 194, 184–198. [Google Scholar] [CrossRef]
  16. Guo, X.; Sepanta, M. Evaluation of a new combined energy system performance to produce electricity and hydrogen with energy storage option. Energy Rep. 2021, 7, 1697–1711. [Google Scholar] [CrossRef]
  17. Fu, P.; Pudjianto, D.; Zhang, X.; Strbac, G. Integration of Hydrogen into Multi-Energy Systems Optimisation. Energies 2020, 13, 1606. [Google Scholar] [CrossRef]
  18. Ince, A.C.; Colpan, C.O.; Hagen, A.; Serincan, M.F. Modeling and simulation of Power-to-X systems: A review. Fuel 2021, 304, 121354. [Google Scholar] [CrossRef]
  19. Imdahl, C.; Blume, C.; Blume, S.; Zellmer, S.; Gensicke, M.; Herrmann, C. Potentials of Hydrogen Technologies for Sustainable Factory Systems. Procedia CIRP 2021, 98, 583–588. [Google Scholar] [CrossRef]
  20. Schulz, J.; Leinmüller, D.; Misik, A.; Zaeh, M.F. Renewable On-Site Power Generation for Manufacturing Companies—Technologies, Modeling, and Dimensioning. Sustainability 2021, 13, 3898. [Google Scholar] [CrossRef]
  21. Kuhlmann, T.; Bauernhansl, T. Method for Designing an Energy-agile Energy System for Industrial Manufacturing. Procedia CIRP 2015, 29, 179–184. [Google Scholar] [CrossRef]
  22. Kuhlmann, T. Methode zur Gestaltung der energetischen Wandlungsfähigkeit in Fabriken; Fraunhofer Verlag: Stuttgart, Germany, 2020; ISBN 978-3-8396-1596-6. [Google Scholar]
  23. Thiede, S.; Herrmann, C.; Kara, S. State of Research and an innovative Approach for simulating Energy Flows of Manufacturing Systems. In Glocalized Solutions for Sustainability in Manufacturing; Springer: Berlin/Heidelberg, Germany, 2011; pp. 335–340. [Google Scholar] [CrossRef]
  24. Schmeling, L.; Buchholz, A.A.I.; Heineke, H.; Klement, P.; Hanke, B.; von Maydell, K. Planning, Optimisation and Evaluation of Small Power-to-Gas-to-Power Systems: Case Study of a German Dairy. Sustainability 2022, 14, 6050. [Google Scholar] [CrossRef]
  25. NOW GmbH. HyLand—Wasserstoffregionen in Deutschland. Available online: https://www.hy.land/ (accessed on 18 November 2022).
  26. Stadt Straßburg. Energieregion Staßfurt: Grüne Energie aus der Region für die Region. Available online: https://www.stassfurt.de/de/wirtschaftsstandort/energieregion-stassfurt.html (accessed on 23 June 2022).
  27. Birth, T.; Scheffler, M.; Eggers, N. HyPerFerment—Ein Neues Verfahren zur mikrobiologischen Wasserstofferzeugung. In Proceedings of the 6. Info-Veranstaltung zum Klimaschutz—Schwerpunkt Landwirtschaft und Bioenergie—Zukunft der Biogasanlagen, Online, 12 March 2021. [Google Scholar] [CrossRef]
  28. Bundesministerium für Bildung und Forschung. Living Laboratory—Demonstration eines kopmlett reinen Wasserstoff-Brennstoffzellen-Systems. Available online: https://www.fenes.net/forschung/energiespeicher/laufende-projekte/livingh2 (accessed on 18 November 2022).
  29. Khalid, F.; Dincer, I.; Rosen, M.A. Analysis and assessment of an integrated hydrogen energy system. Int. J. Hydrog. Energy 2016, 41, 7960–7967. [Google Scholar] [CrossRef]
  30. HYPOS East Germany. LocalHy. Available online: https://www.hypos-eastgermany.de/wasserstoffprojekte/zwanzig20/chemische-umwandlung/localhy/ (accessed on 23 June 2022).
  31. Bhandari, R.; Shah, R.R. Hydrogen as energy carrier: Techno-economic assessment of decentralized hydrogen production in Germany. Renew. Energy 2021, 177, 915–931. [Google Scholar] [CrossRef]
  32. Dawood, F.; Anda, M.; Shafiullah, G.M. Hydrogen production for energy: An overview. Int. J. Hydrog. Energy 2020, 45, 3847–3869. [Google Scholar] [CrossRef]
  33. Griffiths, S.; Sovacool, B.K.; Kim, J.; Bazilian, M.; Uratani, J.M. Industrial decarbonization via hydrogen: A critical and systematic review of developments, socio-technical systems and policy options. Energy Res. Soc. Sci. 2021, 80, 102208. [Google Scholar] [CrossRef]
  34. Qazi, U.Y. Future of Hydrogen as an Alternative Fuel for Next-Generation Industrial Applications; Challenges and Expected Opportunities. Energies 2022, 15, 4741. [Google Scholar] [CrossRef]
  35. Roth, S.; Sultani, D.; Artmann, I.; Klement, T.; Angerer, K.; Bank, L. Dekarbonisierung der Produktion: Ansätze und Anwendungsfälle für die nachhaltige Produktionsplanung und Brennstoffversorgung. ZWF Z. Wirtsch. Fabr. 2022, 117, 109–116. [Google Scholar] [CrossRef]
  36. Ulrich, P.; Hill, W. Wissenschaftstheoretische Grundlagen der Betriebswirtschaftslehre (Teil I). WiST Z. Ausbild. Hochschulkontakt 1976, 304–309. [Google Scholar]
  37. GFaI Gesellschaft zur Förderung angewandter Informatik e.V. TOP-Energy. Available online: https://www.top-energy.de/ (accessed on 18 November 2022).
  38. Bundesministerium der Justiz. Gesetz für den Ausbau Erneuerbarer Energien—Erneuerbare-Energien-Gesetz: EEG 2021; Bundesministerium der Justiz: Berlin, Germany, 2021.
  39. Kost, C.; Shammugam, S.; Fluri, V.; Peper, D.; Memar, A.D.; Schlegl, T. Stromgestehungskosten erneuerbare Energien: Juni 2021, Freiburg. 2021. Available online: https://www.ise.fraunhofer.de/content/dam/ise/de/documents/publications/studies/DE2021_ISE_Studie_Stromgestehungskosten_Erneuerbare_Energien.pdf (accessed on 1 June 2022).
  40. Statista. Durchschnittlicher Dieselpreis bis 2022. Available online: https://de.statista.com/statistik/daten/studie/779/umfrage/durchschnittspreis-fuer-dieselkraftstoff-seit-dem-jahr-1950/ (accessed on 20 March 2022).
  41. Hydrogen: A Renewable Energy Perspective: Report Prepared for the 2nd Hydrogen Energy Ministerial Meeting in Tokyo, Japan. 2019. Available online: https://www.irena.org/-/media/Files/IRENA/Agency/Publication/2019/Sep/IRENA_Hydrogen_2019.pdf (accessed on 2 June 2022).
  42. Philipp, M.; Collath, N.; Roth, S.; Theumer, P.; Will-Ehlers, G.; Kellermann, M.; Hesse, H. Batteriespeicherlösungen zur energiewirtschaftlichen Optimierung von Industriebetrieben. ZWF Z. Wirtsch. Fabr. 2022, 117, 305–311. [Google Scholar] [CrossRef]
  43. Karlsruher Institut für Technologie KIT. Energy Lab 2.0 Produces System Knowledge for the Energy Transition. In lookKIT—The Magazine for Research, Teaching, Innovation; Karlsruher Institut für Technologie KIT: Karlsruhe, Germany, 2020. [Google Scholar]
  44. Wiendahl, H.-P.; El Maraghy, H.A.; Nyhuis, P.; Zäh, M.F.; Wiendahl, H.-H.; Duffie, N.; Brieke, M. Changeable Manufacturing—Classification, Design and Operation. CIRP Ann. Manuf. Technol. 2007, 56, 783–809. [Google Scholar] [CrossRef]
  45. Nyhuis, P.; Reinhart, G.; Abele, E. Wandlungsfähige Produktionssysteme: Heute die Industrie von morgen gestalten; PZH Produktionstechnisches Zentrum: Garbsen, Germany, 2008; ISBN 978-3-939026-96-9. [Google Scholar]
Figure 1. Method for developing and evaluating industrial hydrogen energy supply systems.
Sustainability 15 02994 g001
Figure 2. Screenshot of the simulation model scheme for utilisation path 1 in TOP-Energy®.
Sustainability 15 02994 g002
Figure 3. Power supply composition for dimensioning variants where P_PV,peak = 750 kWp.
Sustainability 15 02994 g003
Figure 4. Hydrogen production for dimensioning configurations where P_PV,peak = 750 kWp and 1000 kWp.
Sustainability 15 02994 g004
Figure 5. Hydrogen system component full-load hours for dimensioning variants where P_PV,peak = 750 kWp.
Sustainability 15 02994 g005
Figure 6. Investment cost situation for dimensioning configurations where P_PV,peak = 750 kWp and 1000 kW.
Sustainability 15 02994 g006
Figure 7. Electricity production costs for dimensioning variants where P_PV,peak = 750 kWp and 1000 kWp. (1) Average German industrial electricity price for new contracts in the second half of 2022: 54.90 ct/kWh [1]; (2) Electricity price assumed for the simulated use case: 17.38 ct/kWh; (3) Electricity cost range for PV battery storage systems with a ratio of PPV,Peak to Wbat of 2:1: 1.5 to 4.5 ct/kWh [39].
Sustainability 15 02994 g007
Figure 8. Fuel cost of hydrogen mobility applications for systems dimensions where P_PV,peak = 750 kWp and 1000 kW. (1) Reference fuel cost per trip distance for diesel passenger cars in 2021.
Sustainability 15 02994 g008
Figure 9. Hydrogen production costs for systems dimensions where PPV,peak = 750 kWp and 1000 kWp.
Sustainability 15 02994 g009
Figure 10. Global warming potential per energy supply system in (t CO2 eq./year)—utilization path 1 (hydrogen as energy storage).
Sustainability 15 02994 g010
Figure 11. Global warming potential per kWh electricity in (t CO2 eq./kWh electricity)—utilization path 1 (hydrogen as energy storage).
Sustainability 15 02994 g011
Figure 12. Global warming potential per unit of distance traveled (vehicle type: passenger car) in (t CO2 eq./km)—utilization pathway 2 (hydrogen mobility).
Sustainability 15 02994 g012
Figure 13. Global warming potential per kg hydrogen in (t CO2 eq./kg hydrogen)—utilization pathway 3 (direct use of hydrogen).
Sustainability 15 02994 g013
Table 1. Nominal power ratings for electrolyzers and fuel cells with different PV system sizes.
Peak PV PowerNominal Electrolyzer PowerNominal Fuell Cell PowerSelf-Consumption Rate
300 kWp200 kW5 kW99.77%
500 kWp300 kW10 kW99.87%
750 kWp500 kW30 kW99.97%
1000 kWp700 kW75 kW99.01%
Table 2. Electricity self-sufficiency for component dimensions with a peak PV power of 750 kW.
P_Pv,Peak = 750 kW
P_el,El = 0 kW P_el,FC = 0 kW
W_Bat = 0 kWh
P_el,EL = 500 kW, P_el,FC = 30 kW
W_Bat = 0 kWhW_Bat = 375 kWhW_Bat = 750 kWh
Electricity self-sufficiency40.4%59.7%60.9%61.9%
Disclaimer/Publisher’s Note: The statements, opinions and data contained in all publications are solely those of the individual author(s) and contributor(s) and not of MDPI and/or the editor(s). MDPI and/or the editor(s) disclaim responsibility for any injury to people or property resulting from any ideas, methods, instructions or products referred to in the content.

