Does Climate Change Affect Rapeseed Production in Exporting and Importing Countries? Evidence from Market Dynamics Syntheses
Abstract
1. Introduction
2. Materials and Methods
2.1. Study Area
2.2. Data Sources and Acquisition
2.2.1. Baseline Data
2.2.2. Projected Data
2.3. Analytical Techniques
Supply and Demand Mechanism
3. Results
3.1. Estimation of Functions of the Supply and Demand Model
3.2. Projection Scenario
Rapeseed Supply and Demand Scenario under Different RCPs and SSPs
4. Discussion
5. Conclusions and Policy Implications
Author Contributions
Funding
Institutional Review Board Statement
Informed Consent Statement
Data Availability Statement
Acknowledgments
Conflicts of Interest
Appendix A


| Variables | Levels | 1st Differences | Variables | Levels | 1st Differences | ||||
|---|---|---|---|---|---|---|---|---|---|
| ADF | PP | ADF | PP | ADF | PP | ADF | PP | ||
| Canada | |||||||||
| MayT | –3.84 ** | –3.81 ** | –3.91 ** | –23.36 *** | MayR | –5.68 *** | –6.68 *** | –4.61 *** | –23.40 *** |
| JunT | –3.73 ** | –3.63 ** | –5.19 *** | –19.22 *** | JunR | –5.74 *** | –7.99 *** | –5.82 *** | –16.12 *** |
| JulT | –4.01 *** | –9.83 *** | –4.84 *** | –21.30 *** | JulR | –4.69 *** | –5.12 *** | –6.59 *** | –17.01 *** |
| AugT | –4.68 *** | –4.67 *** | –4.50 *** | –9.38 *** | AugR | –6.20 *** | –6.96 *** | –4.36 *** | –12.19 *** |
| SepT | –4.38 ** | –4.87 *** | –5.89 *** | –11.08 *** | SepR | –4.81 *** | –4.81 *** | –7.40 *** | –16.16 *** |
| OctT | –5.25 *** | –13.34 *** | –4.63 *** | –17.62 *** | OctR | –5.38 *** | –5.66 *** | –8.16 *** | –14.50 *** |
| China | |||||||||
| JanT | –2.35 | –5.73 *** | –2.60 | –18.99 *** | JanR | –6.88 *** | –6.83 *** | –6.74 *** | –39.38 *** |
| FebT | –6.46 *** | –6.78 *** | –4.99 *** | –24.69 *** | FebR | –4.16 ** | –4.17 ** | –5.78 *** | –19.71 *** |
| MarT | –3.42 * | –3.40 * | –3.63 * | –9.95 *** | MarR | –4.38 *** | –4.40 *** | –4.29 ** | –9.06 *** |
| AprT | –4.01 ** | –4.40 *** | –4.81 *** | –17.32 *** | AprR | –5.28 *** | –5.35 *** | –5.86 *** | –17.87 *** |
| MayT | –3.40 * | –6.92 *** | –4.37 ** | –18.23 *** | MayR | –6.43 *** | –7.38 *** | –5.90 *** | –23.14 *** |
| NovT | –4.94 *** | –5.40 *** | –7.09 *** | –15.88 *** | NovR | –9.58 *** | –11.72 *** | –4.47 *** | –15.36 *** |
| DecT | –4.30 ** | –6.15 *** | –3.63 * | –30.74 *** | DecR | –5.45 *** | –6.35 *** | –6.82 *** | –19.97 *** |
| U.S. | |||||||||
| JanT | –3.10 | –6.97 *** | –5.26 *** | –43.73 *** | JanR | –5.10 *** | –5.69 *** | –5.14 *** | –20.38 *** |
| FebT | –5.81 *** | –6.04 *** | –7.44 *** | –20.11 *** | FebR | –3.12 | –7.03 *** | –5.32 *** | –15.31 *** |
| MarT | –5.83 *** | –12.65 *** | –5.36 *** | –26.72 *** | MarR | –4.24 *** | –8.38 *** | –4.52 *** | –25.52 *** |
| AprT | –2.20 | –6.70 *** | –8.06 *** | –29.94 *** | AprR | –7.48 *** | –7.47 *** | –4.24 *** | –26.84 *** |
| MayT | –6.61 *** | –6.61 *** | –6.73 *** | –46.68 *** | MayR | –6.94 *** | –6.95 *** | –4.25 *** | –45.91 *** |
| JunT | –2.54 | –5.83 *** | –3.33 * | –18.47 *** | JunR | –6.31 *** | –9.91 *** | –6.14 *** | –43.85 *** |
| JulT | –4.69 *** | –4.22 *** | –3.28 * | –11.19 *** | JulR | –7.19 *** | –7.19 *** | –5.45 *** | –26.21 *** |
| OctT | –5.72 *** | –6.56 *** | –3.14 | –36.33 *** | OctR | –4.74 *** | –14.22 *** | –4.76 *** | –31.37 *** |
| NovT | –5.27 *** | –6.52 *** | –6.41 *** | –32.34 *** | NovR | –1.72 | –10.12 *** | –5.16 *** | –48.73 *** |
| DecT | –5.67 *** | –7.53 *** | –8.21 *** | –29.44 *** | DecR | –2.73 | –6.61 *** | –10.83 *** | –11.88 *** |
| Bangladesh | |||||||||
| JanT | –6.69 *** | –8.45 *** | –6.70 *** | –24.19 *** | JanR | –7.72 *** | –15.01 *** | –5.64 *** | –26.05 *** |
| FebT | –5.17 *** | –5.61 *** | –7.36 *** | –14.11 *** | FebR | –4.64 *** | –4.64 *** | –8.16 *** | –15.16 *** |
| NovT | –4.30 ** | –4.38 *** | –5.60 *** | –11.97 *** | NovR | –5.49 *** | –12.11 *** | –4.25 ** | –20.06 *** |
| DecT | –4.08 ** | –4.07 *** | –5.91 *** | –12.20 *** | DecR | –5.26 *** | –5.58 *** | –4.88 *** | –11.25 *** |
| Year | Area (Million ha) | Exports (Million MT) | Imports (Million MT) | Per Capita Consumption (Kg Year−1 Person−1) | ||||||||
|---|---|---|---|---|---|---|---|---|---|---|---|---|
| Canada | China | U.S. | Bangladesh | Canada | China | U.S. | Bangladesh | Canada | China | U.S. | Bangladesh | |
| 2019 | 9.3552 | 6.6957 | 0.7881 | 0.3121 | 8.6643 | 1.6020 | 0.8053 | 0.1186 | 16.6179 | 1.4833 | 1.6426 | 0.8771 |
| 2020 | 9.8373 | 7.2325 | 0.8522 | 0.3204 | 10.2614 | 1.2005 | 0.7566 | 0.1183 | 17.2643 | 1.6529 | 1.6777 | 0.9304 |
| 2021 | 9.9102 | 7.0046 | 0.8842 | 0.3187 | 10.1516 | 1.3536 | 0.7731 | 0.1255 | 18.0681 | 1.5313 | 1.6983 | 0.9558 |
| 2022 | 9.7700 | 7.0300 | 0.8922 | 0.3153 | 9.5983 | 1.3231 | 0.7907 | 0.1266 | 18.3601 | 1.5801 | 1.7035 | 0.9529 |
| 2023 | 9.7384 | 7.0333 | 0.8942 | 0.3154 | 9.5645 | 1.3259 | 0.7951 | 0.1243 | 18.5343 | 1.5683 | 1.7048 | 0.9507 |
| 2024 | 9.7915 | 6.8745 | 0.8947 | 0.3166 | 9.7456 | 1.3258 | 0.7962 | 0.1217 | 18.8648 | 1.5699 | 1.7051 | 0.9493 |
| 2025 | 9.8189 | 6.6061 | 0.8542 | 0.3177 | 9.7799 | 1.3258 | 0.7965 | 0.1194 | 19.2547 | 1.5698 | 1.7052 | 0.9483 |
| 2026 | 9.8146 | 6.9776 | 0.8762 | 0.3186 | 9.7230 | 1.3259 | 0.7965 | 0.1175 | 19.5994 | 1.5456 | 1.7052 | 0.9475 |
| 2027 | 9.8149 | 7.0890 | 0.8902 | 0.3194 | 9.7045 | 1.3258 | 0.7863 | 0.1161 | 19.9183 | 1.5559 | 1.7052 | 0.9469 |
| 2028 | 9.8266 | 7.0226 | 0.8937 | 0.3200 | 9.7216 | 1.3258 | 0.7940 | 0.1150 | 20.2496 | 1.5681 | 1.7052 | 0.9494 |
| 2029 | 9.8380 | 6.9792 | 0.8810 | 0.3204 | 9.7301 | 1.3361 | 0.7959 | 0.1141 | 20.5912 | 1.5599 | 1.7052 | 0.9484 |
| 2030 | 9.8455 | 6.8379 | 0.8750 | 0.3207 | 9.7253 | 1.3698 | 0.7964 | 0.1135 | 20.9299 | 1.5728 | 1.7052 | 0.9476 |
| 2031 | 9.8525 | 6.8194 | 0.8735 | 0.3210 | 9.7219 | 1.3008 | 0.7931 | 0.1130 | 21.2648 | 1.5694 | 1.7052 | 0.9479 |
| 2032 | 9.8609 | 6.8909 | 0.8867 | 0.3212 | 9.7349 | 1.3321 | 0.7923 | 0.1126 | 21.6003 | 1.5618 | 1.7052 | 0.9482 |
| 2033 | 9.8694 | 7.0297 | 0.8883 | 0.3214 | 9.7318 | 1.3252 | 0.7921 | 0.1123 | 21.9373 | 1.5571 | 1.7052 | 0.9485 |
| 2034 | 9.8775 | 7.0303 | 0.8833 | 0.3215 | 9.7209 | 1.3259 | 0.7954 | 0.1121 | 22.2742 | 1.5632 | 1.7052 | 0.9480 |
| 2035 | 9.8855 | 6.9466 | 0.8765 | 0.3216 | 9.7207 | 1.3258 | 0.7951 | 0.1119 | 22.6108 | 1.5680 | 1.7052 | 0.9479 |
| 2036 | 9.8935 | 6.8789 | 0.8784 | 0.3216 | 9.7268 | 1.3258 | 0.7939 | 0.1117 | 22.9473 | 1.5736 | 1.7052 | 0.9482 |
| 2037 | 9.9016 | 6.8494 | 0.8829 | 0.3217 | 9.7288 | 1.3284 | 0.7925 | 0.1116 | 23.2841 | 1.5674 | 1.7052 | 0.9482 |
| 2038 | 9.9096 | 6.9133 | 0.8861 | 0.3217 | 9.7270 | 1.3394 | 0.7933 | 0.1116 | 23.6209 | 1.5680 | 1.7052 | 0.9481 |
| 2039 | 9.9175 | 6.9836 | 0.8827 | 0.3218 | 9.7261 | 1.3331 | 0.7942 | 0.1115 | 23.9578 | 1.5628 | 1.7052 | 0.9480 |
| 2040 | 9.9255 | 7.0022 | 0.8794 | 0.3218 | 9.7270 | 1.3347 | 0.7948 | 0.1115 | 24.2947 | 1.5607 | 1.7052 | 0.9481 |

References
- EEA. Climate Change Adaptation in the Agriculture Sector in Europe, EEA Report No 4/2019, European Environment Agency. 2019. Available online: https://www.eea.europa.eu/publications/cc-adaptation-agriculture (accessed on 19 November 2020).
- EEA. The European Environment—State and Outlook 2020, European Environment Agency. 2020. Available online: https://www.eea.europa.eu/soer/2020 (accessed on 19 November 2020).
- Chengula, L.K. Exploring the Agricultural Innovation Continuum—The Case of Kenya Climate Smart Agriculture Project. In Agriculture Global Practice; The World Bank Group, World Bank: Washington, DC, USA, 2018. [Google Scholar]
- INFOODS. International Food Composition Table/Database Directory. FAO. 2022. Available online: https://www.fao.org/infoods/infoods/tables-and-databases/faoinfoods-databases/en/ (accessed on 30 April 2022).
- WHO. Fact Sheets: Healthy Diet. World Health Organization. Available online: https://www.who.int/news-room/fact-sheets/detail/healthy-diet (accessed on 30 April 2022).
- Obaideen, K. Contribution of Vegetable Oils towards Sustainable Development Goals: A Comparative Analysis. In Policy Analysis and Development Agency; Ministry of Foreign Affairs of The Republic of Indonesia: Jakarta, Indonesia, 2020. Available online: https://kemlu.go.id/download/L3NpdGVzL3B1c2F0L0RvY3VtZW50cy9LYWppYW4lMjBCUFBLL1AzSyUyME9JLU1VTFRJTEFURVJBTC8yMV9Db250cmlidXRpb25fb2ZfVmVnZXRhYmxlX09pbHNfdG93YXJkc19TdXN0YWluYWJsZV9EZXZlbG9wbWVudF9Hb2Fsc19BX0NvbXBhcmF0aXZlX0FuYWx5c2lzLnBkZg== (accessed on 23 January 2022).
- OECD-FAO. Agricultural Outlook 2020–2029. World Oilseed Projections. 2020. Available online: https://www.oecd-ilibrary.org/agriculture-and-food/data/oecd-agriculture-statistics_agr-data-en (accessed on 11 January 2022).
- Villanueva-Mejia, D.; Alvarez, J.C. Genetic improvement of oilseed crops using modern biotechnology. Adv. Seed Biol. 2017, 295–317. [Google Scholar] [CrossRef]
- Lu, C.; Napier, J.A.; Clemente, T.E.; Cahoon, E.B. New frontiers in oilseed biotechnology: Meeting the global demand for vegetable oils for food, feed, biofuel, and industrial applications. Cur. Opin. Biotech. 2011, 22, 252–259. [Google Scholar] [CrossRef] [PubMed]
- AgMRC. Grain and Oilseeds: Rapeseed. Agricultural Marketing Resource Center. 2022. Available online: https://www.agmrc.org/commodities-products/grains-oilseeds/rapeseed (accessed on 7 February 2022).
- Jaime, R.; Alcántara, J.M.; Manzaneda, A.J.; Rey, P.J. Climate change decreases suitable areas for rapeseed cultivation in Europe but provides new opportunities for white mustard as an alternative oilseed for biofuel production. PLoS ONE 2018, 13, e0207124. [Google Scholar] [CrossRef] [PubMed]
- D’Odorico, P.; Davis, K.F.; Rosa, L.; Carr, J.A.; Chiarelli, D.; Dell’Angelo, J.; Gephart, J.; MacDonald, G.K.; Seekell, D.A.; Suweis, S.; et al. The Global Food-Energy-Water Nexus. Rev. Geophys. 2018, 56, 456–531. [Google Scholar] [CrossRef]
- FAO. The Future of Food and Agriculture—Trends and Challenges. Rome. 2017. Available online: https://www.fao.org/3/i6583e/i6583e.pdf (accessed on 20 January 2022).
- FAOSTAT. FAO Statistical Database. 2019. Available online: https://www.fao.org/faostat/en/#data/FBS (accessed on 23 July 2021).
- Canola Council. Growing Canola. 2021. Available online: https://www.canolacouncil.org/growing-canola/ (accessed on 10 December 2021).
- Pahl, G. Biodiesel: Growing a New Energy Economy; Chelsea Green Publishing Company: Hartford, VT, USA, 2008. [Google Scholar]
- Pirjo, P.-S.; Kaija, H.; Lauri, J.; Kimmo, R. Comparing regional risks in producing turnip rape and oilseed rape—Impacts of climate change and breeding. Acta Agric. Scand. Sect. B Soil Plant Sci. 2009, 59, 129–138. [Google Scholar] [CrossRef]
- Pullens, J.W.M.; Sharif, B.; Trnka, M.; Balek, J.; Semenov, M.A.; Olesen, J.E. Risk factors for European winter oilseed rape production under climate change. Agric. For. Meteorol. 2019, 272, 30–39. [Google Scholar] [CrossRef]
- Qian, B.; Zhang, X.; Smith, W.; Grant, B.; Jing, Q.; Cannon, A.J.; Neilsen, D.; McConkey, B.; Li, G.; Bonsal, B. Climate change impacts on Canadian yields of spring wheat, canola and maize for global warming levels of 1.5 C, 2.0 C, 2.5 C and 3.0 C. Environ. Res. Lett. 2019, 14, 074005. [Google Scholar] [CrossRef]
- Wu, W.; Ma, B.L.; Whalen, J.K. Chapter Three—Enhancing Rapeseed Tolerance to Heat and Drought Stresses in a Changing Climate: Perspectives for Stress Adaptation from Root System Architecture. Adv. Agron. 2018, 151, 87–157. [Google Scholar] [CrossRef]
- Tabassum, T. How Falling International Oil Prices Are Affecting Bangladesh? Light Castle Analytics Wing. 2015. Available online: https://www.lightcastlebd.com/insights/2015/05/how-bangladesh-economy-is-experiencing-falling-international-oil-price/ (accessed on 23 January 2022).
- Ishikawa-Ishiwata, Y.; Furuya, J. Interlocal Adaptations to Climate Change in East and Southeast Asia. Sharing Lessons of Agriculture, Disaster Risk Reduction, and Resource Management. In Springer Briefs in Climate Studies; Springer: Berlin/Heidelberg, Germany, 2022. [Google Scholar] [CrossRef]
- Salam, M.A.; Furuya, J.; Kobayashi, S. Climate effect on supply and market price stability of rice in Bangladesh: Assessment of climate and socioeconomic scenarios. Jpn. J. Agric. Econ. 2017, 19, 60–65. [Google Scholar] [CrossRef][Green Version]
- Hung, C.; Zhou, L.; Furuya, J. Climate change effects on supply and demand of rice in India. Jpn. Agric. Res. Q. 2018, 52, 255–272. [Google Scholar] [CrossRef]
- Ishikawa-Ishiwata, Y.; Furuya, J. Soybean Rust and Resistant Cultivar Effects on Global Soybean Supply and Demand. Jpn. Agric. Res. Q. JARQ 2021, 55, 59–67. [Google Scholar] [CrossRef]
- Jannat, A.; Ishikawa-Ishiwata, Y.; Furuya, J. Assessing the Impacts of Climate Variations on the Potato Production in Bangladesh: A Supply and Demand Model Approach. Sustainability 2021, 13, 5011. [Google Scholar] [CrossRef]
- Furuya, J.; Meyer, S.D.; Kageyama, M.; Jin, S. Development of Supply and Demand Models for Rice in Lower Mekong River Basin Countries: RENEW-Mekong; JIRCAS Working Report, 68; JIRCAS: Tsukuba, Japan, 2010; pp. 1–72. [Google Scholar]
- Fridrihsone, A.; Romagnoli, F.; Cabulis, U. Environmental Life Cycle Assessment of Rapeseed and Rapeseed Oil Produced in Northern Europe: A Latvian Case Study. Sustainability 2020, 12, 5699. [Google Scholar] [CrossRef]
- Svanes, E.; Waalen, W.; Uhlen, A.K. Environmental Impacts of Rapeseed and Turnip Rapeseed Grown in Norway, Rape Oil and Press Cake. Sustainability 2020, 12, 10407. [Google Scholar] [CrossRef]
- Forleo, M.B.; Palmieri, N.; Suardi, A.; Coaloa, D.; Pari, L. The eco-efficiency of rapeseed and sunflower cultivation in Italy. Joining environmental and economic assessment. J. Clean. Prod. 2018, 172, 3138–3153. [Google Scholar] [CrossRef]
- Flénet, F.; Wagner, D.; Simonin, P. Examination of an attempt to improve rapeseed cultivation in France in order to reduce the greenhouse gas emissions of biodiesel. OCL 2020, 27, 69. [Google Scholar] [CrossRef]
- Holzworth, D.P.; Huth, N.I. APSIM-evolution towards a new generation of agricultural systems simulation. Environ. Model. Softw. 2014, 62, 327–350. [Google Scholar] [CrossRef]
- Tang, Q.H.; Yin, Y.; Liu, X. A multi-model analysis of change in potential yield of major crops in China under climate change. Earth Syst. Dyn. 2015, 6, 45–59. (In Chinese) [Google Scholar]
- Deligios, P.A.; Farci, R.; Sulas, L. Predicting growth and yield of winter rapeseed in a Mediterranean environment: Model adaptation at a field scale. Field Crops Res. 2013, 144, 100–112. [Google Scholar] [CrossRef]
- Challinor, A.J.; Watson, J. A meta-analysis of crop yield under climate change and adaptation. Nat. Clim. Chang. 2014, 4, 287–291. [Google Scholar] [CrossRef]
- OEC. Rapeseed Oil. 2022. Available online: https://oec.world/en/profile/hs92/rapeseed-oil (accessed on 13 December 2021).
- Gan, Y.; Angadi, S.V.; Cutforth, H.; Potts, D.; Angadi, V.V.; McDonald, C.L. Canola and mustard response to short periods of temperature and water stress at different developmental stages. Can. J. Plant Sci. 2004, 84, 697–704. [Google Scholar] [CrossRef]
- Boyer, J.S. Plant productivity and environment. Science 1982, 218, 443–448. [Google Scholar] [CrossRef] [PubMed]
- Hall, A.E. Breeding for heat tolerance. Plant Breed. Rev. 1992, 10, 129–168. [Google Scholar]
- NCEI. National Centers for Environmental Information, Global Historical Climatology Network—Daily (GHCN-Daily), Version 3. National Oceanic and Atmospheric Administration (NOAA). 2021. Available online: https://www.ncei.noaa.gov/access/search/data-search/daily-summaries (accessed on 7 November 2021).
- Mahan, J.R.; McMicheal, B.L.; Wanjura, D.F. Methods for reducing the adverse effects of temperature stress on plants: A review. Environ. Exp. Bot. 1995, 35, 251–258. [Google Scholar] [CrossRef]
- Angadi, S.V.; Cutforth, H.W.; Miller, P.R.; McConkey, B.G.; Entz, M.H.; Brandt, S.A.; Volkmar, K.M. Response of three Brassica species to high temperature stress during reproductive growth. Can. J. Plant Sci. 2000, 80, 693–701. [Google Scholar] [CrossRef]
- FAOSTAT. FAOSTAT Data. 2021. Available online: www.faostat.fao.org (accessed on 16 November 2021).
- WB. Commodity Markets, Research & Outlook, World Bank. 2021. Available online: https://www.worldbank.org/en/research/commodity-markets (accessed on 10 October 2021).
- Murphy, J.M.; Sexton, D.M.H.; Barnett, D.N.; Jones, G.S.; Webb, M.J.; Collins, M. Quantification of Modeling Uncertainties in A Large Ensemble of Climate Change Simulations. Nature 2004, 430, 772–786. [Google Scholar] [CrossRef]
- Shiogama, H.; Watanabe, M.; Yoshimori, M.; Yokohata, T.; Ogura, T.; Annam, J.D.; Hargreaves, J.C.; Abe, M.; Kamae, Y.; Oishi, R.; et al. Perturbed Physics Ensemble Using the MIROC5 couple Atmosphere–Ocean GCM without Flux Correction: Experimental Design and results, Climate Dynamics; Springer: Berlin/Heidelberg, Germany, 2012. [Google Scholar]
- O’Neill, B.C.; Kriegler, E.; Riahi, K.; Ebi, K.L.; Hallegatte, S.; Carter, T.R.; van Vuuren, D.P. A new scenario framework for climate change research: The concept of shared socioeconomic pathways. Clim. Chang. 2014, 122, 387–400. [Google Scholar] [CrossRef]
- Riahi, K.; van Vuuren, D.P.; Kriegler, E.; Edmonds, J.; O’neill, B.C.; Fujimori, S.; Bauer, N.; Calvin, K.; Dellink, R.; Fricko, O.; et al. The shared socioeconomic pathways and their energy, land use, and greenhouse gas emissions implications: An overview. Glob. Environ. Chang. 2017, 42, 153–168. [Google Scholar] [CrossRef]
- Kc, S.; Lutz, W. The human core of the shared socioeconomic pathways: Population scenarios by age, sex and level of education for all countries to 2100. Glob. Environ. Chang. 2017, 42, 181–192. [Google Scholar] [CrossRef]
- Koizumi, T.; Ohga, K. Impacts of the Brazilian bio-diesel program on the world soybean and soybean products market: An econometric simulation approach. Jpn. J. Rural Econ. 2008, 10, 12–32. [Google Scholar] [CrossRef][Green Version]
- Dickey, D.A.; Fuller, W.A. Distribution of the estimators for autoregressive time series with a unit root. J. Am. Stat. Assoc. 1979, 74, 427–431. [Google Scholar]
- Phillips, P.C.; Perron, P. Testing for a unit root in time series regression. Biometrika 1988, 75, 335–346. [Google Scholar] [CrossRef]
- Johansen, S.A. Statistical analysis of cointegration for I (2) variables. Econom. Theory 1995, 11, 25–29. [Google Scholar] [CrossRef]
- Breusch, T.S. Testing for Autocorrelation in Dynamic Linear Models. Aust. Econ. Pap. 1978, 17, 334–355. [Google Scholar] [CrossRef]
- Godfrey, L.G. Testing Against General Autoregressive and Moving Average Error Models when the Regressors Include Lagged Dependent Variables. Econometrica 1978, 46, 1293. [Google Scholar] [CrossRef]
- Breusch, T.S.; Pagan, A.R. A Simple Test for Heteroscedasticity and Random Coefficient Variation. Econometrica 1979, 47, 1287. [Google Scholar] [CrossRef]
- Butkevičienė, L.M.; Kriaučiūnienė, Z.; Pupaliene, R.; Velicka, R.; Kosteckiene, S.; Kosteckas, R.; Klimas, E. Influence of Sowing Time on Yield and Yield Components of Spring Rapeseed in Lithuania. Agronomy 2021, 11, 2170. [Google Scholar] [CrossRef]
- Liu, J.; Lobb, D.A. An Overview of Crop and Crop Residue Management Impacts on Crop Water Use and Runoff in the Canadian Prairies. Water 2021, 13, 2929. [Google Scholar] [CrossRef]
- Elferjani, R.; Soolanayakanahally, R. Canola Responses to Drought, Heat, and Combined Stress: Shared and Specific Effects on Carbon Assimilation, Seed Yield, and Oil Composition. Front. Plant Sci. 2018, 9, 1224. [Google Scholar] [CrossRef]
- Begna, S.; Angadi, S.; Stamm, M.; Mesbah, A. Winter canola: A potential dualpurpose crop for the United States Southern Great Plains. Agron. J. 2017, 109, 2508–2520. [Google Scholar] [CrossRef]
- FAO. Transforming Food and Agriculture to Achieve the SDGs. 20 Interconnected Actions to Guide Decision-Makers. Food and Agriculture Organization of the United Nations, Rome. 2018. Available online: https://www.fao.org/3/I9900EN/i9900en.pdf (accessed on 21 February 2022).
- FAOSTAT. FAOSTAT Data. 2022. Available online: www.faostat.fao.org (accessed on 1 May 2022).
- Miah, M.A.M.; Afroz, M.S.; Rashid, M.A.; Shiblee, S.A.M. Factors affecting adoption of improved sesame technologies in some selected areas in Bangladesh: An empirical study. Agriculturist 2015, 13, 140–151. [Google Scholar] [CrossRef]
- BBS. Statistical Yearbook of Bangladesh, Bangladesh Bureau of Statistics; Ministry of Planning, Governments of the People’s Republic of Bangladesh: Dhaka, Bangladesh, 2019.
- Brown, S.; Ho, S.H.; Daniel, M.; Hwan, K.M.; Oh, K.B.; Su, C.Y.; Seob, L.D.; Hoon, K.T.; Duk, H.; Phil, K.K.; et al. Korean Agricultural Simulation Model and Livestock Quarterly Model; Food and Agricultural Policy Research Institute, University of Missouri (FAPRI-MU): Columbia, MO, USA, 2008. Available online: http://repository.krei.re.kr/handle/2018.oak/15373 (accessed on 12 December 2021).
- Exchange Rate. U.S. Dollar to Bangladesh Taka Spot Exchange Rates for 2021. 2010. Available online: https://www.exchangerates.org.uk/USD-BDT-spot-exchange-rates-history-2010.html#:~:text=Average%20exchange%20rate%20in%202010%3A%2056.3127%20BDT (accessed on 23 August 2021).
- Clever, J. China’s Robust Demand for Oilseeds Continues to Outpace Growth in Domestic Production, Oilseeds and Products Annual; GAIN Report Number:CH17012; USAD Foreign Agricultural Service: Washington, DC, USA, 2017.
- Vernon, L.; Van, G.D. Potential Impacts of Climate Change on Agricultural Land Use Suitability: Canola; Report 303; Department of Agriculture and Food: South Perth, WA, Australia, 2006.
- Friedt, W.; Snowdon, R. Oilseed rape. In Oil Crops; Vollmann, J., Rajcan, I., Eds.; Springer: New York, NY, USA, 2009; pp. 91–126. [Google Scholar]
- Kojima, Y.; Parcell, J.; Cain, J. A Global Demand Analysis of Vegetable Oils for Food and Industrial Use: A Cross-Country Panel Data Analysis with Spatial Econometrics. Available online: http://purl.umn.edu/235744 (accessed on 5 May 2022).
- AHDB. What Is Driving Rapeseed Prices Higher? Grain Market Daily. Agriculture and Horticulture Development Board, Warwickshire. 2019. Available online: https://ahdb.org.uk/news/what-is-driving-rapeseed-prices-higher-grain-market-daily (accessed on 11 February 2022).
- IPAD. Rapeseed, Bangladesh. International Food Policy Research Institute, USDA Foreign Agricultural Service, U.S. Department of Agriculture. 2022. Available online: https://ipad.fas.usda.gov/rssiws/al/crop_production_maps/sasia/Bangladesh_Rapeseed.png (accessed on 5 January 2022).
- USDA. Bangladesh Rapeseed Production. 2022. Available online: https://ipad.fas.usda.gov/cropexplorer/cropview/commodityView.aspx?cropid=2226000&sel_year=2020&rankby=Production (accessed on 17 February 2022).

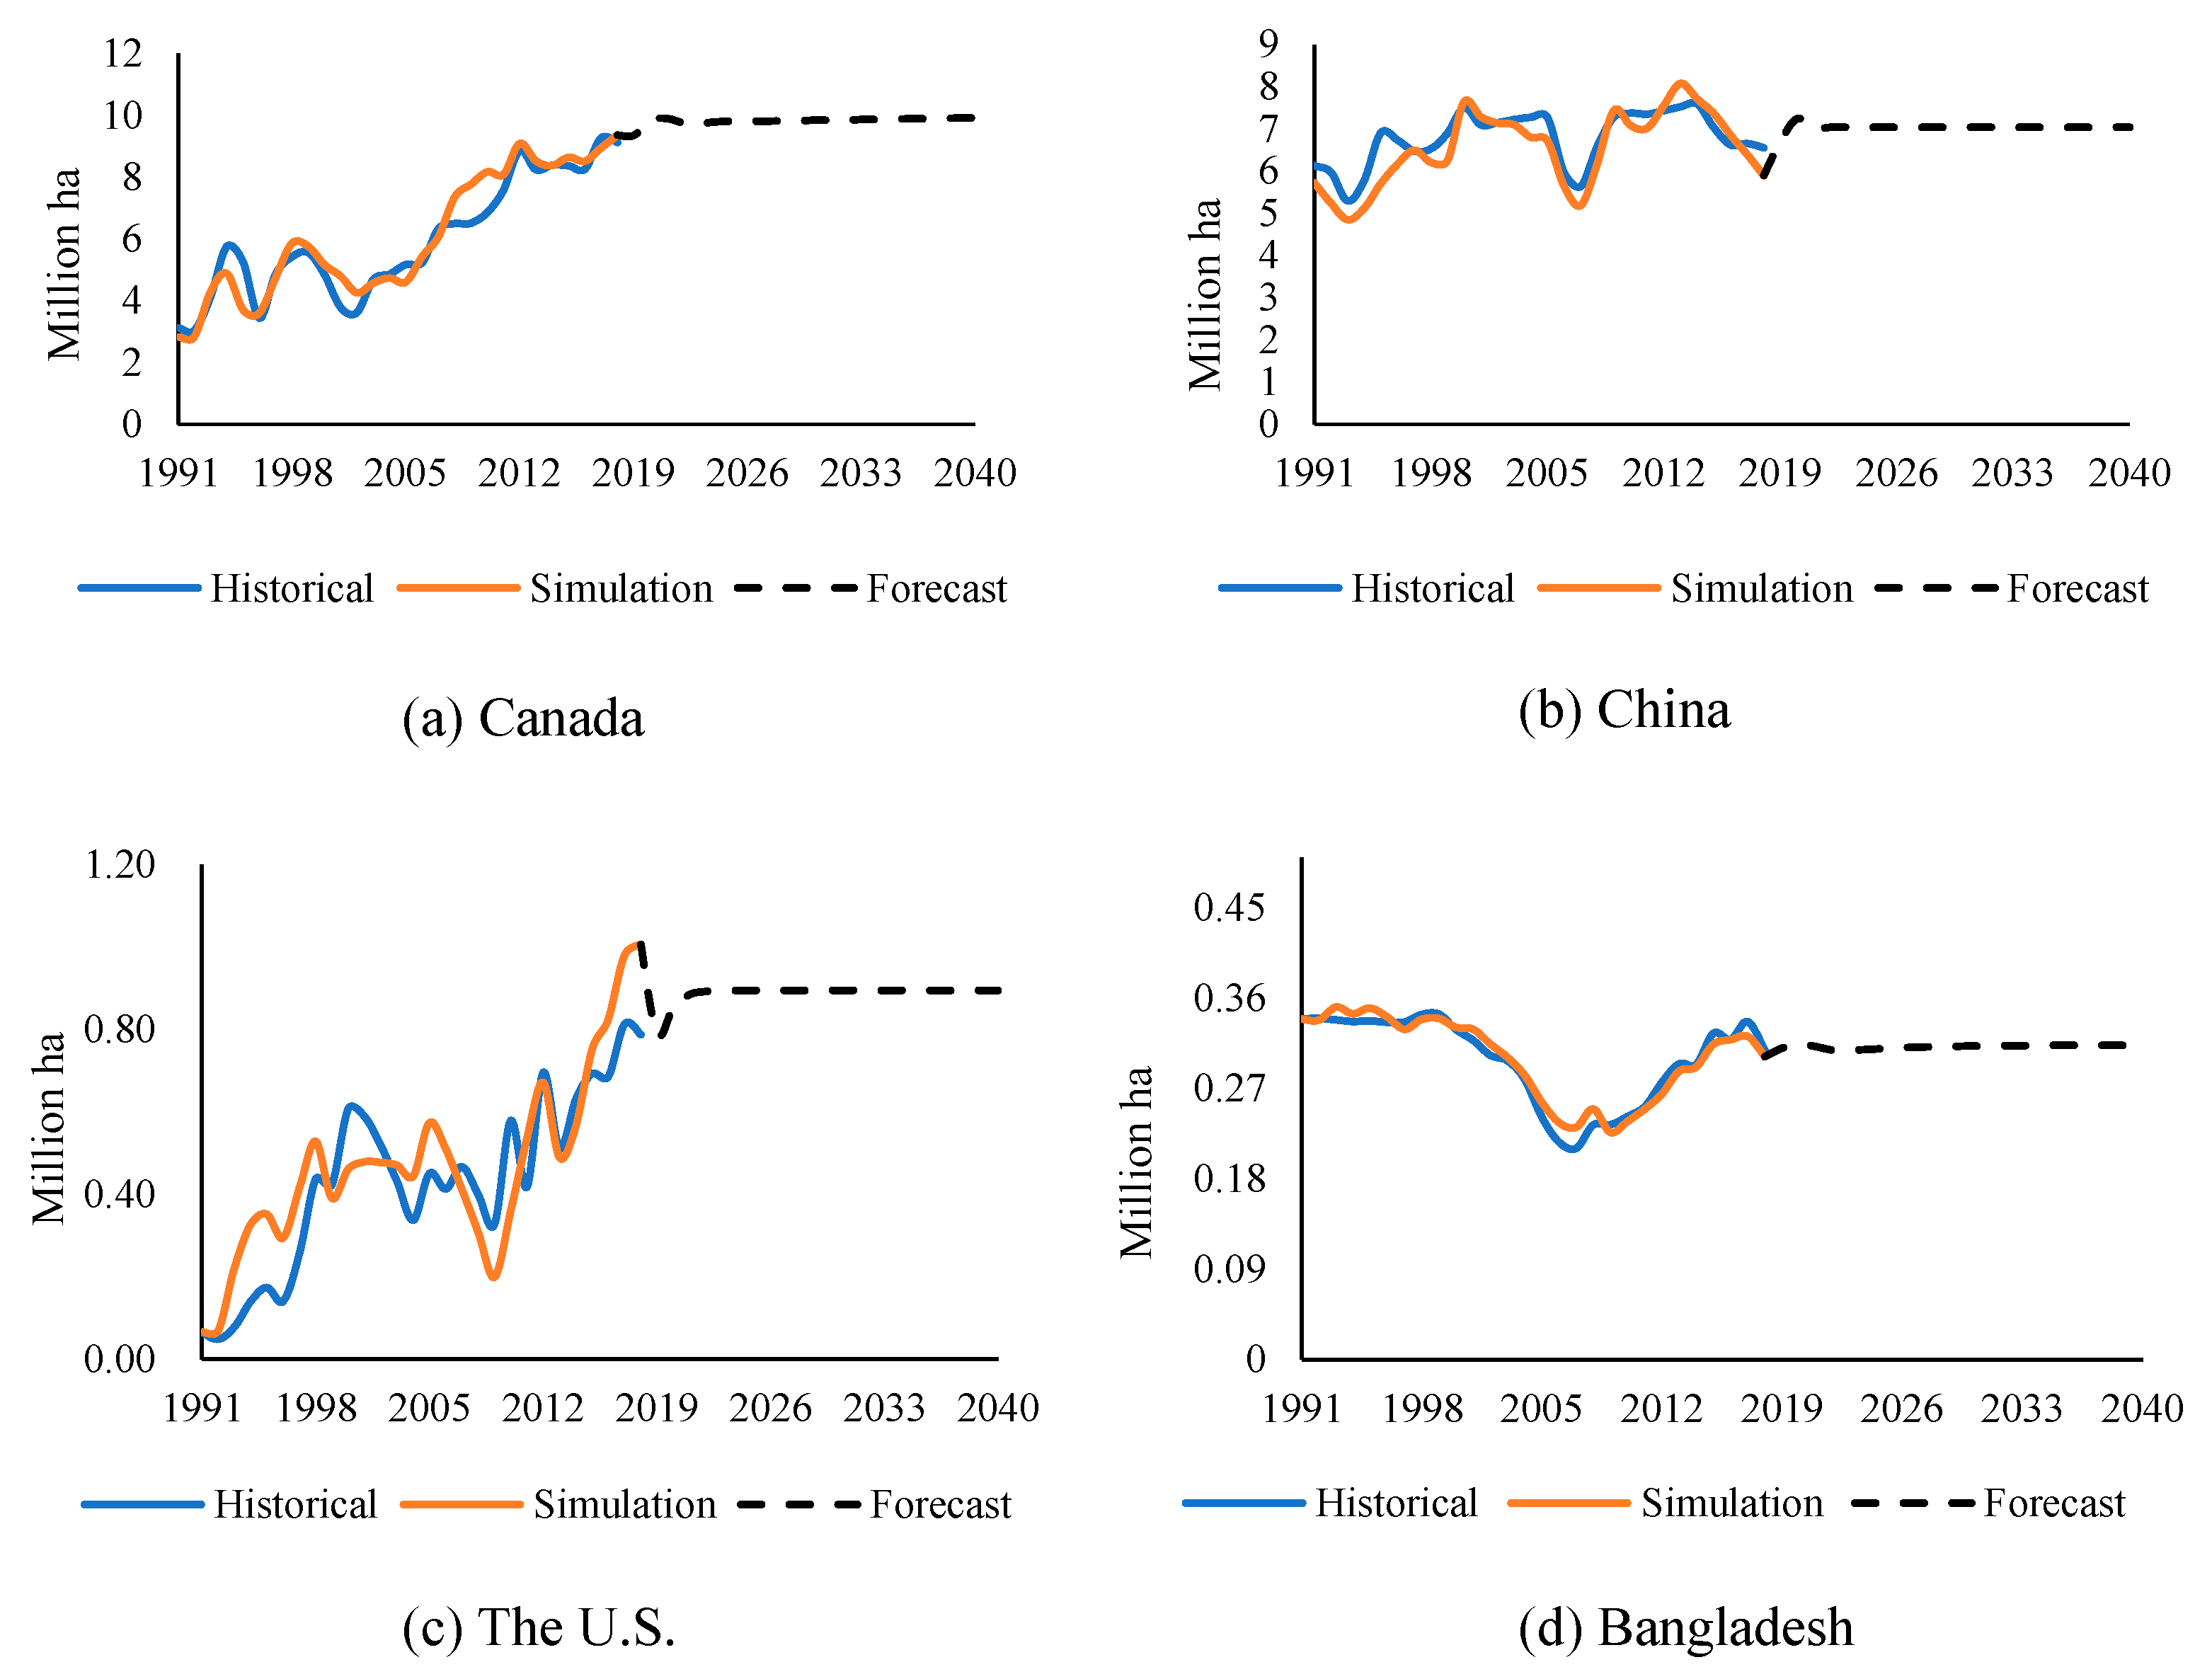
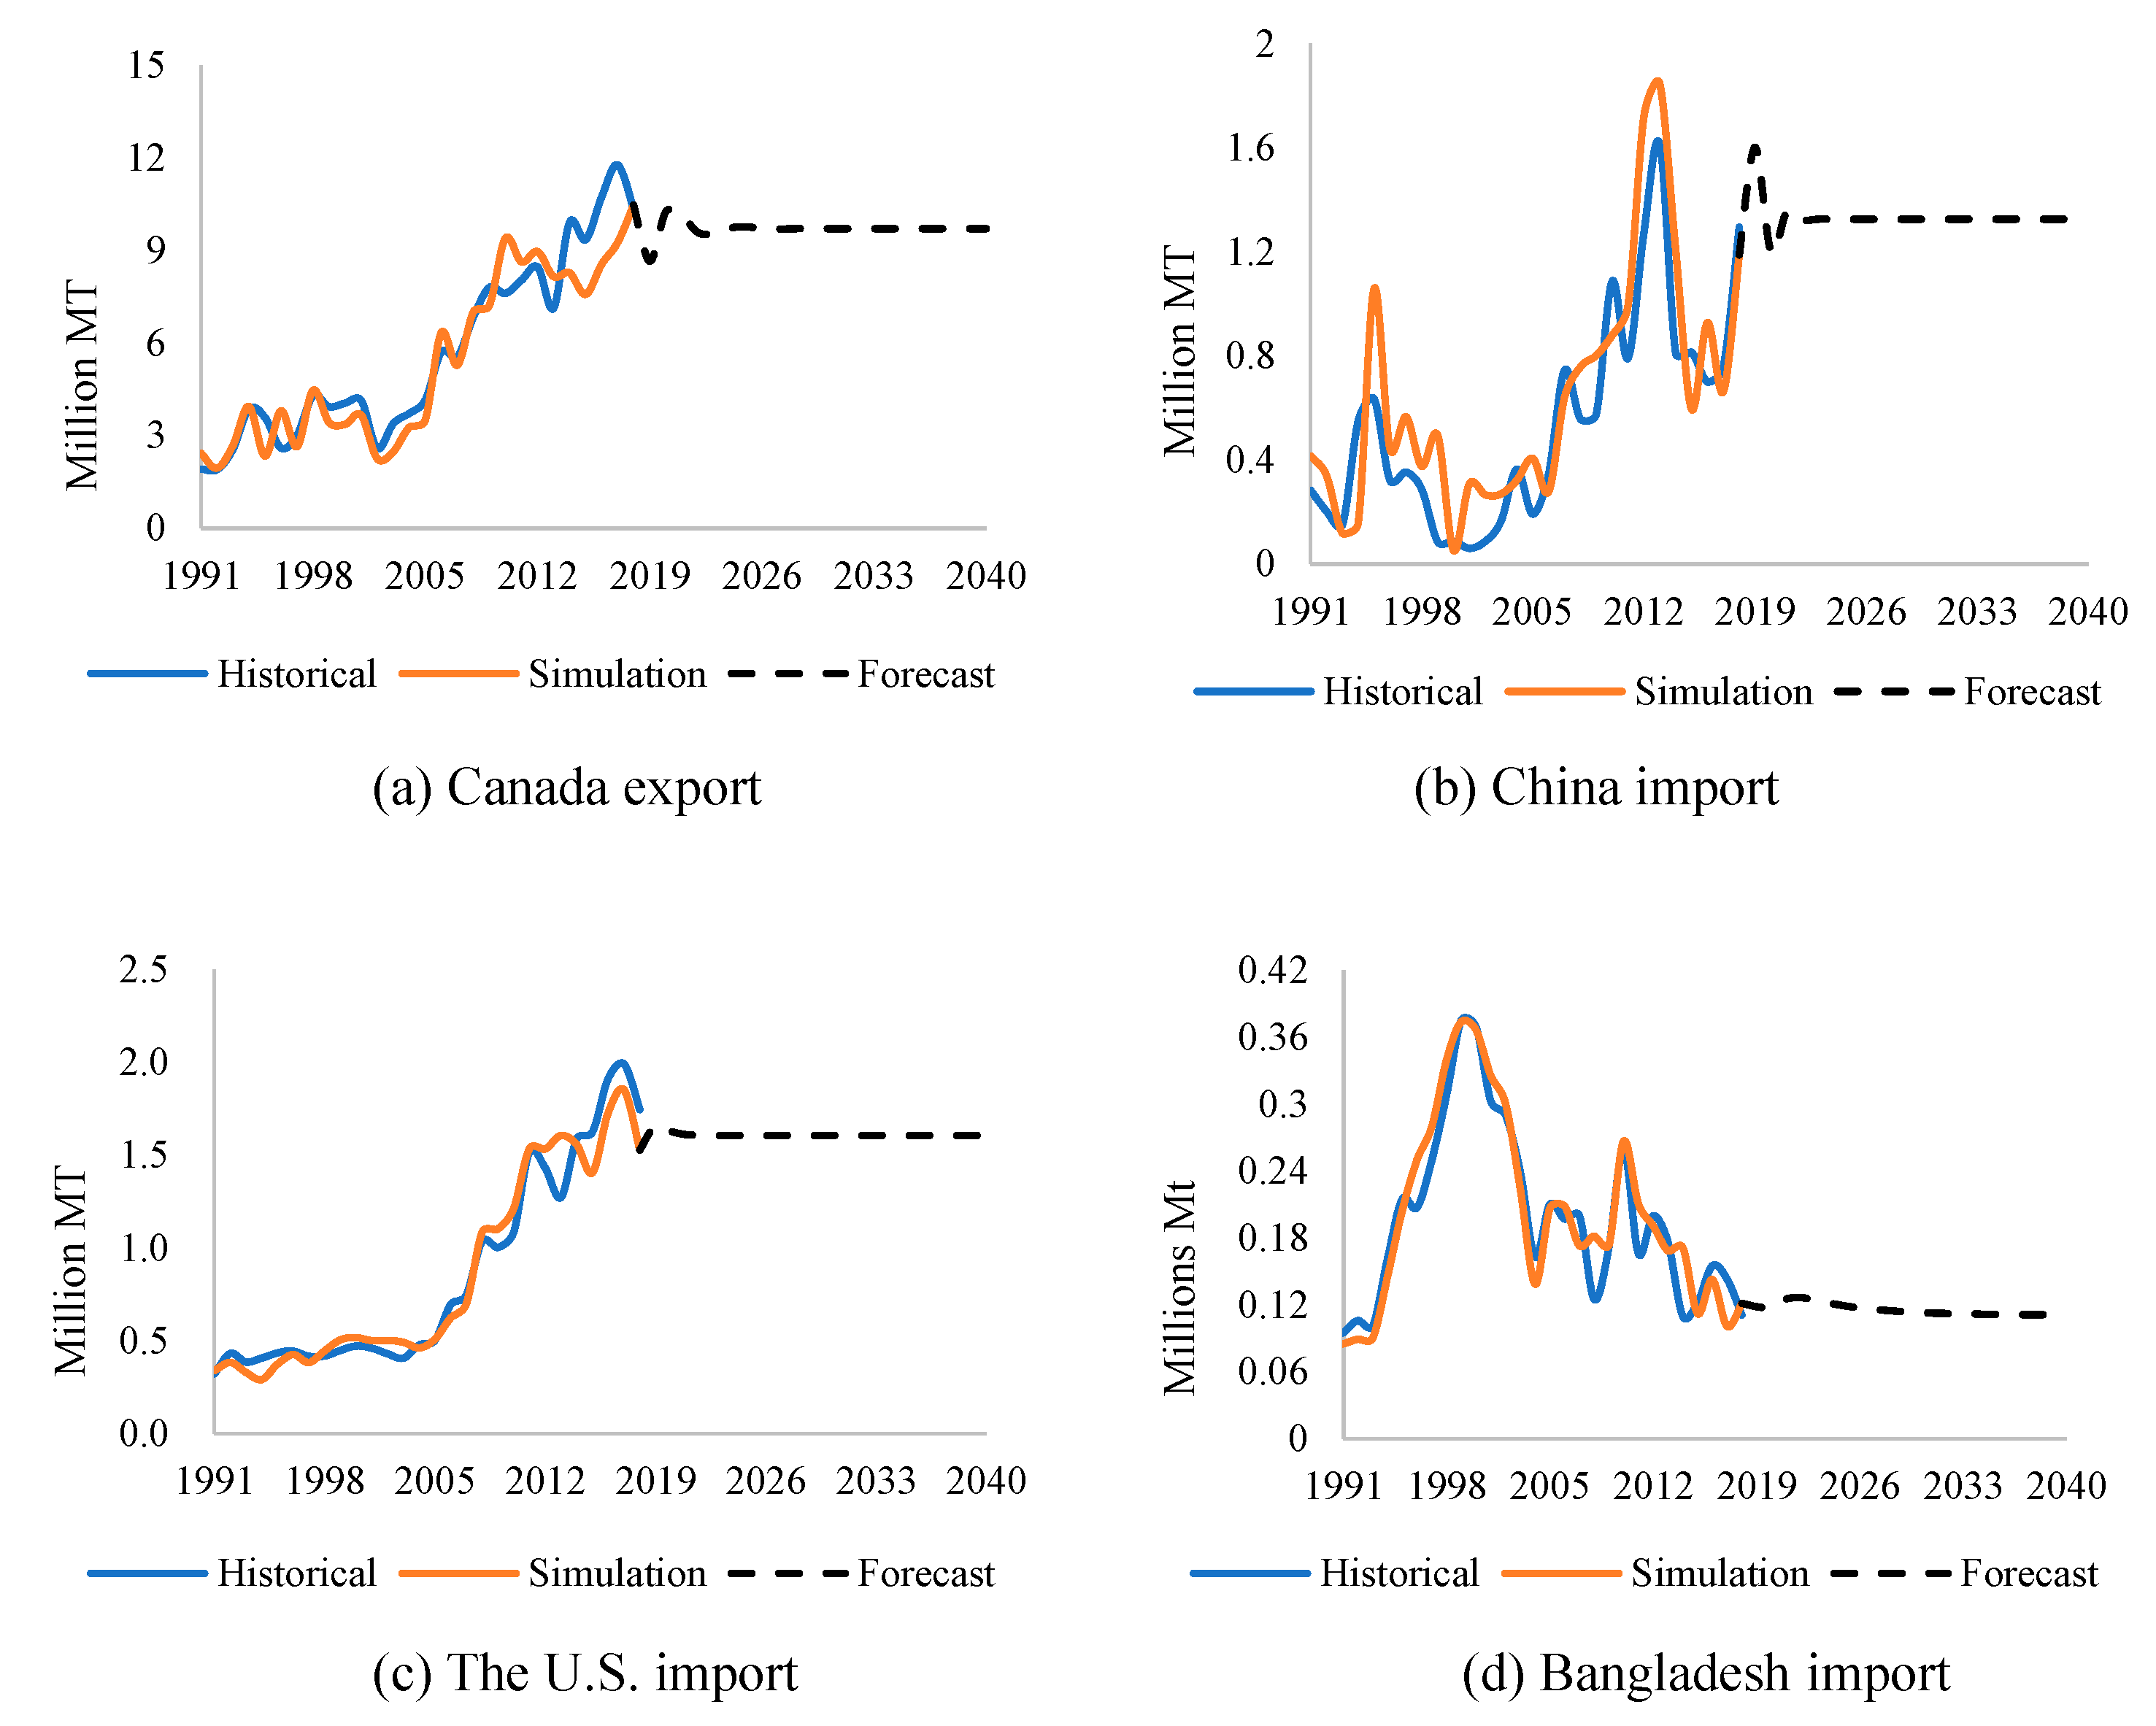
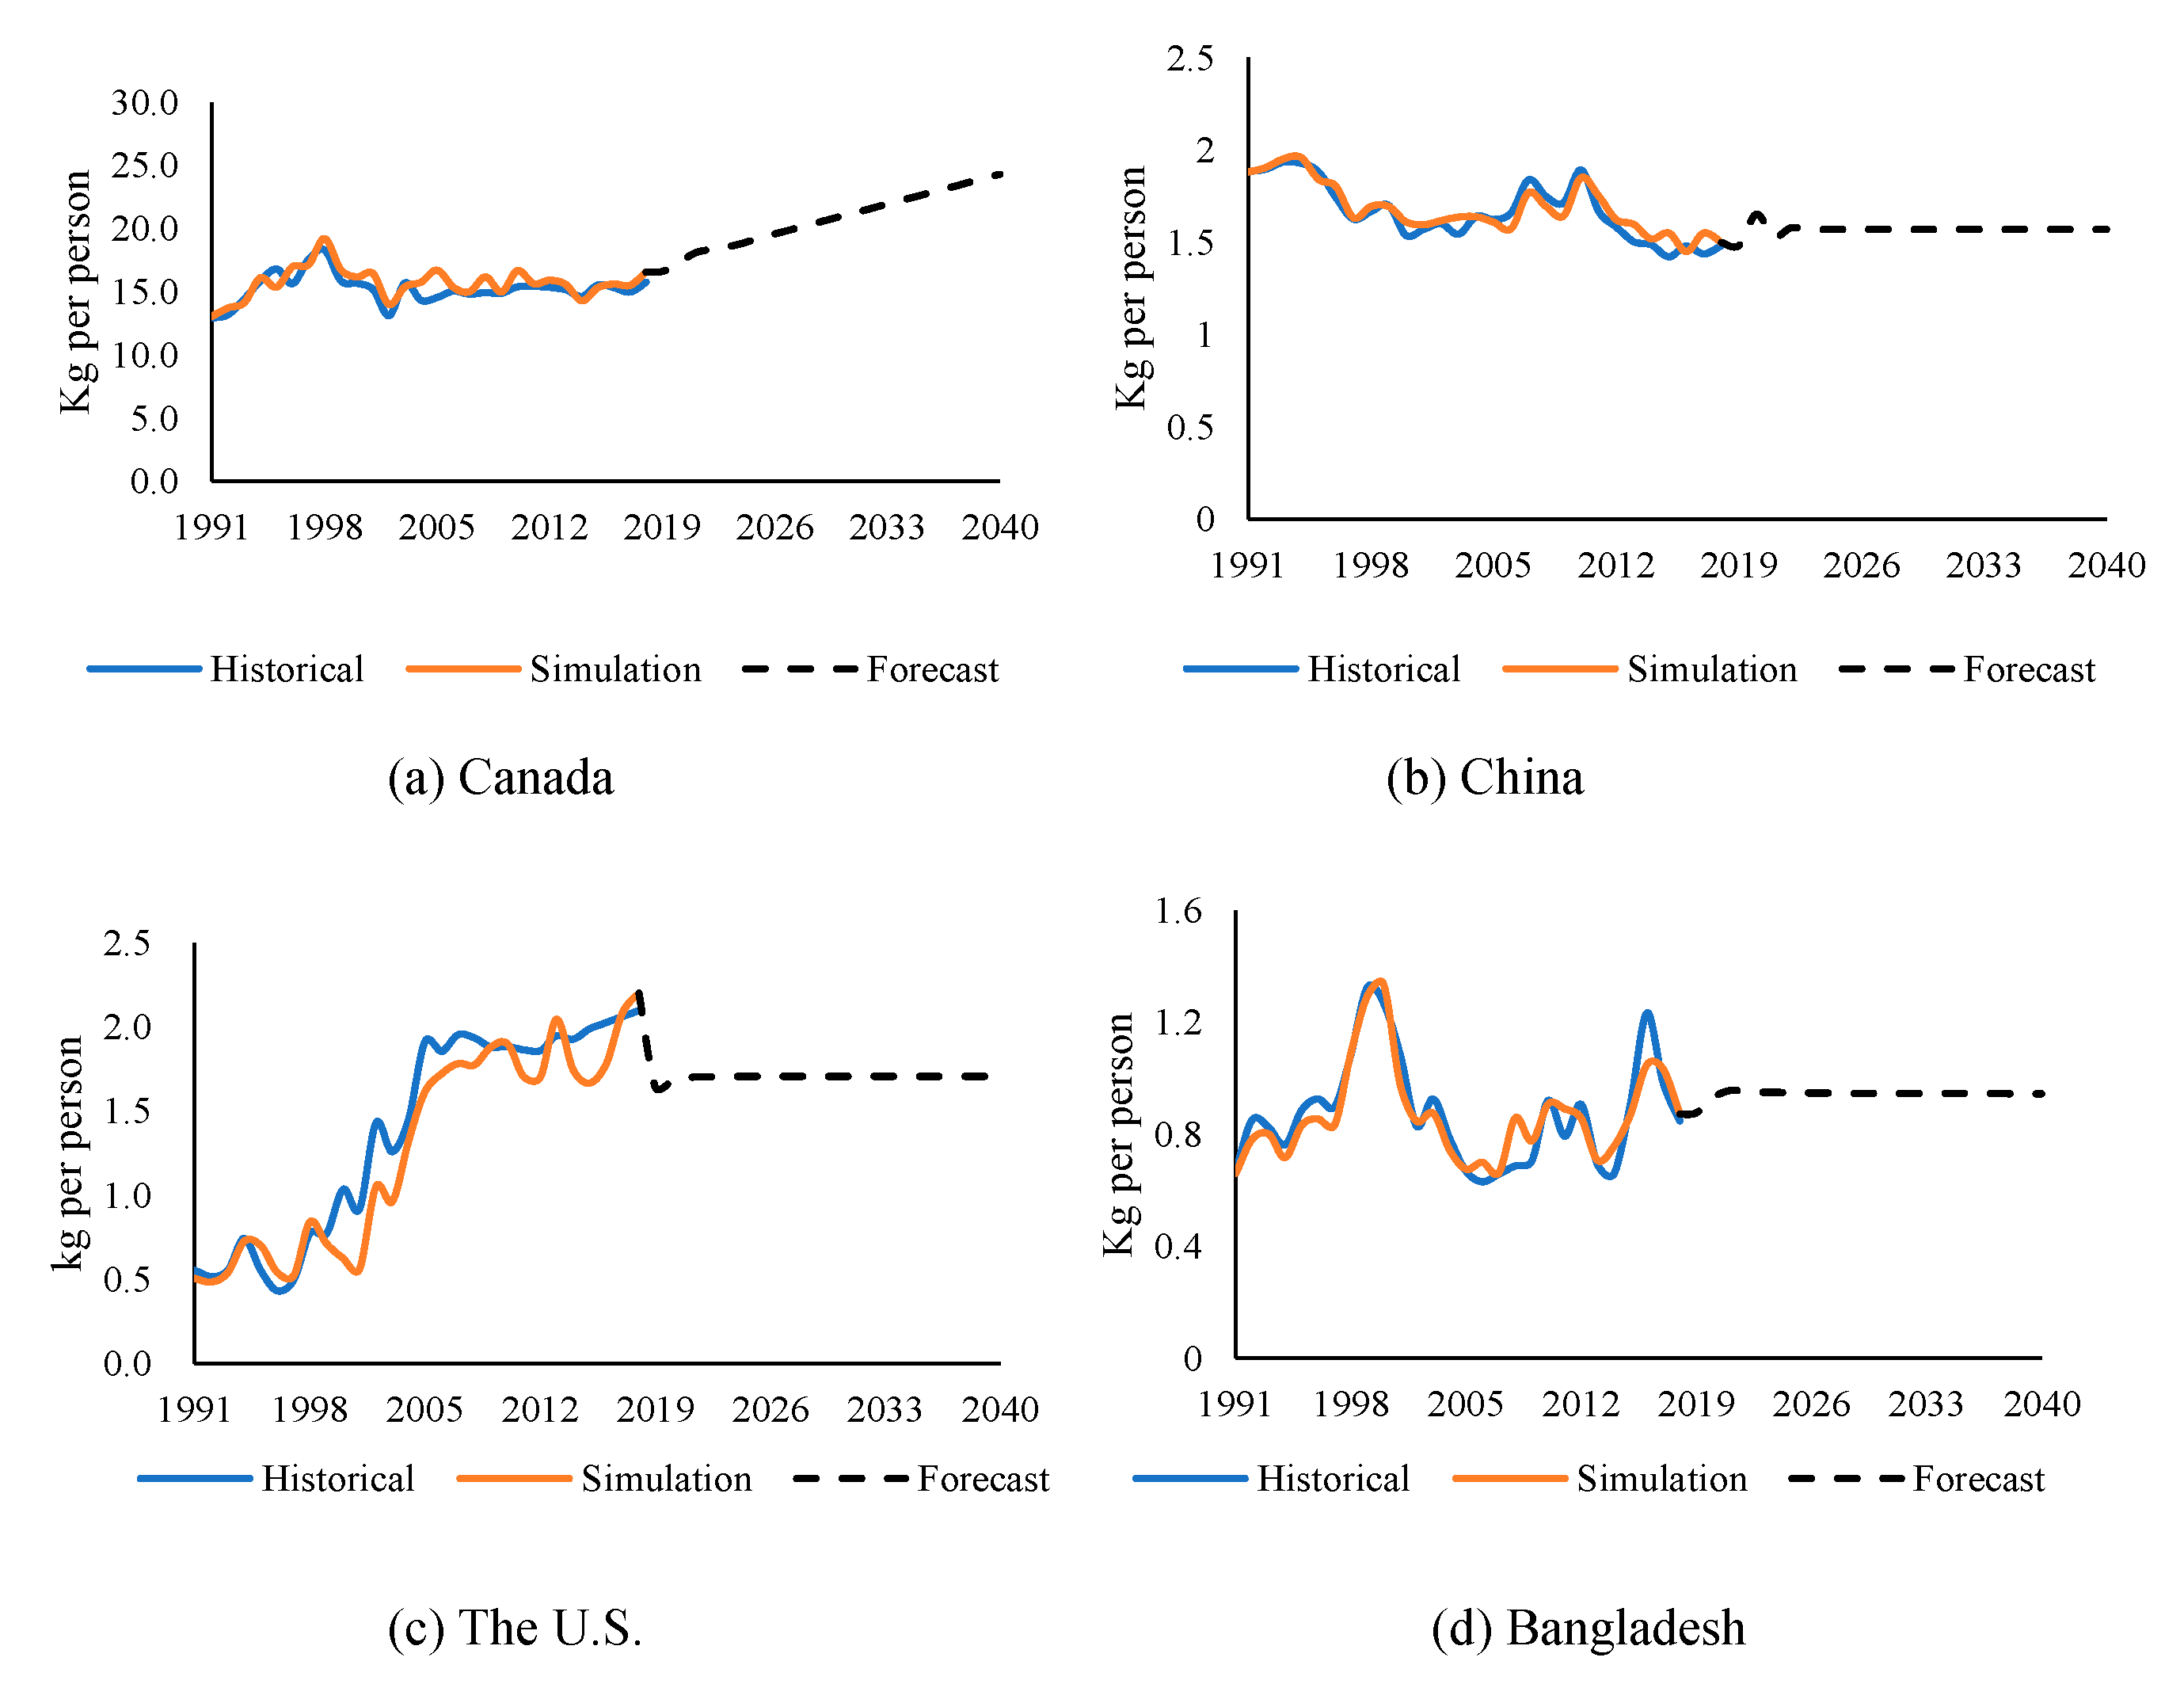
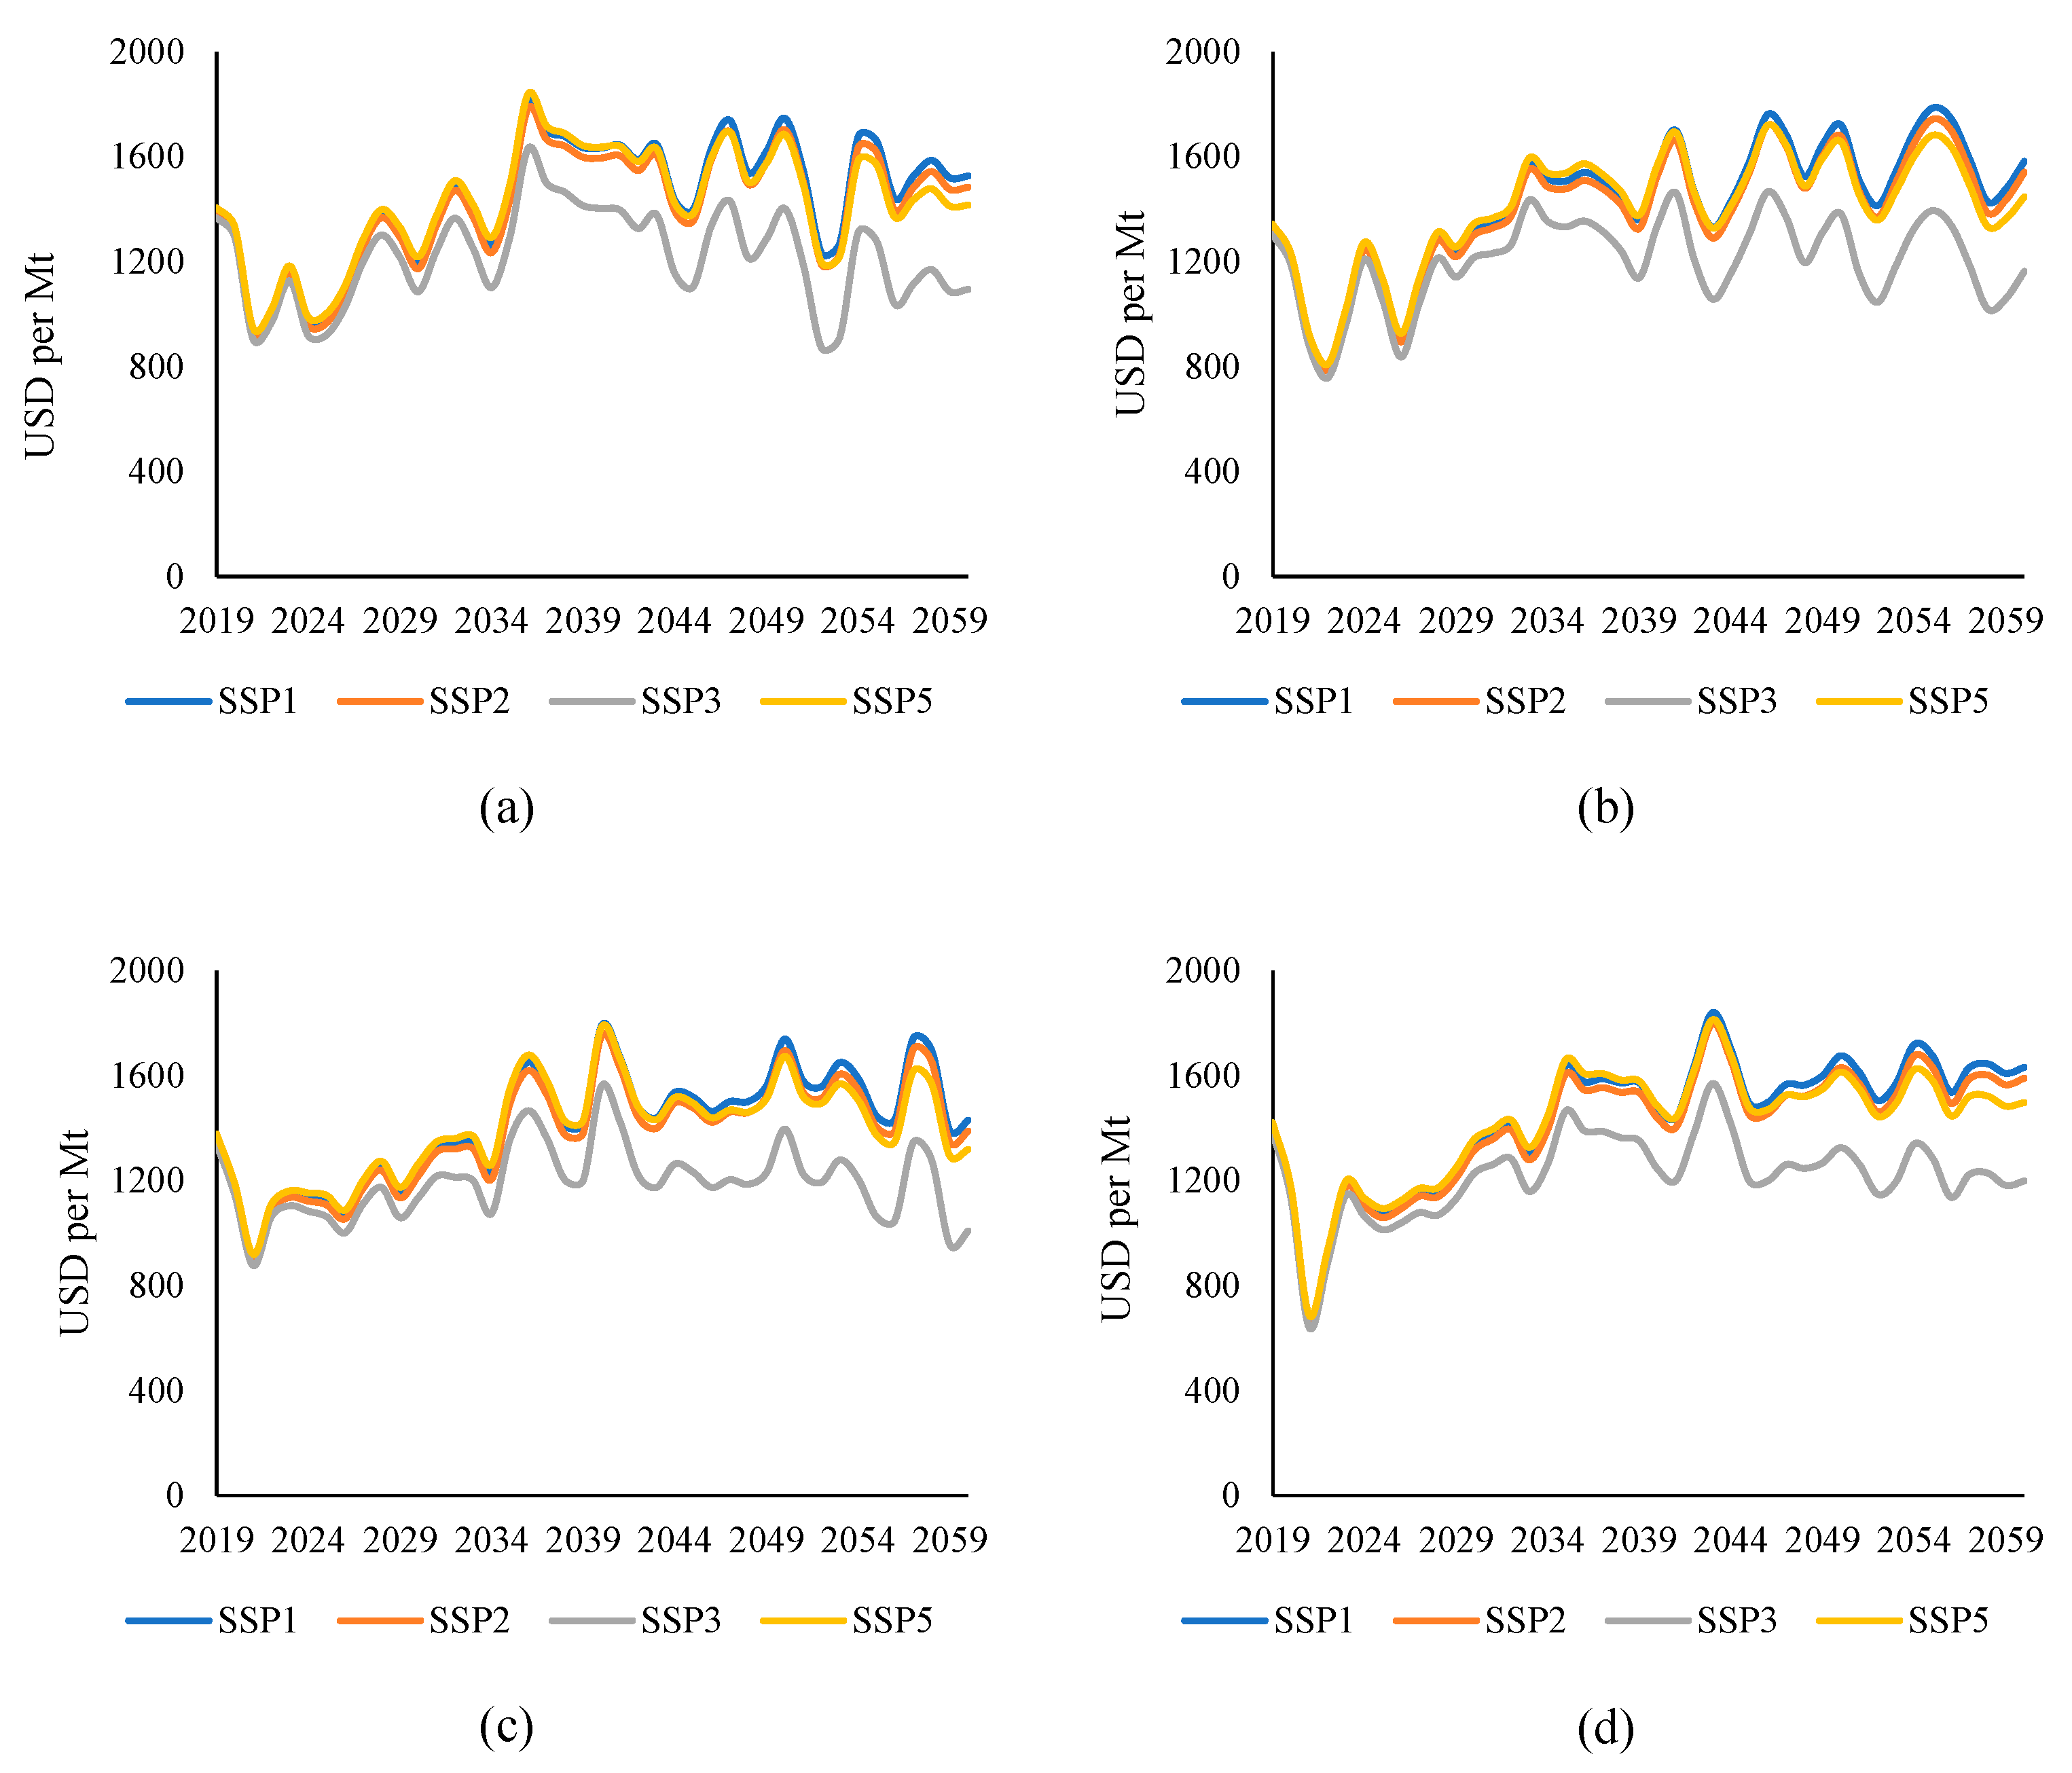

| Variables | Levels | 1st Differences | Variables | Levels | 1st Differences | ||||
|---|---|---|---|---|---|---|---|---|---|
| ADF | PP | ADF | PP | ADF | PP | ADF | PP | ||
| Canada | |||||||||
| A | –2.51 | –2.48 | –4.99 *** | –8.02 *** | OEXP | –1.75 | –0.91 | –4.34 *** | –4.05 *** |
| Y | –4.52 *** | –4.50 *** | –4.57 *** | –22.39 *** | OSTC | –6.12 *** | –6.06 *** | –7.06 *** | –31.55 *** |
| Q | –2.06 | –1.92 | –6.49 *** | –7.45 *** | OBD | –3.53 *** | –3.61 *** | –5.27 *** | –15.07 *** |
| FP | –3.31 *** | –1.98 | –4.28 | –4.33 *** | CruWP | –1.92 | –2.05 | –3.98 *** | –7.23 *** |
| EXP | –2.71 | –2.73 | –3.98 *** | –7.23 *** | GDP | –2.75 | –2.88 | –4.23 *** | –5.34 *** |
| STC | –4.57 *** | –7.98 *** | –4.35 *** | –13.76 *** | POP | –1.84 | –0.92 | –6.49 *** | –2.75 |
| OilQ | –2.38 | –0.75 | –4.85 *** | –4.88 *** | - | - | - | - | - |
| China | |||||||||
| A | –2.31 | –1.69 | –3.00 *** | –5.71 *** | OIMP | –1.95 | –3.00 | –3.87 ** | –6.94 *** |
| Y | –3.58 * | –3.57 * | –7.98 *** | –9.82 *** | OBD | –1.53 | –1.61 | –4.07 *** | –8.27 *** |
| Q | –1.02 | –1.67 | –3.52 * | –9.65 *** | WP | –3.33 * | –1.91 | –4.95 *** | –4.61 *** |
| FP | –1.44 | –1.56 | –3.54 *** | –4.90 ** | CruWP | –1.92 | –2.05 | –4.61 *** | –4.58 *** |
| IMP | –2.29 | –2.32 | –3.51 * | –4.92 *** | GDP | 0.80 | 1.42 | –3.58 * | –2.38 |
| OilQ | 0.67 | 0.21 | –4.09 ** | –4.04 ** | POP | –4.83 *** | –16.49 | –5.12 | –5.26 *** |
| Variables | Level | 1st Differences | Variables | Level | 1st Differences | ||||
|---|---|---|---|---|---|---|---|---|---|
| ADF | PP | ADF | PP | ADF | PP | ADF | PP | ||
| U.S. | |||||||||
| A | –2.20 | –2.58 | –4.38 ** | –11.93 *** | OIMP | –1.72 | –0.92 | –3.86 * | –7.85 *** |
| Y | –1.36 | –5.17 | –7.84 *** | –16.65 *** | OBD | –2.34 | –1.93 | –4.67 *** | –11.01 *** |
| Q | –2.09 | –1.12 | –8.65 *** | –9.79 ** | WP | –1.72 | –2.32 ** | –6.17 *** | –8.19 *** |
| FP | –1.65 | –2.18 | –7.14 *** | –8.97 *** | CruWP | –1.84 | –1.84 | –6.75 *** | –6.78 *** |
| IMP | –2.76 | –3.55 *** | –4.45 *** | –10.40 *** | GDP | 0.50 | 0.14 | –5.25 *** | –5.23 *** |
| OilQ | –0.67 | –1.12 | –8.65 *** | –9.79 *** | POP | –0.90 | 0.17 | –3.21 * | –6.37 *** |
| Bangladesh | |||||||||
| A | –3.98 ** | –1.18 | –5.87 *** | –3.31 * | OilQ | –2.93 * | –2.35 | –4.68 *** | –4.94 *** |
| Y | –2.14 | –1.98 | –5.27 *** | –9.23 *** | WP | –3.07 ** | –2.43 | –5.53 | –6.55 *** |
| Q | –3.57 * | –0.84 | –4.91 *** | –4.94 *** | GDP | 0.19 | 2.25 * | –3.59 * | –4.13 |
| FP | –1.82 | –1.80 | –4.98 *** | –4.93 *** | POP | –0.84 | –0.97 | –3.30 | –7.31 *** |
| IMP | –2.09 | –2.19 | –5.31 *** | –5.34 *** | - | - | - | - | - |
| Parameters | Canada | China | U.S. | Bangladesh | |
|---|---|---|---|---|---|
| Yield | |||||
| Temp. | Jul | 0.090 * (7.76) | |||
| Aug | –054 * (–5.38) | ||||
| Nov | 0.050 *** (1.93) | 0.020 * (4.21) | |||
| Dec | –0.019 ** (–2.43) | –0.012 ** (–3.02) | 0.039 * (5.15) | ||
| Jan | |||||
| Feb | –0.019 * (–4.76) | ||||
| Adj. R2 (DW) | 0.67 (2.50) | 0.53 (1.99) | 0.75 (2.47) | 0.67 (2.13) | |
| Area | |||||
| 0.378 ** (2.14) [0.37] | 0.180 ** (1.85) [0.18] | 0.364 ** (1.94) [0.34] | 0.329 ** (3.01) [0.33] | ||
| 2919.493 ** (1.77) [0.18] | 365.677 ** (2.52) [0.16] | 358.4571 (1.67) [0.22] | 0.908 *** (1.85) [0.10] | ||
| Rain. | - | 9142.189 * (4.74) | |||
| –444.063 * (–5.52) | |||||
| - | 3283.541 * (3.29) | ||||
| - | −556.718 ** (−1.91) | ||||
| 7934.163 ** (1.77) | |||||
| 65.212 ** (3.81) | |||||
| 9585.424 ** (2.3) | |||||
| Adj. R2 | 0.65 | 0.86 | 0.90 | 0.77 | |
| Parameters | Canada | China | U.S. | Bangladesh |
|---|---|---|---|---|
| Exports | ||||
| Q | 0.274 ** (1.9) | |||
| FPd | –6576.018 ** (–2.21) | |||
| Adj. R2 (DW) | 0.60 (1.83) | |||
| Imports | ||||
| Q | - | - | –0.335 (–1.91) | –0.901 ** (–2.36) |
| WPd | −2.254 *** (−1.66) | |||
| Adj. R2 (DW) | - | 0.60 (2.31) | 0.64 (2.59) | |
| Stock change | ||||
| dQ | 0.411 ** (2.35) | |||
| Adj. R2 (DW) | 0.68 (2.43) | |||
| Oil exports | ||||
| OilQ | 0.695 * (7.83) | |||
| Adj. R2 (DW) | 0.78 (2.05) | |||
| Oil imports | ||||
| OilQ | –0.717 ** (−2.85) | |||
| WPd | - | –137.789 ** (–1.97) | –648.135 ** (–2.29) | |
| FPd | - | 316.605 * (3.43) | ||
| Adj. R2 (DW) | 0.84 (1.70) | 0.70 (2.38) | ||
| Parameters | Canada | China | U.S. | Bangladesh |
|---|---|---|---|---|
| Oil biodiesel | ||||
| WPdCru | 110.509 ** (2.1) | 617.328 ** (2.1) | 4429.298 ** (2.72) | |
| Adj. R2 (DW) | 0.67 (2.37) | 0.75 (2.25) | 0.56 (2.16) | |
| Per capita oil consumption | ||||
| FPd | –0.008 ** (–2.88) [–0.20] | –0.005 *** (1.69) [–0.19] | –0.002 * (–3.18) [–0.53] | –0.00005 *** (–1.73) [–0.23] |
| rGDPPC | –1.116 * (–4.51) [–4.38] | –0.041 ** (–2.76) [–0.63] | –0.099 ** (–1.89) [–3.35] | –0.0363 *** (–1.85) [–3.01] |
| FPdsoy | 0.012 * (3.56) [0.22] | |||
| FPdpal | 0.0004 ** (2.45) [0.18] | |||
| Adj. R2 (DW) | 0.63 (2.47) | 0.80 (2.00) | 0.71 (2.23) | 0.67 (2.51) |
| Price linkages | ||||
| FP | - | 0.042 ** (2.18) | 0.244 ** (2.17) | 0.093 ** (3.67) |
| Adj. R2 (DW) | 0.60 (2.02) | 0.89 (2.04) | 0.68 (2.26) | |
| Biodiesel price linkages | ||||
| WPcru | 0.856 * (3.81) | 0.063 ** (1.93) | 0.368 * (3.02) | |
| Adj. R2 (DW) | 0.71 (2.58) | 0.75 (2.05) | 0.75 (1.88) | |
| Scenario | Area (‘000 ha) | Production (‘000 MT) | Per Capita Consumption (Kg Year−1 Person−1) | Farm Price (USD MT−1) | |
|---|---|---|---|---|---|
| Changes in the baseline period (1991–2018) | 299.9 (10.3) | 252.3 (53.2) | 1.09 (18.6) | 300.44 (3.9) | |
| Projection period (2019–2060) | |||||
| RCP 2.6 | SSP2 | 282.3 (3.3) | 336.1 (6.2) | 3.5 (19.6) | 439.16 (4.6) |
| SSP3 | 281.5 (1.8) | 335.2 (5.2) | 3.7 (21.3) | 412.45 (5.1) | |
| SSP4 | 277939.0 (1.2) | 330.9 (3.6) | 3.8 (22.0) | 445.36 (4.5) | |
| RCP 4.5 | SSP2 | 286.4 (2.8) | 342.5 (4.4) | 3.5 (19.0) | 469.13 (4.4) |
| SSP3 | 285702.6 (1.1) | 341.7 (6.1) | 3.7 (21.9) | 444.95 (4.9) | |
| SSP4 | 281.6 (1.6) | 335967.5 (2.5) | 3.8 (22.9) | 458.23 (4.5) | |
| RCP 6.0 | SSP2 | 291.9 (2.1) | 346.7 (5.0) | 3.4 (20.0) | 471.34 (4.7) |
| SSP3 | 292.0 (4.4) | 346.7 (7.2) | 3.7 (21.8) | 470.12 (5.1) | |
| SSP4 | 286.9 (1.3) | 340.7 (3.1) | 3.8 (23.0) | 548.13 (4.9) | |
| RCP 8.5 | SSP2 | 281.6 (3.2) | 338.5 (9.6) | 3.5 (20.9) | 401.57 (4.9) |
| SSP3 | 278.4 (3.9) | 334.7 (10.4) | 3.7 (21.9) | 409.12 (5.2) | |
| SSP4 | 273.4 (1.4) | 328.6 (6.6) | 3.8 (24.1) | 394.41 (5.0) | |
Publisher’s Note: MDPI stays neutral with regard to jurisdictional claims in published maps and institutional affiliations. |
© 2022 by the authors. Licensee MDPI, Basel, Switzerland. This article is an open access article distributed under the terms and conditions of the Creative Commons Attribution (CC BY) license (https://creativecommons.org/licenses/by/4.0/).
Share and Cite
Jannat, A.; Ishikawa-Ishiwata, Y.; Furuya, J. Does Climate Change Affect Rapeseed Production in Exporting and Importing Countries? Evidence from Market Dynamics Syntheses. Sustainability 2022, 14, 6051. https://doi.org/10.3390/su14106051
Jannat A, Ishikawa-Ishiwata Y, Furuya J. Does Climate Change Affect Rapeseed Production in Exporting and Importing Countries? Evidence from Market Dynamics Syntheses. Sustainability. 2022; 14(10):6051. https://doi.org/10.3390/su14106051
Chicago/Turabian StyleJannat, Arifa, Yuki Ishikawa-Ishiwata, and Jun Furuya. 2022. "Does Climate Change Affect Rapeseed Production in Exporting and Importing Countries? Evidence from Market Dynamics Syntheses" Sustainability 14, no. 10: 6051. https://doi.org/10.3390/su14106051
APA StyleJannat, A., Ishikawa-Ishiwata, Y., & Furuya, J. (2022). Does Climate Change Affect Rapeseed Production in Exporting and Importing Countries? Evidence from Market Dynamics Syntheses. Sustainability, 14(10), 6051. https://doi.org/10.3390/su14106051


