
Modeling the Impact of Weather and Context Data on Transport Mode Choices: A Case Study of GPS Trajectories from Beijing


Abstract
:1. Introduction
- The potential of using GPS trajectories to analyze and model the relationship between transport mode choices, weather and context information is investigated.
- The relationship among weather and context information, transport planning, and transport regulation is analyzed.
2. Databases
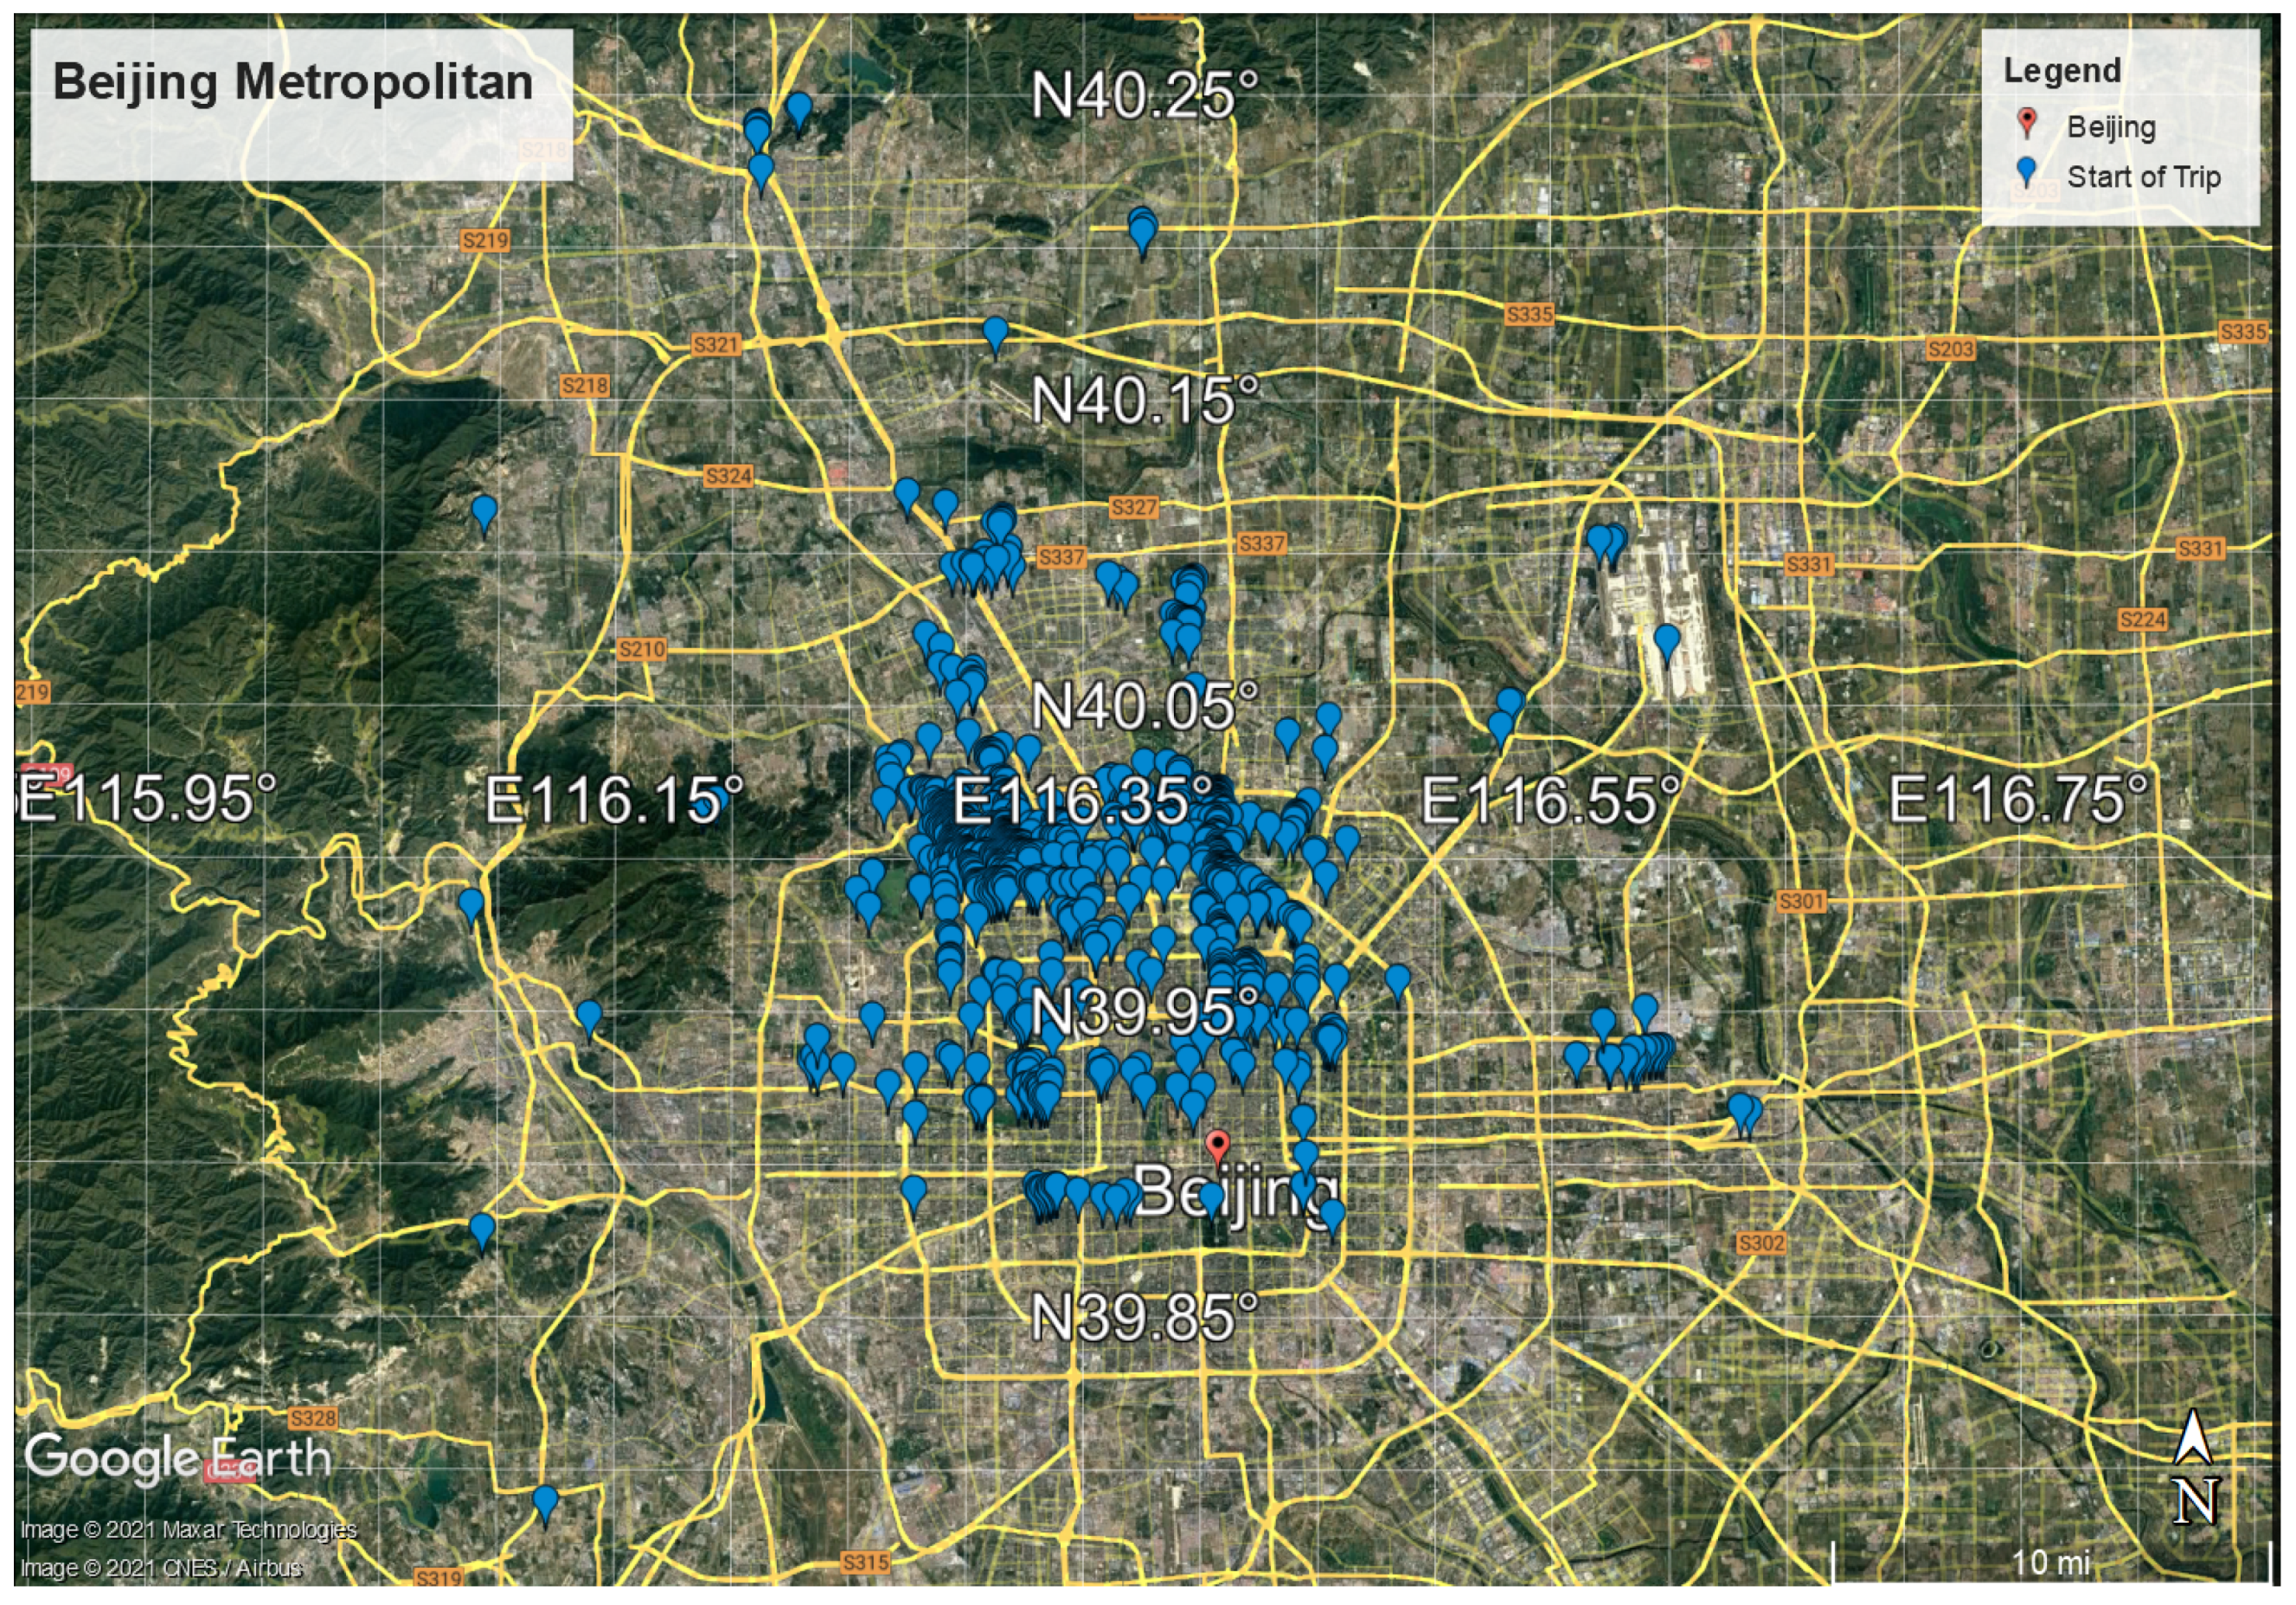
2.1. GPS Trajectories
2.2. Weather Information
2.3. Context Information
2.4. Matching Weather and Context Information with GPS Trajectories
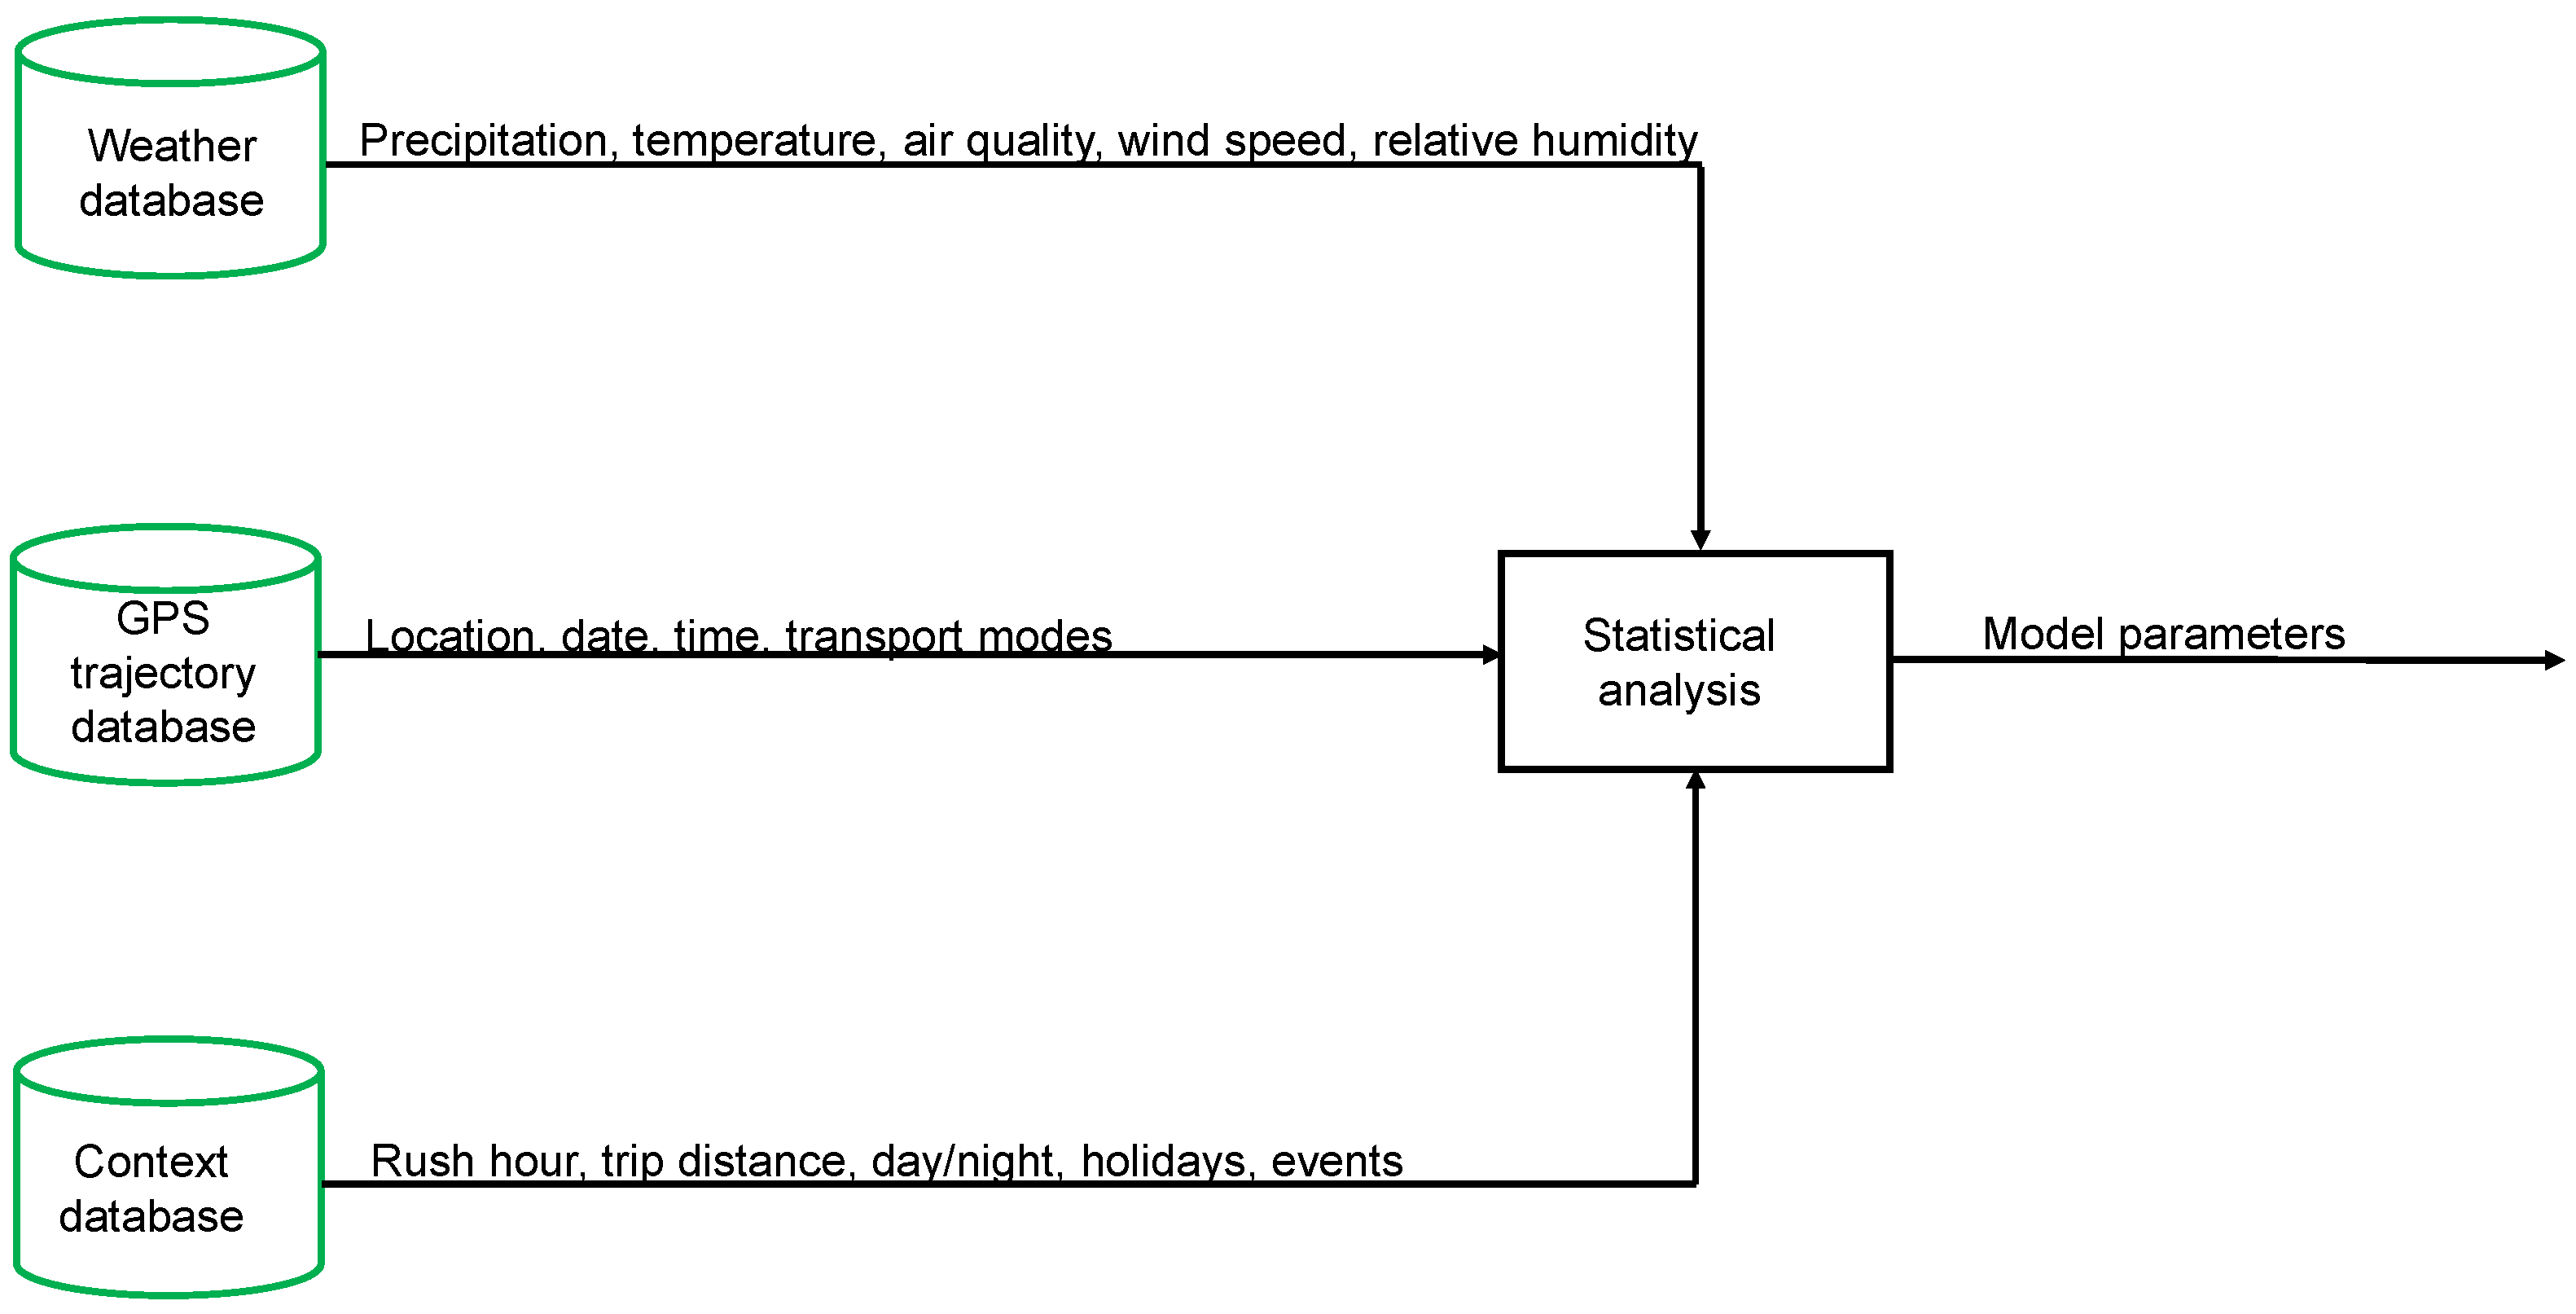
3. Statistical Analysis
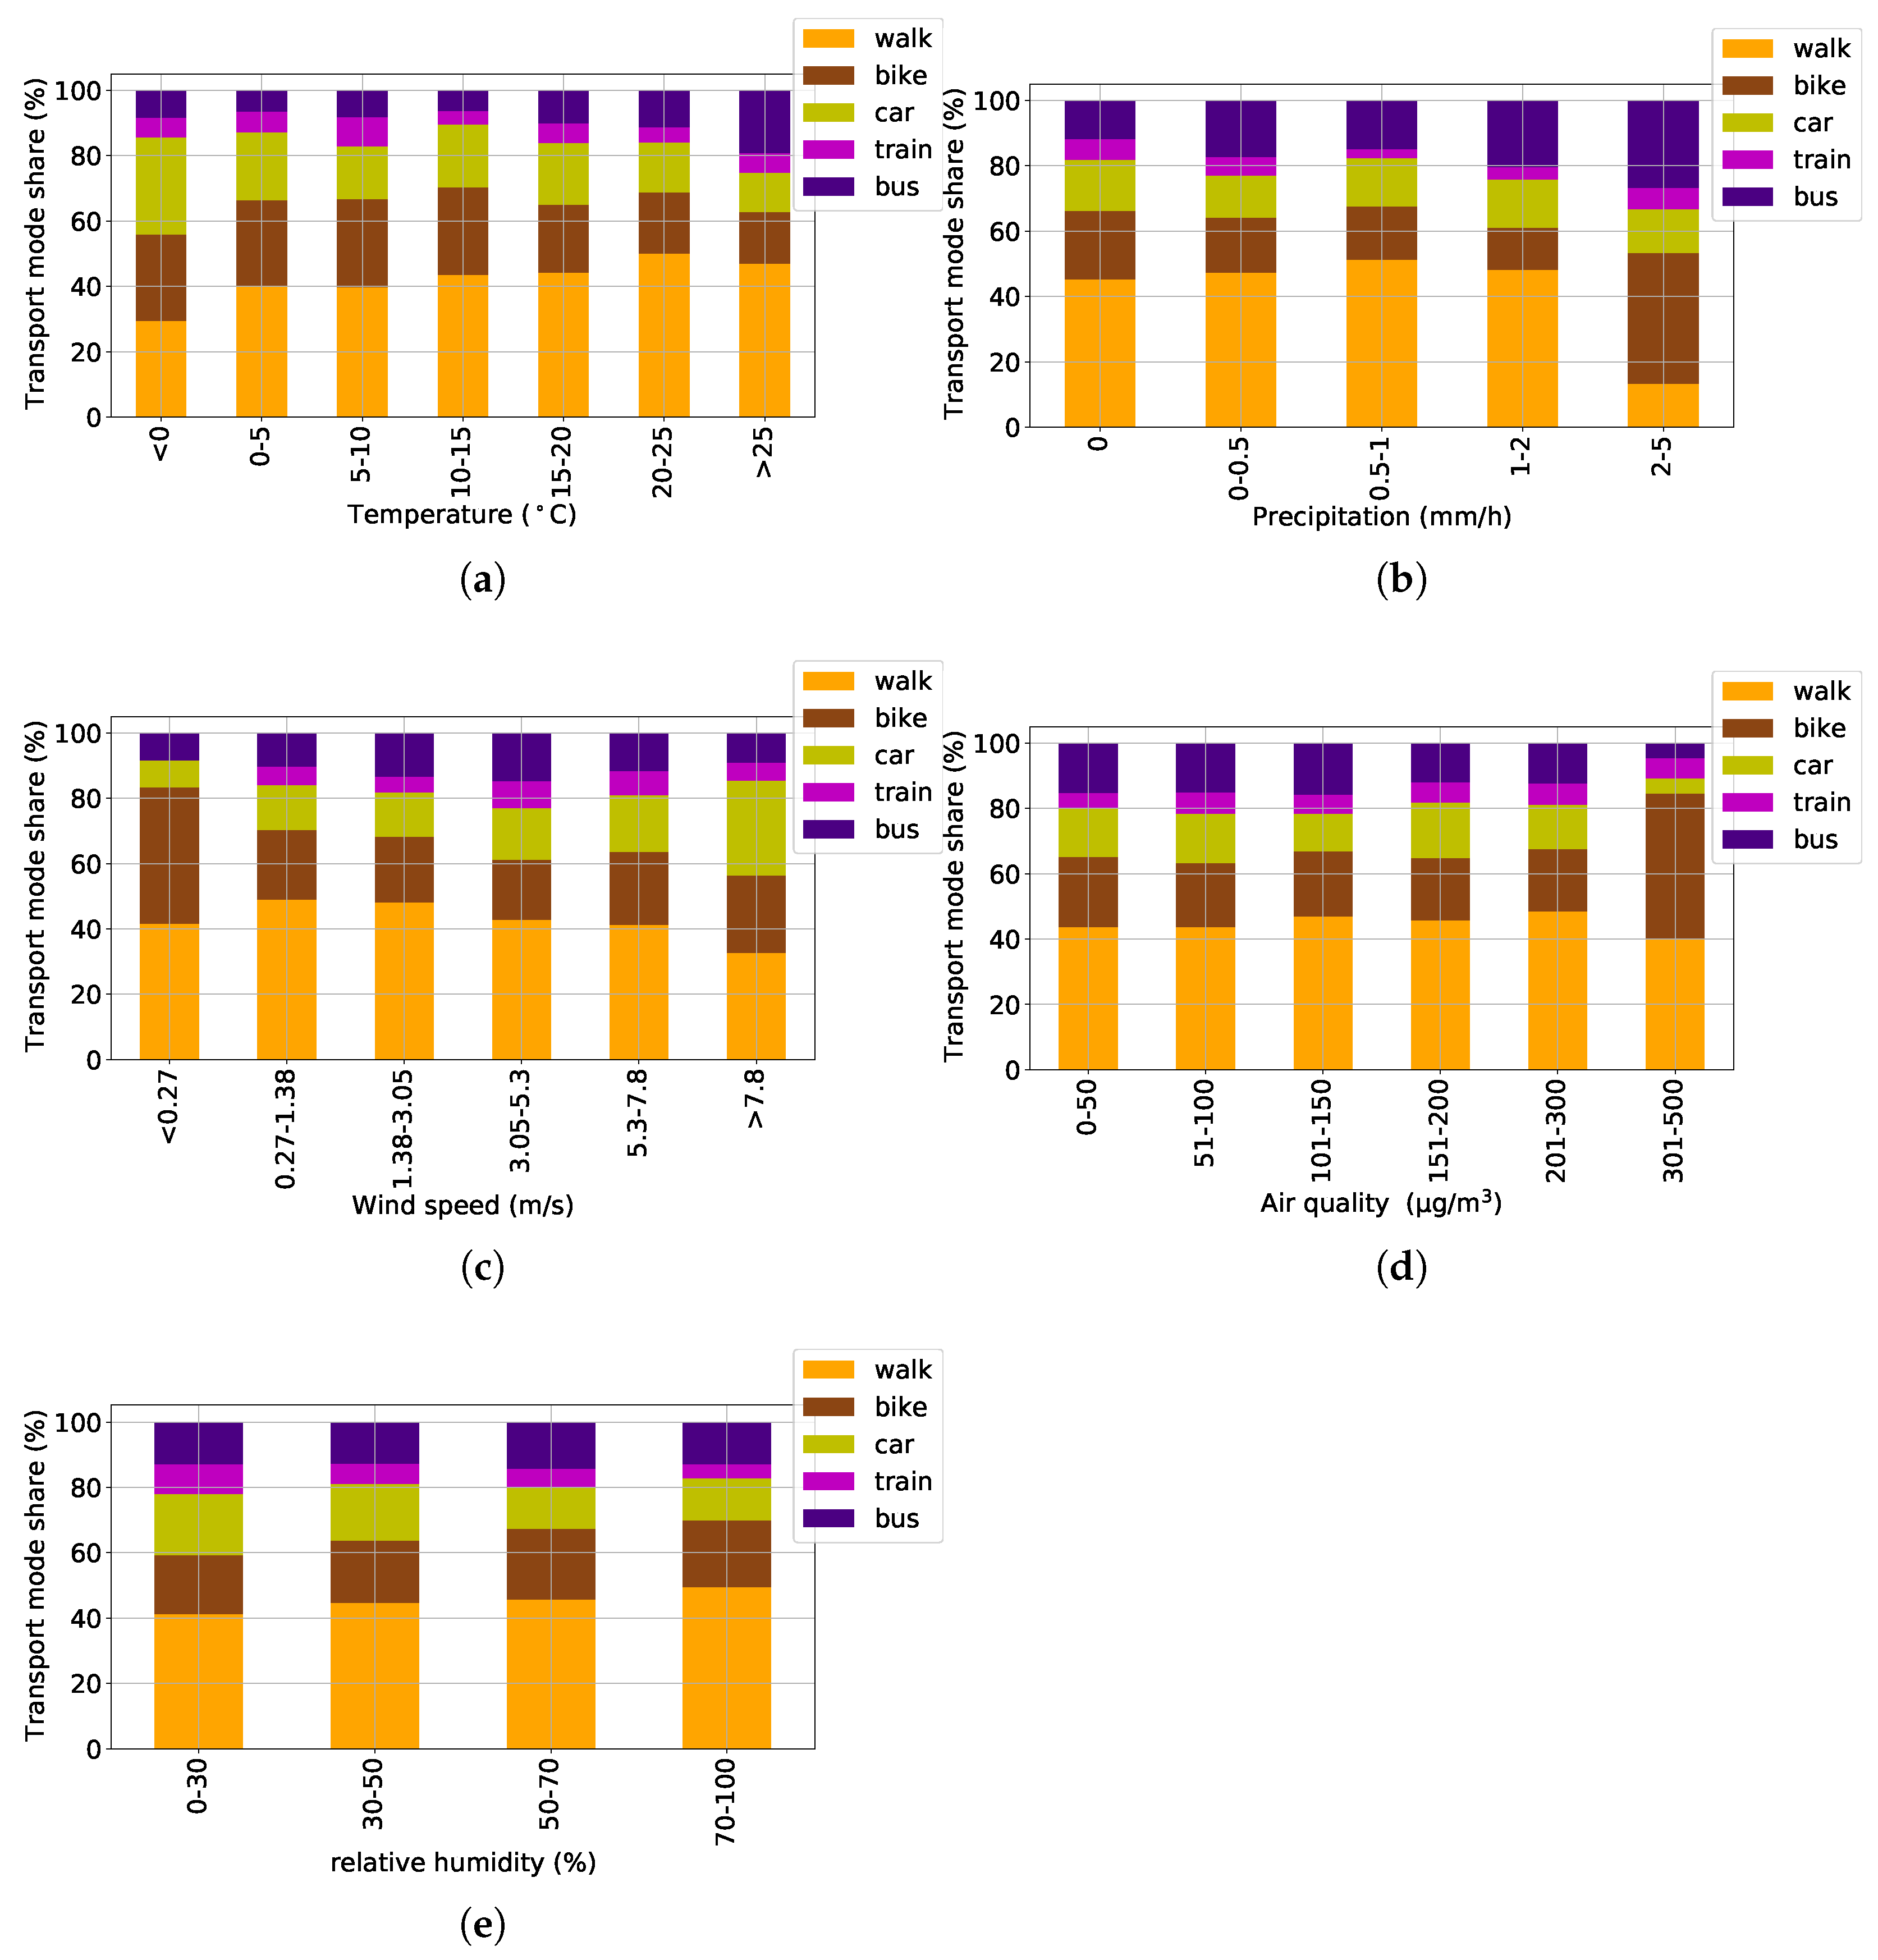
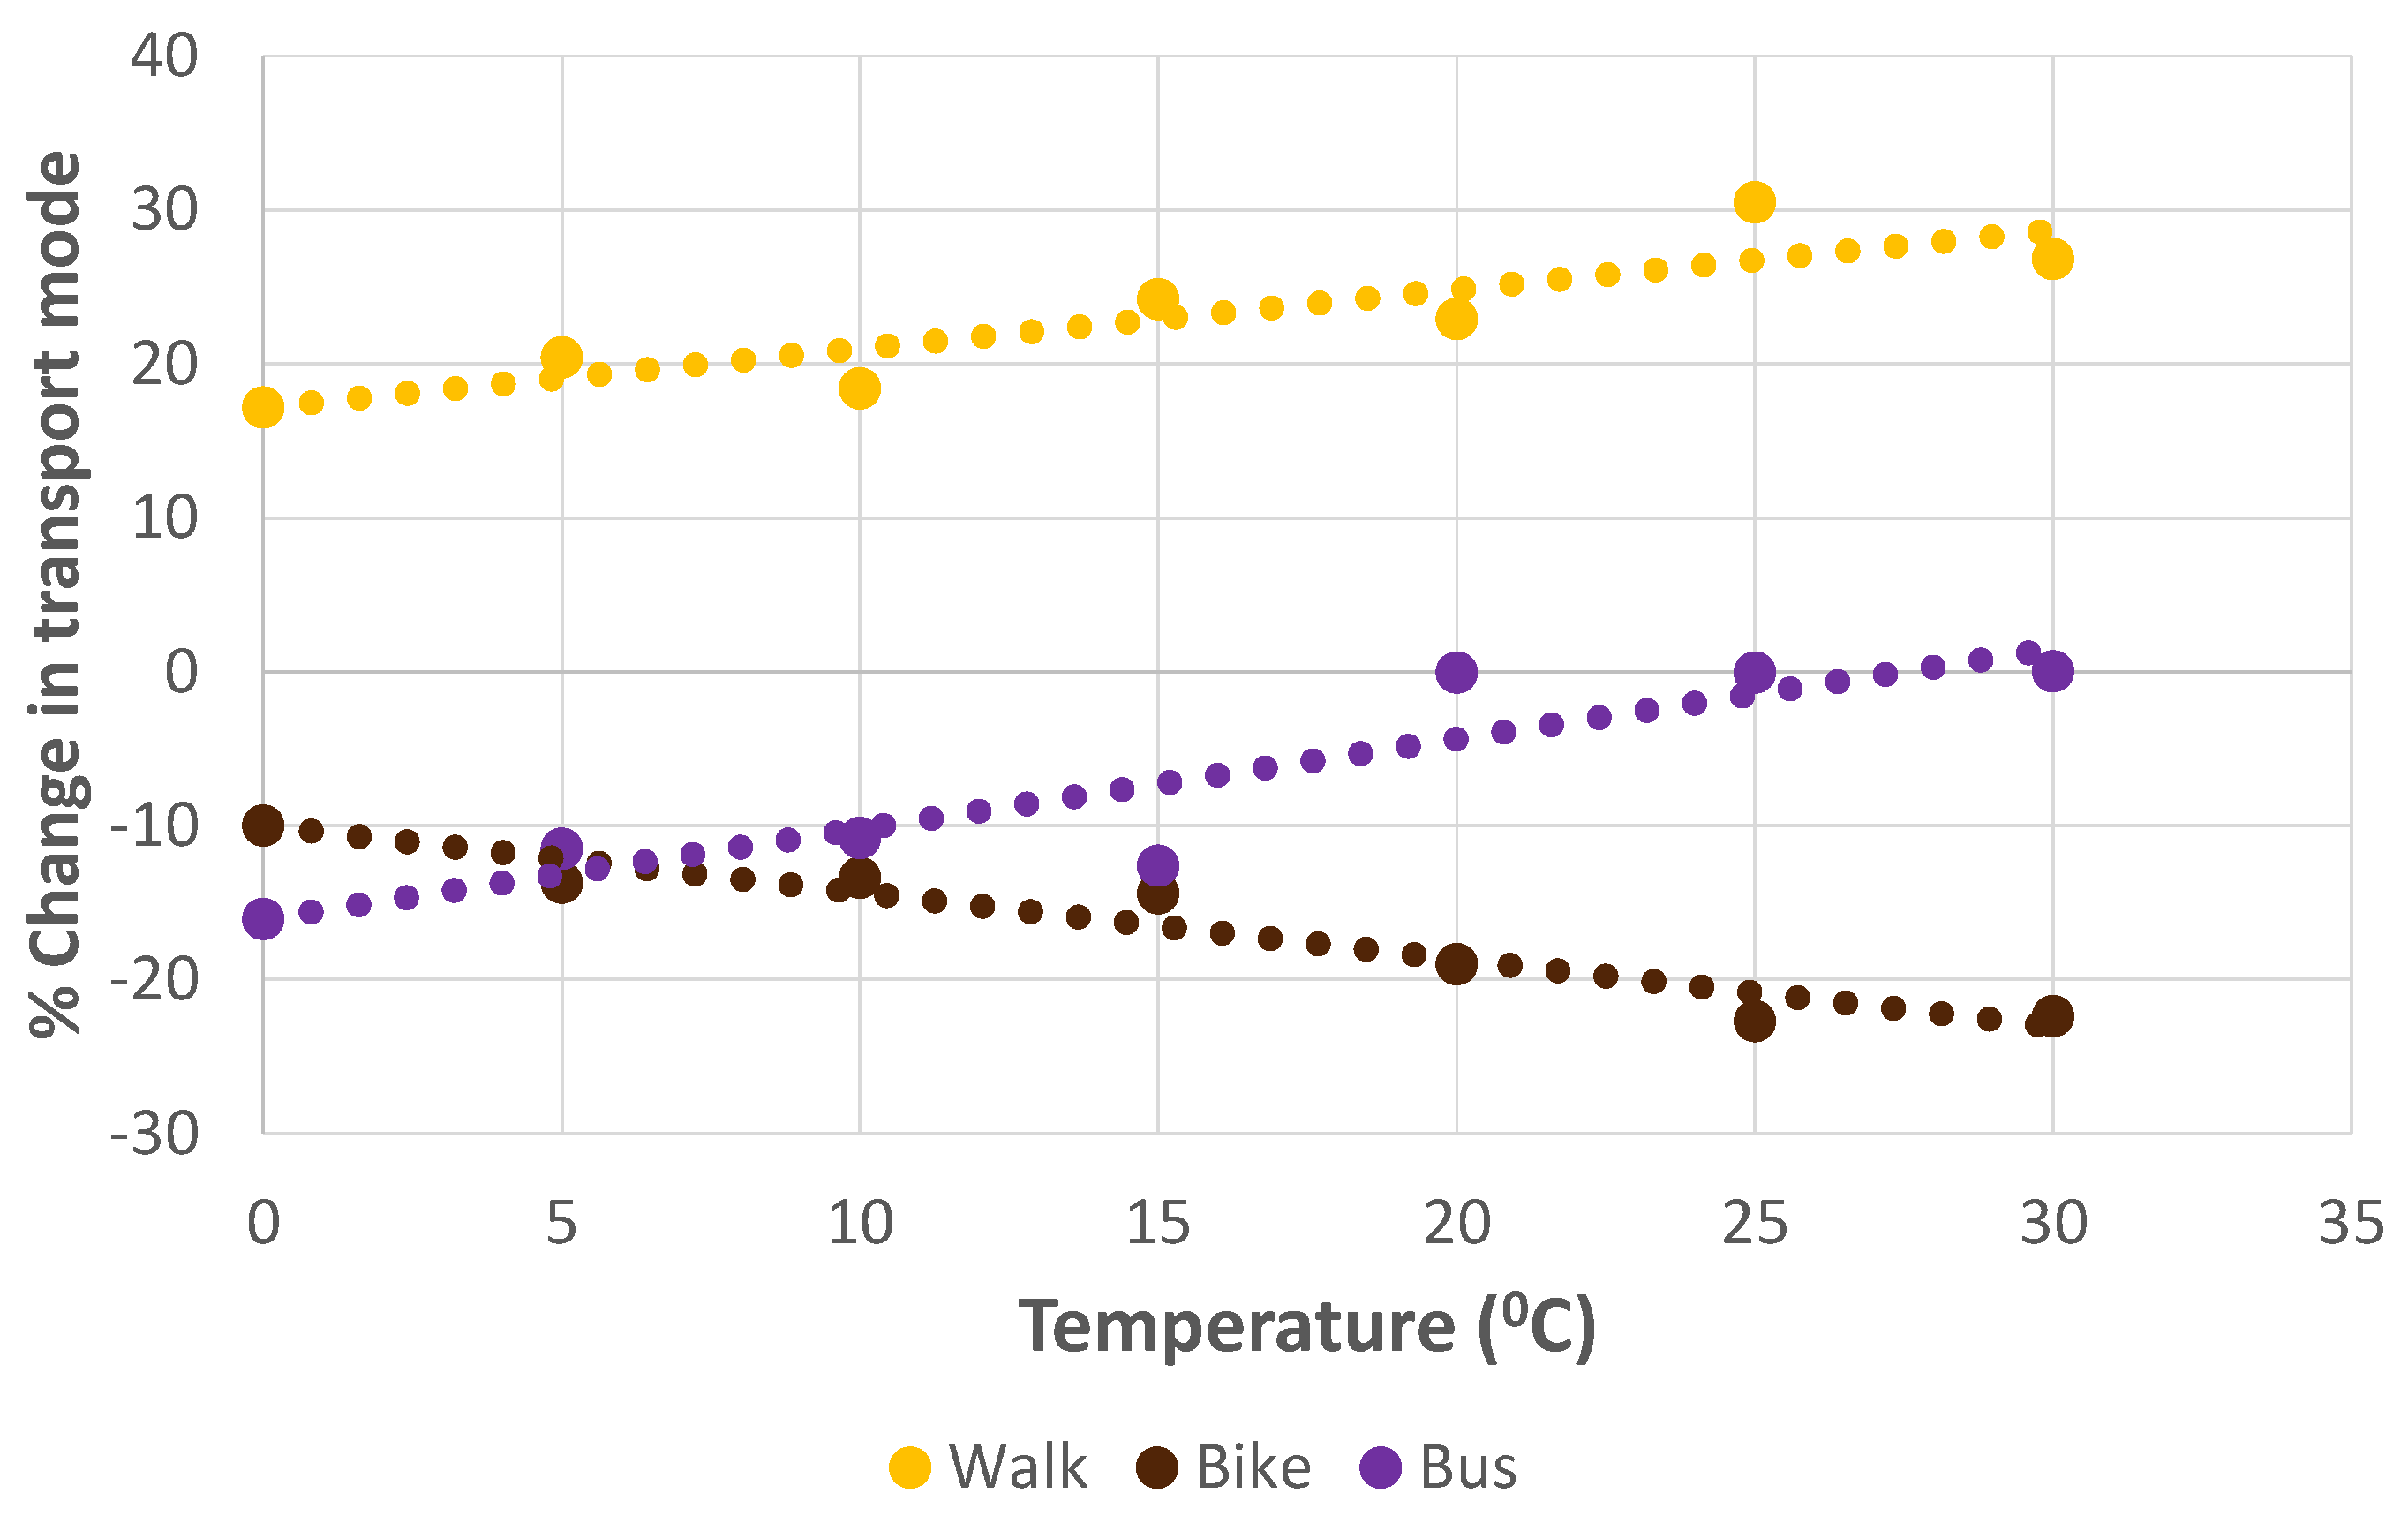
3.1. Influence of the Weather Condition on the Transport Mode Choices
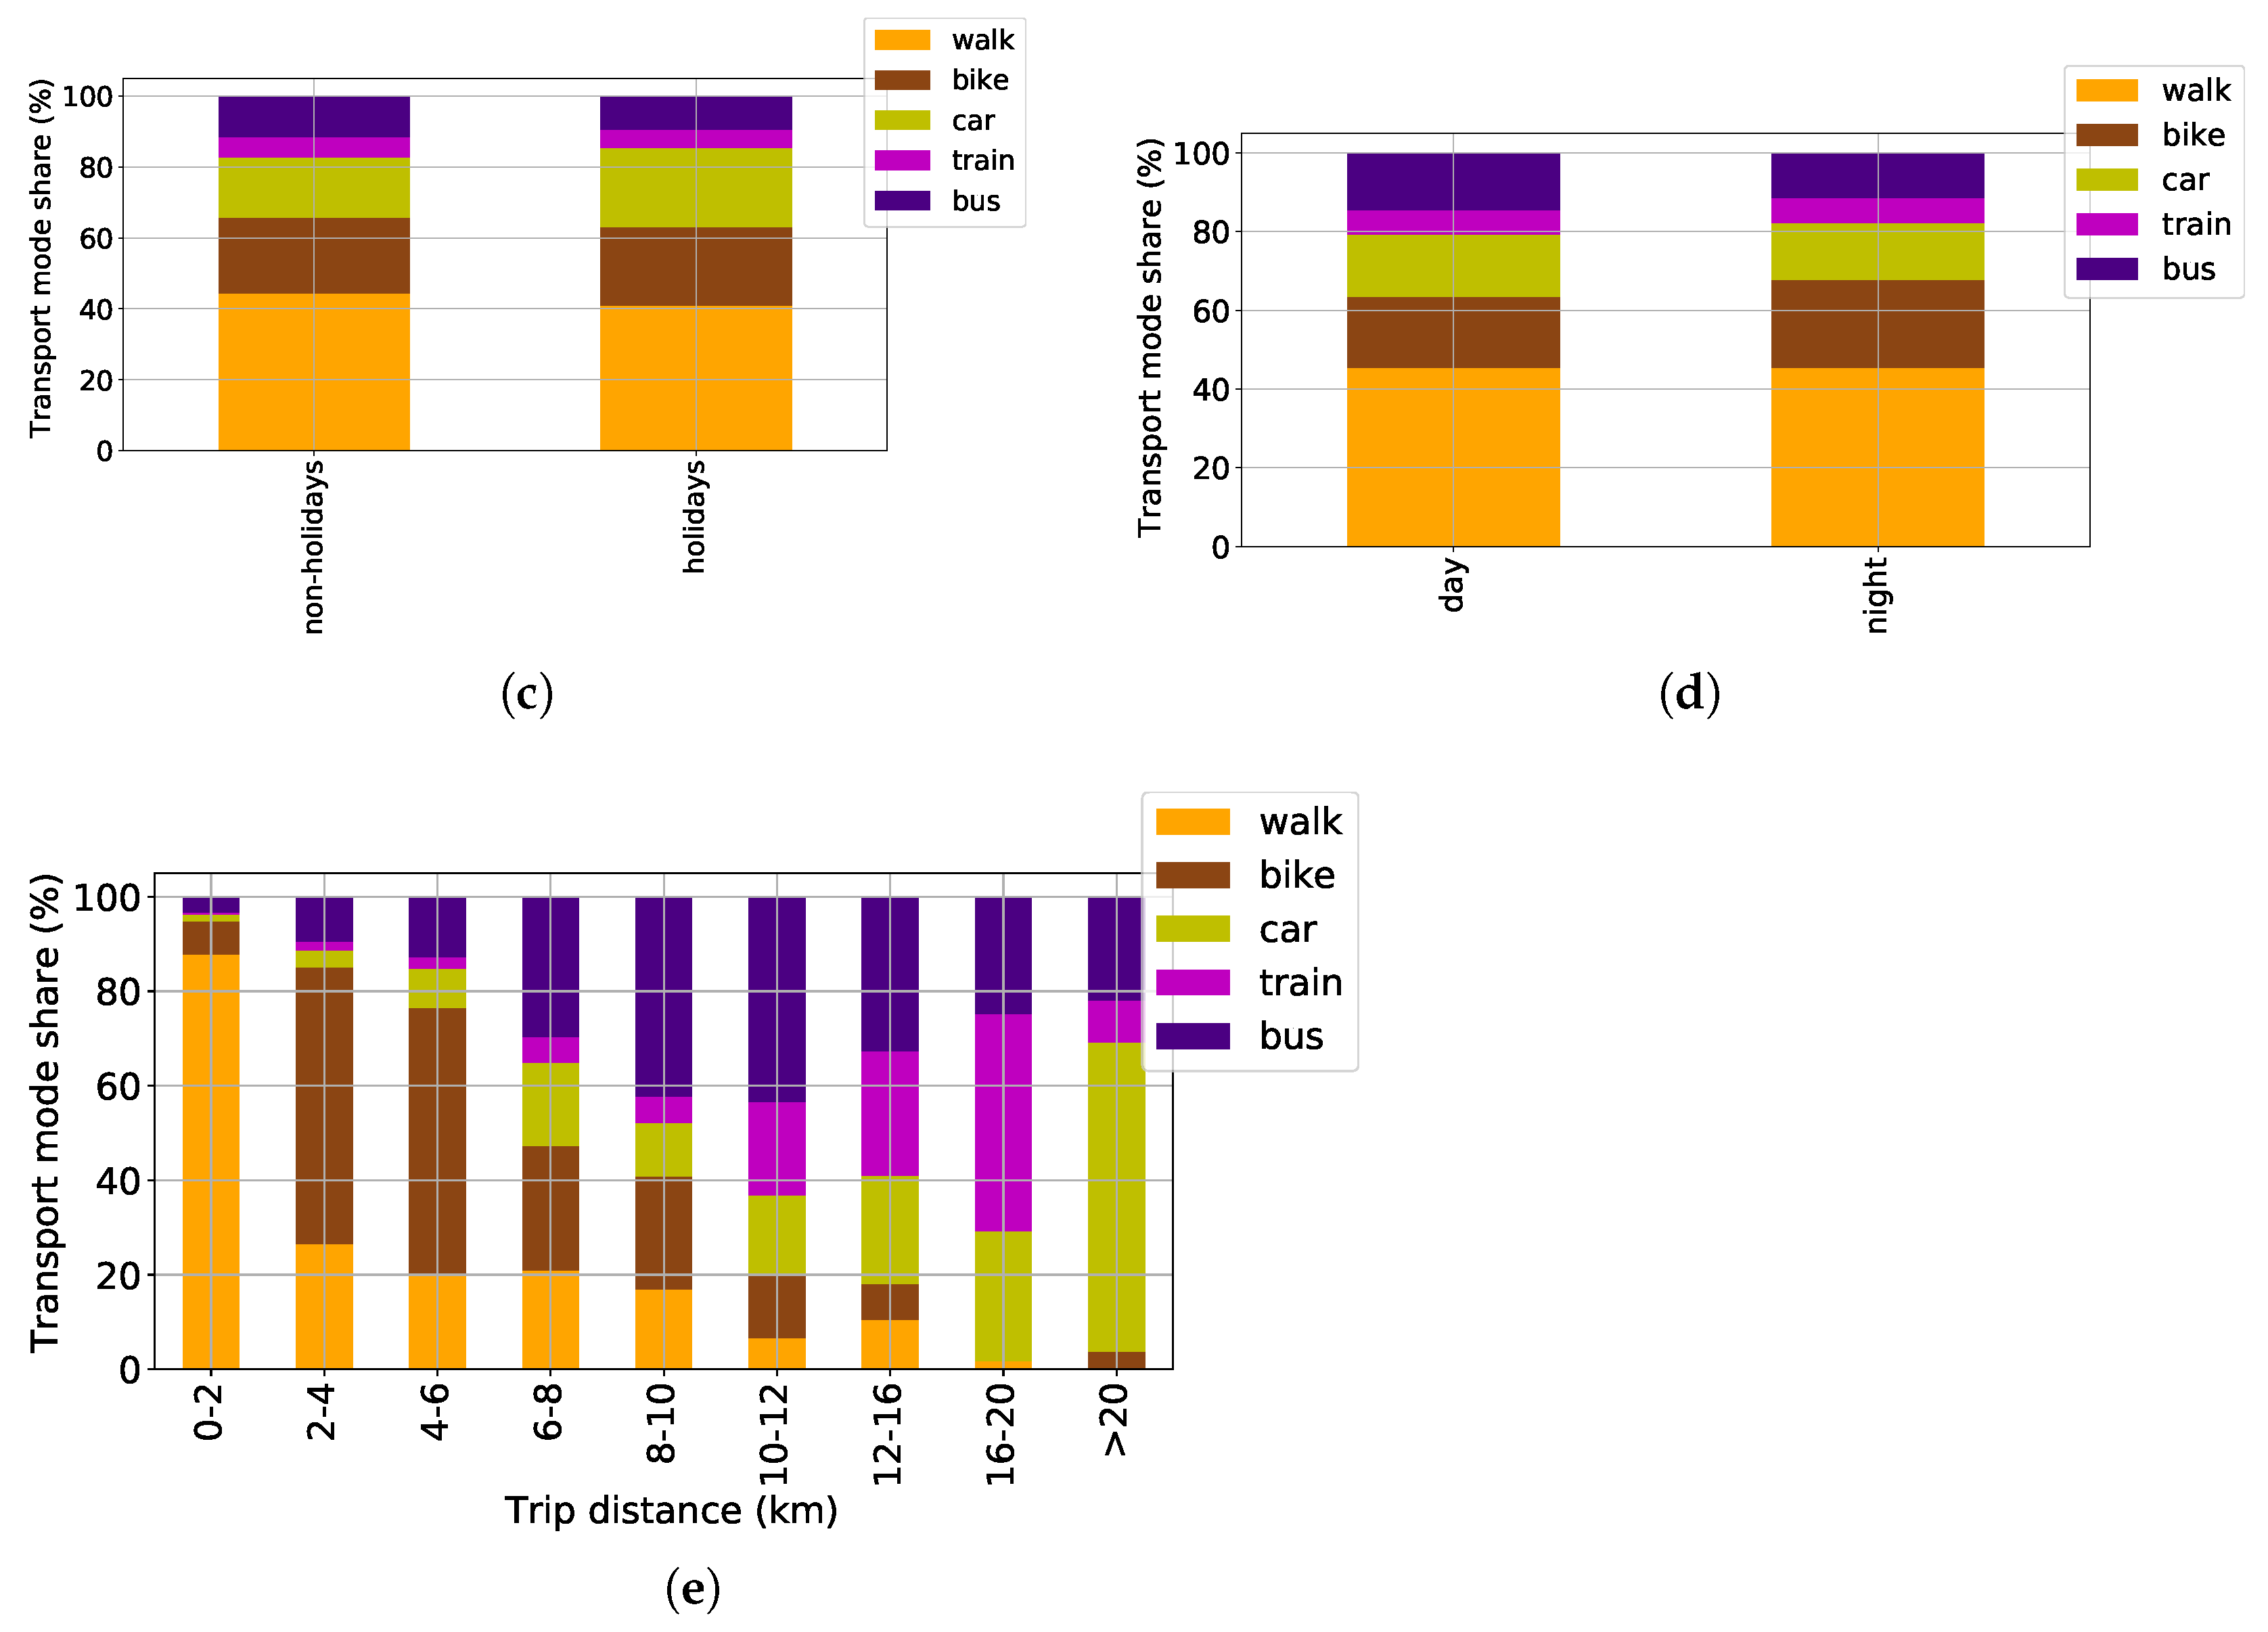
3.2. Influence of Context Information on the Transport Mode Choices
4. Statistical Modeling
4.1. Methods
4.2. Results
5. Discussion
5.1. Air Quality
5.2. Temperature
5.3. Wind Speed
5.4. Trip Distance
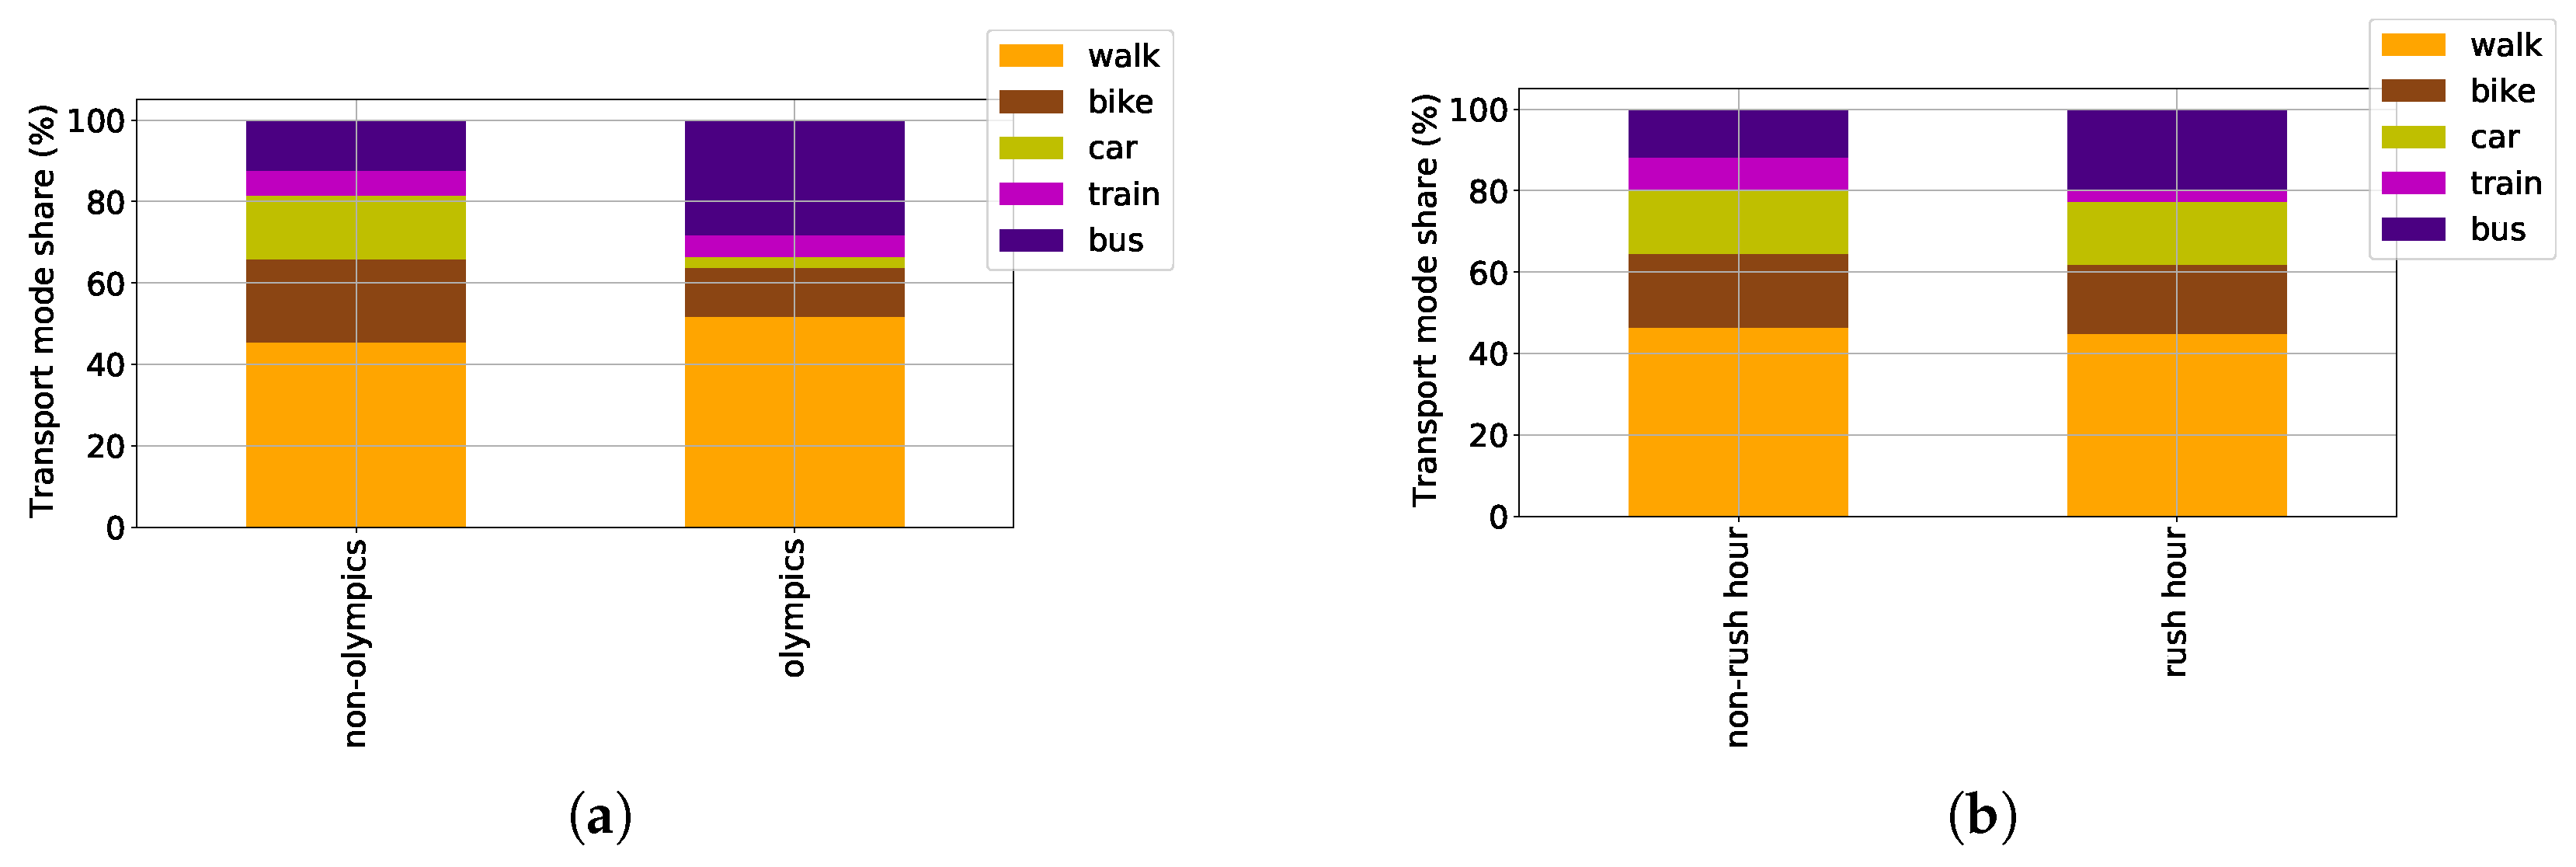
5.5. Olympics
5.6. Rush Hour
5.7. Day/Night
6. Conclusions
Author Contributions
Funding
Institutional Review Board Statement
Informed Consent Statement
Data Availability Statement
Acknowledgments
Conflicts of Interest
References
- International Council on Clean Transportation: Decarbonizing Transportation. Available online: https://theicct.org/ (accessed on 20 April 2022).
- Emissions by Sector. Available online: https://ourworldindata.org/emissions-by-sector (accessed on 20 April 2022).
- Dixit, M.; Sivakumar, A. Capturing the impact of individual characteristics on transport accessibility and equity analysis. Transp. Res. Part D Transp. Environ. 2020, 87, 102473. [Google Scholar] [CrossRef] [PubMed]
- Fatima, K.; Moridpour, S.; Saghapour, T. Spatial and Temporal Distribution of Elderly Public Transport Mode Preference. Sustainability 2021, 13, 4752. [Google Scholar] [CrossRef]
- Şimşekoğlu, Ö.; Nordfjærn, T.; Rundmo, T. The role of attitudes, transport priorities, and car use habit for travel mode use and intentions to use public transportation in an urban Norwegian public. Transp. Policy 2015, 42, 113–120. [Google Scholar] [CrossRef]
- Guzman, L.A.; Oviedo, D.; Rivera, C.M.R. Assessing equity in transport accessibility to work and study: The Bogotá region. J. Transp. Geogr. 2017, 58, 236–246. [Google Scholar] [CrossRef]
- Koetse, M.J.; Rietveld, P. The impact of climate change and weather on transport: An overview of empirical findings. Transp. Res. Part D Transp. Environ. 2009, 14, 205–221. [Google Scholar] [CrossRef]
- Liu, C.; Susilo, Y.O.; Karlström, A. Weather variability and travel behaviour—What we know and what we do not know. Transp. Rev. 2017, 37, 715–741. [Google Scholar] [CrossRef]
- Böcker, L.; Dijst, M.; Prillwitz, J. Impact of Everyday Weather on Individual Daily Travel Behaviours in Perspective: A Literature Review. Transp. Rev. 2013, 33, 71–91. [Google Scholar] [CrossRef]
- Li, J.; Li, X.; Wei Chen, D.; Godding, L. Assessment of metro ridership fluctuation caused by weather conditions in Asian context: Using archived weather and ridership data in Nanjing. J. Transp. Geogr. 2017, 66, 356–368. [Google Scholar] [CrossRef]
- Cools, M.; Moons, E.; Creemers, L.; Wets, G. Changes in Travel Behavior in Response to Weather Conditions: Do Type of Weather and Trip Purpose Matter? Transp. Res. Rec. 2010, 2157, 22–28. [Google Scholar] [CrossRef] [Green Version]
- Arana, P.; Cabezudo, S.; Peñalba, M. Influence of weather conditions on transit ridership: A statistical study using data from Smartcards. Transp. Res. Part A Policy Pract. 2014, 59, 1–12. [Google Scholar] [CrossRef]
- Böcker, L.; Uteng, T.P.; Liu, C.; Dijst, M. Weather and daily mobility in international perspective: A cross-comparison of Dutch, Norwegian and Swedish city regions. Transp. Res. Part D Transp. Environ. 2019, 77, 491–505. [Google Scholar] [CrossRef]
- Singhal, A.; Kamga, C.; Yazici, M.A. Impact of weather on urban transit ridership. Transp. Res. Part A Policy Pract. 2014, 69, 379–391. [Google Scholar] [CrossRef]
- Böcker, L.; Prillwitz, J.; Dijst, M. Climate change impacts on mode choices and travelled distances: A comparison of present with 2050 weather conditions for the Randstad Holland. J. Transp. Geogr. 2013, 28, 176–185. [Google Scholar] [CrossRef]
- Hagenauer, J.; Helbich, M. A comparative study of machine learning classifiers for modeling travel mode choice. Expert Syst. Appl. 2017, 78, 273–282. [Google Scholar] [CrossRef]
- Ma, L.; Xiong, H.; Wang, Z.; Xie, K. Impact of weather conditions on middle school students’ commute mode choices: Empirical findings from Beijing, China. Transp. Res. Part D Transp. Environ. 2019, 68, 39–51. [Google Scholar] [CrossRef]
- Li, L.; Wang, J.; Song, Z.; Dong, Z.; Wu, B.J. Analysing the impact of weather on bus ridership using smart card data. IET Intell. Transp. Syst. 2015, 9, 221–229. [Google Scholar] [CrossRef]
- Li, X.; Ma, Q.; Wang, W.; Wang, B. Influence of Weather Conditions on the Intercity Travel Mode Choice: A Case of Xi’an. Comput. Intell. Neurosci. 2021, 2021, 9969322. [Google Scholar] [CrossRef]
- Hyland, M.F.; Frei, C.; Frei, A.; Mahmassani, H.S. Riders on the storm: Exploring weather and seasonality effects on commute mode choice in Chicago. Travel Behav. Soc. 2018, 13, 44–60. [Google Scholar] [CrossRef]
- Creemers, L.; Wets, G.; Cools, M. Meteorological variation in daily travel behaviour: Evidence from revealed preference data from the Netherlands. Theor. Appl. Climatol. 2014, 120, 183–194. [Google Scholar] [CrossRef] [Green Version]
- Ton, D.; Duives, D.C.; Cats, O.; Hoogendoorn-Lanser, S.; Hoogendoorn, S.P. Cycling or walking? Determinants of mode choice in the Netherlands. Transp. Res. Part A Policy Pract. 2019, 123, 7–23. [Google Scholar] [CrossRef]
- Böcker, L.; Dijst, M.; Faber, J. Weather, transport mode choices and emotional travel experiences. Transp. Res. Part A Policy Pract. 2016, 94, 360–373. [Google Scholar] [CrossRef]
- Alakbarov, R.G. Challenges of Mobile Devices’ Resources and in Communication Channels and Their Solutions. Int. J. Comput. Netw. Inf. Secur. 2021, 13, 39–46. [Google Scholar] [CrossRef]
- GeoLife: Building Social Networks Using Human Location History. Available online: https://www.microsoft.com/en-us/research/project/geolife (accessed on 10 September 2021).
- Beijing Travel Guide. Available online: https://travel.usnews.com/Beijing_China/Getting_Around/ (accessed on 12 January 2022).
- Zheng, Y.; Zhang, L.; Xie, X.; Ma, W.Y. Mining interesting locations and travel sequences from GPS trajectories. In Proceedings of the 18th International World Wide Web Conference, Madrid, Spain, 20–24 April 2009. [Google Scholar]
- Shaham, S.; Ding, M.; Liu, B.; Dang, S.; Lin, Z.; Li, J. Privacy Preserving Location Data Publishing: A Machine Learning Approach. IEEE Trans. Knowl. Data Eng. 2021, 33, 3270–3283. [Google Scholar] [CrossRef] [Green Version]
- Lehmann, A.L.; Alvares, L.O.; Bogorny, V. SMSM: A similarity measure for trajectory stops and moves. Int. J. Geogr. Inf. Sci. 2019, 33, 1847–1872. [Google Scholar] [CrossRef]
- Qi, M.; Wang, Z.; He, Z.; Shao, Z. User Identification across Asynchronous Mobility Trajectories. Sensors 2019, 19, 2102. [Google Scholar] [CrossRef] [Green Version]
- Nawaz, A.; Huang, Z.; Wang, S.; Akbar, A.; AlSalman, H.; Gumaei, A. GPS Trajectory Completion Using End-to-End Bidirectional Convolutional Recurrent Encoder-Decoder Architecture with Attention Mechanism. Sensors 2020, 20, 5143. [Google Scholar] [CrossRef]
- Namdarpour, F.; Mesbah, M.; Gandomi, A.H.; Assemi, B. Using genetic programming on GPS trajectories for travel mode detection. IET Intell. Transp. Syst. 2022, 16, 99–113. [Google Scholar] [CrossRef]
- POWER Data Access Viewe. Available online: https://power.larc.nasa.gov/data-access-viewer/ (accessed on 12 November 2021).
- Climate - Beijing (China). Available online: http://www.climatestotravel.com/climate/china/beijing (accessed on 12 January 2022).
- Travel Demand Management Options in Beijing. Available online: https://www.adb.org/sites/default/files/publication/325266/travel-demand-management-beijing.pdf (accessed on 12 January 2022).
- China Public Holidays Calendar. Available online: https://www.beijingesc.com/china-holiday-calendar.html (accessed on 12 January 2022).
- Cavallaro, C.; Vitrià, J. Corridor Detection from Large GPS Trajectories Datasets. Appl. Sci. 2020, 10, 5003. [Google Scholar] [CrossRef]
- Aultman-Hall, L.; Lane, D.; Lambert, R.R. Assessing Impact of Weather and Season on Pedestrian Traffic Volumes. Transp. Res. Rec. 2009, 2140, 35–43. [Google Scholar] [CrossRef] [Green Version]
- Ma, Y.; Ni, G.; Chandra, C.V.; Tian, F.; Chen, H. Statistical characteristics of raindrop size distribution during rainy seasons in the Beijing urban area and implications for radar rainfall estimation. Hydrol. Earth Syst. Sci. 2019, 23, 4153–4170. [Google Scholar] [CrossRef] [Green Version]
- Harikumar, R.; Sampath, S.; Sasi Kumar, V. Variation of rain drop size distribution with rain rate at a few coastal and high altitude stations in southern peninsular India. Adv. Space Res. 2010, 45, 576–586. [Google Scholar] [CrossRef]
- Royal Meteorological Society. Available online: https://www.rmets.org/resource/beaufort-scale/ (accessed on 12 January 2022).
- Air Quality Index (AQI). Available online: https://www.epa.gov/sites/default/files/2014-05/documents/zell-aqi.pdf (accessed on 12 January 2022).
- Lu, J.; Zhang, X.; Li, P.; Zhu, Y. Case-Based FCTF Reasoning System. Appl. Sci. 2015, 5, 825–839. [Google Scholar] [CrossRef]
- Hall, R.W. Handbook of Transportation Science; Springer: Berlin/Heidelberg, Germany, 1999. [Google Scholar]
- StataCorp. Stata Base Reference Manual. Available online: https://www.stata.com/manuals/r.pdf (accessed on 12 December 2021).
- Li, R.; Li, Z.; Gao, W.; Ding, W.; Xu, Q.; Song, X. Diurnal, seasonal, and spatial variation of PM2.5 in Beijing. Sci. Bull. 2015, 60, 387–395. [Google Scholar] [CrossRef] [Green Version]
- American Academy of Pediatrics Committee on Environmental Health: Ambient air pollution: Respiratory hazards to children. Pediatrics 1993, 91 6, 1210–1213.
- Böcker, L.; Thorsson, S. Integrated weather effects on cycling shares, frequencies, and durations in Rotterdam, the Netherlands. Weather Clim. Soc. 2014, 6, 468–481. [Google Scholar] [CrossRef]
- Thomas, T.; Jaarsma, R.; Tutert, B. Exploring temporal fluctuations of daily cycling demand on Dutch cycle paths: The influence of weather on cycling. Transportation 2013, 40, 1–22. [Google Scholar] [CrossRef] [Green Version]
- Gebhart, K.; Noland, R.B. The impact of weather conditions on bikeshare trips in Washington, DC. Transportation 2014, 41, 1205–1225. [Google Scholar] [CrossRef]
- Ahmed, F.; Rose, G.; Figliozzi, M.A.; Jakob, C. Commuter Cyclist’s Sensitivity to Changes in Weather: Insight from Two Cities with Different Climatic Conditions. In Proceedings of the Transportation Research Board Annual Meeting, Washington, DC, USA, 22–26 January 2012. [Google Scholar]
- Saneinejad, S.; Roorda, M.J.; Kennedy, C.A. Modelling the impact of weather conditions on active transportation travel behaviour. Transp. Res. Part D Transp. Environ. 2012, 17, 129–137. [Google Scholar] [CrossRef] [Green Version]
- Flynn, B.S.; Dana, G.S.; Sears, J.; Aultman-Hall, L. Weather factor impacts on commuting to work by bicycle. Prev. Med. 2012, 54, 122–124. [Google Scholar] [CrossRef]
- Handy, S.L.; van Wee, B.; Kroesen, M. Promoting Cycling for Transport: Research Needs and Challenges. Transp. Rev. 2014, 34, 4–24. [Google Scholar] [CrossRef]
- Zhang, W.; Lu, D.; Chen, Y.; jun Liu, C. Land use densification revisited: Nonlinear mediation relationships with car ownership and use. Transp. Res. Part D Transp. Environ. 2021, 98, 102985. [Google Scholar] [CrossRef]
- Yang, J.; Liu, Y.; Qin, P.; Liu, A.A. A review of Beijing’s vehicle registration lottery: Short-term effects on vehicle growth and fuel consumption. Energy Policy 2014, 75, 157–166. [Google Scholar] [CrossRef]
- Wang, L.; Xu, J.; Qin, P. Will a driving restriction policy reduce car trips?—The case study of Beijing, China. Transp. Res. Part A Policy Pract. 2014, 67, 279–290. [Google Scholar] [CrossRef]
- Huang, H.; Lin, Y.; Weng, J.; Rong, J.; Liu, X. Identification of Inelastic Subway Trips Based on Weekly Station Sequence Data: An Example from the Beijing Subway. Sustainability 2018, 10, 4725. [Google Scholar] [CrossRef] [Green Version]


| Description | Data Source | Travel Modes | Main Variables |
|---|---|---|---|
| Metro ridership fluctuation due to weather [10] | Fare collection system from Nanjing | Metro | Temperature, precipitation, seasonality |
| Travel behavior changes due to weather [11] | Flemish travel survey | Temperature, rainfall, wind, shopping, leisure trips | |
| Analysis of weather conditions on transit ridership [12] | Automatic vehicle location system from Gipuzkoa | Bus | Precipitation, temperature, wind speed, air humility |
| Weather and daily mobility in international perspective [13] | Survey data from Utrecht, Oslo, Stavanger, Stockholm | Bike, walk, bus, train, car | Temperature, wind, rain, snow, fog |
| Impact of weather on urban transit ridership [14] | Fare collection system from NewYork | Subway | Night time, darkness, temperature, rain, snow |
| Climate change impact on mode choices and traveled distances [15] | Survey data from Randstad | Walk, bike, car, train, bus, tram | Seasons, travelled distance |
| Machine learning classifiers for modeling travel mode choices [16] | Dutch travel survey | Walk, bike, car, train, bus | Precipitation, temperature, wind, built environment, household income, individual characteristics, distance |
| Impact of weather conditions on middle school students’ commute mode choices [17] | Beijing school commute Survey | Walk, bike, car, bus, train | Wind, temperature, air quality, humidity |
| Impact of weather on bus ridership [18] | Smart card data collected in Fengxian | Bus | Humidity, wind speed, rainfall and temperature |
| Influence of weather on the intercity travel [19] | Survey data from Xi’an | Airplane, high-speed rail, train, bus | Temperature, relative humidity, rainfall, wind, air quality index |
| Influence of weather and seasonality effects on commute mode choice [20] | Survey data from Chicago | Walk, bike, car | Seasonality |
| Meteorological variation in daily travel behavior [21] | Dutch national travel household survey | Walk, bike, train, bus, tram | Fog, temperature, precipitation, cloud cover, snow, thunderstorm |
| Cycling or walking? [22] | Household, personal and travel diary from the Netherlands | Walk, bike | Season, weather, trip characteristics, built environment, work conditions |
| Weather, transport mode choices and emotional travel experiences [23] | Travel diary from Rotterdam | Walk, cycle, car, bus, train | Temperature, Wind, Sky cleanness, Precipitation |
| Our study: Modeling the impact of weather and context data on transport mode choices | GPS trajectories from Beijing | Walk, bike, car, bus, train | Temperature, precipitation, relative humidity, wind speed, air quality, rush hours, holidays, day/night, Olympics, trip distance |
| Mean | Std.dev | Min | Max | |
|---|---|---|---|---|
| Temperature (°C) | 19.153 | 8.477 | −9.22 | 38.45 |
| Precipitation (mm/h) | 0.083 | 0.307 | 0 | 5 |
| Relative Humidity (%) | 53.837 | 22.076 | 6.25 | 100 |
| Wind speed (m/s) | 3.064 | 1.742 | 0.05 | 12.37 |
| Air quality (μg/m3) | 153.016 | 64.545 | 13 | 547 |
| Distance (km) | 7.993 | 12.341 | 0 | 117.216 |
| Observable Variables | Multinomial Logit (MNL) | Multinomial Probit (MNP) | ||||||
|---|---|---|---|---|---|---|---|---|
| Bike | Car | Bus | Train | Bike | Car | Bus | Train | |
| Intercept | 0.4154 | −2.560 ** | −1.265 ** | −2.928 ** | 0.320 | −1.607 ** | −0.788 * | −1.701 ** |
| Temperature (°C) | ||||||||
| <0 (cold) | ref | ref | ref | ref | ref | ref | ref | ref |
| 0–15 (mild) | −1.122 ** | −1.068 | −2.292 ** | −1.349 * | −0.974 ** | −0.823 * | −1.685 ** | −0.981 * |
| 15–25 (warm) | −1.628 ** | −1.371 * | −2.152 ** | −2.068 ** | −1.335 ** | −0.998 * | −1.642 ** | −1.464 ** |
| >25 (high) | −1.969 ** | −1.558 ** | −1.331 * | −1.338 * | −1.585 ** | −1.144 * | −1.103 ** | −1.013 * |
| Wind speed (m/s) | ||||||||
| 0–3 | ref | ref | ref | ref | ref | ref | ref | ref |
| 3–7.8 | 0.013 | 0.311 | 0.256 | 0.554 * | 0.020 | 0.177 | 0.160 | 0.320 ** |
| >7.8 | 0.280 | 0.621 | −0.018 | 0.228 | 0.200 | 0.400 | −0.004 | 0.069 |
| Air quality (μg/m3) | ||||||||
| <300 | ref | ref | ref | ref | ref | ref | ref | ref |
| >300 | 0.921 ** | −1.333 | −0.564 | 0.405 | 0.735 * | −0.524 | -0.270 | 0.315 |
| Trip distance (km) | ||||||||
| 0–4 | ref | ref | ref | ref | ref | ref | ref | ref |
| 4–8 | 2.143 ** | 2.875 ** | 2.588 ** | 2.829 ** | 1.741 ** | 1.964 ** | 1.890 ** | 1.890 ** |
| 8–12 | 1.912 ** | 4.222 ** | 4.305 ** | 4.926 ** | 1.480 ** | 2.829 ** | 3.082 ** | 3.150 ** |
| 12–20 | 0.872 * | 5.211 ** | 4.319 ** | 6.381 ** | 0.838 ** | 3.444 ** | 2.992 ** | 4.091 ** |
| >20 | 3.609 ** | 9.380 ** | 7.094 ** | 7.912 ** | 2.150 ** | 5.862 ** | 4.293 ** | 4.553 ** |
| Olympics (ref. non Olympics) | −0.471 | −2.347 ** | 0.2617 | −0.432 | −0.380 | −1.635 ** | 0.210 | −0.353 |
| Rush hour (ref. non rush hour) | 0.022 | −0.999 ** | −0.259 | −1.351 ** | −0.005 | −0.624 ** | −0.146 | −0.827 ** |
| Day (ref. night) | −0.140 | 0.355 | 0.515 ** | 0.059 | 0.102 | 0.211 | 0.330 * | 0.0382 |
| Modelling performance | ||||||||
| Log likelihood | −2498.486 | −2505.669 | ||||||
| AIC | 5108.971 | 5123.339 | ||||||
| BIC | 5438.823 | 5453.19 | ||||||
| McFadden R-squared | 0.3289 | 0.012 | ||||||
| ** Significant at α < 0.01 | * Significant at α < 0.05 | |||||||
| Observable Variables | Multinomial Logit (MNL) | Multinomial Probit (MNP) | ||||||||
|---|---|---|---|---|---|---|---|---|---|---|
| Walk | Bike | Car | Bus | Train | Walk | Bike | Car | Bus | Train | |
| Temperature (°C) | ||||||||||
| <0 (cold) | ref | ref | ref | ref | ref | ref | ref | ref | ref | ref |
| 0–15 (mild) | 0.234 ** | −0.006 | 0.003 | −0.219 ** | −0.013 | 0.273 ** | −0.050 | 0.077 | −0.218 ** | −0.011 |
| 15–25 (warm) | 0.320 ** | −0.107 | −0.004 | −0.177 ** | −0.031 | 0.351 ** | −0.135 | 0.004 | −0.183 ** | −0.037 |
| >25 (high) | 0.279 ** | −0.216 ** | −0.026 | −0.030 | −0.006 | 0.319 ** | −0.234 ** | −0.025 | −0.053 | −0.005 |
| Wind speed (m/s) | ||||||||||
| 0–3 | ref | ref | ref | ref | ref | ref | ref | ref | ref | ref |
| 3–7.8 | −0.039 | −0.024 | 0.018 | 0.027 | 0.018 * | −0.037 | −0.018 | 0.0158 | 0.020 | 0.020 * |
| >7.8 | −0.062 | 0.039 | 0.046 | −0.025 | 0.002 | −0.057 | 0.0342 | 0.05 | −0.024 | −0.002 |
| Air quality (μg/m3) | ||||||||||
| <300 | ref | ref | ref | ref | ref | ref | ref | ref | ref | ref |
| >300 | −0.099 | 0.312 ** | −0.125 ** | −0.096 * | 0.005 | −0.100 | 0.295 ** | −0.121 ** | −0.084 * | 0.010 |
| Trip distance (km) | ||||||||||
| 0–4 | ref | ref | ref | ref | ref | ref | ref | ref | ref | ref |
| 4–8 | −0.517 ** | 0.303 ** | 0.061 ** | 0.125 ** | 0.027 ** | −0.518 ** | 0.298 ** | 0.062 ** | 0.128 ** | 0.028 ** |
| 8–12 | −0.629 ** | −0.015 | 0.123 ** | 0.398 ** | 0.123 ** | −0.629 ** | −0.017 | 0.125 ** | 0.394 ** | 0.126 ** |
| 12–20 | −0.664 ** | −0.162 ** | 0.225 ** | 0.246 ** | 0.353 ** | −0.662 ** | −0.163 ** | 0.229 ** | 0.245 ** | 0.350 ** |
| >20 | −0.725 ** | −0.176 ** | 0.672 ** | 0.162 ** | 0.066 ** | −0.724 ** | −0.177 ** | 0.671 ** | 0.163 ** | 0.067 ** |
| Olympics (ref. non Olympics) | 0.130 * | −0.046 | −0.175 ** | 0.100 ** | −0.004 | 0.140 * | −0.040 | −0.21 ** | 0.115 ** | −0.005 |
| Rush hour (ref. non rush hour) | 0.072 | 0.058 ** | −0.071 * | −0.014 | −0.044 ** | 0.063 | 0.0503 ** | −0.073 ** | 0.004 | −0.052 * |
| Day (ref. night) | −0.031 | −0.064** | 0.024 | 0.073* | −0.006 | −0.029 | −0.057 * | 0.023 | 0.064 * | 0.010 |
| ** Significant at α < 0.01 | * Significant at α < 0.05 | |||||||||
Publisher’s Note: MDPI stays neutral with regard to jurisdictional claims in published maps and institutional affiliations. |
© 2022 by the authors. Licensee MDPI, Basel, Switzerland. This article is an open access article distributed under the terms and conditions of the Creative Commons Attribution (CC BY) license (https://creativecommons.org/licenses/by/4.0/).
Share and Cite
Otim, T.; Dörfer, L.; Ahmed, D.B.; Munoz Diaz, E. Modeling the Impact of Weather and Context Data on Transport Mode Choices: A Case Study of GPS Trajectories from Beijing. Sustainability 2022, 14, 6042. https://doi.org/10.3390/su14106042
Otim T, Dörfer L, Ahmed DB, Munoz Diaz E. Modeling the Impact of Weather and Context Data on Transport Mode Choices: A Case Study of GPS Trajectories from Beijing. Sustainability. 2022; 14(10):6042. https://doi.org/10.3390/su14106042
Chicago/Turabian StyleOtim, Timothy, Leandro Dörfer, Dina Bousdar Ahmed, and Estefania Munoz Diaz. 2022. "Modeling the Impact of Weather and Context Data on Transport Mode Choices: A Case Study of GPS Trajectories from Beijing" Sustainability 14, no. 10: 6042. https://doi.org/10.3390/su14106042
APA StyleOtim, T., Dörfer, L., Ahmed, D. B., & Munoz Diaz, E. (2022). Modeling the Impact of Weather and Context Data on Transport Mode Choices: A Case Study of GPS Trajectories from Beijing. Sustainability, 14(10), 6042. https://doi.org/10.3390/su14106042