
Designing Better Public Transport: Understanding Mode Choice Preferences Following the COVID-19 Pandemic


Abstract
:1. Introduction—The Importance of Public Transport Usage
1.1. COVID-19 in the UK Context
1.2. Aim and Objectives
- Identifying, through literature searching and a focus group, the five most important factors that drive the choice of public transport;
- Designing and running an online discrete choice decision-making experiment;
- Conducting analyses of the data using a multinomial logit model;
- Deriving the relative importance of the different factors as well as a marginal willingness to pay estimate for each.
2. Literature Review
2.1. Discrete Choice Methodology
2.2. DCEs in the Transport Context
3. Method
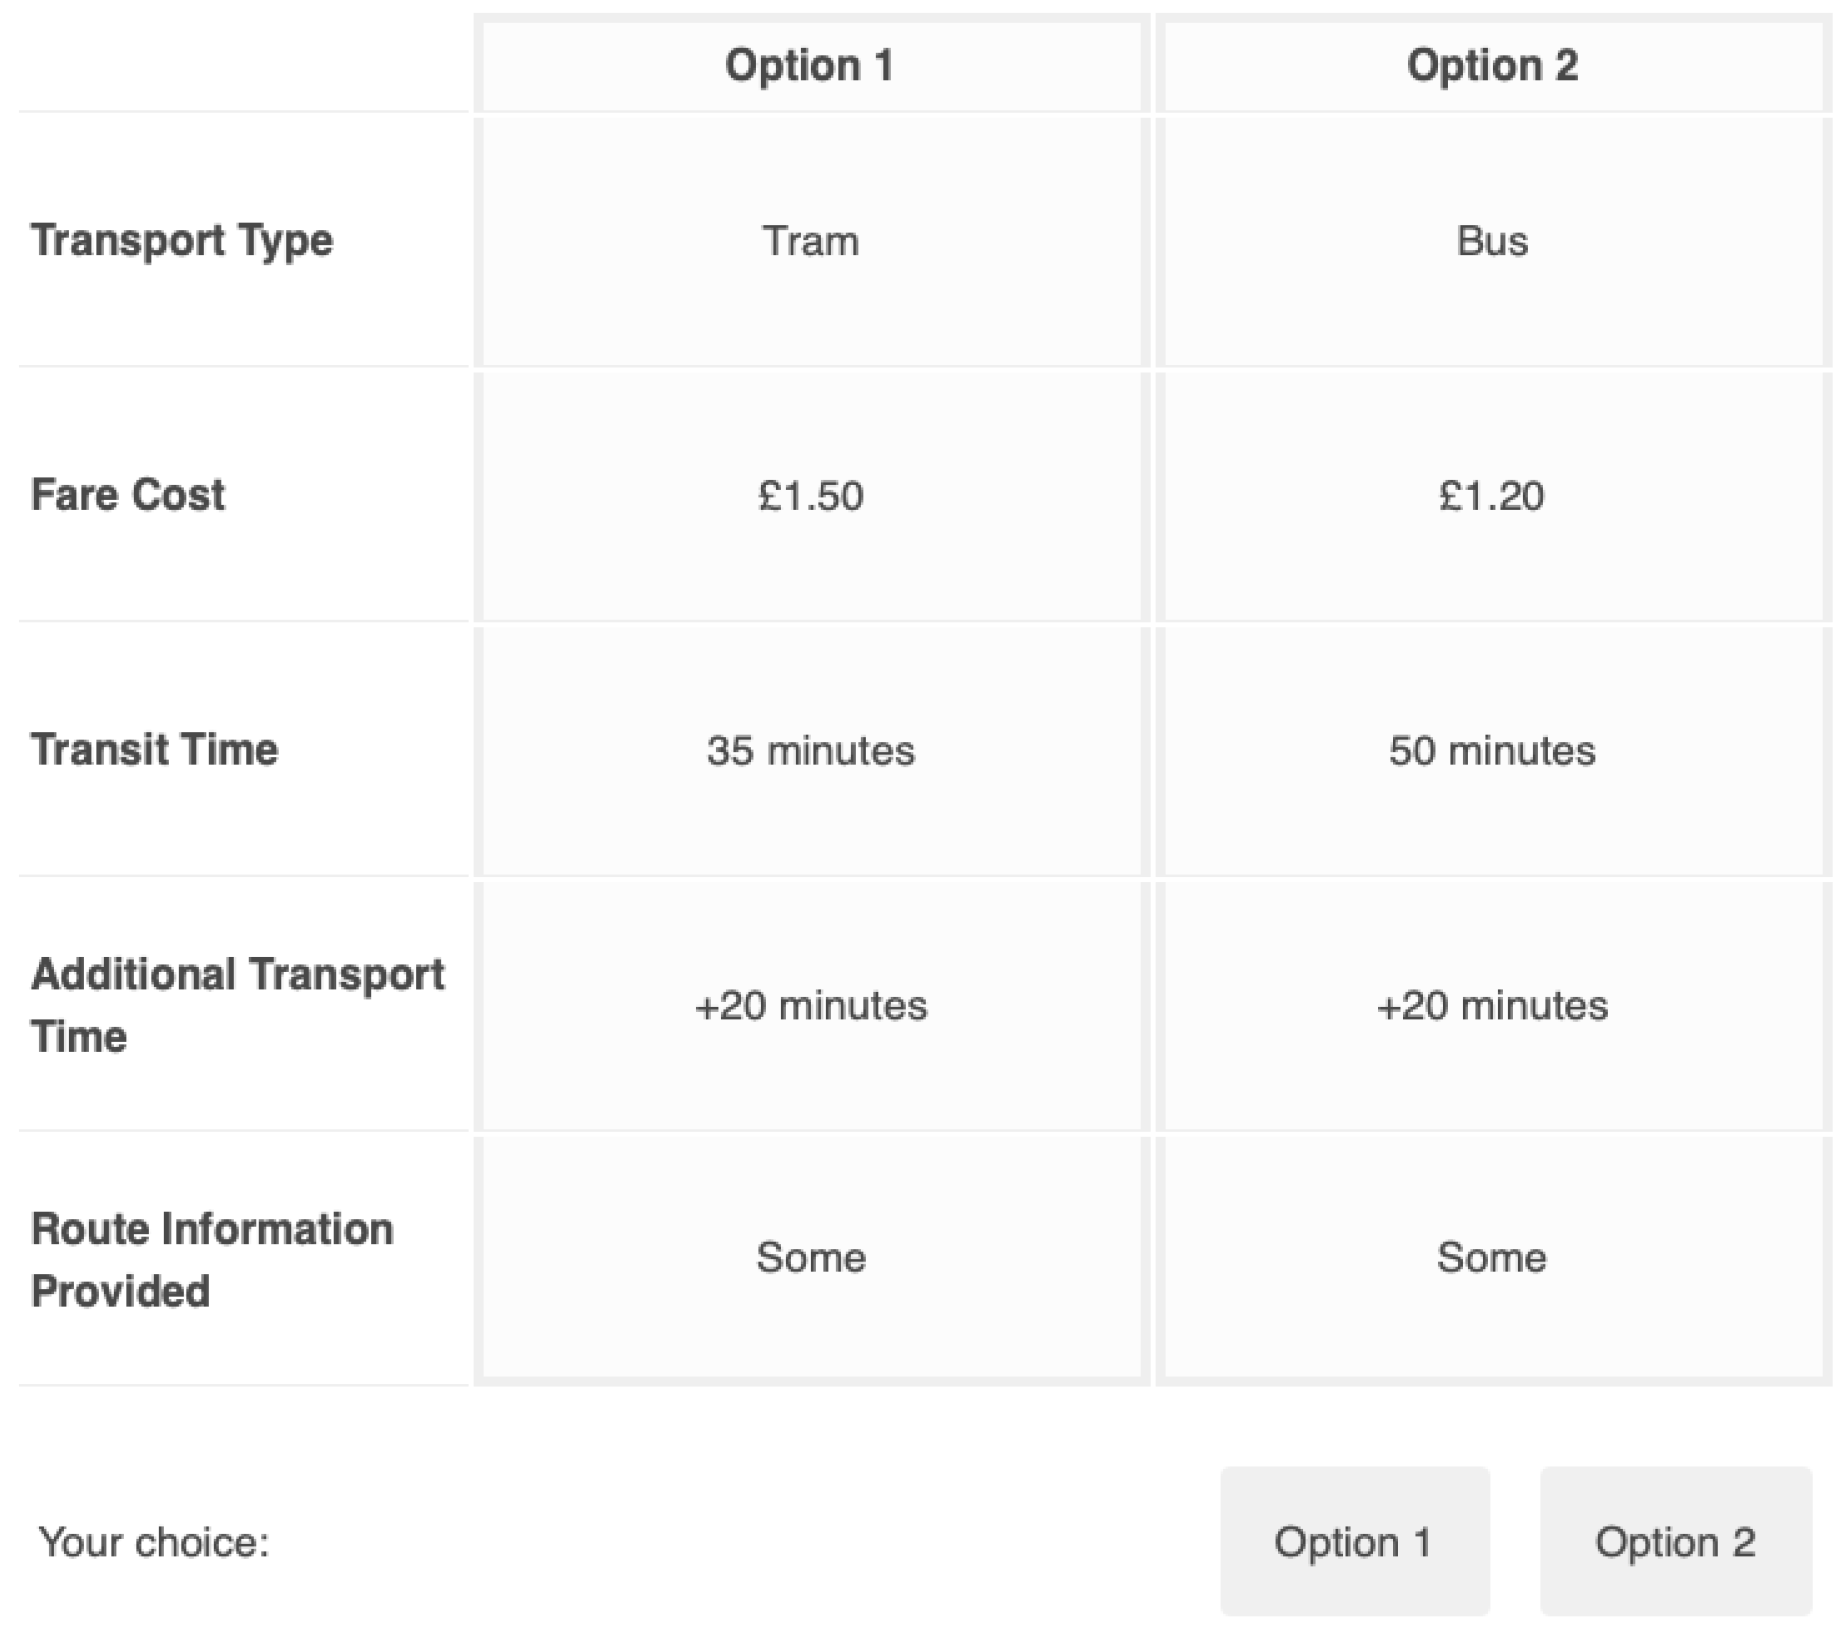
3.1. DCE Scenario
- Personal journeys—journeys for personal reasons, such as shopping, holidays, family visits, healthcare, etc.
- Commuting journeys—journeys taken to travel to either work or education, typically taken on a regular basis.
- Expensed journeys—journeys where the traveller would not indirectly pay for their travel option. For example, business journeys where travel expenses could be claimed back, or a situation where a parent/guardian has paid for their child’s ticket.
3.2. Selection of Attributes and Levels
3.2.1. Transport Type
- Bus;
- Taxi;
- Tram/Underground;
- Train.
3.2.2. Fare Cost
3.2.3. Travel Time (on Journey)
3.2.4. Additional Travel Time
3.2.5. Information Provision
- None—no information provided on the journey;
- Some—some information, such as time of arrival;
- Much—much information is provided, such as real-time location information and the next upcoming station/stop.
3.3. Experimental Design
3.4. Data Collection and Sample
3.5. Data Analysis
4. Results
4.1. Estimated Parameters
4.2. Marginal Willingness to Pay
5. Discussion
5.1. Practical Implications for Public Transport Service Design
5.1.1. Fare Cost
5.1.2. Travel Time
5.1.3. Additional Travel Time
5.1.4. Information Provision
5.1.5. Taxi Travel
5.2. Limitations
6. Conclusions
- Journey time savings should not be implemented at the expense of higher fare costs. Fare cost had a stronger negative coefficient in all travel scenarios than journey time.
- If fare cost remains consistent, then providing faster travel times has a greater utility compared to decreasing the additional travel time (i.e., time travelling to stops or stations). This was most notable for commuters.
- Commuter and expensed traveller-focussed transport options should provide some level of information provision on board, such as next stop and delays. Some information provision was found to be the most significant positive factor for utility for commuters, but there was no further utility gained from providing a lot of detailed information.
- The strong preference towards taxis for those on expensed journeys suggest taxi drivers should focus their businesses on addressing the needs of these customers. On a wider level, this indicates a preference towards road vehicle travel when cost is not a concern.
Author Contributions
Funding
Institutional Review Board Statement
Informed Consent Statement
Data Availability Statement
Acknowledgments
Conflicts of Interest
References
- Anderson, R.M.; Heesterbeek, H.; Klinkenberg, D.; Hollingsworth, T.D. How Will Country-Based Mitigation Measures Influence the Course of the COVID-19 Epidemic? Lancet 2020, 395, 931–934. [Google Scholar] [CrossRef]
- Xu, S.; Li, Y. Beware of the Second Wave of COVID-19. Lancet 2020, 395, 1321–1322. [Google Scholar] [CrossRef]
- Gkiotsalitis, K.; Cats, O. Public Transport Planning Adaption under the COVID-19 Pandemic Crisis: Literature Review of Research Needs and Directions. Transp. Rev. 2021, 41, 374–392. [Google Scholar] [CrossRef]
- Gutiérrez, A.; Miravet, D.; Domènech, A. COVID-19 and Urban Public Transport Services: Emerging Challenges and Research Agenda. Cities Health 2020, 1–4. [Google Scholar] [CrossRef]
- Beck, M.J.; Hensher, D.A. Insights into the Impact of COVID-19 on Household Travel and Activities in Australia–The Early Days of Easing Restrictions. Transp. Policy 2020, 99, 95–119. [Google Scholar] [CrossRef]
- Tian, H.; Liu, Y.; Li, Y.; Wu, C.-H.; Chen, B.; Kraemer, M.U.G.; Li, B.; Cai, J.; Xu, B.; Yang, Q.; et al. An Investigation of Transmission Control Measures during the First 50 Days of the COVID-19 Epidemic in China. Science 2020, 368, 638–642. [Google Scholar] [CrossRef] [Green Version]
- RAC. RAC Report on Motoring 2020; RAC: London, UK, 2020. [Google Scholar]
- Hachem, M.; Saleh, N.; Paunescu, A.C.; Momas, I.; Bensefa-Colas, L. Exposure to Traffic Air Pollutants in Taxicabs and Acute Adverse Respiratory Effects: A Systematic Review. Sci. Total Environ. 2019, 693, 133439. [Google Scholar] [CrossRef]
- Acar, C.; Dincer, I. The Potential Role of Hydrogen as a Sustainable Transportation Fuel to Combat Global Warming. Int. J. Hydrogen Energy 2020, 45, 3396–3406. [Google Scholar] [CrossRef]
- Logan, K.G.; Nelson, J.D.; Hastings, A. Electric and Hydrogen Buses: Shifting from Conventionally Fuelled Cars in the UK. Transp. Res. Part D Transp. Environ. 2020, 85, 102350. [Google Scholar] [CrossRef]
- Averchenkova, A.; Fankhauser, S.; Finnegan, J.J. The Impact of Strategic Climate Legislation: Evidence from Expert Interviews on the UK Climate Change Act. Clim. Policy 2021, 21, 251–263. [Google Scholar] [CrossRef]
- Campbell, P. UK Plans to Ban Sale of All Polluting Cars by 2035|Financial Times. Available online: https://www.ft.com/content/46bfd6e2-473a-11ea-aee2-9ddbdc86190d (accessed on 30 June 2020).
- Wolff, S.; Madlener, R. Driven by Change: Commercial Drivers’ Acceptance and Efficiency Perceptions of Light-Duty Electric Vehicle Usage in Germany. Transp. Res. Part C Emerg. Technol. 2019, 105, 262–282. [Google Scholar] [CrossRef]
- National Statistics. Department of Business Energy and Industrial Strategy UK Energy in Brief; National Statistics: London, UK, 2018; pp. 1–52.
- Dirgahayani, P. Environmental Co-Benefits of Public Transportation Improvement Initiative: The Case of Trans-Jogja Bus System in Yogyakarta, Indonesia. J. Clean. Prod. 2013, 58, 74–81. [Google Scholar] [CrossRef]
- Department for Business, Energy & Industrial Strategy. GOV.UK Greenhouse Gas Reporting: Conversion Factors 2019; Department for Business, Energy & Industrial Strategy: London, UK, 2020. [Google Scholar]
- Poudenx, P. The Effect of Transportation Policies on Energy Consumption and Greenhouse Gas Emission from Urban Passenger Transportation. Transp. Res. Part A Policy Pract. 2008, 42, 901–909. [Google Scholar] [CrossRef]
- Department for Transport. Vehicle Licensing Statistics: 2020 Quarter 1 (Jan–Mar); Department for Transport: London, UK, 2020.
- Jain, S.; Aggarwal, P.; Kumar, P.; Singhal, S.; Sharma, P. Identifying Public Preferences Using Multi-Criteria Decision Making for Assessing the Shift of Urban Commuters from Private to Public Transport: A Case Study of Delhi. Transp. Res. Part F Traffic Psychol. Behav. 2014, 24, 60–70. [Google Scholar] [CrossRef] [Green Version]
- Paulley, N.; Balcombe, R.; Mackett, R.; Titheridge, H.; Preston, J.; Wardman, M.; Shires, J.; White, P. The Demand for Public Transport: The Effects of Fares, Quality of Service, Income and Car Ownership. Transp. Policy 2006, 13, 295–306. [Google Scholar] [CrossRef] [Green Version]
- Balcombe, R.; Mackett, R.; Paulley, N.; Preston, J.; Shires, J.; Titheridge, H.; Wardman, M.; White, P. The Demand for Public Transport: A Practical Guide; University College London: London, UK, 2004. [Google Scholar]
- Vickerman, R. Will Covid-19 Put the Public Back in Public Transport? A UK Perspective. Transp. Policy 2021, 103, 95–102. [Google Scholar] [CrossRef]
- Gundlach, A.; Ehrlinspiel, M.; Kirsch, S.; Koschker, A.; Sagebiel, J. Investigating People’s Preferences for Car-Free City Centers: A Discrete Choice Experiment. Transp. Res. Part D Transp. Environ. 2018, 63, 677–688. [Google Scholar] [CrossRef]
- Jackson, T. Motivating Sustainable Consumption. Sustain. Dev. Res. Netw. 2005, 29, 30–40. [Google Scholar]
- Louviere, J.J.; Flynn, T.N.; Carson, R.T. Discrete Choice Experiments Are Not Conjoint Analysis. J. Choice Model. 2010, 3, 57–72. [Google Scholar] [CrossRef] [Green Version]
- Mangham, L.J.; Hanson, K.; McPake, B. How to Do (or Not to Do)...Designing a Discrete Choice Experiment for Application in a Low-Income Country. Health Policy Plan. 2009, 24, 151–158. [Google Scholar] [CrossRef] [Green Version]
- Baltussen, R.; Ten Asbroek, A.H.A.; Koolman, X.; Shrestha, N.; Bhattarai, P.; Niessen, L.W. Priority Setting Using Multiple Criteria: Should a Lung Health Programme Be Implemented in Nepal? Health Policy Plan. 2007, 22, 178–185. [Google Scholar] [CrossRef] [PubMed] [Green Version]
- Alpizar, F.; Carlsson, F.; Martinsson, P. Using Choice Experiments for Non-Market Valuation; Working Papers in Economics No. 52; Department of Economics, Gothenburg University: Gothenburg, Sweden, 2001. [Google Scholar]
- Drummond, M.F.; Sculpher, M.J.; Claxton, K.; Stoddart, G.L.; Torrance, G.W. Methods for the Economic Evaluation of Health Care Programmes; Oxford University Press: Oxford, UK, 2015; ISBN 0191643580. [Google Scholar]
- Hensher, D.A.; Collins, A.T. Interrogation of Responses to Stated Choice Experiments: Is There Sense in What Respondents Tell Us?: A Closer Look at What Respondents Choose and Process Heuristics Used in Stated Choice Experiments. J. Choice Model. 2011, 4, 62–89. [Google Scholar] [CrossRef] [Green Version]
- Bech, M.; Kjaer, T.; Lauridsen, J. Does the Number of Choice Sets Matter? Results from a Web Survey Applying a Discrete Choice Experiment. Health Econ. 2011, 20, 273–286. [Google Scholar] [CrossRef] [PubMed]
- Carson, R.T.; Groves, T. Incentive and Informational Properties of Preference Questions. Environ. Resour. Econ. 2007, 37, 181–210. [Google Scholar] [CrossRef]
- Rubin, G.; Bate, A.; George, A.; Shackley, P.; Hall, N. Preferences for Access to the GP: A Discrete Choice Experiment. Br. J. Gen. Pract. 2006, 56, 743–748. [Google Scholar]
- Ewing, G.; Sarigöllü, E. Assessing Consumer Preferences for Clean-Fuel Vehicles: A Discrete Choice Experiment. J. Public Policy Mark. 2000, 19, 106–118. [Google Scholar] [CrossRef]
- Ryan, M.; Bate, A.; Eastmond, C.J.; Ludbrook, A. Use of Discrete Choice Experiments to Elicit Preferences. BMJ Qual. Saf. 2001, 10, i55–i60. [Google Scholar] [CrossRef]
- Abrantes, P.A.L.; Wardman, M.R. Meta-Analysis of UK Values of Travel Time: An Update. Transp. Res. Part A Policy Pract. 2011, 45, 1–17. [Google Scholar] [CrossRef]
- König, A.; Grippenkoven, J. Modelling Travelers’ Appraisal of Ridepooling Service Characteristics with a Discrete Choice Experiment. Eur. Transp. Res. Rev. 2020, 12, 1. [Google Scholar] [CrossRef]
- Steck, F.; Kolarova, V.; Bahamonde-Birke, F.; Trommer, S.; Lenz, B. How Autonomous Driving May Affect the Value of Travel Time Savings for Commuting. Transp. Res. Rec. 2018, 2672, 11–20. [Google Scholar] [CrossRef] [Green Version]
- Kløjgaard, M.E.; Bech, M.; Søgaard, R. Designing a Stated Choice Experiment: The Value of a Qualitative Process. J. Choice Model. 2012, 5, 1–18. [Google Scholar] [CrossRef] [Green Version]
- Department for Transport. Commuting Trends in England; Department for Transport: London, UK, 2015.
- National Statistics. GOV.UK National Travel Survey; National Statistics: London, UK, 2019. [Google Scholar]
- McNamara, A.; Chen, G.; George, S.; Walker, R.; Ratcliffe, J. What Factors Influence Older People in the Decision to Relinquish Their Driver’s Licence? A Discrete Choice Experiment. Accid. Anal. Prev. 2013, 55, 178–184. [Google Scholar] [CrossRef] [PubMed]
- Merkert, R.; Beck, M. Value of Travel Time Savings and Willingness to Pay for Regional Aviation. Transp. Res. Part A Policy Pract. 2017, 96, 29–42. [Google Scholar] [CrossRef]
- Beirão, G.; Sarsfield Cabral, J.A. Understanding Attitudes towards Public Transport and Private Car: A Qualitative Study. Transp. Policy 2007, 14, 478–489. [Google Scholar] [CrossRef]
- Dell’Olio, L.; Ibeas, A.; Cecin, P. The Quality of Service Desired by Public Transport Users. Transp. Policy 2011, 18, 217–227. [Google Scholar] [CrossRef]
- Department for Transport. Transport Statistics; Department for Transport: London, UK, 2019.
- Echaniz, E.; dell’Olio, L.; Ibeas, Á. Modelling Perceived Quality for Urban Public Transport Systems Using Weighted Variables and Random Parameters. Transp. Policy 2018, 67, 31–39. [Google Scholar] [CrossRef]
- De Oña, J.; De Oña, R.; Eboli, L.; Mazzulla, G. Perceived Service Quality in Bus Transit Service: A Structural Equation Approach. Transp. Policy 2013, 29, 219–226. [Google Scholar] [CrossRef]
- Transport for London. Network Performance; Transport for London: London, UK, 2019. [Google Scholar]
- Department for Transport. Light Rail and Tram Statistics; Department for Transport: London, UK, 2018.
- Eboli, L.; Mazzulla, G. A Methodology for Evaluating Transit Service Quality Based on Subjective and Objective Measures from the Passenger’s Point of View. Transp. Policy 2011, 18, 172–181. [Google Scholar] [CrossRef]
- Tyrinopoulos, Y.; Antoniou, C. Public Transit User Satisfaction: Variability and Policy Implications. Transp. Policy 2008, 15, 260–272. [Google Scholar] [CrossRef]
- Aizaki, H.; Aizaki, M.H. Package ‘Support. CEs’; CRAN: Berkeley, CA, USA, 2015. [Google Scholar]
- Weber, S. A Step-by-Step Procedure to Implement Discrete Choice Experiments in Qualtrics. Soc. Sci. Comput. Rev. 2019, 39, 903–921. [Google Scholar] [CrossRef]
- Lancsar, E.; Fiebig, D.G.; Hole, A.R. Discrete Choice Experiments: A Guide to Model Specification, Estimation and Software. Pharmacoeconomics 2017, 35, 697–716. [Google Scholar] [CrossRef] [PubMed] [Green Version]
- Croissant, Y. Package ‘Mlogit’. Available online: https://cran.r-project.org/web/packages/mlogit/index.html (accessed on 10 November 2020).
- McFadden, D.; Train, K. Mixed MNL Models for Discrete Response. J. Appl. Econom. 2000, 15, 447–470. [Google Scholar] [CrossRef]
- Chen, J.; Li, S. Mode Choice Model for Public Transport with Categorized Latent Variables. Math. Probl. Eng. 2017, 2017, 7861945. [Google Scholar] [CrossRef] [Green Version]
- Department for Transport. Quarterly Bus Statistics: July to September 2020; Department for Transport: London, UK, 2020.
- Topham, G.; Partridge, J. Rail Fares Rise by 2.6% in England and Wales; The Guardian: London, UK, 2021. [Google Scholar]
- Jánošíková, L.; Slavík, J.; Koháni, M. Estimation of a Route Choice Model for Urban Public Transport Using Smart Card Data. Transp. Plan. Technol. 2014, 37, 638–648. [Google Scholar] [CrossRef]
- Vickerman, R. Can High-Speed Rail Have a Transformative Effect on the Economy? Transp. Policy 2018, 62, 31–37. [Google Scholar] [CrossRef] [Green Version]
- Soza-Parra, J.; Raveau, S.; Muñoz, J.C.; Cats, O. The Underlying Effect of Public Transport Reliability on Users’ Satisfaction. Transp. Res. Part A Policy Pract. 2019, 126, 83–93. [Google Scholar] [CrossRef] [Green Version]
- Department for Transport. Bus Back Better; Department for Transport: London, UK, 2021.
- Oliveira, L.C.; Fox, C.; Birrell, S.; Cain, R. Analysing Passengers’ Behaviours When Boarding Trains to Improve Rail Infrastructure and Technology. Robot. Comput. Integr. Manuf. 2019, 57, 282–291. [Google Scholar] [CrossRef] [Green Version]
- Statista. Penetration Rate of Smartphones in Selected Countries 2020; Statista: Hamburg, Germany, 2020. [Google Scholar]
- Zhang, J.; Reed Johnson, F.; Mohamed, A.F.; Hauber, A.B. Too Many Attributes: A Test of the Validity of Combining Discrete-Choice and Best-Worst Scaling Data. J. Choice Model. 2015, 15, 1–13. [Google Scholar] [CrossRef]
- GOV.UK Male and Female Populations. Available online: https://www.ethnicity-facts-figures.service.gov.uk/uk-population-by-ethnicity/demographics/male-and-female-populations/latest (accessed on 23 April 2020).


| Type | Fare Cost Levels (GBP/£) | Data Source |
|---|---|---|
| Bus | 1.2/2.7/4.2 | National Bus Fares Survey (TAS, 2018) and market data from transit services |
| Taxi | 13/19/25 | National Taxi Price Index (Reg Transfers, 2019) |
| Tram/ Underground | 1.5/3.75/6 | DfT data (Department for Transport, 2018) and market values from transit services |
| Train | 5/9/13 | Market values from train search engines (National Rail, 2021) |
| Type | Travel Time (Minutes) | Data Source |
|---|---|---|
| Bus | 50/60/70 | DfT average journey time data [46] along with values from mapping services |
| Taxi | 25/30/35 | |
| Tram/Underground | 35/45/55 | |
| Train | 10/15/20 |
| Type | Additional Travel Time (Minutes) | Justification |
|---|---|---|
| Bus | 10/20/30 | Transport for London data (Transport for London, 2019) and data from mapping services |
| Taxi | 0/5/10 | DfT data (Department for Transport, 2019) and mapping services |
| Tram/Underground | 10/20/30 | DfT data (Department for Transport, 2018) and mapping services |
| Train | 20/30/40 | DfT data (Department for Transport, 2019) and mapping services |
| Sociodemographic Variable | Total Sample Breakdown | Total (n = 1138) | Personal (n = 382) | Commute (n = 364) | Expensed (n = 392) |
|---|---|---|---|---|---|
| Gender | Female | 593 | 205 | 170 | 218 |
| Male | 544 | 177 | 193 | 174 | |
| Other | 1 | 0 | 1 | 0 | |
| Age | 18–24 | 125 | 14 | 97 | 14 |
| 25–34 | 217 | 56 | 100 | 61 | |
| 35–44 | 212 | 74 | 70 | 68 | |
| 45–54 | 244 | 93 | 51 | 100 | |
| 55–64 | 182 | 70 | 30 | 82 | |
| 65+ | 158 | 75 | 16 | 67 | |
| Ethnicity | Asian/Asian British | 67 | 18 | 35 | 14 |
| Black/African/Caribbean Black British | 37 | 7 | 14 | 16 | |
| Mixed/Multiple ethnic groups | 26 | 6 | 14 | 6 | |
| White/White British | 1004 | 349 | 301 | 354 | |
| Other ethnic group | 4 | 2 | 0 | 2 | |
| Region | Northern England | 270 | 91 | 78 | 101 |
| Mid England | 272 | 98 | 79 | 95 | |
| Southern England | 263 | 94 | 84 | 85 | |
| Greater London | 142 | 35 | 69 | 38 | |
| Wales | 54 | 15 | 20 | 19 | |
| Scotland | 104 | 37 | 28 | 39 |
| Personal Travel (PERSONAL) (n = 382) | Commuter Travel (COMMUTE) (n = 364) | Expensed Travel (EXPENSED) (n = 392) | |||||||
|---|---|---|---|---|---|---|---|---|---|
| Coefficient | SE | z-Value | Coefficient | SE | z-Value | Coefficient | SE | z-Value | |
| Intercept | 0.245 | 0.569 | 0.572 | 0.214 | 0.270 | 0.791 | 0.465 | 0.308 | 1.508 |
| Type:Taxi (TAXI) | −0.0399 | 0.306 | −0.130 | 0.143 | 0.240 | 0.595 | 0.682 * | 0.212 | 3.202 |
| Type:Tram (TRAM) | −0.00351 | 0.144 | −0.0243 | 0.0320 | 0.112 | 0.285 | 0.100 | 0.106 | 0.942 |
| Type:Train (TRAIN) | −0.405 | 0.277 | −1.458 | −0.351 | 0.215 | −1.627 | 0.0342 | 0.201 | 0.170 |
| Fare Cost (FARE) | −0.144 ** | 0.0137 | −11.909 | −0.161 ** | 0.0106 | −15.120 | −0.119 ** | 0.00874 | −13.708 |
| Travel Time (TIME) | −0.0331 ** | 0.00556 | −6.851 | −0.0359 ** | 0.00427 | −8.416 | −0.0399 ** | 0.00398 | −10.026 |
| Ad. Travel Time (ATIME) | −0.0304 ** | 0.00649 | −3.663 | −0.0138 ** | 0.00513 | −2.699 | −0.0247 ** | 0.00431 | −5.741 |
| Some Information Provision (SINFO) | 0.0413 | 0.121 | 0.339 | 0.246 * | 0.0972 | 2.537 | 0.158 * | 0.0797 | 1.991 |
| Much Information Provision (MINFO) | −0.145 | 0.105 | −1.372 | −0.155 | 0.0819 | −1.892 | 0.126 | 0.0741 | 1.705 |
| Log-likelihood | −988.35 | −1632.1 | −1998.9 | ||||||
| McFadden’s R2 | 0.202 | 0.171 | 0.119 | ||||||
| AIC | 2101.55 | 3344.121 | 4085.779 | ||||||
| Personal | Commute | Expensed | |
|---|---|---|---|
| TYPE:TAXI | n/a | n/a | 5.73 * |
| TIME (£/min) | 0.23 ** | 0.22 ** | 0.33 ** |
| ATIME (£/min) | 0.21 ** | 0.09 ** | 0.21 ** |
| SINFO (£) | n/a | 1.52 * | 1.33 * |
Publisher’s Note: MDPI stays neutral with regard to jurisdictional claims in published maps and institutional affiliations. |
© 2022 by the authors. Licensee MDPI, Basel, Switzerland. This article is an open access article distributed under the terms and conditions of the Creative Commons Attribution (CC BY) license (https://creativecommons.org/licenses/by/4.0/).
Share and Cite
Ulahannan, A.; Birrell, S. Designing Better Public Transport: Understanding Mode Choice Preferences Following the COVID-19 Pandemic. Sustainability 2022, 14, 5952. https://doi.org/10.3390/su14105952
Ulahannan A, Birrell S. Designing Better Public Transport: Understanding Mode Choice Preferences Following the COVID-19 Pandemic. Sustainability. 2022; 14(10):5952. https://doi.org/10.3390/su14105952
Chicago/Turabian StyleUlahannan, Arun, and Stewart Birrell. 2022. "Designing Better Public Transport: Understanding Mode Choice Preferences Following the COVID-19 Pandemic" Sustainability 14, no. 10: 5952. https://doi.org/10.3390/su14105952
APA StyleUlahannan, A., & Birrell, S. (2022). Designing Better Public Transport: Understanding Mode Choice Preferences Following the COVID-19 Pandemic. Sustainability, 14(10), 5952. https://doi.org/10.3390/su14105952