1. Introduction
After 1978, China’s GDP was known as the “Chinese miracle” with an average annual growth rate of nearly 10% [
1], but behind the rapid economic development was the scale investment of resources and energy and the traditional emergency rescue development mode with high investment, high consumption, and high pollution. On the one hand, according to the “2020 Eco-Environmental Quality Profile”, the average proportion of light pollution, moderate pollution, heavy pollution, and serious pollution in 337 cities above the prefecture level in 2020 will be 13%, and 135 cities still have air pollution. Hebei Province, Henan Province, Shanxi Province, and Shandong Province are the provinces with the highest concentrations of non-standard and severely polluted areas. China ranks 12th from the bottom according to the data of the 2020 Global Urban Air Pollution Survey Report; the air quality of the majority of domestic cities still exceeds the standard; 32 cities are on the list. In addition, according to a document from the Ministry of Ecology and Environment of the People’s Republic of China, water pollution in the central and southern regions is severe, and the carrying capacity of resources and the environment in certain regions is nearing its limit [
2], which means that the need for a shift in the social and economic development model has become increasingly apparent. On the other hand, as China’s economy enters the new normal, the contradiction between economic development and environmental protection is increasingly intensified [
3], which objectively requires China to constantly innovate its economic development model and achieve green and sustainable economic development. It also means that green development has become an inevitable trend. To this end, the Chinese government has issued a large number of relevant environmental regulation policies [
4,
5,
6]. The report of the 19th National Congress of the Communist Party of China identified pollution prevention and control as one of the three major battles of the new era, and proposed that air, water, soil, and agricultural non-point source pollution should be the primary objectives of future governance, aiming to guide and urge resource-based enterprises to actively implement green transformation, and further form a green development system of “central government monitoring, local government regulation and corporate implementation”. In other words, the central government entrusts and authorizes the Ministry of Ecology and Environment of the People’s Republic of China to supervise the implementation of the environmental policies of local governments and the green development of enterprises [
7], and local governments are responsible for carrying out the supervision and enforcement of the green development of enterprises in their regions [
8], so as to ensure the consistency of the top and bottom, and make joint efforts to stifle and reverse the trend of increasing resource depletion and ecological degradation in the country at source [
9]. Similarly, a similar three-level management system exists in certain nations, such as the “EPA-state government-enterprise” structure in the United States and the “AGDA-state/local government-enterprise” structure in Australia, etc. Under this system, even though it helps to improve the effectiveness of environmental governance, the phenomenon of companies ignoring the environment in pursuit of their greatest interests is still prevalent [
10], according to information reported by the Ministry of Ecology and Environment from January to December 2021. There were 132,800 environmental administrative penalty decisions issued at the national level, with a total of CNY 11,687 billion in fines and confiscations and an average fine of CNY 88,000 per case. This exposed the extent of environmental pollution caused by certain businesses as well as numerous problems, such as the ineffectiveness of local government oversight mechanisms and the failure of central government oversight. Governance of these issues is crucial for the development of the nation, the well-being of the population, and the sustainable growth of businesses.
Nowadays, the majority of research on environmental governance focuses on the underlying causes of environmental pollution, the formulation and implementation of environmental policies, and the study of the game relationship between environmental governance subjects. In research on the causes of pollution, on the one hand, scholars examine the impact on the polluted environment in terms of economic development [
11], technological development [
12], and industrial structure [
13]. For instance, Tian [
14] believes that excessive pursuit of the economy will lead businesses to disregard environmental protection and cause environmental pollution; the environmental pollution caused by technological development is reflected in daily life, such as automobile exhaust emissions and waste cosmetics and cleaning products. The disposal of supplies exerts some pressure on the environment [
15]; the impact of industrial structure changes on the environment is mainly reflected in the energy industry. Shi et al. [
16] believed that as coal resources are depleted, the energy- and resource-intensive industrial structure will accentuate and exacerbate environmental pollution issues. In this regard, some scholars believe that effective pollution reduction can be achieved through the implementation of appropriate environmental protection policies.
From an environmental policy perspective, in recent years, countries have developed environmental policies centered on a low-carbon economy, pollution prevention and control, energy conservation, emission reduction, and cleaner production. For instance, the Chinese government’s “14th Five-Year Plan for Soil, Groundwater and Rural Ecological Environmental Protection,” the United States’ “National Environmental Policy Act” and “Oil Pollution Act,” and Australia’s “Clean Air Regulations,” etc. On the basis of distinct policy characteristics, these policies can be categorized as command-and-control, market-incentivized, or public participation. The command-and-control type refers to the government’s direct control [
17]; the market-incentive type is a policy that encourages enterprises to conduct cleaner production through the formulation of various reward and punishment policies [
18]; and the public-participation type refers to public participation and encourages public participation in the form of reporting and supervision [
19]. Environmental governance policies are aimed at enhancing the efficiency of environmental governance. According to the various ways that policies are initiated, they are typically divided into two categories: “central initiation-local application” and “central initiation.” The “central initiation” policy is typically a non-local, normative policy that lacks local characteristics. The second is to require the local government to develop a local policy based on the interpretation of the central policy and to combine local characteristics with a strong sense of individuality.
In the study of environmental governance subject behavior, some scholars have indicated enterprise industrial activities are the primary factor leading to environmental deterioration [
20], arguing that Chinese enterprises are capital intensive, and green development must bear high adjustment costs and sunk costs [
21], under huge cost pressure enterprises will inevitably lead to the local government “rent-seeking” to seek interest exchange [
22]. Some local governments with local protectionism are afraid of the threat of interest damage and take the opportunity to exchange interests with “rent-seeking” enterprises, and to achieve “win-win” [
23]. Due to information asymmetry [
24], it is difficult for the central government to grasp local environmental behaviors in time, leading to the long-term existence of such “cooperation” between enterprises and the local government [
25]. The state has also introduced environmental tax [
26] and other governance measures, but has still failed to fundamentally solve the environmental pollution problem, which has brought great losses to the society. Game analysis is helpful to simulate and predict the implementation effect of environmental tax regulations and reward and punishment measures. Using evolutionary game theory, Xiu [
27] and Aubert [
28] discussed the complexity of rare earth mining areas and water resource environmental governance. Sun et al. [
29] used evolutionary games to demonstrate that central government regulation positively affects the strategies chosen by local municipal governments and businesses. Wang [
30] analyzed the effect of market regulation on economic and environmental performance using evolutionary game theory; Luo [
31] and Wang et al. [
32] used evolutionary game theory to analyze the environmental governance strategy game between local governments or environmental regulatory departments and enterprises and found that the cost of government supervision and the punishment of illegal enterprises are the key factors affecting the behavior of both sides.
To sum up, the existing studies have affirmed the enterprise, local government, and national ecological environment role in environmental governance, but these studies have mostly analyzed enterprises, local government, and central government as a separate individual, lacking in environmental governance interests between the interests and quantitative considerations of behavior interaction. Given that evolutionary games are an effective method to study the dynamics of multi-actor strategies with limited rationality, they are also applicable to the study of environmental governance. This paper constructs a three-party evolution game model of enterprises, local government, and central government, and analyzes the interactive behaviors of the three parties in environmental governance from the perspective of game theory. By solving the equilibrium strategy, the evolution law of enterprise behaves differently under different situations and the interaction mechanism between enterprises, local governments, and central government provides a factual basis for the governance role of the local government and central government; lastly, relevant countermeasures and suggestions are proposed based on the game derivation and numerical analysis results.
The rest of this paper is organized as follows:
Section 2 constructs a three-party evolutionary game model;
Section 3 introduces the evolutionary stability strategies in different situations through numerical simulation and illustrates the impact of parameter changes on these strategies;
Section 4 discusses the simulation results of
Section 3; and finally,
Section 5 discusses the conclusions of this study and proposes corresponding policy recommendations.
2. Materials and Methods
Numerous variables come into play when it comes to environmental governance. This paper, in accordance with Chinese policy, draws on Ioppolo’s point of view [
25] and selects enterprises, local governments, and central government as game participants from various administrative levels in China. Each of the three will consider how to make the best use of available resources in order to maximize their own benefits, and each participant will have two strategies to choose from.
There are two environmental management strategies available to businesses: “Cleaner Production” and “Non-cleaner production.” Cleaner Production: On the one hand, businesses must incorporate environmental management into their planning and decision-making processes, actively fulfill their corporate social responsibility, optimize resource allocation, and reduce waste and pollution emissions. On the other hand, they must invest human and financial resources in order to acquire or develop cutting-edge technological products, optimize the use of secondary energy, and achieve energy conservation and consumption reduction, among other environmental goals. Non-cleaner production: Negative treatment of environmental management, including inaction on environmental management, in production and operations focuses exclusively on the costs and benefits directly related to their own interests, ignoring the social and environmental costs associated with their operations.
Local governments employ two strategies in the environmental governance process: “Regulation” and “Non-regulation.” Regulation: Enforcing environmental protection laws and standards at the national level, developing guidelines for regional environmental governance, establishing limits on the total amount of pollution in the area under their jurisdiction, and rigorously approving construction, renovation, and other projects involving various enterprises within their jurisdiction. Non-regulation: focuses exclusively on economic development within the jurisdiction’s boundaries, ignores sustainable green development, and takes no action against enterprises’ environmentally irresponsible behavior.
Central government employs two strategies in the process of environmental governance: “Monitoring” and “Non-monitoring.” Monitoring includes developing and improving policies related to ecological and environmental protection, assessing the extent to which provincial and municipal governments implement their policies, supervising the implementation of national emission reduction targets, and so forth. Non-monitoring entails failing to pay attention to provincial and municipal environmental development, failing to investigate the implementation of provincial and municipal policies, and ignoring public demands for a greener living environment, among other things.
2.1. Model Assumptions
This section may be divided by subheadings. It should provide a concise and precise description of the experimental results, their interpretation, as well as the experimental conclusions that can be drawn.
Hypothesis 1 (H1). Assume that the probability of an enterprise choosing a “Cleaner Production” strategy is x and 0 ≤ x ≤ 1, and that the probability of an enterprise choosing a “Non-cleaner production” strategy is 1 − x. The enterprise’s primary benefit is R1. When an enterprise opts for the “Cleaner Production” strategy, it incurs the cost C1. Simultaneously, the local government andcentral government will provide enterprises with E1 subsidies and E2 rewards for their behavior. When enterprises prioritize profit maximization over environmental protection and cause excessive environmental pollution, they will face punishment Q from the local government. However, if the local government adopts a strict supervision strategy during this time period, it will not only confiscate the rent-seeking cost K (K < C1), but also punish the enterprise S1. Additionally, regardless of the strategy employed by an enterprise, it must pay an environmental tax. The tax rate is α, but the amount of pollutants discharged under various strategies varies. When an enterprise is committed to cleaner production, the amount of pollutants discharged is M1, but when it is not, the amount is M2 (M2 > M1).
Hypothesis 2 (H2). Assume that the probability of the local government adopting the “Regulation” strategy is y and 0 ≤ y ≤ 1; and that the probability of the local government adopting the “Non-regulation” strategy is 1 − y. The local government’s basic income is R2. When local governments exercise strict oversight, they incur time, energy, and other costs C2. If the local government is carefully supervised bycentral government, and if the local government is properly supervised, the local government will receive E1. If it is determined that the local government was negligent, punitive measures will be taken against it, which will be recorded as S2. If the enterprise is found to have violated environmental protection laws during this time period,central government will also hold the local government accountable H.
Hypothesis 3 (H3). Assume thatcentral government chooses the “Monitoring” strategy with a probability of z and 0 ≤ z ≤ 1; the probability of choosing the “Non-monitoring” strategy with a probability of 1 − z. Bear in mind thatcentral government’s basic income is R3, and the cost of monitoring is C3. Whencentral government chooses not to supervise, and local governments and enterprises “combine with the same stream,” their own credibility is diminished, resulting in social losses D.
On the basis of the foregoing assumptions, the strategic combination between the enterprise, the local government, and central government can be obtained, as shown in
Table 1 and
Table 2.
2.2. Model Analysis
2.2.1. Replication Dynamic Equation and Equilibrium Points of Enterprise
Note that the expected value of a company adhering to cleaner production is
V11 and the expected value of adopting a neglectful approach to environmental development is
V12, with an average expected value of
.
Then, the replication dynamics equation for cleaner production in companies is:
According to the differential equation stability theorem, for an enterprise’s probability of choosing cleaner production to be stable, it must satisfy the following conditions: and . is an increasing function with respect to z due to .
Thus, when , , , and , all x are in the evolutionary stable state; when , , , then x = 0 is the enterprise’s evolutionary stable strategy; otherwise, x = 1 is the enterprise’s evolutionary stable strategy.
2.2.2. Replication Dynamic Equation and Equilibrium Points of Local Government
Note that the expected value of a local government to regulation is
V21, the expected value of a local government to no-regulation is
V22, with an average expected value of
.
Then, the replication dynamic equation for strict local government regulation is
According to the differential equation stability theorem, the probability of local governments exercising strict supervision in a stable state must satisfy the following conditions: and . As a result of , is an increasing function in terms of z. Thus, when , , and , all y are in an evolutionary stable state; when , , , y = 0 is the local government’s evolutionary stability strategy; otherwise, y = 1 is the local government’s evolutionary stability strategy.
2.2.3. Replication Dynamic Equation and Equilibrium Points of Central Government
The expected value of monitoring by central government of the People’s Republic of China is
V31, and the expected value of non-monitoring is
V32, the average expected value is
.
Then, the replication dynamic equation for central government is
According to differential equations’ stability theorem, the probability that central government chooses to monitor in a stable state must satisfy the following conditions: and . is a decreasing function with respect to y due to . Thus, when , , and , then all y are in an evolutionary stable state; when , and , then z = 0 is central government’s evolutionary stabilization strategy; otherwise, z = 1 is the evolutionary stabilization strategy.
While the evolution process of a game system composed of enterprises, local governments, and central government can be described by their respective replication dynamic equations, it is still impossible to predict the equilibrium point to which the system will tend during the evolution process. We obtain eight pure-strategy equilibrium solutions and multiple mixed-strategy equilibrium solutions using the differential equations’ stability principle [
33]. However, as Ritzberger’s research [
34] indicates, the mixed strategy equilibrium solution cannot be an evolutionary stable strategy (ESS); this game system requires only the analysis of eight pure strategy equilibrium solutions. The three-party evolutionary game has a different stability analysis than the two-party evolutionary game. Friedman’s positive and negative determination of the Jacobian matrix determinant and trace to discuss the ESS is no longer applicable, and the Lyapunov first judgment method is used in this paper to carry out the ESS’s judgment. The necessary and sufficient condition for the system to be asymptotically stable is that all eigenvalues of the Jacobian matrix have negative real parts; if at least one of the eigenvalues of the Jacobian matrix is positive, the equilibrium point is the evolutionary unstable point; if the eigenvalues of the Jacobian matrix contain both zero and negative values, the equilibrium point is in a critical state, and its stability depends on the following sections, which will examine the stability of each strategy combination. The game system’s Jacobian matrix is as follows:
To obtain the corresponding eigenvalues, substitute each equilibrium solution into the above Jacobian matrix, as shown in
Table 3.
As an example, the point (0,0,0,) is used to discuss the conditions for satisfying the evolutionary stabilization strategy. The eigenvalues of the Jacobi matrix of the system at (0,0,0) are
,
,
. If
,
,
are also satisfied, then this point is a stable point for the evolution of this conditional system. By analogy, the conditions for the remaining conditional asymptotically stable points are shown in
Table 4.
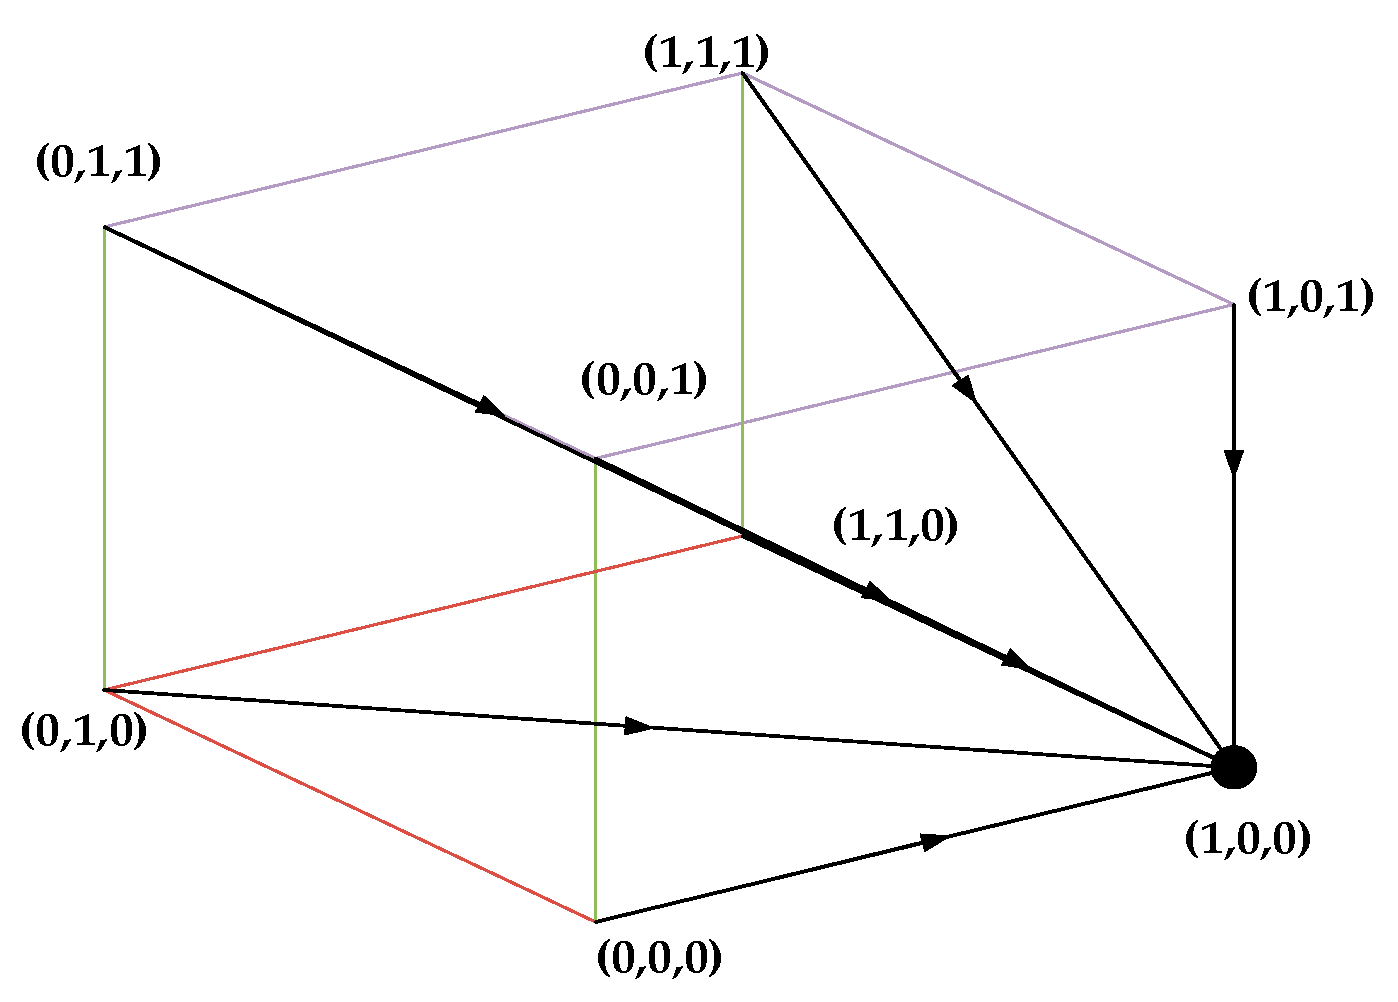
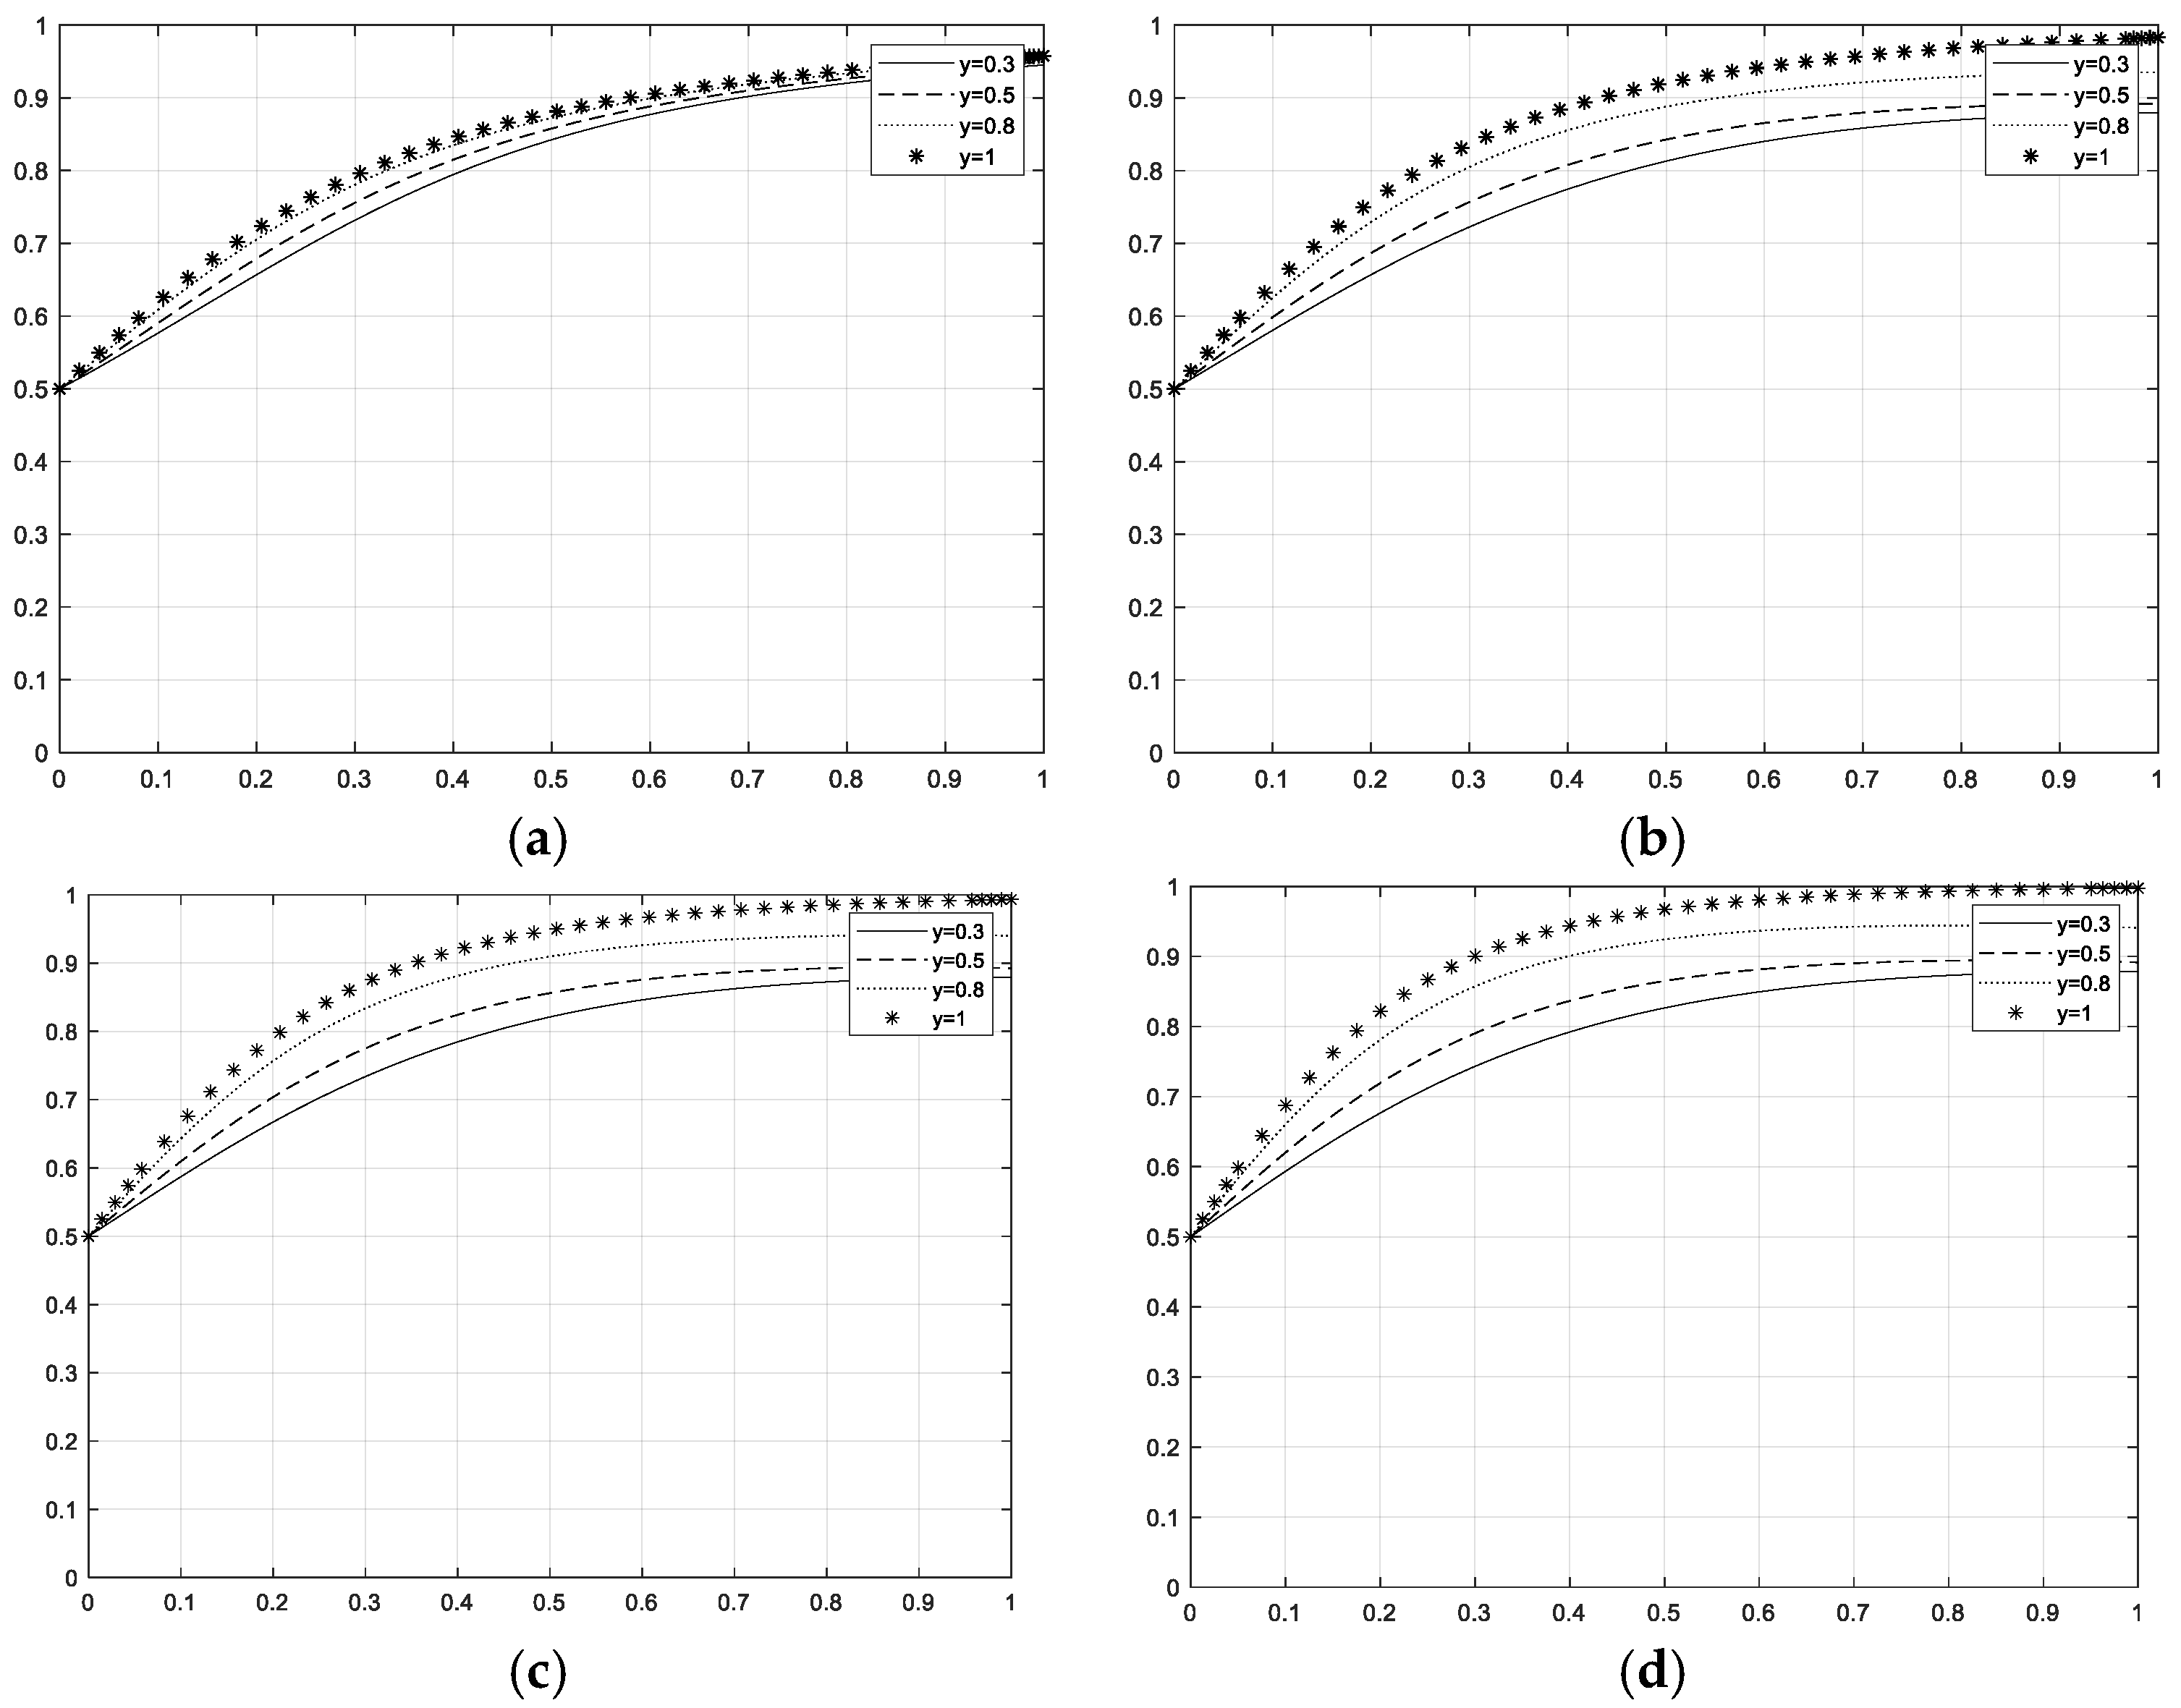
As shown in
Table 4, when central government does not monitor both local and enterprise-level activities, there is only one stable strategy for enterprise-level cleaner production with a value of No.2 (1,0,0), (cleaner production, no-regulation, no-monitoring), which corresponds to the replicated dynamic phase diagram shown in
Figure 1. In combination 2, conditions
,
and
must be met, namely that the cost of green development to the firm is less than the sum of the firm’s rent-seeking costs and environmental taxes, and that the cost of strict monitoring by central government is greater than the difference between the fines it collects from local governments for poor regulation and the rewards it gives to firms.
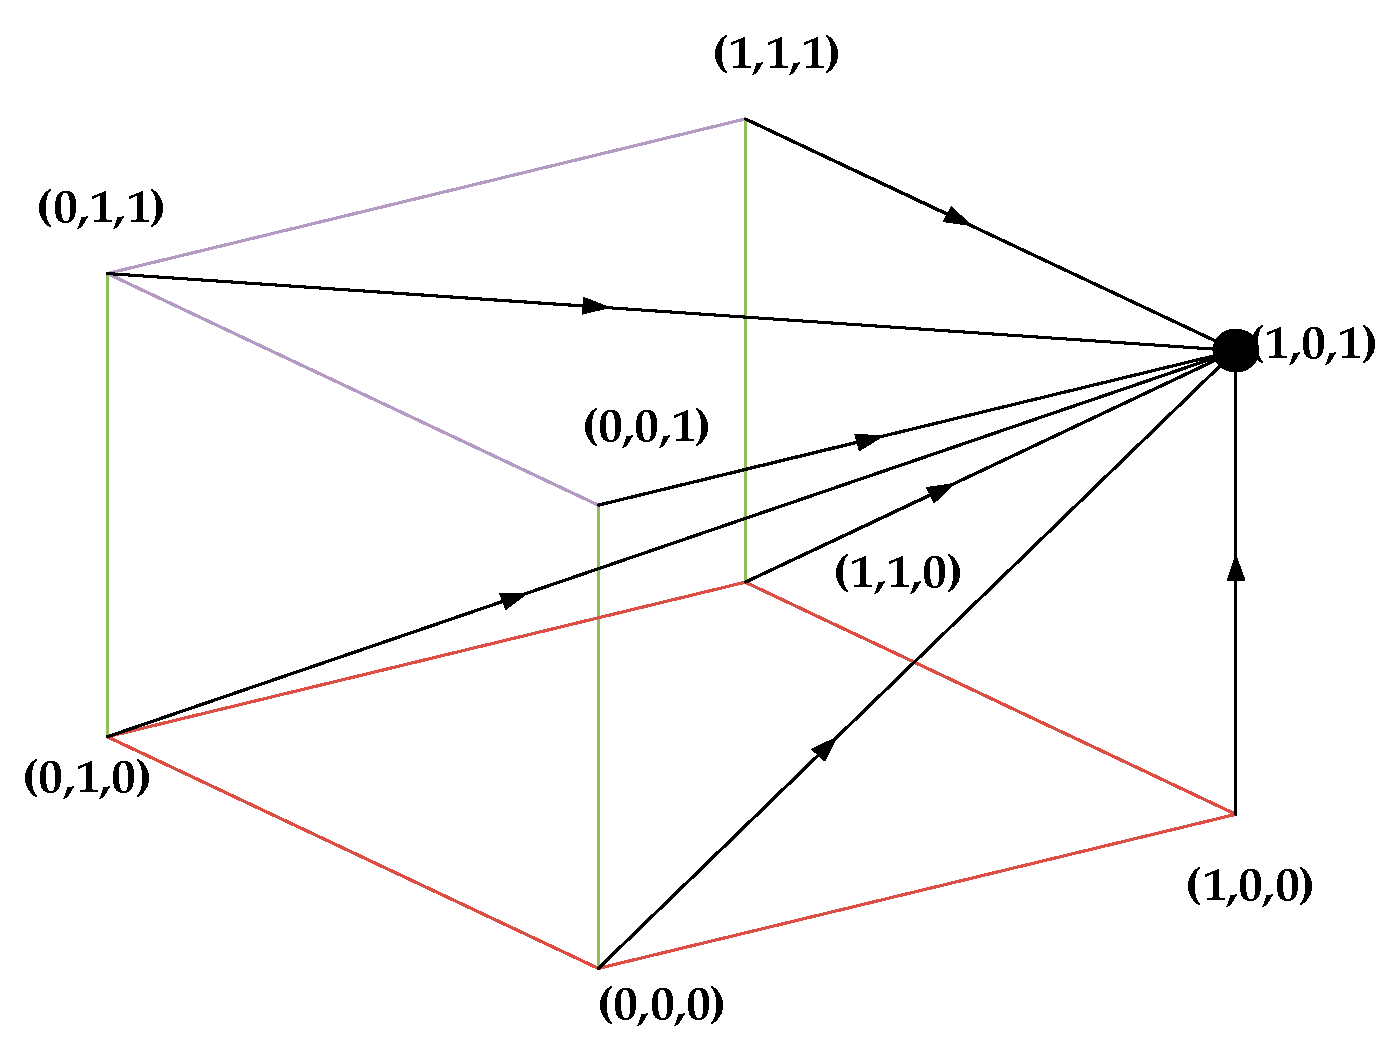
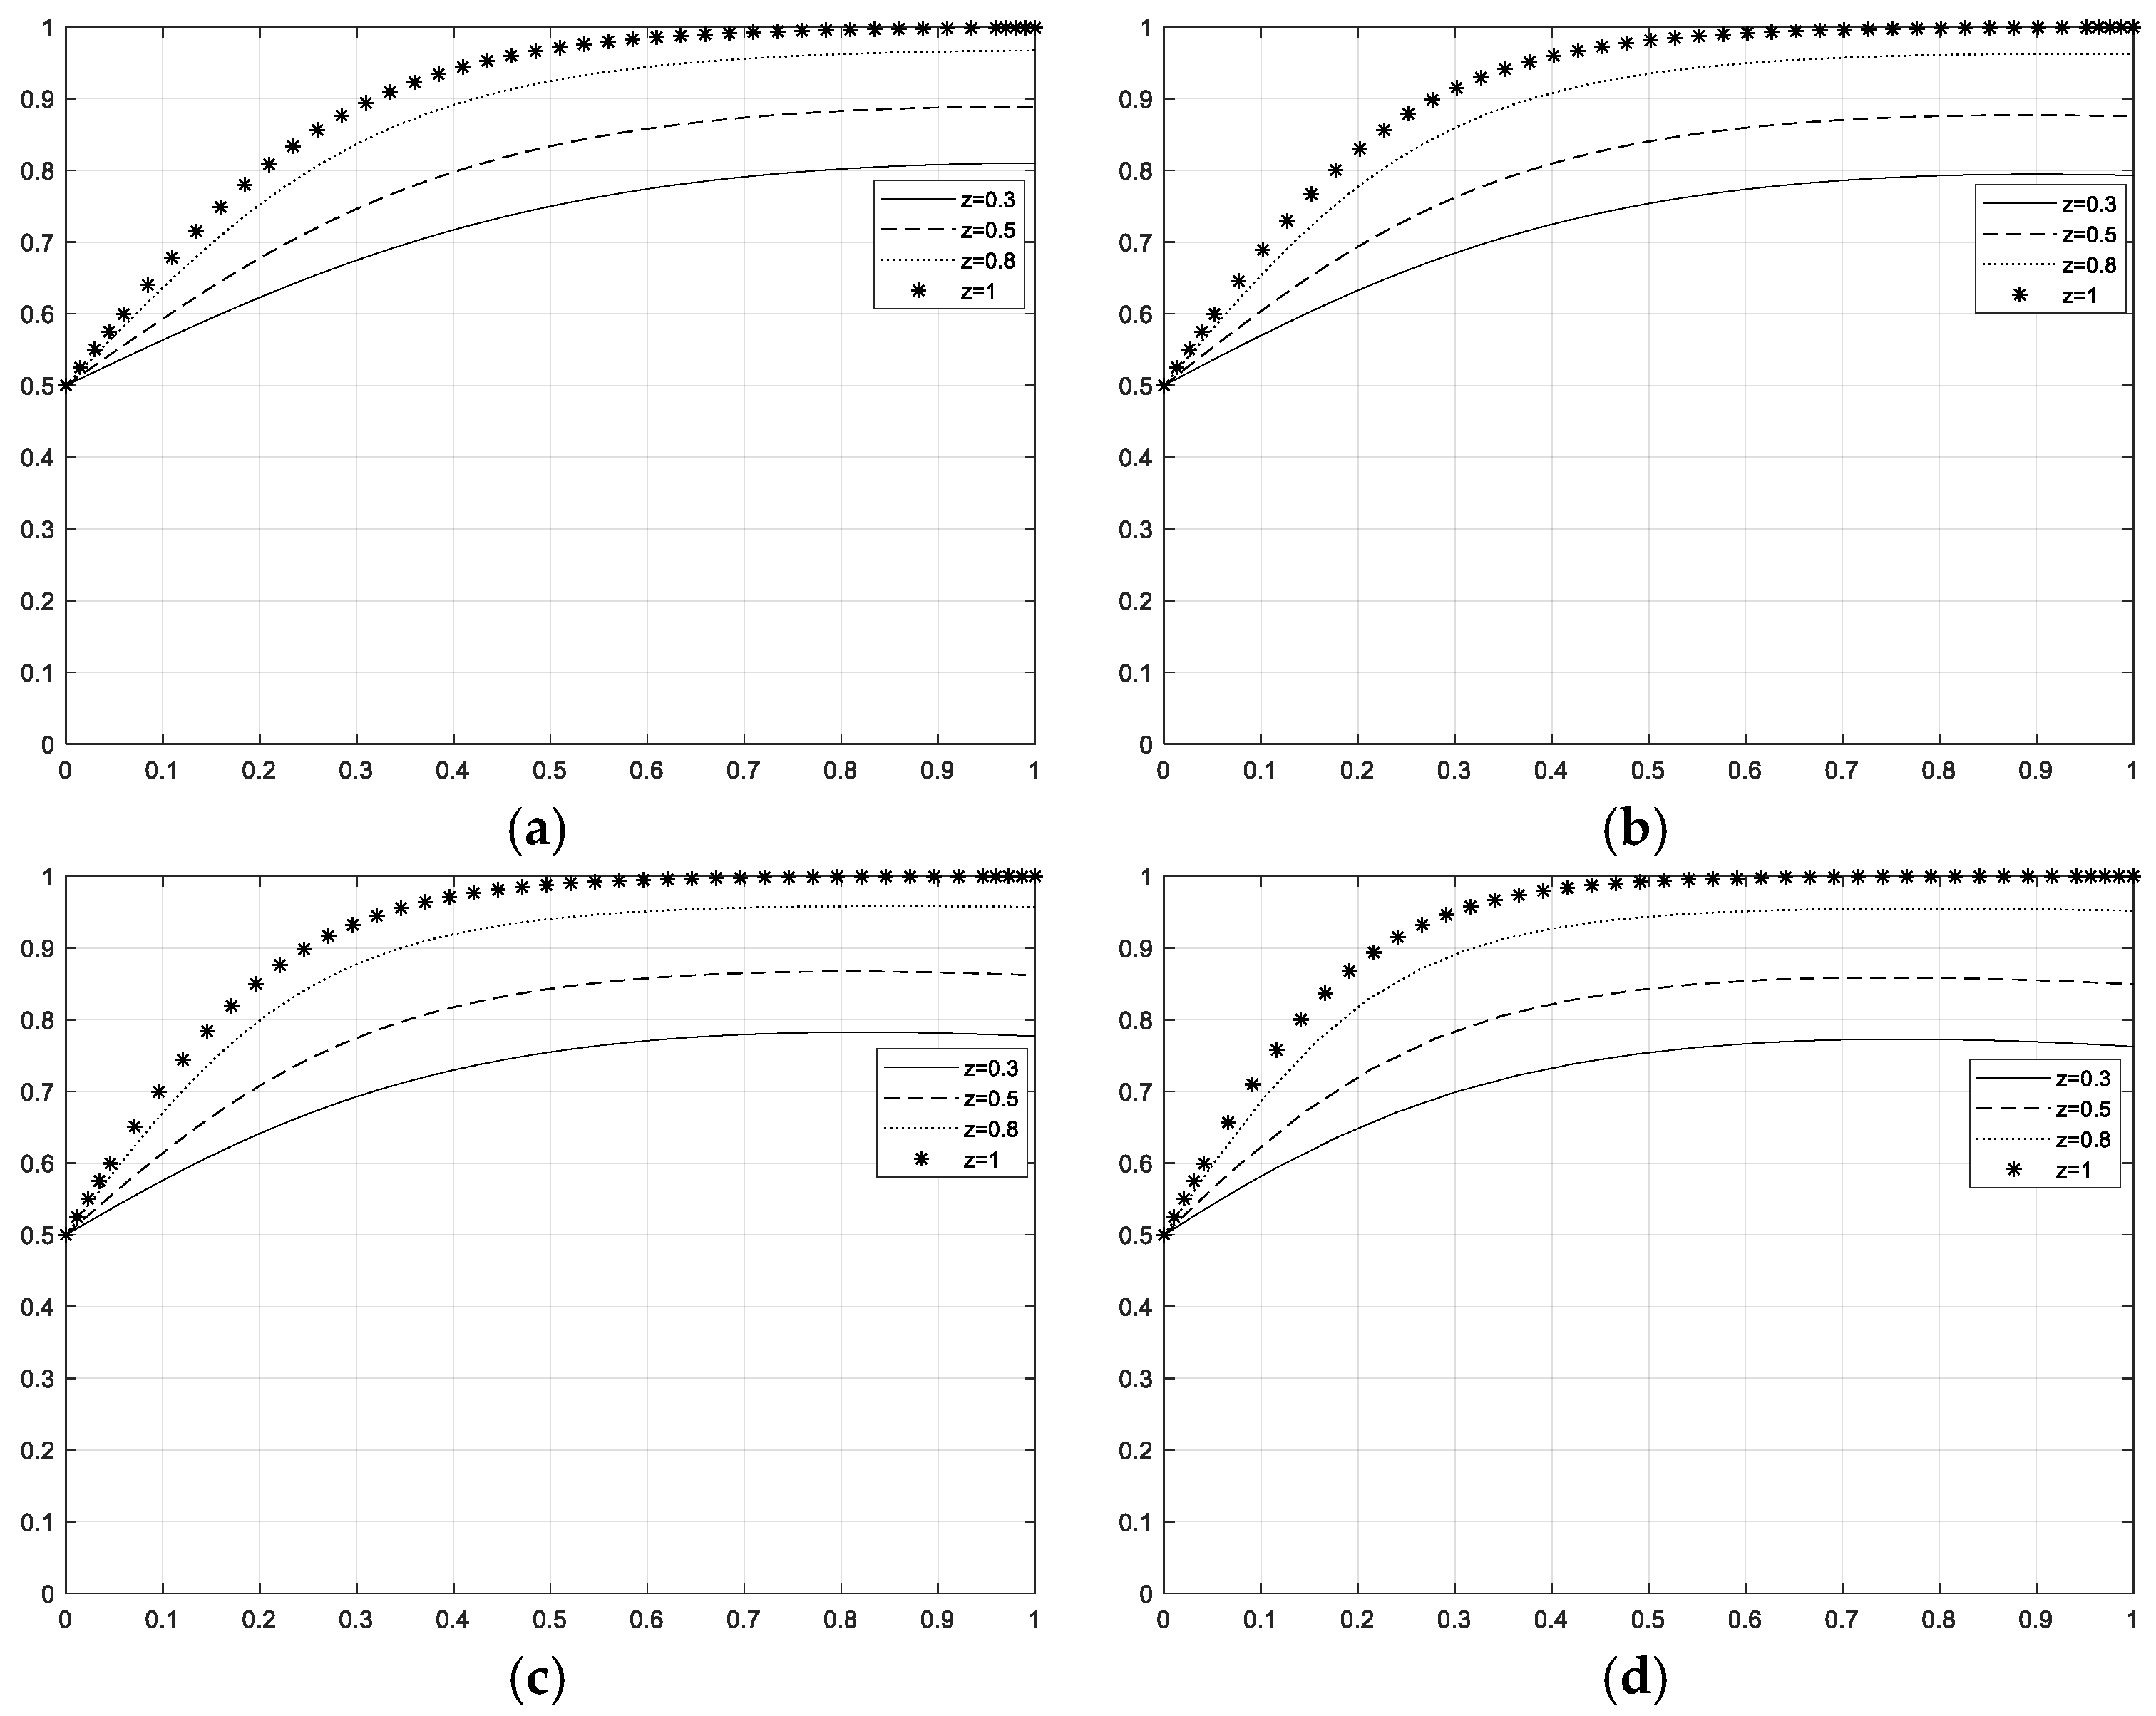
When central government chooses to monitor the local as well as the enterprise, there exists a stable strategy combination of enterprise cleaner production with one value of No.3 (1,0,1), i.e., (green development, no regulation, monitoring), which corresponds to the replicated dynamic phase diagram shown in
Figure 2. In combination 3, the conditions
,
,
need to be satisfied, that is, the cost paid by enterprises to choose cleaner production is lower than the sum of rent-seeking costs, environmental taxes, fines for rent-seeking behavior, and the state’s incentives for environmental behavior of enterprises; the sum of the cost of local government supervision and the amount of subsidies paid to enterprises is lower than the sum of the incentives and penalties for proper supervision of local governments by central government; the cost of strict monitoring by central government is lower than the difference between the fines it charges local governments for poor supervision and the incentives it rewards companies for their cleaner production practices.
4. Discussion
This article employs game theory to construct a game model with three dimensions: national, local, and enterprise, and then uses simulation experiments to verify the effect of environmental taxes, pollution emissions, static reward and punishment policies at various administrative levels, and dynamic reward and punishment measures on corporate strategic behavior choices. From a model-building perspective, the three game players chosen in this paper in accordance with China’s “State Council Institutional Reform Plan” reflect the current state of China’s environmental management while also providing a framework for environmental governance in other countries. This is because the majority of other countries also have a three-tiered governance structure, such as the “EPA-state government-enterprise” structure in the United States and the Australian “AGDA-state/local government-enterprise” structure etc.
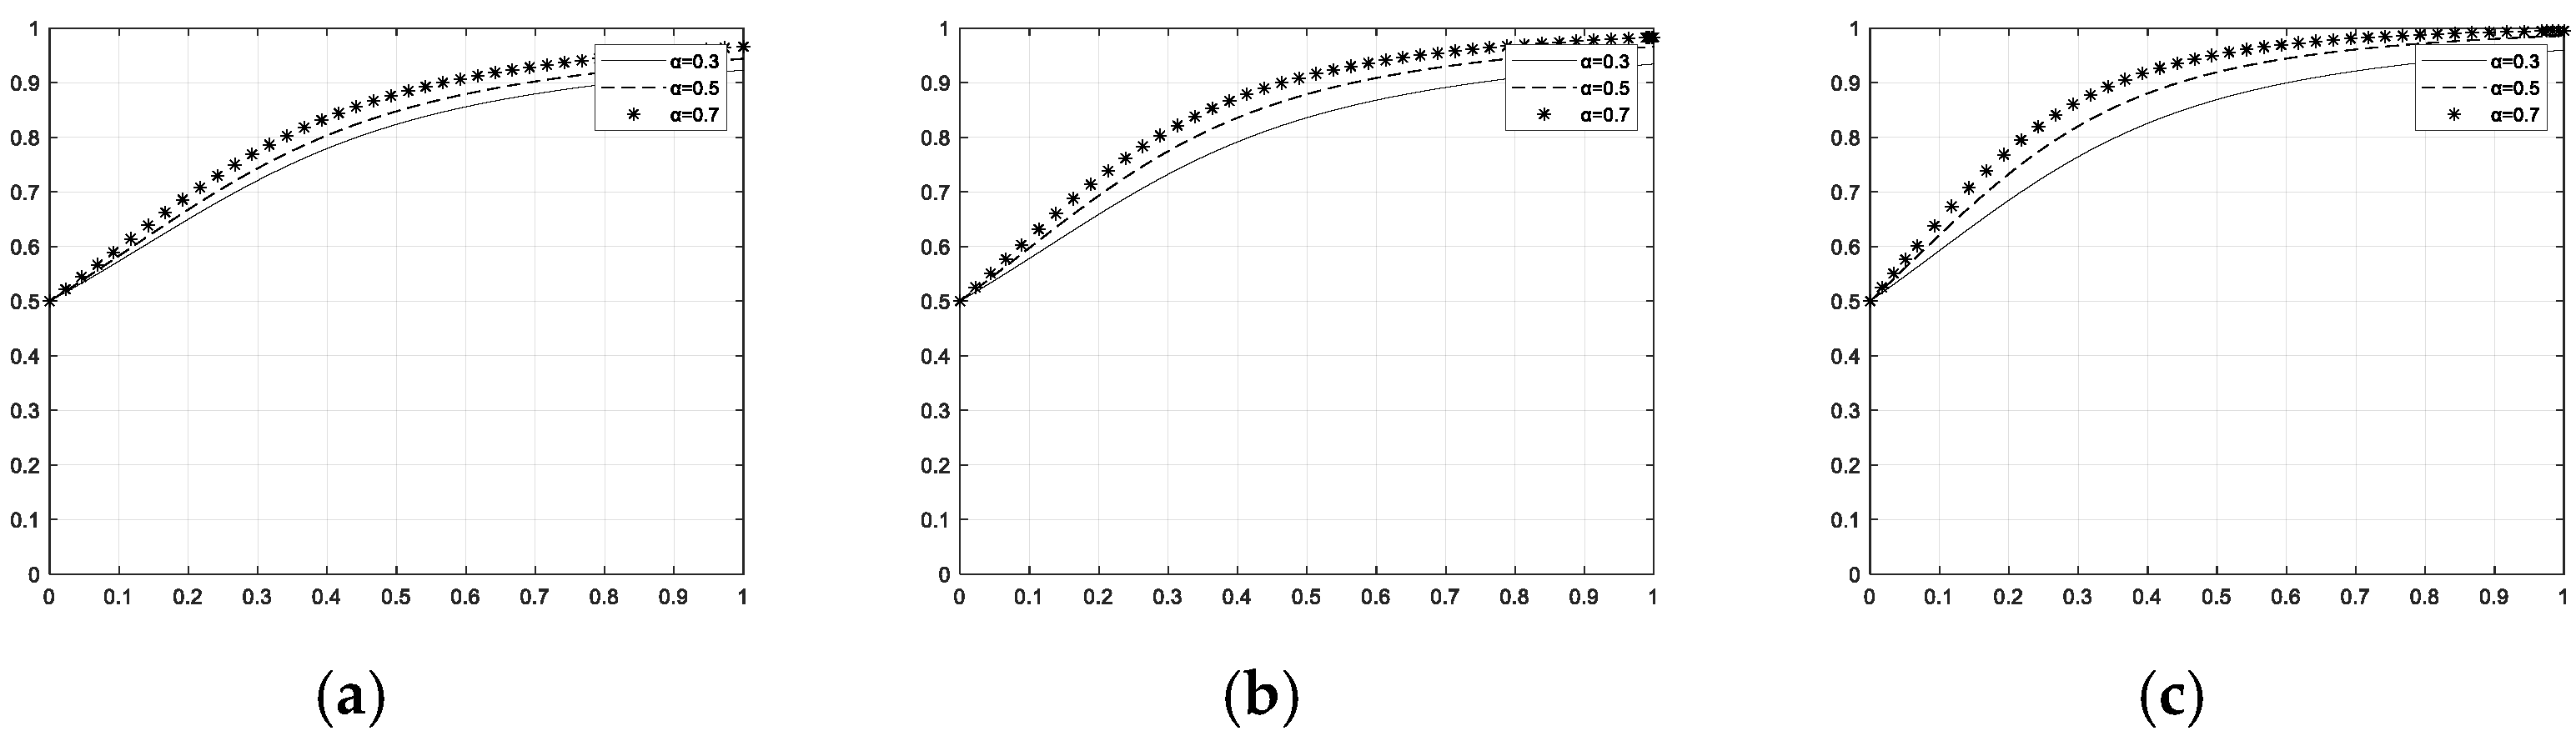
In terms of the impact of pollutant discharge and environmental taxes on corporate decision making, Weitzman [
36] has theoretically demonstrated that government departments’ use of taxation plays a significant role in promoting cleaner production enterprises. According to Pearce [
37], environmental taxes can both compel businesses to conserve energy and reduce emissions and encourage businesses to improve their manufacturing technology, thereby benefiting environmental development. The simulation results presented in this article on environmental taxation and pollutant discharge corroborate these assertions. At the same time, this paper believes that businesses are the primary source of environmental pollution, and that different types of businesses emit pollution at varying levels. For example, manufacturing enterprises emit more pollution than other types of businesses, and they are more sensitive to changes in environmental taxes. Environmental pollution is relatively low for Internet companies, and changes in environmental taxes have little effect on the development of businesses.
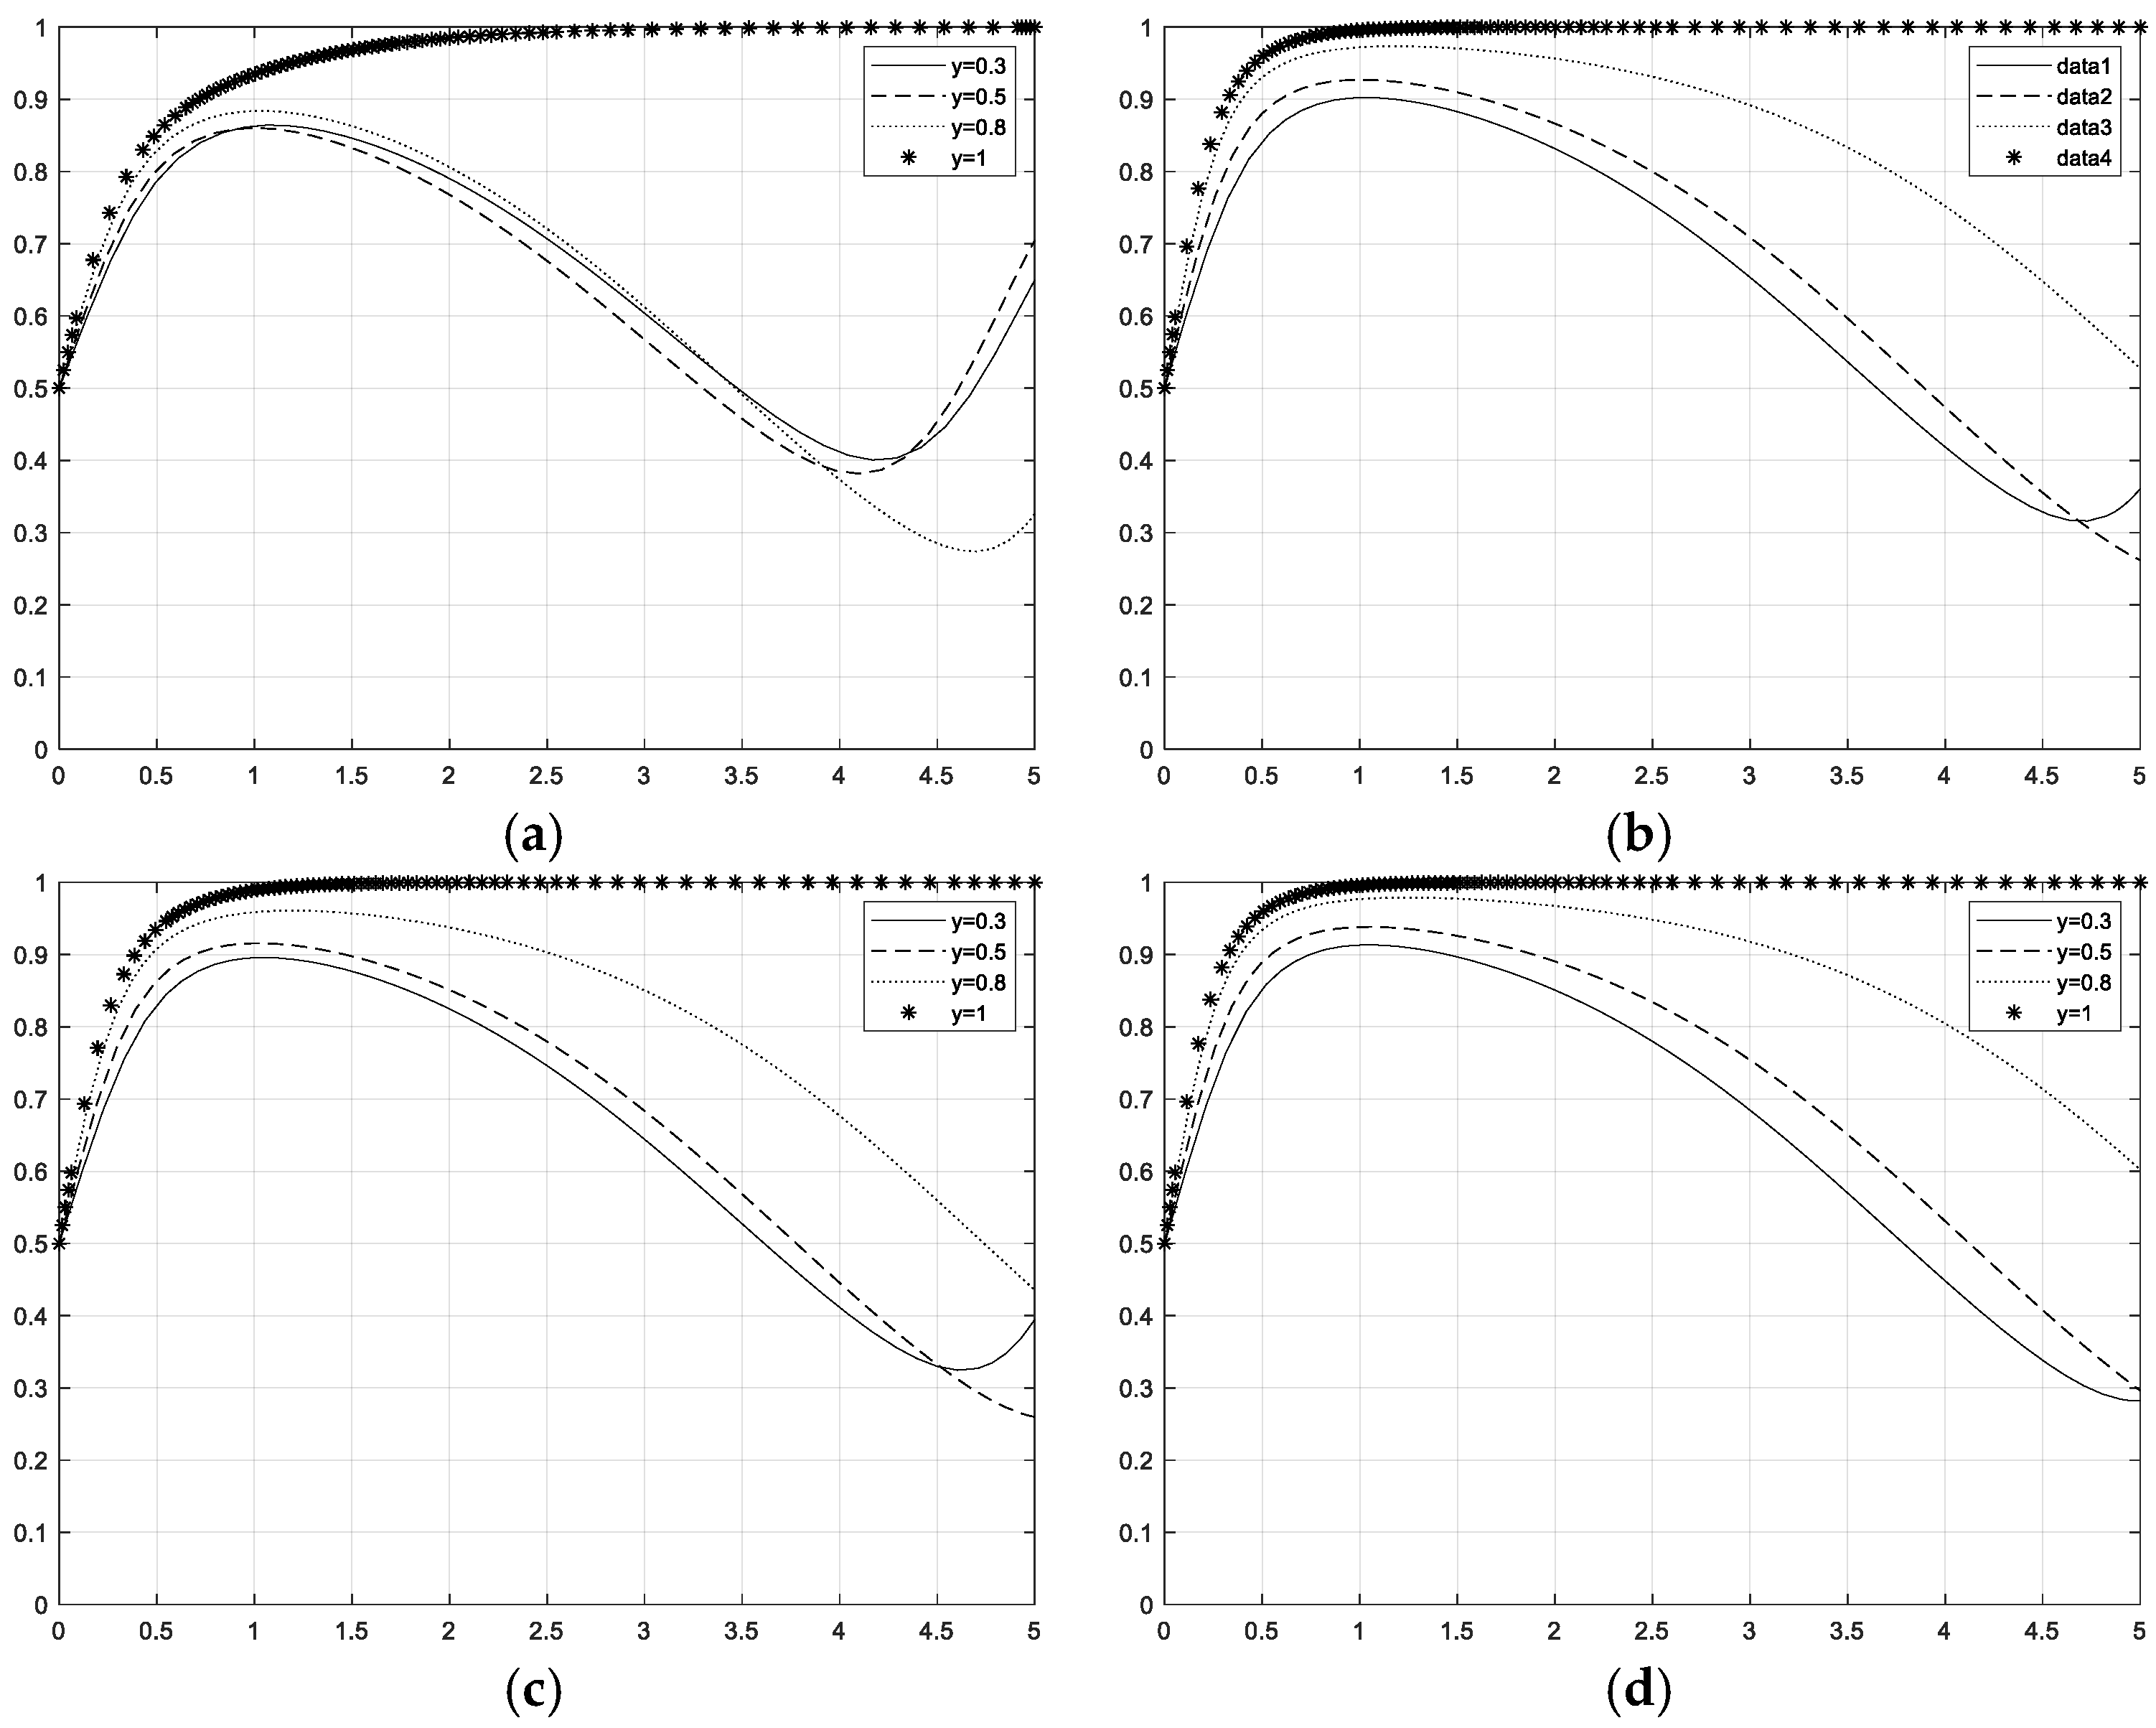
The simulation results in this paper confirm the viewpoints of Olubum [
38] and Devlin [
39] regarding the impact of static reward and punishment policies on corporate behavioral decision making. This effect is only temporary. It could be because the likelihood of local governments and national departments participating changes over time, and the sensitivity of enterprises to policies decreases over time. The incentive effect brought by the static reward and punishment policy gradually declines and it may even induce enterprises to take risks, engage in rent-seeking behavior, and achieve complicity [
40], all of which are consistent with the psychological characteristics of greed [
41]. On the other hand, existing research on the effects of reward and punishment policies on corporate behavior has failed to account for the difference in corporate sensitivity to the two types of decision making. The simulation results indicate that businesses are more sensitive to state and local government incentive policies than to punishment policies, which is consistent with economics’ fundamental assumption—the bounded rational person who “seeks benefits and avoids disadvantages [
42],” because the purpose of the enterprise is to maximize benefits. When incentive and punishment policies are sensitively compared, enterprises are more sensitive to the state’s and government’s incentive policies.
The impact of dynamic reward policies on corporate behavior is more stable and continuous than the simulation results of static reward and punishment policy. Scholars in the financial industry [
43], agriculture [
44], the Internet [
45], and other industries have reached similar conclusions, but there are few studies on environmental protection. This conclusion is psychologically consistent with the characteristics of classical conditioning theory, namely “acquisition, extinction, recovery, and generalization [
46].” When a static reward and punishment policy is implemented, businesses are stimulated to engage in the corresponding behaviors, but only for a limited time. This effect fades and fades over time, reverting to unfriendly behavior. When an enterprise adopts a dynamic reward and punishment policy, as the policy’s effect fades, the dynamic policy can cause the enterprise to adjust the policy in response to changes in the environment over time, generate new incentives for the enterprise, and keep the enterprise’s decision-making choice. Any decision made by the decision maker in the long-term development process of an enterprise is made after a detailed analysis of the business environment of the enterprise, and the policy environment determines the enterprise’s development in the external environment. Changes in policies determine the development direction of an enterprise in the future. As a result, if the reward and punishment policy does not change for a long time, the company will make haphazard strategic decisions and will gradually tend to make decisions that are unfriendly to the environment. Therefore, when the reward and punishment policy have not changed for a long time, the enterprise will make tentative decisions on strategic choices, and will gradually tend to make decisions that are not environmentally friendly.
5. Conclusions and Suggestions
This paper analyzes the strategic choices made by enterprises, local governments, and central government under various tax systems, and reward and punishment programs, and discusses the systematic dynamic evolution trends and stability strategies. The evolution path of the game between enterprises, local governments, and central government, as well as the position changes of equilibrium points, are numerically calculated using MATLAB software. The following conclusions are drawn from this paper: there is no ideal evolutionary equilibrium state in the game system under static policies; in comparison to the punishment policy, the company is more sensitive to the reward policy, and while both punishment and reward have a guiding effect on the company’s strategic choice in the short run, the guiding effect gradually fades over time and cannot completely curb the company’s irregular strategy; the dynamic reward scheme can effectively mitigate the game system’s fluctuation and make enterprise strategy selection tend to be ideal. Based on the above analysis, the following suggestions are made:
Firstly, strengthen government–enterprise exchanges and encourage technological innovation and enterprise transformation. Relevant government policies will have an impact on a variety of business decisions. Strengthening communication between the government and businesses can help businesses understand their future development directions, which is beneficial to the development of strategic decisions for cleaner production. In terms of communication, it has the potential to accelerate the transformation of enterprises’ technological innovation while also lowering the cost of cleaner production.
Secondly, broaden the methods of supervision and increase the visibility of corporate wrongdoing. Local government supervision and supervision by central government influences enterprise strategic decision making, enriches supervision forms, and increases the rate of violations by companies that violate regulations, which can not only improve supervision effectiveness, but also have a deterrent effect on other companies. As a result, it is necessary to make effective use of social channels, such as the media, increase the frequency of public communication, and improve the local governments’ and central government’s supervision and supervision effects.
Thirdly, use dynamic incentive measures to increase the incentive effect of enterprises’ cleaner production. Static reward and punishment policies can only guide enterprises toward more environmentally friendly production in the short term, but their guiding role will gradually fade away as the development process progresses. To achieve the best incentives, central government and local governments should adjust incentive measures in response to changes in corporate behavior.
This paper also suffers from the following flaws, which warrant future research: due to the numerous variables that influence the effectiveness of environmental governance, this paper only selects three game subjects based on their administrative levels and other factors. Future research can further enrich the game subjects, such as third-party polluting businesses, the public, internal employees, etc., thereby improving the game model’s accuracy. Furthermore, during the assumption process, this paper makes assumptions based on the behavioral interaction logic of the three parties and only considers the gains and losses of interest, which does not accurately reflect the actual game situation. In the future, theories from various disciplines can be incorporated to further enrich the assumptions. For example, prospect theory and public game theory. Finally, in the process of simulation analysis, this paper refers to the third batch of typical ecological and environmental law enforcement cases announced by the Ministry of Ecology and Environment in 2020 and the related literature to set basic values. Although it has a certain degree of authenticity, due to the small number of cases, each country’s policies are also different, so the applicability to other countries will be affected to some extent.


