1. Introduction
A water distribution system (WDS) is designed to supply and distribute water to each user with sufficient pressure and water quality. The WDS performance must be maintained, considering that water is essential to sustain human life. However, in recent years, various disruptions have degraded the WDS performance and caused abnormal conditions. Recovery from such abnormal conditions typically involves isolating a failed block, thereby necessitating a water service interruption. Depending on the size and location of the isolated block, the amount and duration of water shortage will differ. Therefore, proper mitigation strategies should be established beforehand to minimize the degree and duration of water shortage under abnormal conditions and to secure sustainability of WDS.
The strategies can be divided into two categories: predisaster mitigation and postdisaster mitigation [
1]. Predisaster mitigation measures include the renewal of aged pipes to reduce the breakage probability [
2,
3], dual lining of pipes to enhance system redundancy [
4,
5], and installation of additional water storage for backup [
6,
7]. These strategies focus on long-term disaster preparedness by reducing failure probability or creating redundancy. In contrast, postdisaster mitigation measures are focused on emergency response with continuous service under abnormal conditions and rapid recovery from failure; they include the identification of failure [
8,
9], effective isolation of the failure region [
10,
11], adaptive operation [
12], and emergency interconnected operation (EIO) [
13,
14,
15].
A WDS consists of various components, such as pipes, valves, pumps, and tanks, resulting in multiple combinations of possible failure scenarios [
16]. Among various scenarios, reservoir-related failures cause the most damage to the system, especially when the system has a single reservoir. Reservoir failure generally has a long recovery time and causes large-scale damage that needs to be reduced by converting the water system in case of an emergency [
17]. Even if the reservoir itself does not fail but a pipe connected to the reservoir breaks, the entire system may experience water shortage unless it has access to alternative water sources [
14].
EIO is an efficient approach to respond to reservoir failure. EIO is a strategy that secures the maximum possible water supply to the failed block by opening an emergency interconnection pipe (EIP) that is connected to an adjacent block. Thus, when performing the EIO, water will be supplied to the failed block from the adjacent reservoir. Studies have highlighted the necessity of designing an EIO strategy to secure the reliability of the WDS [
18]. Government organizations have also described EIO as an alternative for mitigating water shortages. For example, the Korea Ministry of Environment [
19] states that it is desirable to improve the stability of water source facilities to be linked and operated in case of emergency through multi-systemization and pluralization. Further, diversification of water sources should be considered by connecting nearby water sources to prepare for climate change events, such as drought or flood. Moreover, the United States Environmental Protection Agency (USEPA) highlighted the use of EIPs and valves between two blocks for realizing EIO to minimize water shortage under abnormal conditions [
20].
Only a few studies have directly focused on EIO. For example, Baek et al. [
21] investigated emergency water supply plans, and Han et al. [
22] proposed an emergency water supply plan and analyzed the amount of supply through hydraulic analysis. Oak et al. [
13] and Jun et al. [
14] calculated the fuzzy-function-based supply capacity standard index in the case of EIO, selected variable combinations according to consumers’ perception, and calculated their satisfaction. Gim et al. [
23] focused on improving the EIO performance using a pressure-driven analysis (PDA) model. Jayaram and Srinivasan [
24] and Cunha et al. [
25] tried to minimize system failure in the WDS design phase. Bross and Krause [
26] focused on the type of emergency water supply source. Kim et al. [
27] explored the equity of points of distribution locations of bottled water. Bross and Krause [
26] and Bross et al. [
28] also highlighted the political support for emergency water supply plans. Emergency water supply plans have mainly been devised for a pipe breakage scenarios or fire flow condition, especially for WDS design problems [
8,
9,
16,
29]. Even though many studies have focused on emergencies for various purposes, detailed analyses and solutions regarding insufficient EIO performance have not yet been reported.
Before performing EIO, the significance of abnormal conditions and water supply performance must be considered. When performing EIO, water is supplied from an adjacent block through the EIP, and the hydraulics of the block changes [
14]. Such changes in the hydraulics may induce several problems which will eventually reduce the performance of EIO. For example, the block receiving water from the adjacent block may suffer from insufficient pressure, and the block supplying water may also suffer insufficient pressure with increasing head loss and depletion of the adjacent reservoir. Therefore, before performing EIO, its temporal and spatial appropriateness must be investigated through a proper hydraulic analysis model to determine whether water can be sufficiently supplied to the target block for an appropriate time, and if appropriate EIO performance cannot be achieved then strategies to enhance the performance should be also investigated to guarantee serviceability of WDS under abnormal condition.
As mentioned, when performing EIO, not all plans can effectively reduce the impact. This study analyzed the effect of EIO and investigated options to improve the EIO performance. Therefore, first, the reasons for insufficient EIO are identified and categorized, and strategies are suggested and explored to improve the EIO performance. The systemized process is proposed, and examples of decision-making are provided. All demonstrations were performed on a real WDS in A-City, South Korea. To quantify the EIO performance, a hydraulic analysis model called advanced pressure-driven analysis (A-PDA) that can consider changes in the reservoir head in response to supply changes was used.
The rest of this paper is organized as follows.
Section 2 discusses the methodology used for the analysis.
Section 3 discusses strategies to improve the EIO performance.
Section 4 describes the case study.
Section 5 presents the results. Finally,
Section 6 presents the conclusions of this study.
2. Materials and Methods
This section introduces the key methodologies. First, different types of hydraulic analysis are discussed and A-PDA, which is used for all simulations in this study, is introduced and compared with other hydraulic analyses. Then, possible methods to identify scenarios that require EIO initiation are discussed as not all abnormal conditions require EIO. Only pipe breakage scenarios are considered in this study, and the pipes that require EIO once they fail are defined as high-importance pipes (HIPs). Next, a metric for evaluating the EIO performance is discussed. Finally, possible challenges that can reduce the EIO performance are examined and corresponding solutions are presented.
2.1. Hydraulic Analysis
Hydraulic analysis for WDS can generally be classified into two categories: demand-driven analysis (DDA) and PDA. DDA assumes that all demand at all demand nodes is satisfied regardless of the pressure condition of the node. From this assumption, the continuity equation and energy equation are applied to estimate the pressure at each node by calculating the associated head loss following determined flows in the pipes. DDA works well under normal operating conditions with sufficient pressure at nodes above the minimum required head, but provides unrealistic results (e.g., negative pressure) for abnormal conditions (i.e., computed pressure at nodes is below the minimum required pressure). In contrast, PDA considers the head–orifice relationship (HOR) and computes the available demand for a given node pressure. If the node pressure is below the minimum service pressure, then the demand is adjusted following HOR. Therefore, unlike DDA, PDA can provide a better estimation during abnormal conditions. However, both hydraulic analyses assume an infinite reservoir; therefore, additional treatment should be performed to account for changes in the water level of the linked reservoir with additional water supply during EIO. Here, an infinite reservoir implies that a reservoir can theoretically supply unlimited amount of water regardless of its capacity (size).
To overcome this issue, Lee et al. [
30] proposed an alternative hydraulic analysis model called A-PDA. A-PDA is identical to PDA in terms of pressure calculations; however, it does not use an infinite reservoir. In other words, A-PDA limits the water supply of the reservoir based on its capacity, and therefore, the head of the reservoir will respond to the difference between the supply to the reservoir (i.e., inflow from water treatment plant) and supply from the reservoir (i.e., total demand of service area including additional supply during EIO). Specifically, if the supply to the reservoir is less than the supply from the reservoir, then the head of the reservoir will decrease, and vice versa. The A-PDA has been applied in multiple studies [
13,
14].
Table 1 summarizes the characteristics obtained using the hydraulic analysis models.
As this study focuses on EIO and additional supply from a specific reservoir will influence the reservoir operation, A-PDA was used for all hydraulic analyses in this study. The A-PDA model was first introduced by Lee et al. [
30], and the uWater software, which was used for this study, was developed based on the model by UNU Inc. (
https://unu-inc.com/uwater (accessed on 25 March 2022)). The EPANET source code was modified to account for a limited reservoir. A major change was made to the reservoir by adding a level-storage relation, average inflow, and inflow pattern. As a result, water level (or head) of the reservoir will continuously change responding to preplanned inflow to the reservoir and actual supply to the service area, and it has a continuous in-flow as planned by the water utility (typically equal to the daily demand of the service area).
2.2. Identification of High-Importance Pipes (HIPs)
Usually, the damage caused by pipe breakage is smaller than that caused by the failure of water intake plants, water treatment plants, and reservoirs; however, not all pipes suffer the same damage [
17]. When a WDS component fails, the isolation valves are closed to isolate it and to perform maintenance; this necessitates a service interruption. Note that the smallest area that can be isolated by the valves is defined as a segment [
18]. The service interruption occurs owing to not only the location of the isolation valves but also isolation-induced insufficient pressure. Typically, the former is defined as the intended isolation and the latter as unintended isolation [
31].
An HIP is a pipe that cannot supply as per the sufficient demand even during EIO. It is similar to the concept of criticality by [
32,
33], as both account for damage caused by a pipe failure; they differ in that HIP as defined in the present study additionally considers EIO. To determine HIPs, the segment must be identified to estimate the expected damage. This study uses the segment finding algorithm proposed by Jun et al. [
34]. Based on the segment analysis, HIPs were identified through two steps. First, the initial selection was performed by calculating the total damage of the isolation event following each pipe failure. If the isolation has water service interruption above 10% of the total demand of the system, then the pipe causing the isolation is considered as a potential HIP. Second, EIO was performed, and the damage was reevaluated to finalize the HIP selection. If the damage caused by the pipe failure can be effectively reduced by EIO, then the pipe is not selected as an HIP as it has a countermeasure.
2.3. Water Supply Performance Indicator
To determine whether to perform EIO, it is necessary to evaluate whether an appropriate amount of water can be supplied to the isolated block in an appropriate range by the EIO. For this, a performance indicator is needed to evaluate the performance of the EIO. Usually, the performance of the WDS is expressed by the reliability, which can be measured in various ways. According to Gheisi et al. [
35], WDS reliability measures are categorized into three groups: analytic, systemic-holistic, and heuristic approaches. The analytic approach typically emphasizes connectivity, which can be quantified by hydraulic analysis (availability) [
12,
29,
36] or by graph theory [
37,
38]. The systemic-holistic approach is somehow similar to the hydraulic analysis of the analytic approach; it views the performance from the system level and ability to continue service. The heuristic approach can be further categorized into three groups: (1) entropy-based technique [
39,
40], (2) power/energy-based technique [
24,
41,
42], and (3) hybrid surrogate reliability measure [
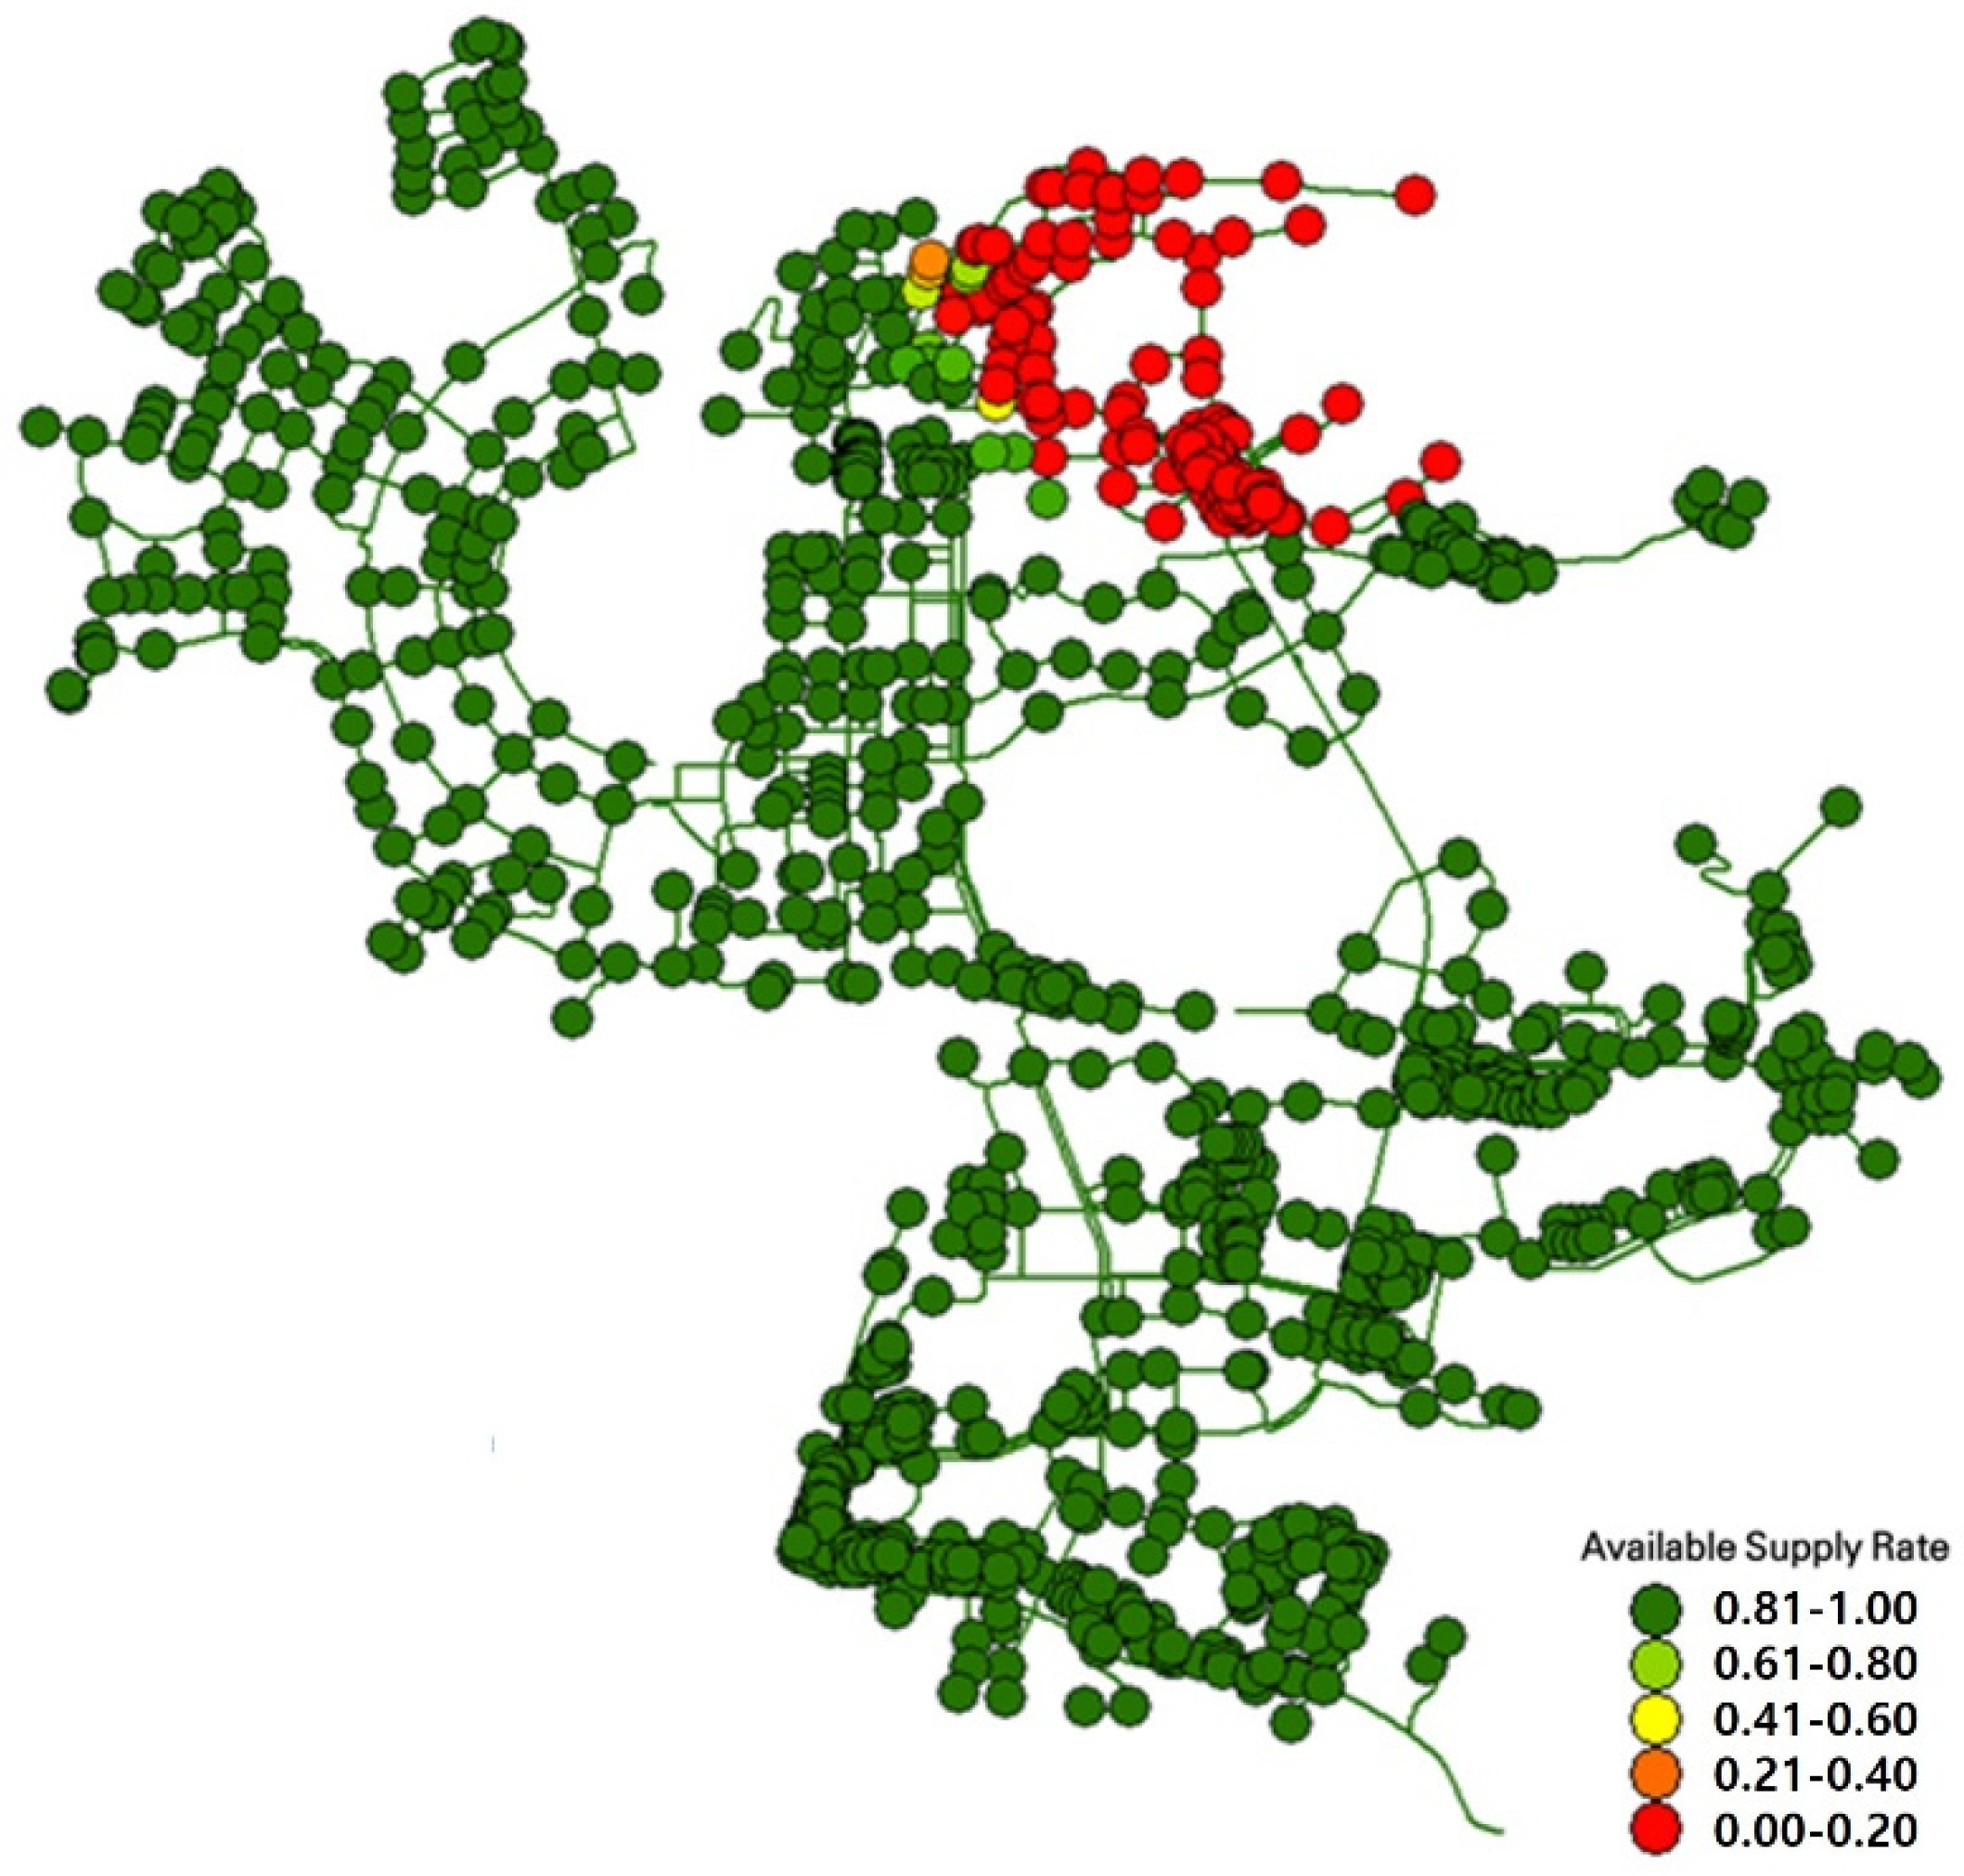
43]. In this study, reliability was defined as available supply rate (ASR) which is the ratio between the requested (or required) demand and delivered (or supplied) demand from a modeling standpoint [
18]. The ASR for each time step was used to evaluate the effectiveness of EIO against HIP failure (Equation (1)).
where
is the available supply rate at time
t (%), and
and
are the available and required demand of the ith node at time
t (in flow units), respectively.
of all time steps were averaged to obtain the ASR for comparison purposes.
2.4. Possible Risks of EIO
When performing EIO, temporal and spatial problems may arise owing to the characteristics between blocks and/or between reservoirs. The EIO performance mainly degrades because of connection and pressure-related (both low and high pressure) problems [
23].
As mentioned, EIO can be performed by opening existing EIPs between two adjacent blocks. However, not all blocks have EIPs or are located in an appropriate location, resulting in the connection problem. Therefore, it is necessary to investigate the supply performance for each EIP to check the effectiveness of EIO. If the EIP cannot ensure the supply performance or no EIP exists to perform EIO, then an alternative EIP should be installed.
Regarding the pressure-related problems, the low-pressure problem may occur due to two main causes. First, the EIP that connects two adjacent blocks is open during EIO, hence the head loss increases as the flow through the pipe increases, which eventually reduces the pressure. Another is when water is supplied from a lower elevation block to a higher elevation block. Note that a high-pressure problem occurs in the opposite case, in which water is supplied from a higher elevation block to a lower elevation block.
3. Strategies to Improve EIO Performance
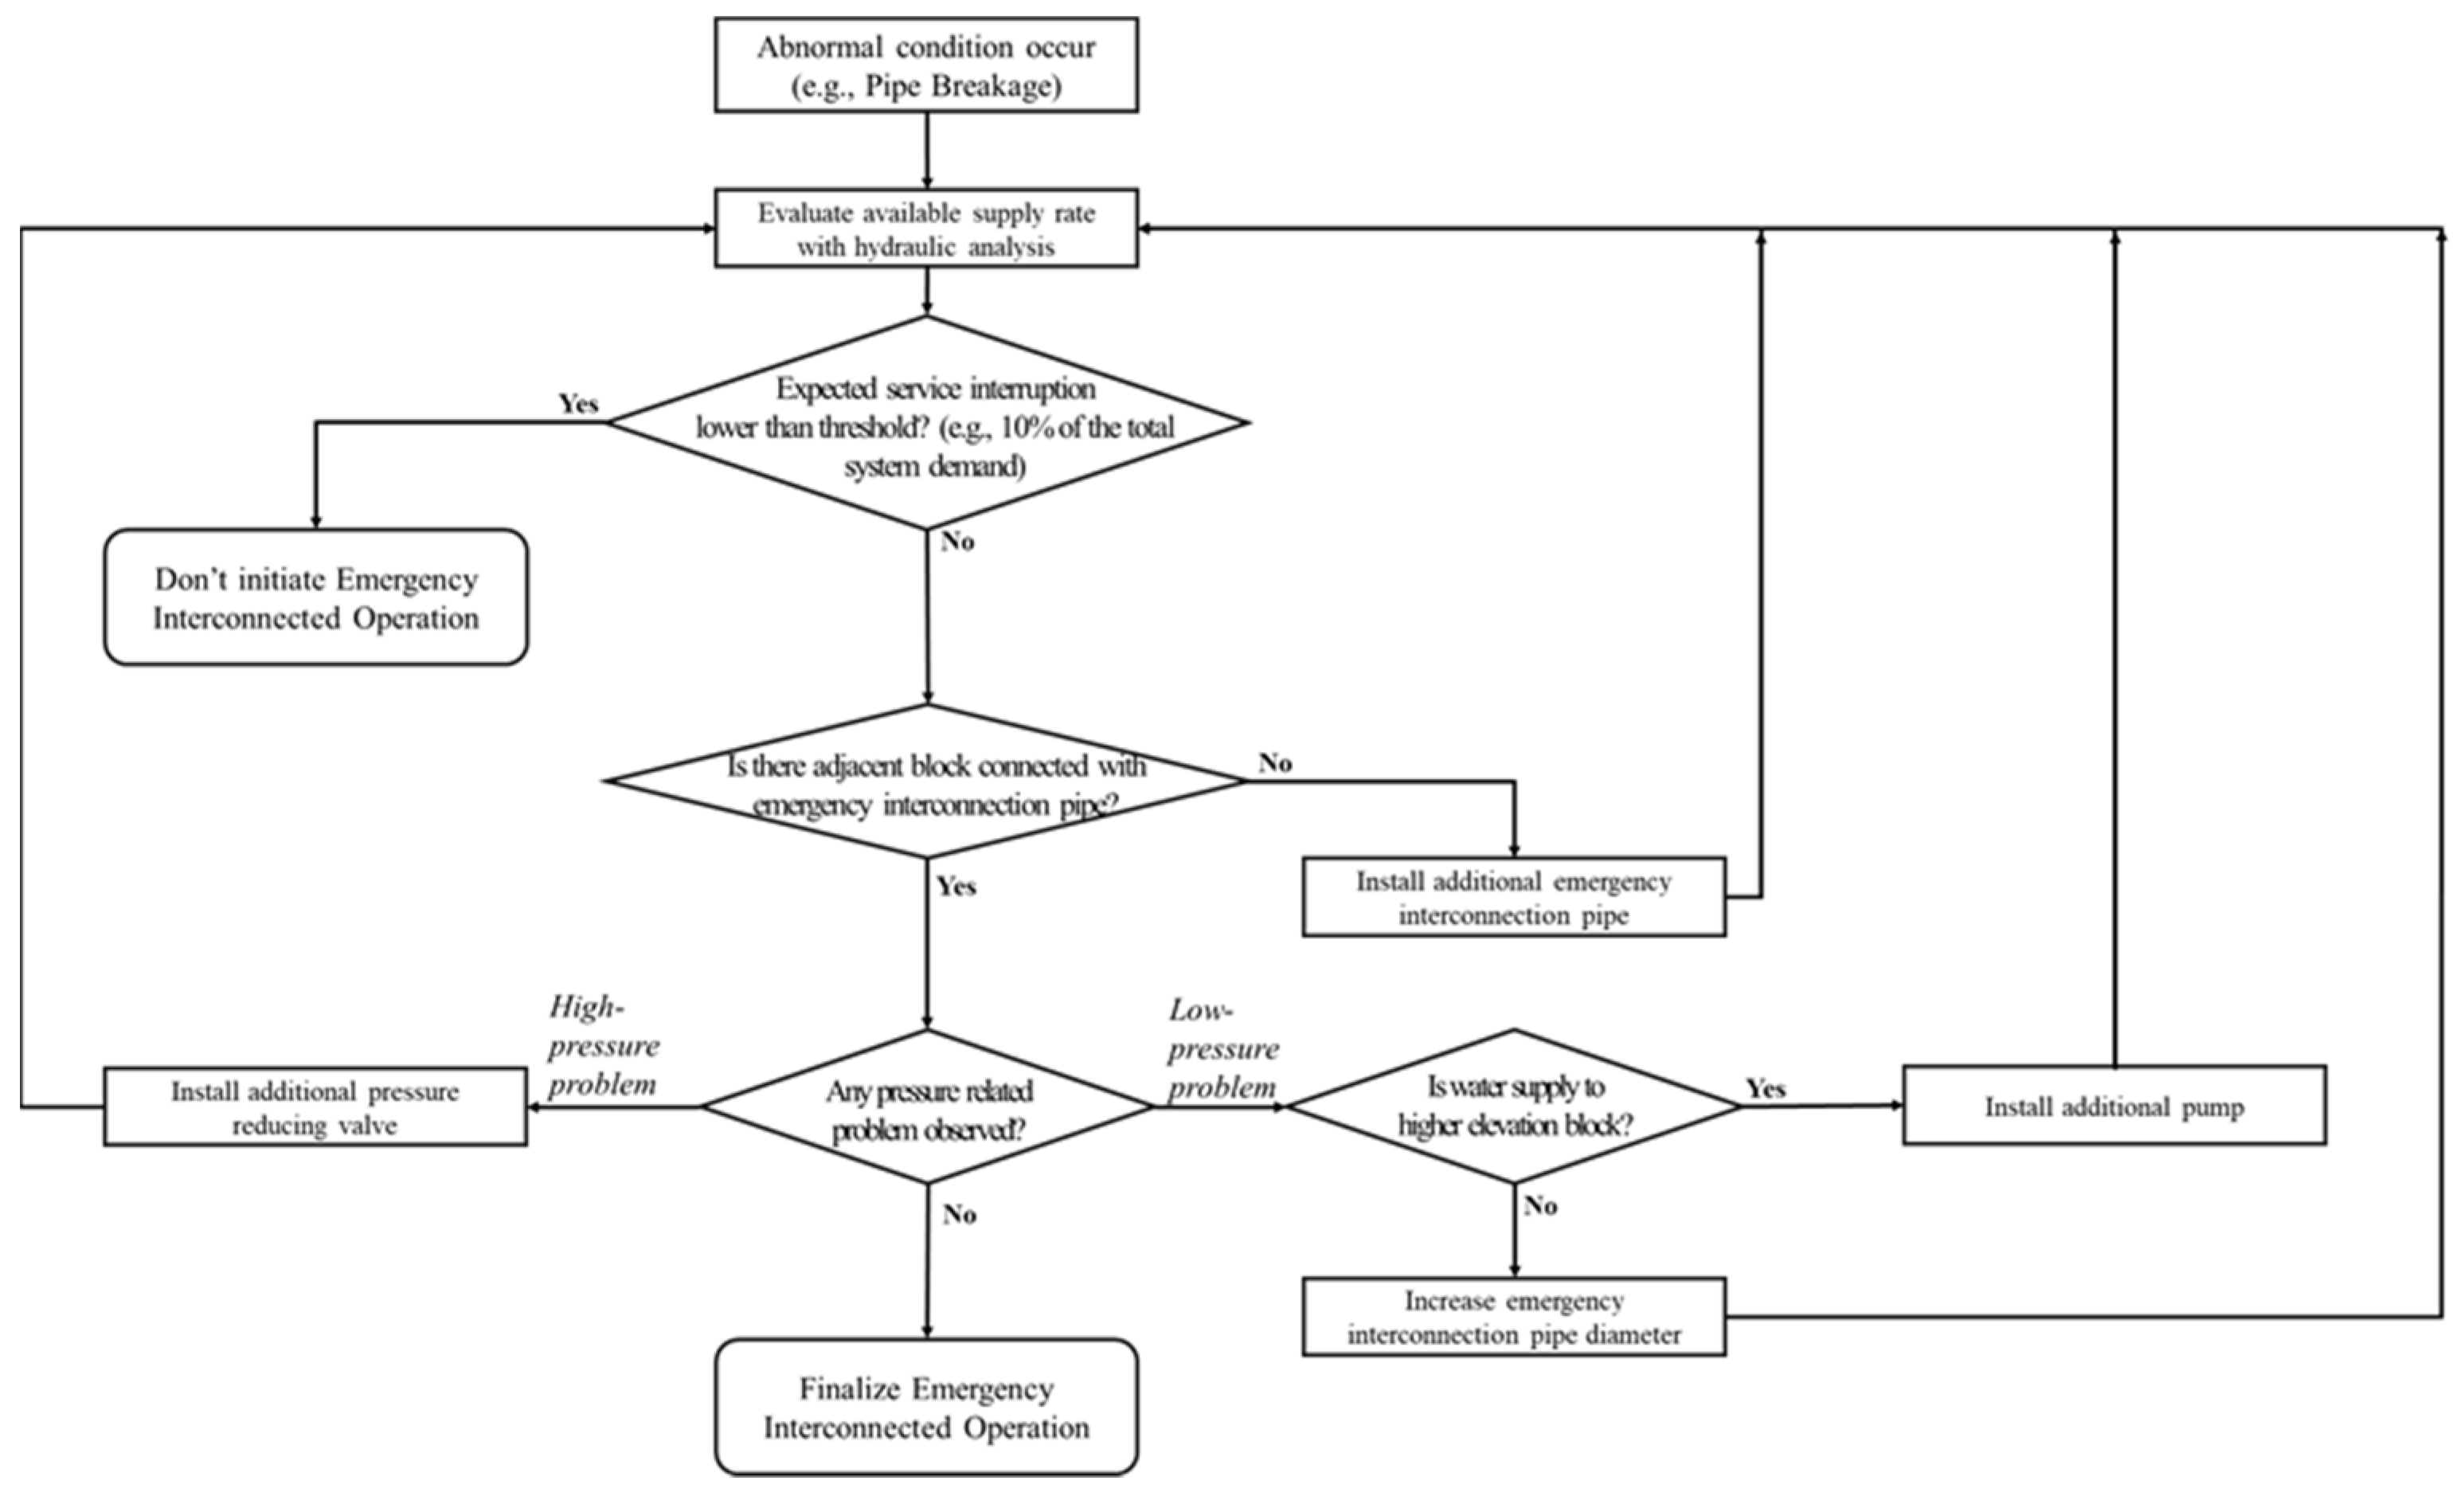
As mentioned earlier, there are a few cases that EIO does not guarantee sufficient supply performance. Therefore, appropriate strategies must be established to enhance the EIO performance. In a spatial sense, the appropriateness of the EIO is determined by whether it can provide suitable pressure. In a WDS, the pressure is influenced by the pumps, PRVs, and pipes, and it changes depending on the location and characteristics of these components. To improve the EIO performance, especially in the HIP failure scenario, the following strategies are proposed (see
Figure 1) and the performance was tested using A-PDA: install additional EIPs, PRVs, or pumps or increase the EIP diameter.
Table 2 summarizes a few design suggestions for each strategy; nonetheless, the design criteria of the water utility must be followed as different utilities and countries have their own design guidelines.
3.1. Install Additional EIP
Installing an additional EIP is the only way to solve the problem of the absence of a connection between two blocks. Additional EIPs should be installed at places where the elevation between the two blocks is similar and the distance between them is not too large (considering cost and energy effectiveness). If an EIP is installed at an inappropriate location, the supply performance may be degraded; therefore, a hydraulic analysis must be conducted to determine an appropriate location. The diameter of the additional EIP should be set similar to the diameter of the pipes adjacent to its inlet and outlet, and the pipe length should be set as the actual distance between the inlet and the outlet. Even if a connection is secured by adding an EIP, pressure problems may occur owing to elevation differences between the two blocks and the EIP specifications; therefore, another hydraulic analysis should be conducted to check the pressure during EIO.
3.2. Install Additional PRVs
In a WDS, high pressure causes problems such as leakage and pipe breakage, especially at loosened joints or in aged pipes. When performing EIO, if water is supplied from a high-elevation block to a low-elevation block, problems such as pipe breakage may occur. In this case, PRVs should be added to regulate the appropriate pressure in the affected block. The final pressure should be set to be similar to the pressure under normal operating conditions.
3.3. Increase EIP Diameter
When performing EIO, the entire demand of the isolation block is supplied through EIPs, resulting in excessive head loss. Further, if the EIP diameter is small or the EIP is not installed at an appropriate location, the problem of low pressure can occur. Because the head loss is inversely proportional to the pipe diameter (with power of about 5), the supply performance can be secured by increasing the pipe diameter. At the same time, the EIP diameter should not be made larger than the pipe diameter in the downstream block (block receiving water) to avoid minor loss (i.e., sudden contraction).
3.4. Install Additional Pump
One of the reasons for the low pressure is the elevation difference, that is, water is supplied from a low-elevation block to a high-elevation segment. In this case, increasing the diameter may not have a significant impact. In this case, the supply performance should be improved by adding a pump. The pump should be installed at a suitable location near the inlet or outlet of the EIP not to affect normal operating conditions (including water-hammer effect). However, when the maximum pressure is set to the discharge pressure (pressure at the downstream of pump), the problem of high pressure may occur; in this case, the discharge pressure should be set appropriately such that the block receiving water does not suffer from the water-hammer or excessive pressure.
4. Case Study
4.1. Study Network
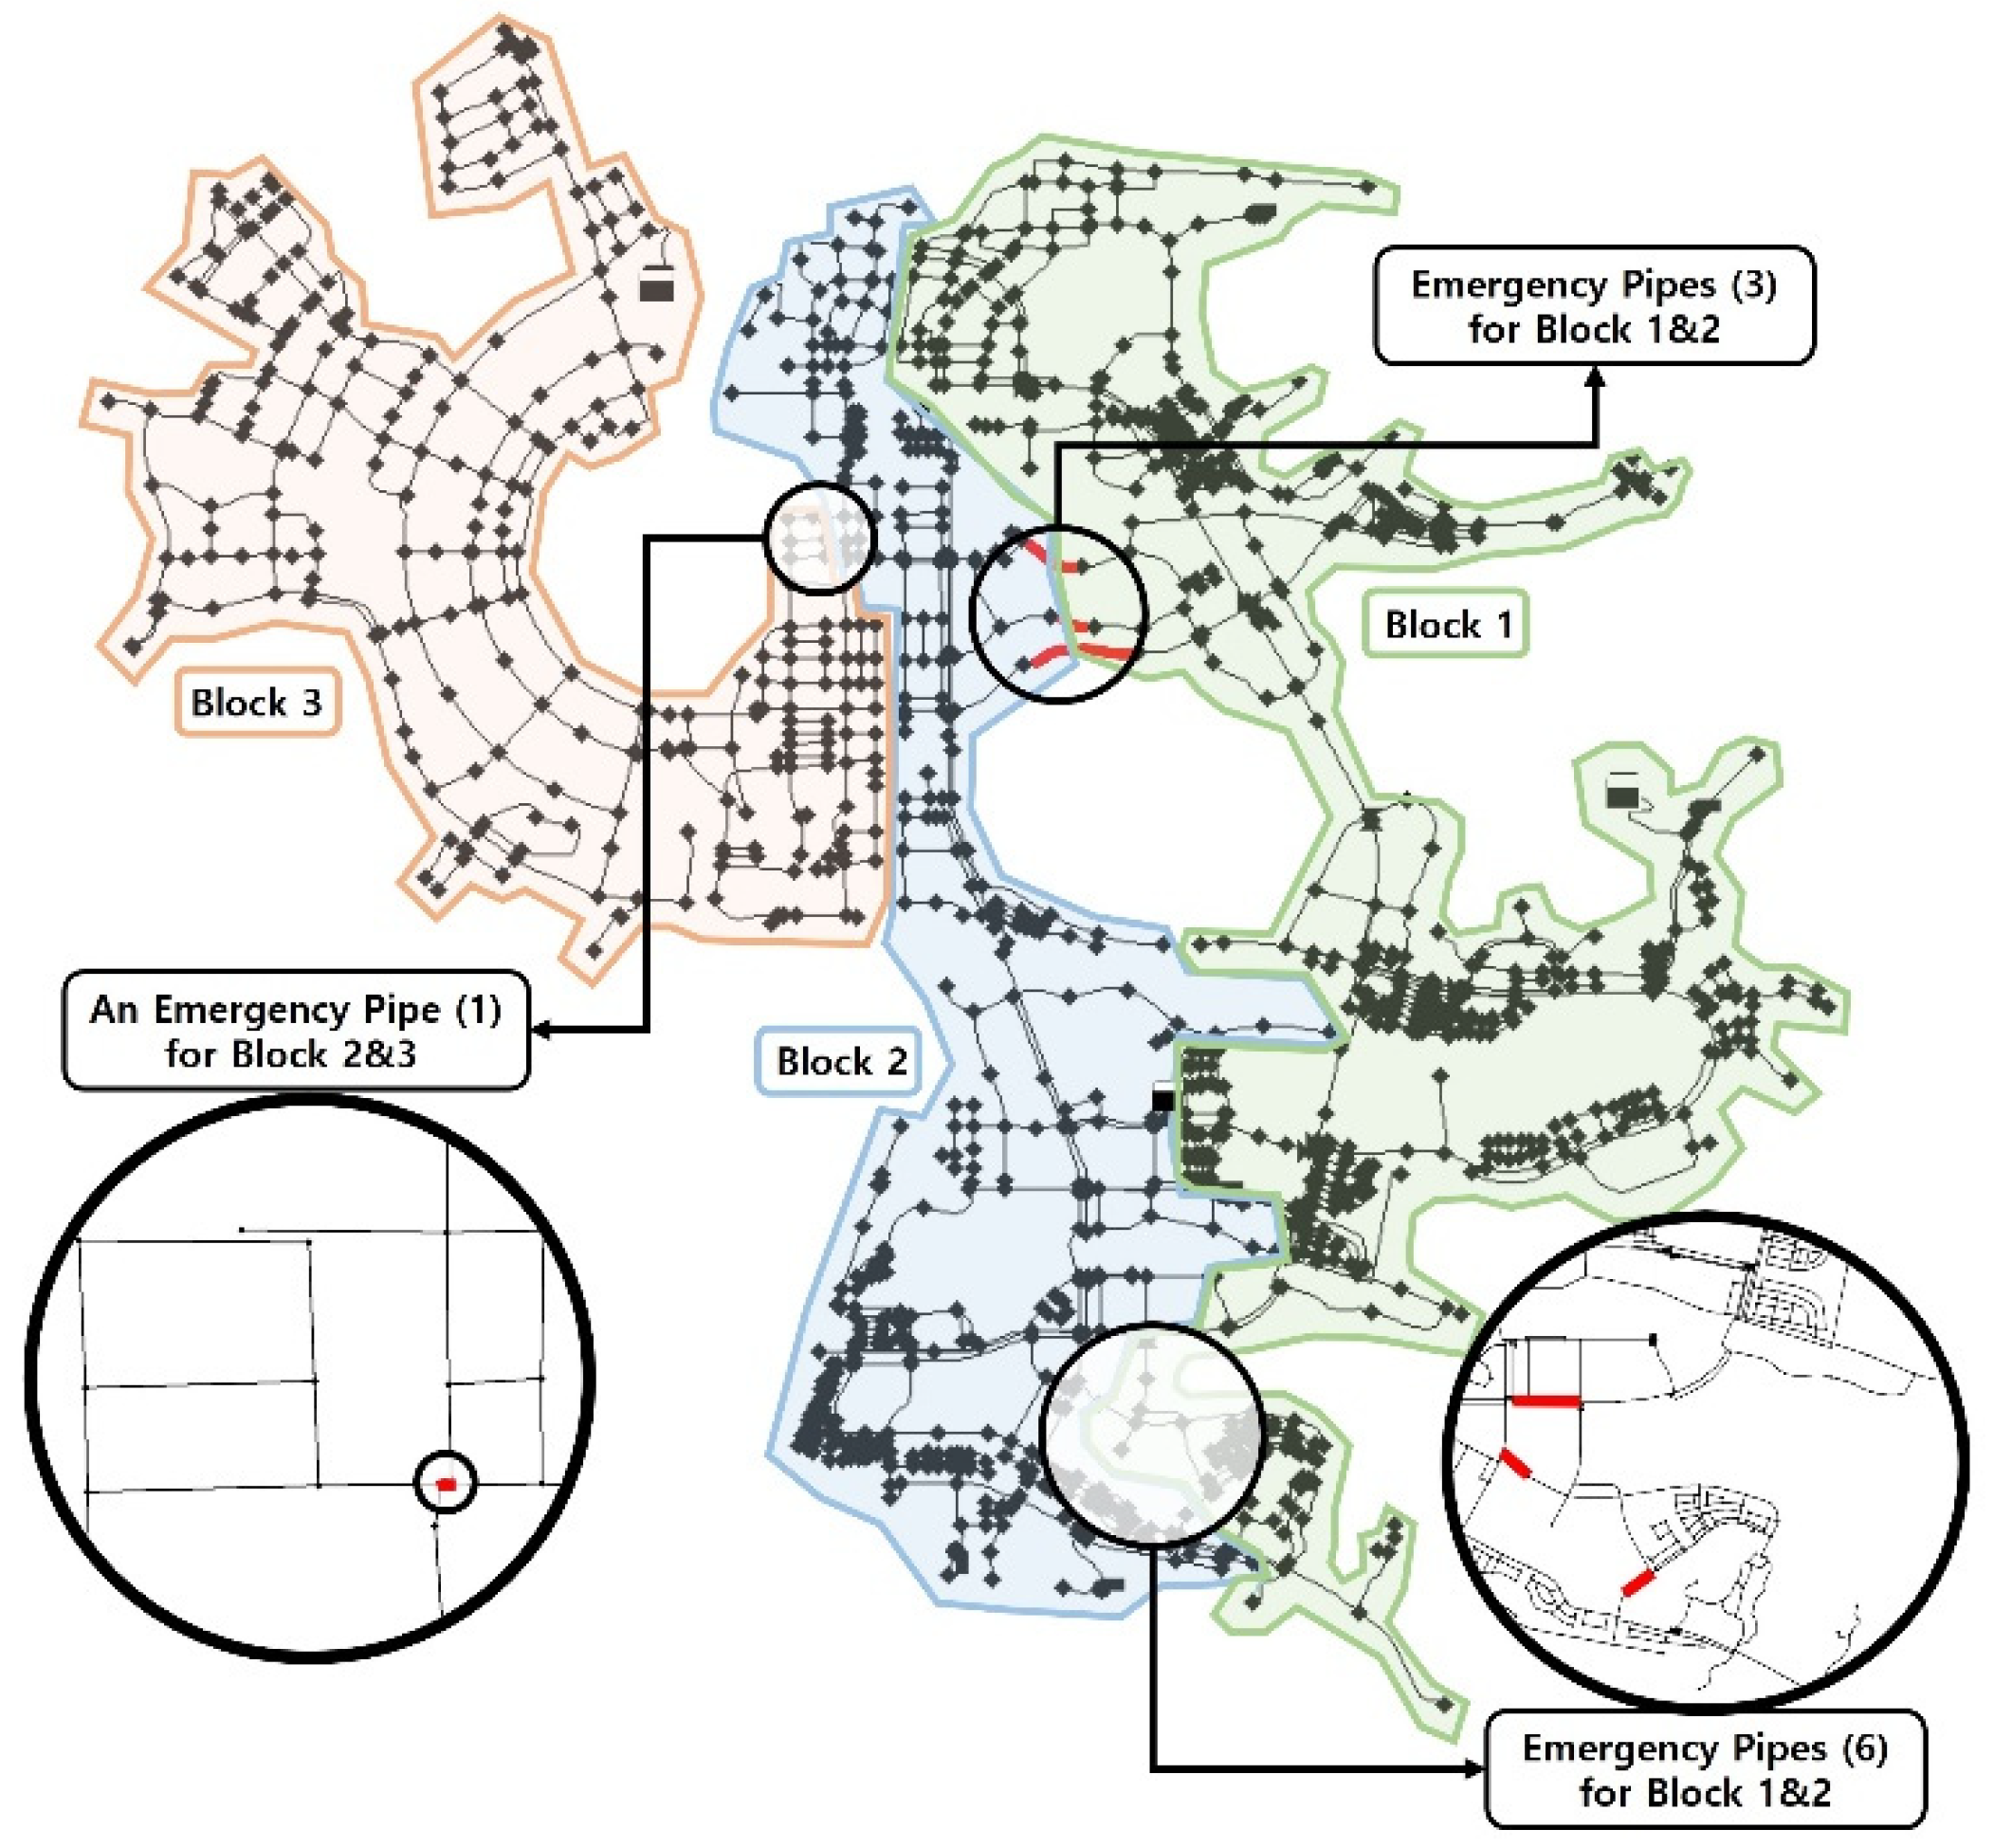
The aforementioned methodologies have been demonstrated with the real WDS which is a partial area of approximately 56.28 km
2 in A-city in South Korea (
Figure 2). The target WDS consists of 3 reservoirs, 1491 nodes, 1937 pipes, 8 pumps, and 8 PRVs. Each reservoir supplies one drainage block (i.e., Blocks 1, 2, and 3, as shown in
Figure 2), and water is supplied to approximately 290,000 consumers. The blocks are divided and connected by 10 EIPs. Block 1 is connected to Block 2 with three and six EIPs at the top and bottom, respectively, and Block 2 is connected to Block 3 by one EIP at the top.
Under abnormal conditions, water can be supplied during EIO through these 10 EIPs located between the blocks.
Table 3 shows the specifications of the reservoirs in the study network which are also used as inputs for the A-PDA model. As the elevation of Res1 is higher than that of the others, eight PRVs are installed to prevent pipe breakage owing to high pressure. Blocks 2 and 3 have relatively low elevation and mostly consist of flat terrain.
4.2. HIP Identification
The HIP was selected to identify critical segments where the EIO must be improved. For this purpose, a segment analysis was conducted on the operation status of A-City before EIO. The WDS was set up with the actual operating conditions of A-City, and all EIPs were not operated (i.e., they were kept closed).
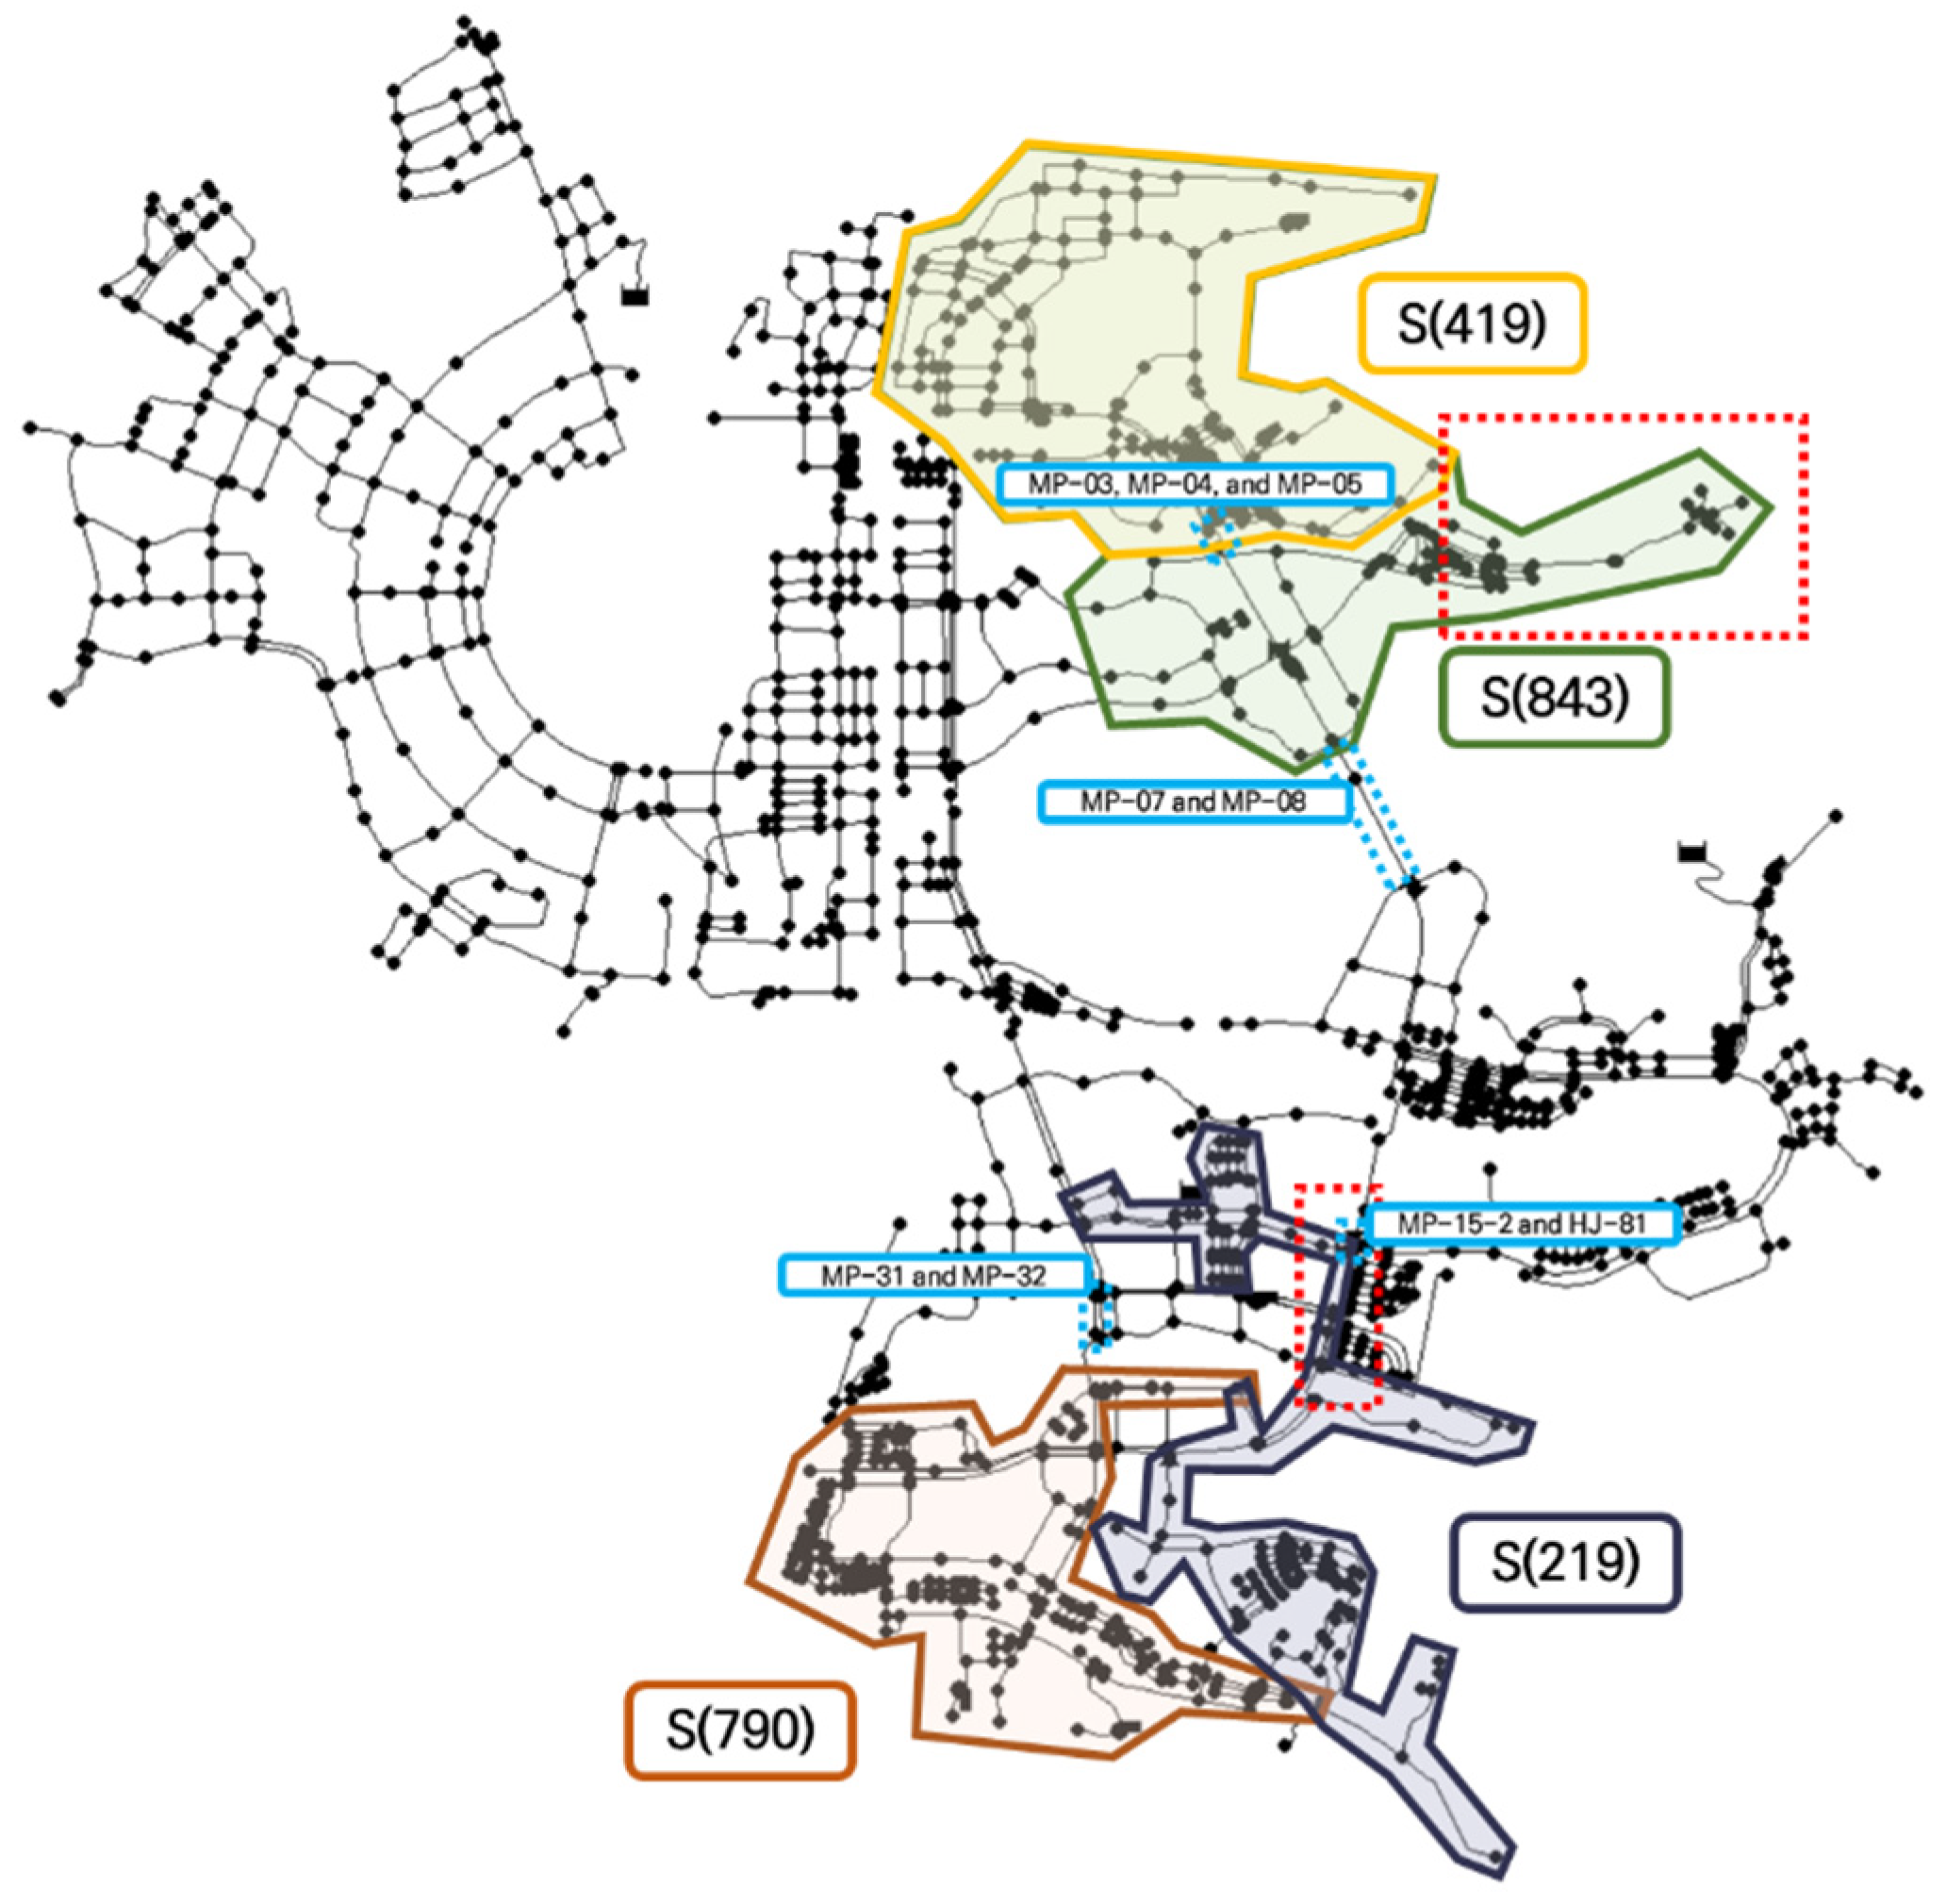
Figure 3 shows the HIP segments that generate large-scale damage (10% or more of the total demand of A-City).
Before EIO, segment S(843) had the highest water demand of 33,083.6 m3/d (17.66% of the total demand of A-city). It is isolated by two HIPs (MP-07 and MP-08), and three EIPs are connected to its upper part. During EIO, hydraulic analysis results indicate that these pipes can supply approximately 9575.6 m3/d of water to this segment (i.e., 28.9% of S(843) demand).
Segment S(790) has the second-highest demand of 22,448.4 m3/d (11.98% of the total demand of A-city). It is isolated by two pipes (MP-31 and MP-32), and six EIPs supply water from Block 1 to S(790). During EIO, 22,163 m3/d of water can be supplied (i.e., 98.7% of S(790) demand) as Block 1 is located at a higher elevation than S(790). Therefore, two pipes (MP-31 and MP-32) isolating this segment are not selected as HIPs; however, the segment has been considered as it has challenges of high-pressure.
Segment S(219) has a demand of 19,973.4 m3/d (10.66% of the total demand of A-City). It is isolated by two HIPs (MP-15-2 and HJ-81), and it is connected through six EIPs to the lower parts of Blocks 1 and 2. During EIO, 10,028.8 m3/d of water can be supplied (i.e., 50.2% of S(219) demand).
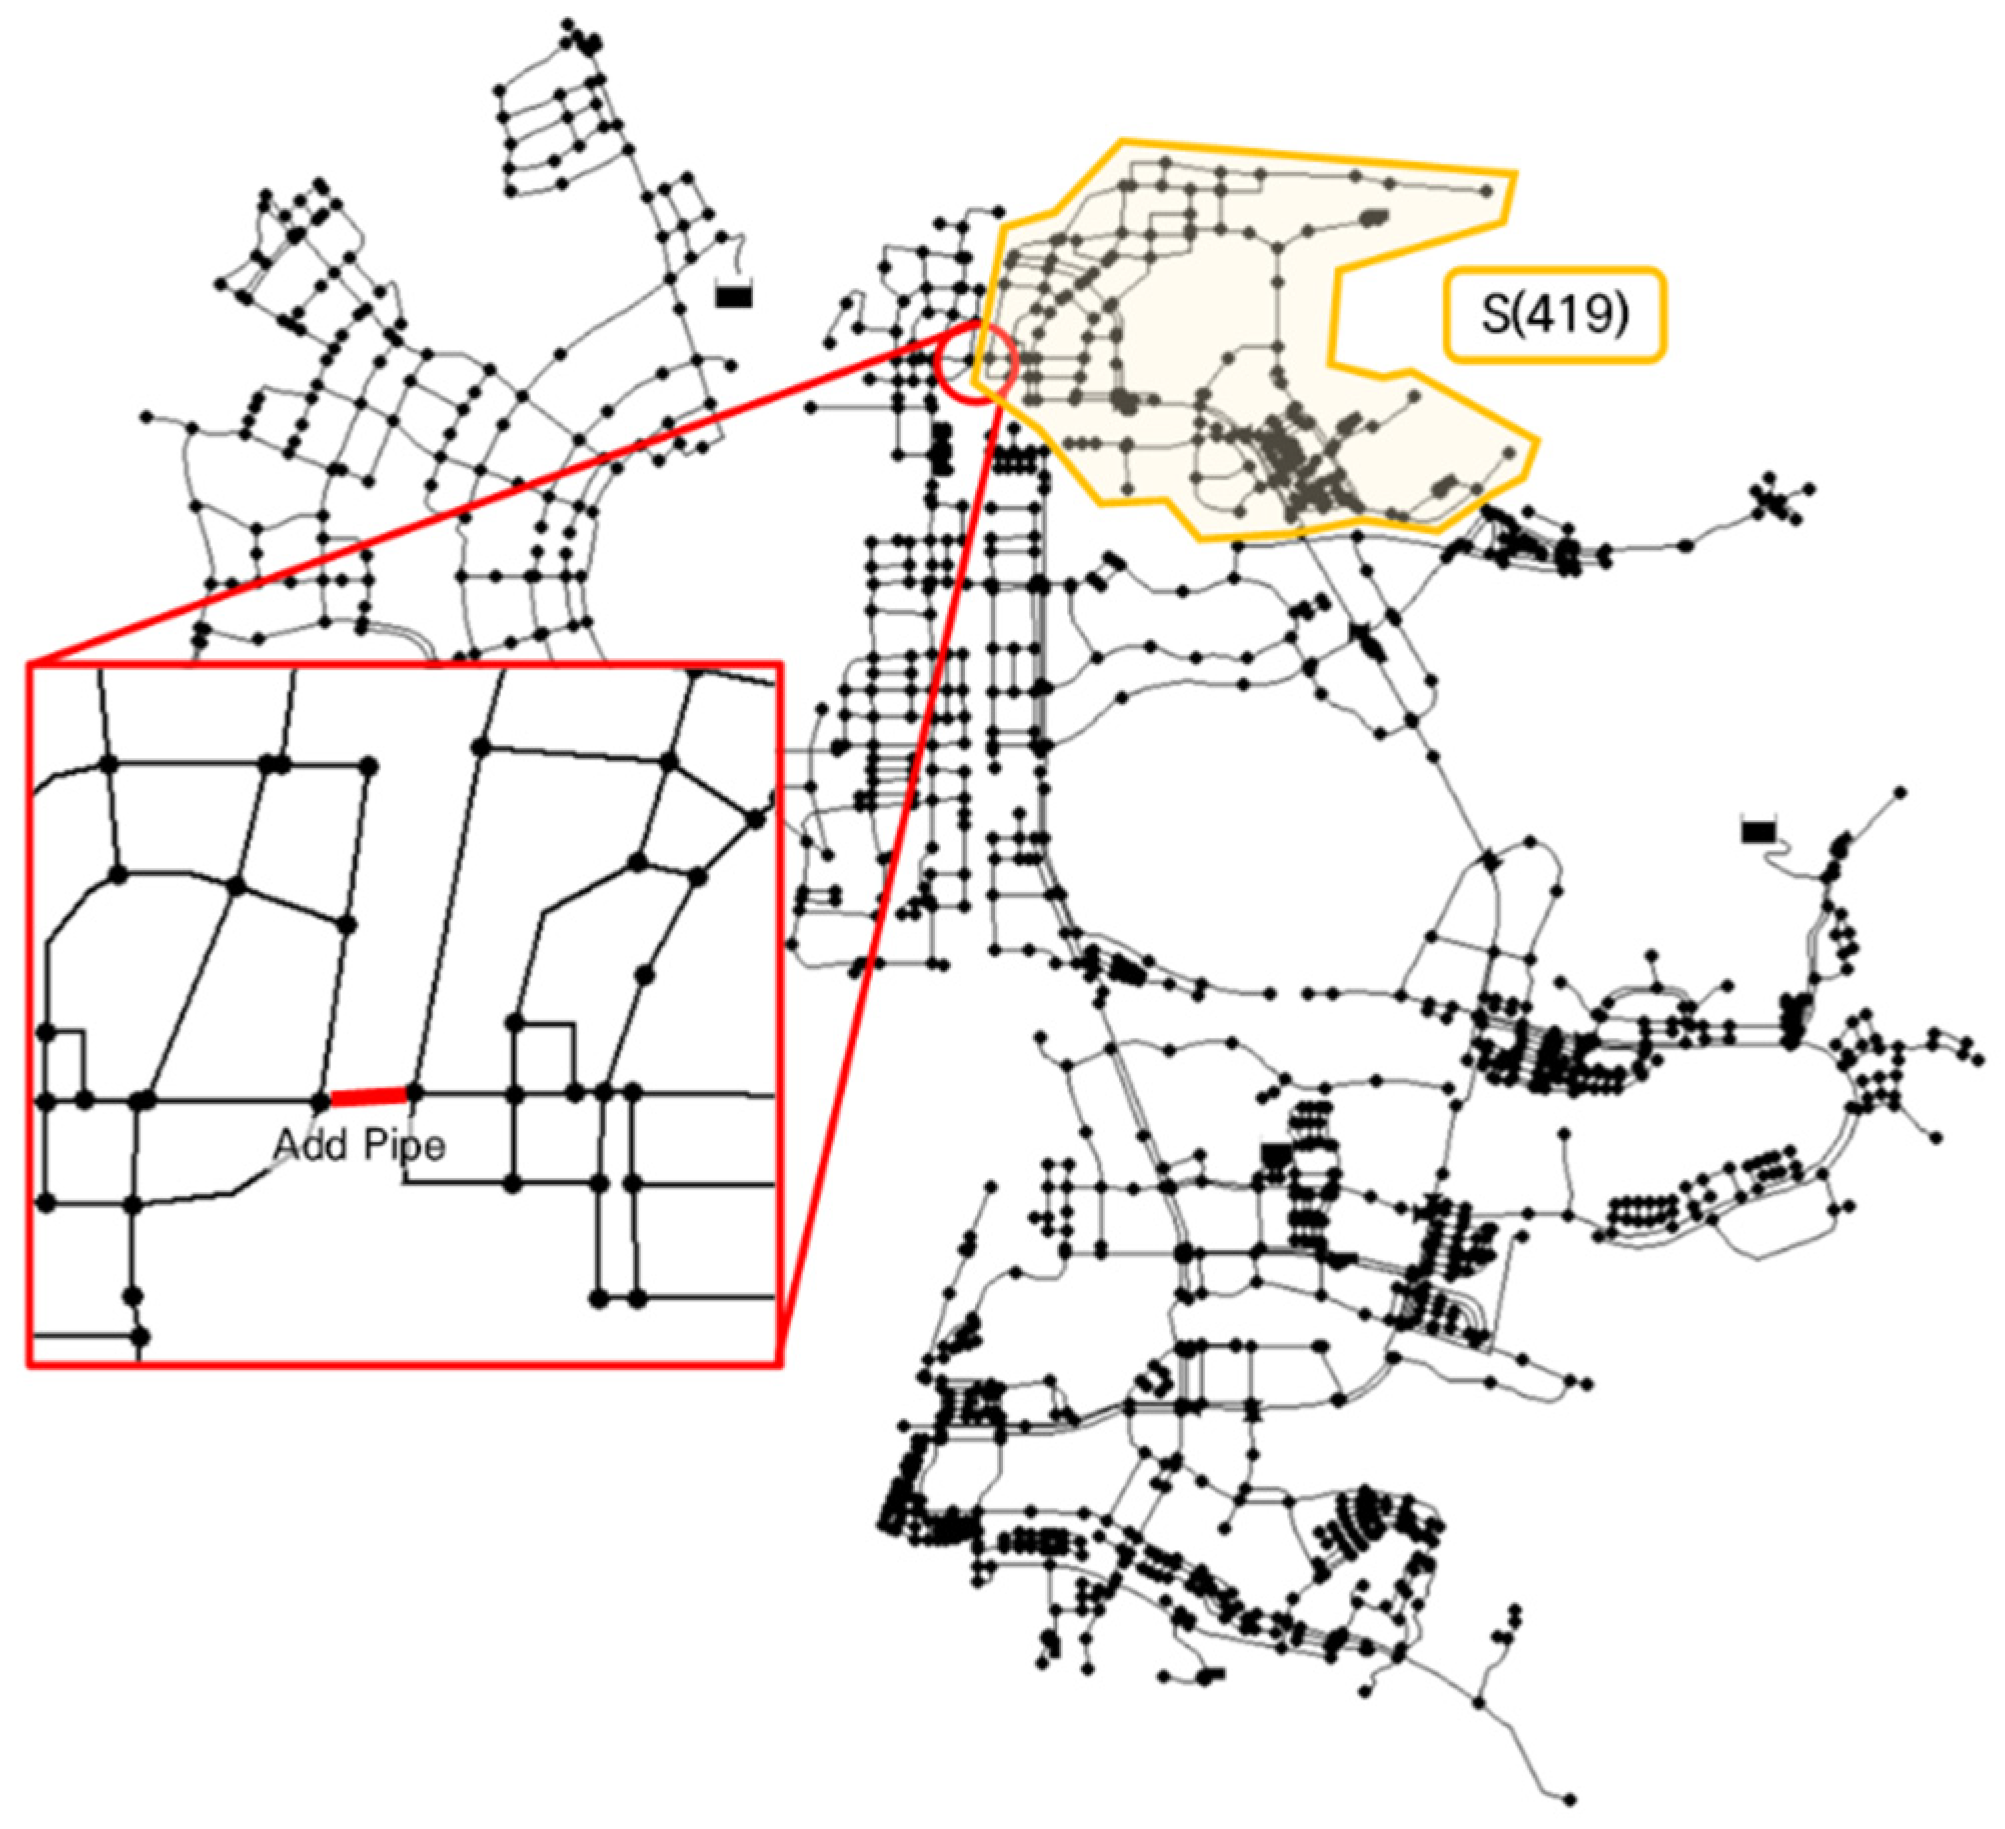
Segment S(419), a part of segment S(843), is located at the top of Block 1 and has a demand of 18,800 m3/d (10.04% of the total demand of A-City). It is isolated by three HIPs (MP-03, MP-04, and MP-05), but it does not have any EIPs at appropriate locations. Therefore, if the HIPs fail and EIO is needed, water cannot be supplied to this segment.
4.3. Scenario Descriptions
From the HIP selection, four critical segments were identified. Each segment had different key problems and therefore required different solutions.
Table 4 lists the strategies to improve EIO performance in each segment. As this study adopts A-PDA (limited reservoir condition), the head of the reservoir used for EIO will be decreased during EIO. If the reservoir used for EIO is unavailable to receive additional inflow to match increased supply due to EIO, then the reservoir will eventually be depleted (i.e., water level of the reservoir reaches zero). As the reservoir cannot operate adequately once it depletes (ASR of the blocks receiving water from the reservoir being zero), the simulation duration is set to the time until depletion of the reservoir used for EIO. Note that time of depletion was found by performing a long enough time until the water level of the reservoir reached zero for the first time.
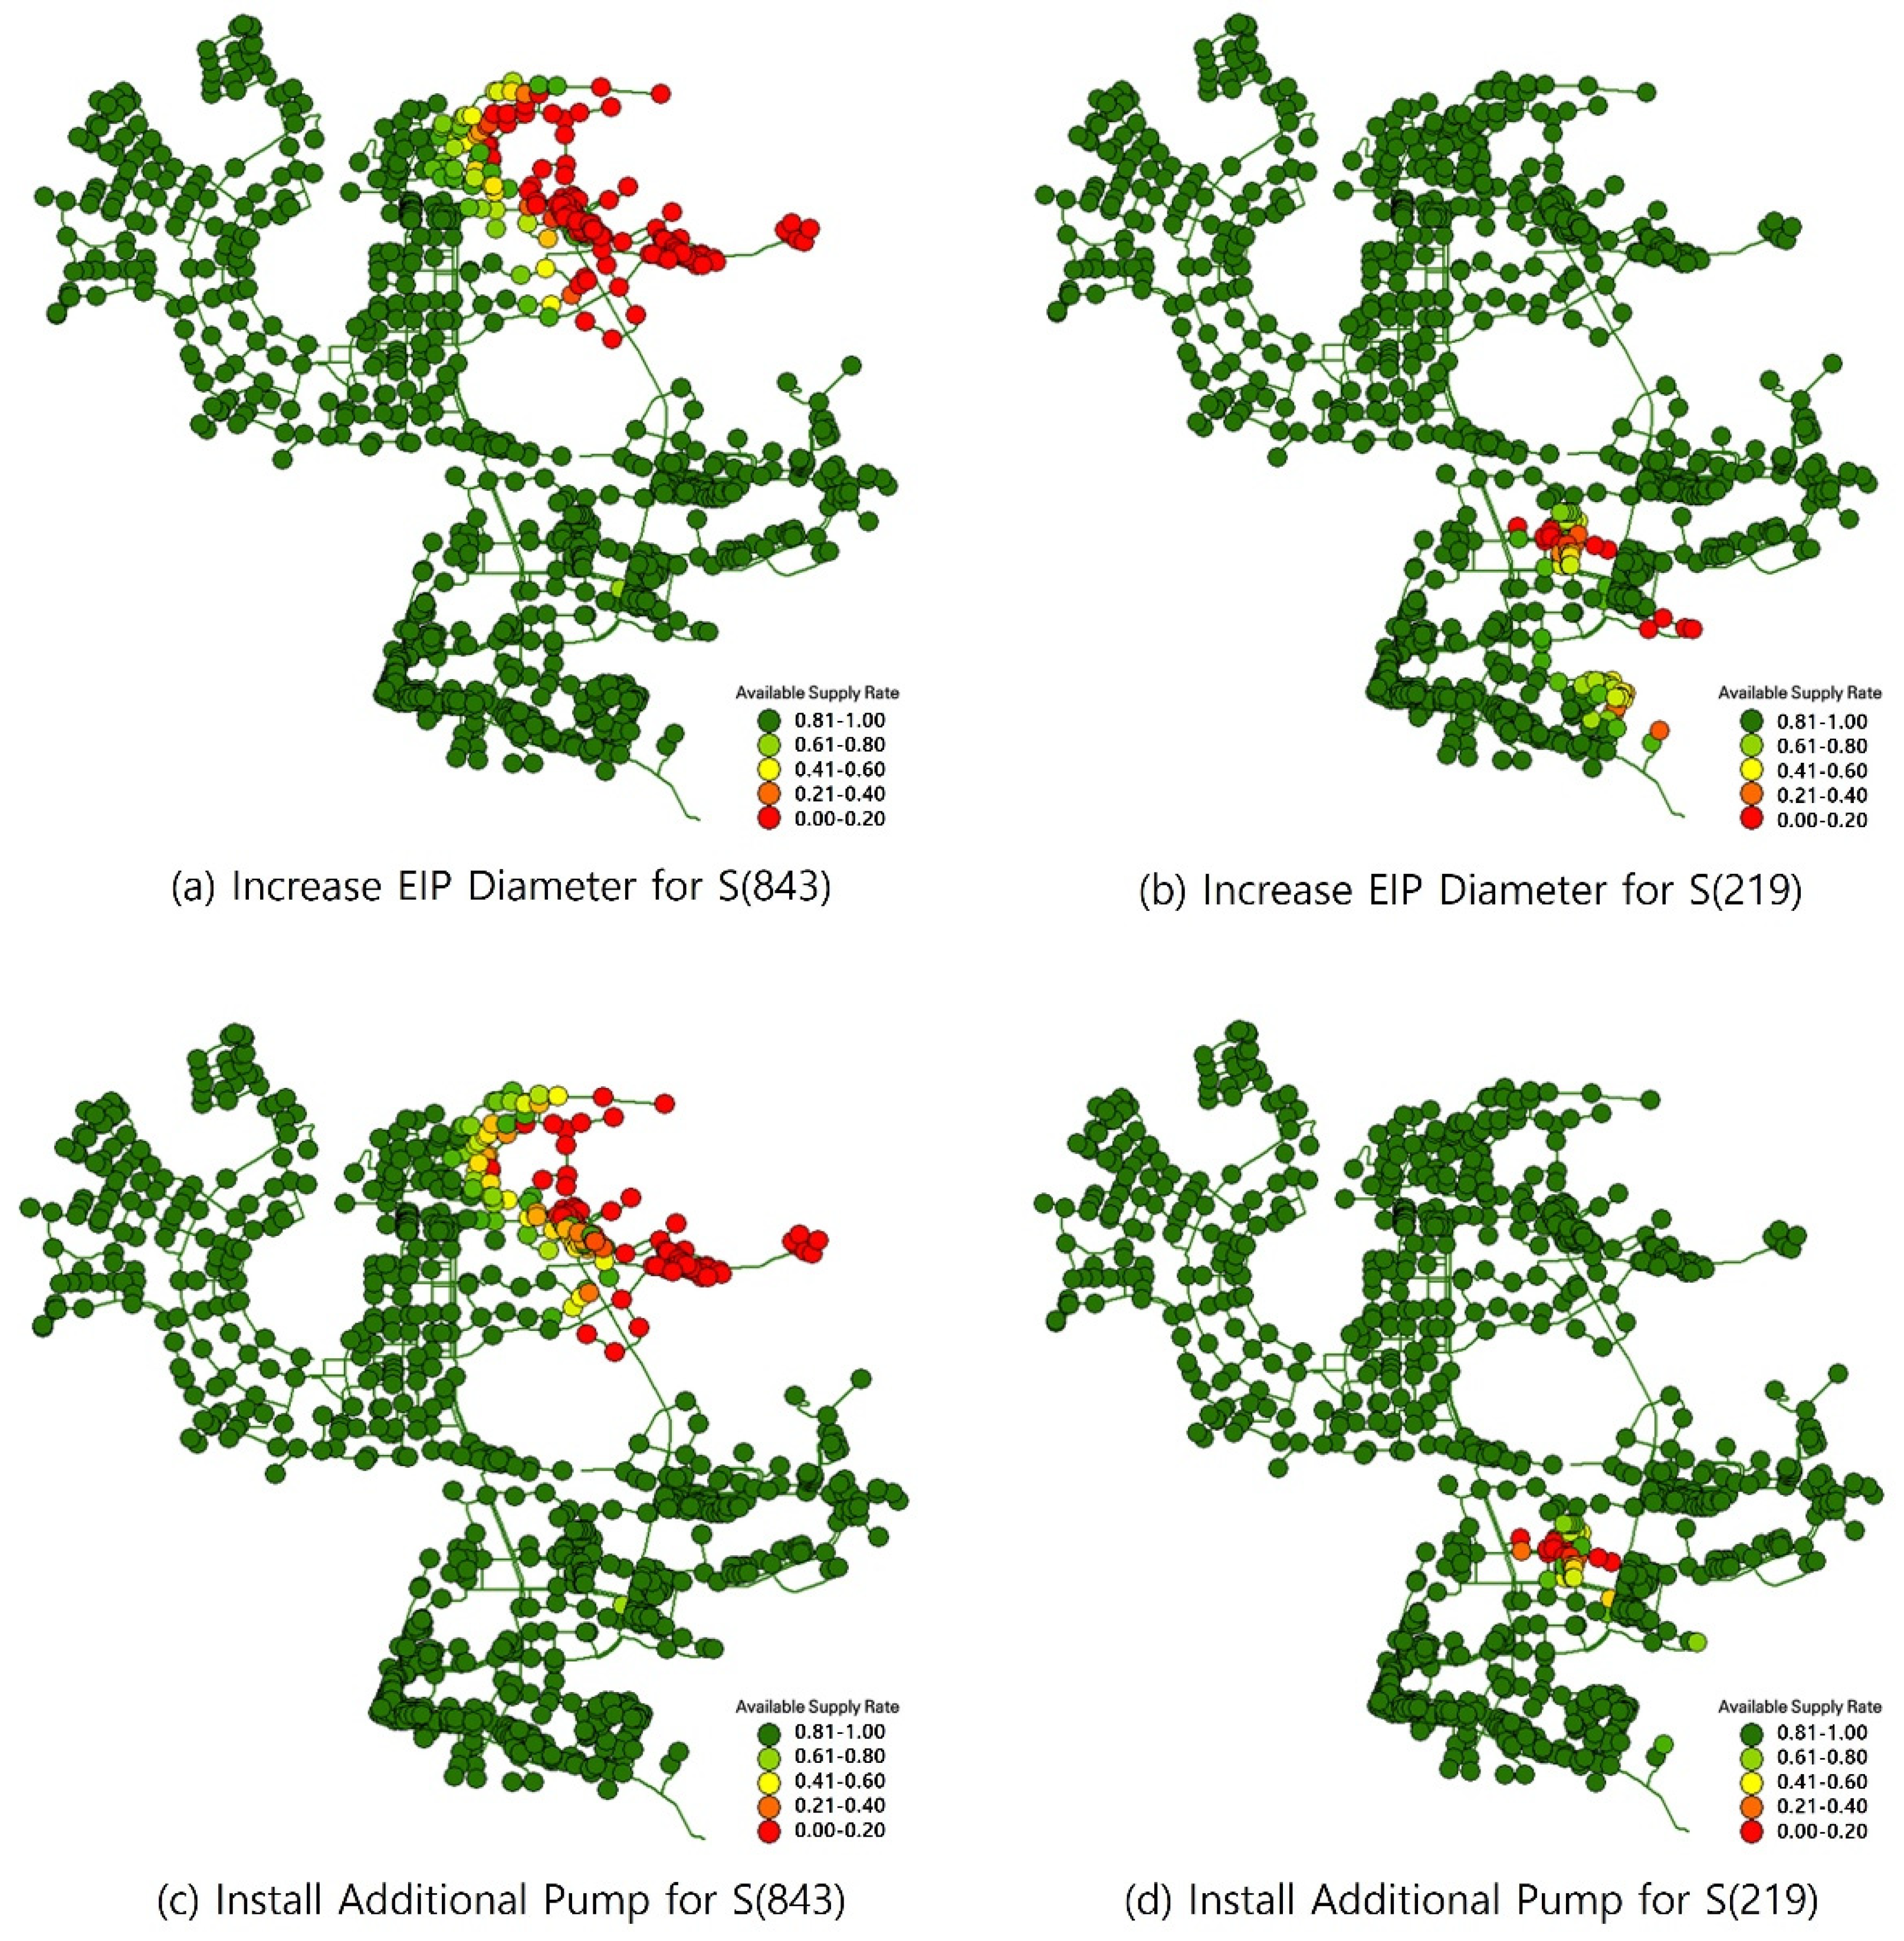
4.3.1. Scenario 1: Increase EIP Diameter
Scenario 1 considers segments S(843) and S(219) that have low pressure. To solve this problem, the EIP diameter was increased by 200 mm. Segment S(843) has three EIPs with similar characteristics and performance; therefore, the diameters of all three EIPs was increased. In contrast, segment S(219) has six EIPs with different locations and characteristics; therefore, the diameter of one EIP responsible for supplying 46.3% of total demand was increased.
4.3.2. Scenario 2: Install Additional Pump
Scenario 2 also considers segments S(843) and S(219) that suffer from low pressure; in this case, an additional pump was installed. Specifically, in segment S(843), the additional pump was installed at the inlet of a pipe that is responsible for 46.7% of the total supply, and the discharge pressure was assumed to be a maximum of 70 m following the maximum pipe pressure criteria announced by the Korean Ministry of Environment (KDS-57-65-00). Note that the end nodes of S(843) (upper right red rectangular area in
Figure 3) have a higher elevation than Res2, and therefore, the discharge pressure of the pumps is set to a maximum value. Further, in segment S(219), the additional pump was installed at the outlet of an EIP that is responsible for 46.3% of the total supply (same as Scenario 1), and the discharge pressure was assumed to be a maximum of 60 m. Unlike in the case of S(843), a lower discharge pressure has been set as only nodes in the middle area (lower red rectangular in
Figure 3) have a higher elevation than Res2, whereas the remaining nodes had a slightly lower elevation than that of Res2.
4.3.3. Scenario 3: Install Additional PRV
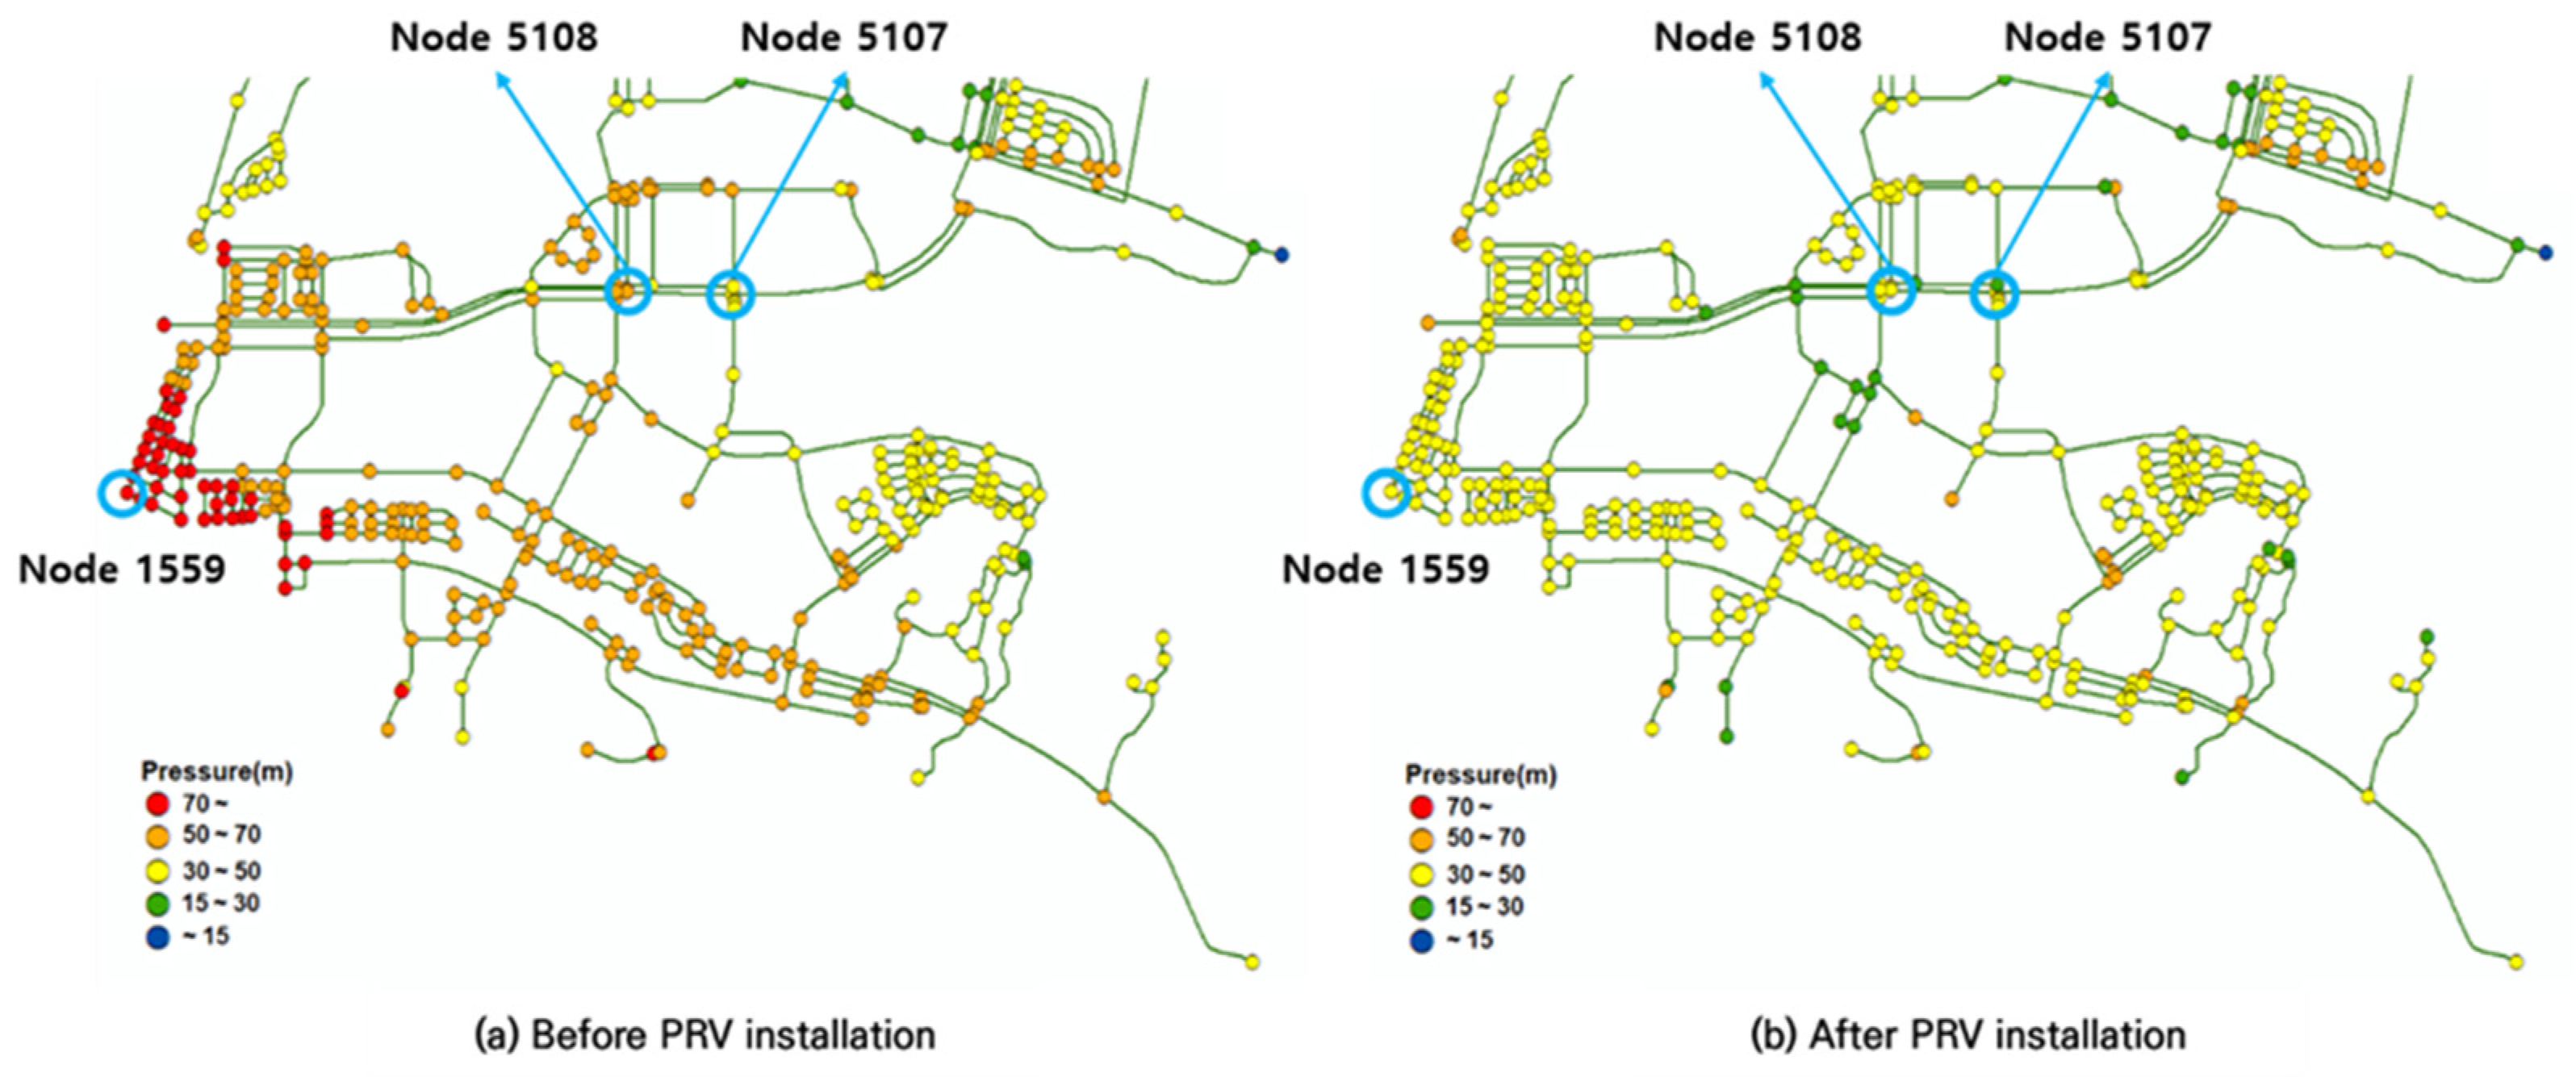
In general, EIO causes low-pressure problems; however, it may cause high-pressure problems when water is supplied from high-elevation blocks to low-elevation blocks. Scenario 3 considers segment S(790) that has a high-pressure problem. In this segment, the service interruption was 11.98% when it was isolated; however, EIO can reduce the impact by 98.7%. This segment received water from Block 1 that has a higher elevation, and its pressure was more than 50 m while that of the dead-ends was as high as 60 m. The maximum pressure suggested was 70 m. However, the pipe diameter and wall thickness were generally smaller in downstream of the WDS, and as a result, the probability of breakage owing to high pressure increased. To solve this problem, the pressure was controlled by installing a PRV at the EIP outlet. The pressure of the PRV was set to 30 m; this was similar to the pressure under normal operating conditions.
4.3.4. Scenario 4: Install Additional EIP
If no EIP is connected to a segment that suffers unintended isolation, EIO cannot be initiated, and the damage caused by isolation cannot be mitigated. Scenario 4 considers segment S(419) that experiences water service interruption of 10.04% but does not have any EIP. Therefore, an EIP was installed at an appropriate location to secure an additional water supply route. This EIP was assumed to have a diameter and length of 200 mm and 135 m, respectively, considering actual distance between the two points on the map and the diameter of connected pipes.
6. Conclusions
This study identified the causes of insufficient EIO performance, such as pressure-related problems and connection problems that were caused by elevation differences between blocks, specifications and locations of EIPs, and pumps. Further, it tested strategies to improve the EIO performance to mitigate the damage as much as possible, including increasing the EIP diameter or installing an additional pump to solve low-pressure problems, installing an additional PRV to solve high-pressure problems, and installing an additional EIP to solve connection problems.
Analyses were conducted for the WDS in A-City, South Korea. Four scenarios were considered: (1) increase EIP diameter, (2) install an additional pump, (3) install an additional PRV, and (4) install an additional EIP. Scenarios 1 and 2 focused on segments S(843) and S(219) that had low pressure during EIO. Increasing the EIP diameter did not result in a significant improvement, mainly owing to the elevation difference with the block supplying water to the segment. Installing an additional pump could improve the supply by 20–30% compared to that before installation. Scenario 3 focused on segment S(790) that had high pressure during EIO. Before installing a PRV, the pressure at the end of segment S(790) was 70.28 m. After installing the PRV, the pressure reduced to 48.89 m; further, the pressure throughout the segment remained between 30 and 50 m. Scenario 4 focused on segment S(419) that lacked an EIP to perform EIO. Installing an EIP helped to improve the supply performance; however, the elevation difference remained, and therefore, the ASR was not significantly improved.
The proposed strategies should contribute to the allocation of facilities such as EIPs, pumps, and PRVs for realizing effective EIO. However, as each strategy improves the supply performance differently, a proper, fully calibrated hydraulic model should be used to investigate the appropriateness and cost-effectiveness of each alternative. In addition, some strategies may have a synergistic effect when applied together, making it necessary to review a combination of strategies during the design stage. Lastly, this study did not consider the cost for each EIO strategy. To obtain realistic results, the costs associated with each decision should be taken into account.
In the future, the improvement in supply performance with a combination of strategies must be analyzed to determine appropriate EIO plans that satisfy supply and usability requirements in case of an emergency. In addition, optimization techniques can be utilized to determine detail sizing or designing specifics of each EIO strategies.


