Article

Estimation of Groundwater Recharge in Kumamoto Area, Japan in 2016 by Mapping Land Cover Using GIS Data and SPOT 6/7 Satellite Images

1
Liberal Arts Education Center, Kumamoto Campus, Tokai University, 9-1-1 Toroku, Higashi-ku, Kumamoto 862-8652, Japan
2
Department of Electrical Engineering and Computer Science, Faculty of Industrial and Welfare Engineering, Tokai University, 9-1-1 Toroku, Higashi-ku, Kumamoto 862-8652, Japan
*
Author to whom correspondence should be addressed.
Sustainability 2022, 14(1), 545; https://doi.org/10.3390/su14010545
Submission received: 20 September 2021 / Revised: 22 December 2021 / Accepted: 28 December 2021 / Published: 4 January 2022

Abstract

:
Agricultural fields, grasslands, and forests are very important areas for groundwater recharge. However, these types of land cover in the Kumamoto area, Japan, were damaged by the Kumamoto earthquake and heavy rains in 2016. In this region, where groundwater provides almost 100% of the domestic water supply for a population of about 1 million, quantitative evaluation of changes in groundwater recharge due to land cover changes induced by natural disasters is important for the sustainable use of groundwater in the future. The objective of this study was to create a land cover map and estimate the groundwater recharge in 2016. Geographic information system (GIS) data and SPOT 6/7 satellite images were used to classify the Kumamoto area into nine categories. The maximum likelihood classifier of supervised classification was applied in ENVI 5.6. Eventually, the map was cleaned up with a 21 × 21 kernel filter, which is larger than the common size of 3 × 3. The created land cover map showed good performance of the larger filter size and sufficient validity, with overall accuracy of 91.7% and a kappa coefficient of 0.88. The estimated total groundwater recharge amount reached 757.56 million m3. However, if areas of paddy field, grassland, and forest had not been reduced due to the natural disasters, it is estimated that the total groundwater recharge amount would have been 759.86 million m3, meaning a decrease of 2.30 million m3 in total. The decrease of 2.13 million m3 in the paddy fields is temporary, because the paddy fields and irrigation channels have been improved and the recharge amount will recover. On the other hand, since the topsoil on the landslide scars will not recover easily in natural conditions, it is expected to take at least 100 years for the groundwater recharge to return to its original state. The recharge amount was estimated to decrease by 0.17 million m3 due to landslides. This amount is quite small compared to the total recharge amount. However, since the reduced recharge amount accounts for the annual water consumption for 1362 people, and 12.1% of the recharge decrease of 1.41 million m3 each year to fiscal year 2024 is expected by municipalities, we conclude that efforts should be made to compensate for the reduced amount due to the disasters.

1. Introduction

Groundwater in the Kumamoto area, Japan, which has a population of about 1 million, is an extremely important water resource for the region because it accounts for almost 100% of domestic water use. Therefore, a number of activities and studies have been carried out from the viewpoint of both the quantity and quality of groundwater. For example, a groundwater condition report was conducted from these two perspectives for 3 years, starting in 1992, by the Kumamoto prefecture and Kumamoto city [1]. They predicted decreases in the groundwater level and spring water volume due to a decreased recharge area and increased groundwater extraction and found the existence of areas where pollutants could easily spread. In terms of quantity, groundwater levels have been continuously recorded at 123 sites in the Kumamoto area, the earliest in 1976 [2]. At Ezu Lake, which is formed by springs, the volume of spring water has been observed every month since December 1991 [3]. In a last few decades, the groundwater recharge amount decreased with the reduction of paddy field areas, due to the Japanese government’s rice production adjustment policy and urbanization [4]. In response to this situation, an artificial groundwater recharge project in paddy and plowed fields during the fallow period was initiated in the mid-stream area of the Shirakawa River in 2004. This project has contributed greatly to the recovery of groundwater level and spring volume in recent years [4].
In order to enhance groundwater recharge, municipalities are promoting the installation of rainwater seepage pits, for example, in houses and greenhouses, through subsidies [5]. In 2012, Kumamoto became the first prefecture in Japan to introduce regulations on extraction (pumping permission system) for the sustainable use of groundwater, even though the area has not experienced any particular groundwater disasters such as land subsidence or salinization [6]. In terms of water quality, fluorine and nitrate– and nitrite–nitrogen concentrations that exceed Japanese drinking water standards (F: 0.8 mg/L; NO3+NO2-N: 10 mg/L) have been reported [7]. Fluorine is generated naturally and is considered to have been leached during the process of groundwater flow in the igneous rock strata [7], while the geographical information system (GIS) technique using agricultural census data and nitrate isotopic measurements revealed that chemical and organic fertilizers and domestic animal wastes are mainly related to nitrate pollution [8,9,10].
In recent years, groundwater has suffered various impacts due to the Kumamoto earthquake in 2016. For example, abnormal changes in groundwater levels were observed after the earthquake, which were attributed to water transfer downward through newly generated open cracks (called the Suizenji fault) [11] and mountain water release due to enhanced permeability [12,13]. These factors altered not only the groundwater level but also the groundwater flow system [14,15,16]. As a result, changes in groundwater chemistry occurred, such as decreasing concentrations of common ions (Cl, F, Na+, K+, Ca2+) and NO3+NO2-N in specific locations [17,18]. In terms of water quality, there is also a report of pollution due to sewer exfiltration from sewage pipes broken by the earthquake [19]. The earthquake also caused significant damage to groundwater recharge areas. In paddy fields, which are highly important as recharge areas, liquefaction, cracking, and sinking occurred. In some areas, irrigation canals were damaged, making it impossible to supply water. Under these circumstances, farmers were forced to shift their paddy crops to field crops such as soybeans [20], or agricultural activities were interrupted. Nishihara Town and Mashiki Village, which are located in the southeastern part of the Kumamoto area and lie on the fault, experienced many large and small landslides in the forests and grasslands due to the earthquake and the heavy rains three months later [21]. As the number of paddy fields with large recharge capacity decreases, the amount of groundwater recharge will decrease. Further, since the infiltration capacity of bare land is much lower than that of forest and grassland, land cover changes due to landslides will also reduce groundwater recharge.
The assessment of the groundwater recharge amount in the Kumamoto area has been conducted by an administrative organization, and two reports [1,5] have been compiled. In recent years, in order to concretely promote the Comprehensive Conservation and Management Plan for Groundwater in Kumamoto Area (fiscal year (FY) 2009 to FY 2024) formulated in FY 2008 [5], the First Action Plan (FY 2009 to FY 2013), Second Action Plan (FY 2014 to FY 2018), and Third Action Plan (FY 2019 to FY 2024) have been formulated, and groundwater conservation measures have been promoted [22]. The impact of the Kumamoto earthquake on groundwater recharge is reported in the Third Action Plan [22], but it is limited to the impact on artificial recharge projects in the fallow land mentioned earlier. Therefore, the main objective of this study is to evaluate the effect on groundwater recharge due to landslides and decreased paddy fields for sustainable groundwater use in the Kumamoto area.
In order to consider the water resource management, GIS has been applied in many studies. For example, Fauzia et al. [23] not only estimated groundwater recharge potential based on GIS model, but also mapped a potential groundwater recharge zone. Ahirwar et al. [24] developed an action plan for artificial groundwater recharge by using an integrated approach of remote sensing and GIS and visualized a proposed artificial recharge area. Batarseh et al. [25] created a GIS zoning map representing the spatial distribution of the irrigation water quality index and providing a clear visualization of groundwater quality. In these studies, the role of GIS is to provide large scale spatial data and/or make the results into understandable maps for water resource management. In this study, the GIS data of land cover is required to estimate groundwater recharge. However, the damaged paddy fields are only arranged as statistical data, and there is no map to show their locations. Since the water requirement rate of paddy fields varies greatly from place to place [26], locating fields that cannot be used as paddy fields is important for a better assessment of the change in recharge amount. Liu et al. [27] detected the landslides caused by the 2016 Kumamoto Earthquake in Mashiki Town and Nishihara Village using two sets of airborne Lidar data. That study focused on landslides caused by the earthquake and did not include those caused by the heavy rainfall in 2016 after the earthquake. Although the Geospatial Information Authority of Japan has created a distribution map of landslides, including those after heavy rains by interpreting the aerial photographs [21], they do not show area data, but point data. Specifically, a land cover map showing the damage caused by natural disasters for the entire Kumamoto area in 2016 has not been created. Thus, we need to create a land cover map representing natural disaster damage in order to estimate groundwater recharge. The locations and areas of land covers with different groundwater recharge capacities are important for an accurate estimation.
Satellite images are useful for land cover/use classification and change extraction, and have been used in many studies (e.g., [28,29,30,31,32,33,34,35,36,37,38,39,40,41,42,43,44,45]) from several years ago to the present. Some of these studies combined geographic information system (GIS) and satellite images [41]. By integrating the normalized difference vegetation index (NDVI) based on satellite images and GIS, we have also demonstrated that the classification accuracy can be improved [46]. Although many kinds of methods for land cover classification have been used in recent years, supervised classification based on maximum likelihood classification (MLC), which is pixel based, classifying images based on the homogeneity of pixel spectral information [43], has generally been used because of its ease in application, simple operation, and good performance [44]. Therefore, this method is often used, including in the last few years (e.g., [36,37,41,42,45]). Duan et al. [39] analyzed the characteristics of each land cover type before classification, and effectively used the supervised classification method and others, such as band ratio and decision tree methods, according to each characteristic. Eventually, in order to eliminate noise from the classification results, a kernel filter was applied in some studies [41,43]. Based on these studies, in order to create a land cover map in this study, we used supervised classification and GIS data according to the characteristics of land cover in the Kumamoto area for better classification. Then, the classification results were cleaned up by using a kernel filter. While a 3 × 3 kernel filter is the most widely applied, larger sizes are appropriate for smaller pixel sizes and/or larger land cover entities [47]. Therefore, in order to take into account an appropriate filter size, in addition to the common size, we examined the quantitative effect of larger filter sizes on the classification results and applied the better filter size.
By quantifying the change of groundwater recharge amount induced by natural disasters, we expect to gain basic and useful data in order to consider various artificial recharge measures to be implemented for sustainable groundwater use. Then, our quantitative analysis of the effects of the various kernel filter sizes will help to verify the necessity of testing larger filter sizes to determine the validity of land cover maps.
The remainder of this paper is organized into the following sections: Related work, Materials and methods, Results, Discussion, and Conclusions.

2. Related Work

The Kumamoto area is located in the northern part of the Kumamoto Prefecture, Japan (Figure 1a). It consists of 16 former municipalities, with an area of about 1041 km2. The mean annual temperature and precipitation during 1980–2010 were 16.9 °C and 1986 mm, respectively [48]. Precipitation in June and July, the rainy season, accounts for approximately 40% of annual precipitation [48]. At present, due to the consolidation of municipalities, the municipal boundaries have become as shown in Figure 1b. Quantification of groundwater recharge in 2016 in the area, which shares a large groundwater basin, was performed, as shown in Figure 1a. However, the target area for land cover classification needed to be the region shown in Figure 1b. This is because in this study, the statistical data of paddy field areas was used to determine the size of the kernel filter for smoothing of the classification results (described later), but in 2016, that statistical data was arranged by municipality, as shown in Figure 1b rather than Figure 1a.
The descriptions of groundwater and water circulation in the Kumamoto area were explained in the Comprehensive Conservation and Management Plan for Groundwater in Kumamoto Area [5] as follows. Three factors contribute to the abundance of groundwater in this area: (1) the large groundwater basin covering about 600 km2 from Aso caldera to the lowland area of Kumamoto plain, (2) the presence of strata that are easy to infiltrate and store groundwater for the groundwater basin, and (3) abundant precipitation. According to this plan [5], the water budget in the area was estimated, based on the data of the past 10 years, as follows: the Kumamoto area receives nearly 2.04 billion m3 of rain annually; of this abundant precipitation, about 700 million m3 is returned to the atmosphere through evapotranspiration. About 640 million m3 is recharged as groundwater in recharge areas (forests, grasslands, paddy fields, and plowed fields), where water can easily infiltrate. The remaining 700 million m3 is discharged into rivers such as the Shirakawa and Midorikawa Rivers, and then into the Ariake Sea.
According to the Comprehensive Conservation and Management Plan [5], by FY 2024, the annual groundwater recharge amount was projected to decline to 563.2 million m3. However, the Third Action Plan [22] reported that the average estimated groundwater recharge amount from FY 2009 to FY 2017 was 557.9 million m3, which is already less than the estimated amount for FY 2024. With a revision of the decreasing trend, the forecast shows that groundwater recharge will decrease to 548.0 million m3 in FY 2024 [22]. This is a decrease of 9.9 million m3 from the average amount from FY 2009 to FY 2017. In other words, it is 15.2 million m3 less than the previous forecast [5].

3. Materials and Methods

3.1. Satellite Image Data

This study used satellite images taken by Satellite Pour l’Observation de la Terre (SPOT 6/7), which is characterized by high-resolution 1.5 m panchromatic images and 6 m multispectral images. SPOT 6/7 were launched on 9 September 2012 and 30 June 2014, respectively. These satellites are operated by Airbus Defence and Space in France as fully commercial satellites. The multispectral wavelengths are as follows: 0.455–0.525 μm for blue, 0.530–0.590 μm for green, 0.625–0.695 μm for red, and 0.760–0.890 μm for near infrared. In this study, since we selected SPOT 6/7 satellite images with cloud cover of less than 10% in 2015 and 2016, only four images, from 2 May 2015, and 21 March, 29 July, and 2 November 2016, were acquired. In other words, there are very few opportunities to obtain satellite images of the Kumamoto area with few clouds. Although that may seem to be a low number of images to account for seasonal variability, as mentioned later, the NDVI of the training area used for supervised classification shows different seasonal characteristics for each land cover in used satellite images. Namely, even if the number of satellite images is low, they adequately captured different seasonal variabilities for each land cover type in the study area. Satellite images of 2 May 2015, and 29 July 2016, were used to identify the landslide area. Satellite images from 2016 were used for supervised classification. All images were corrected by using Quick Atmospheric Correction in ENVI 5.6 (Harris Geospatial Solutions, Inc., America) before classification processing.

3.2. Land Cover Map Creation

In this study, the area of 11 municipalities (Figure 1b) was classified into 9 categories: (1) paddy field, (2) plowed field, (3) damaged paddy field, (4) grassland, (5) lawn (golf course and park) and weeds, (6) forest (trees), (7) buildings and roads, (8) bare land, and (9) water body.
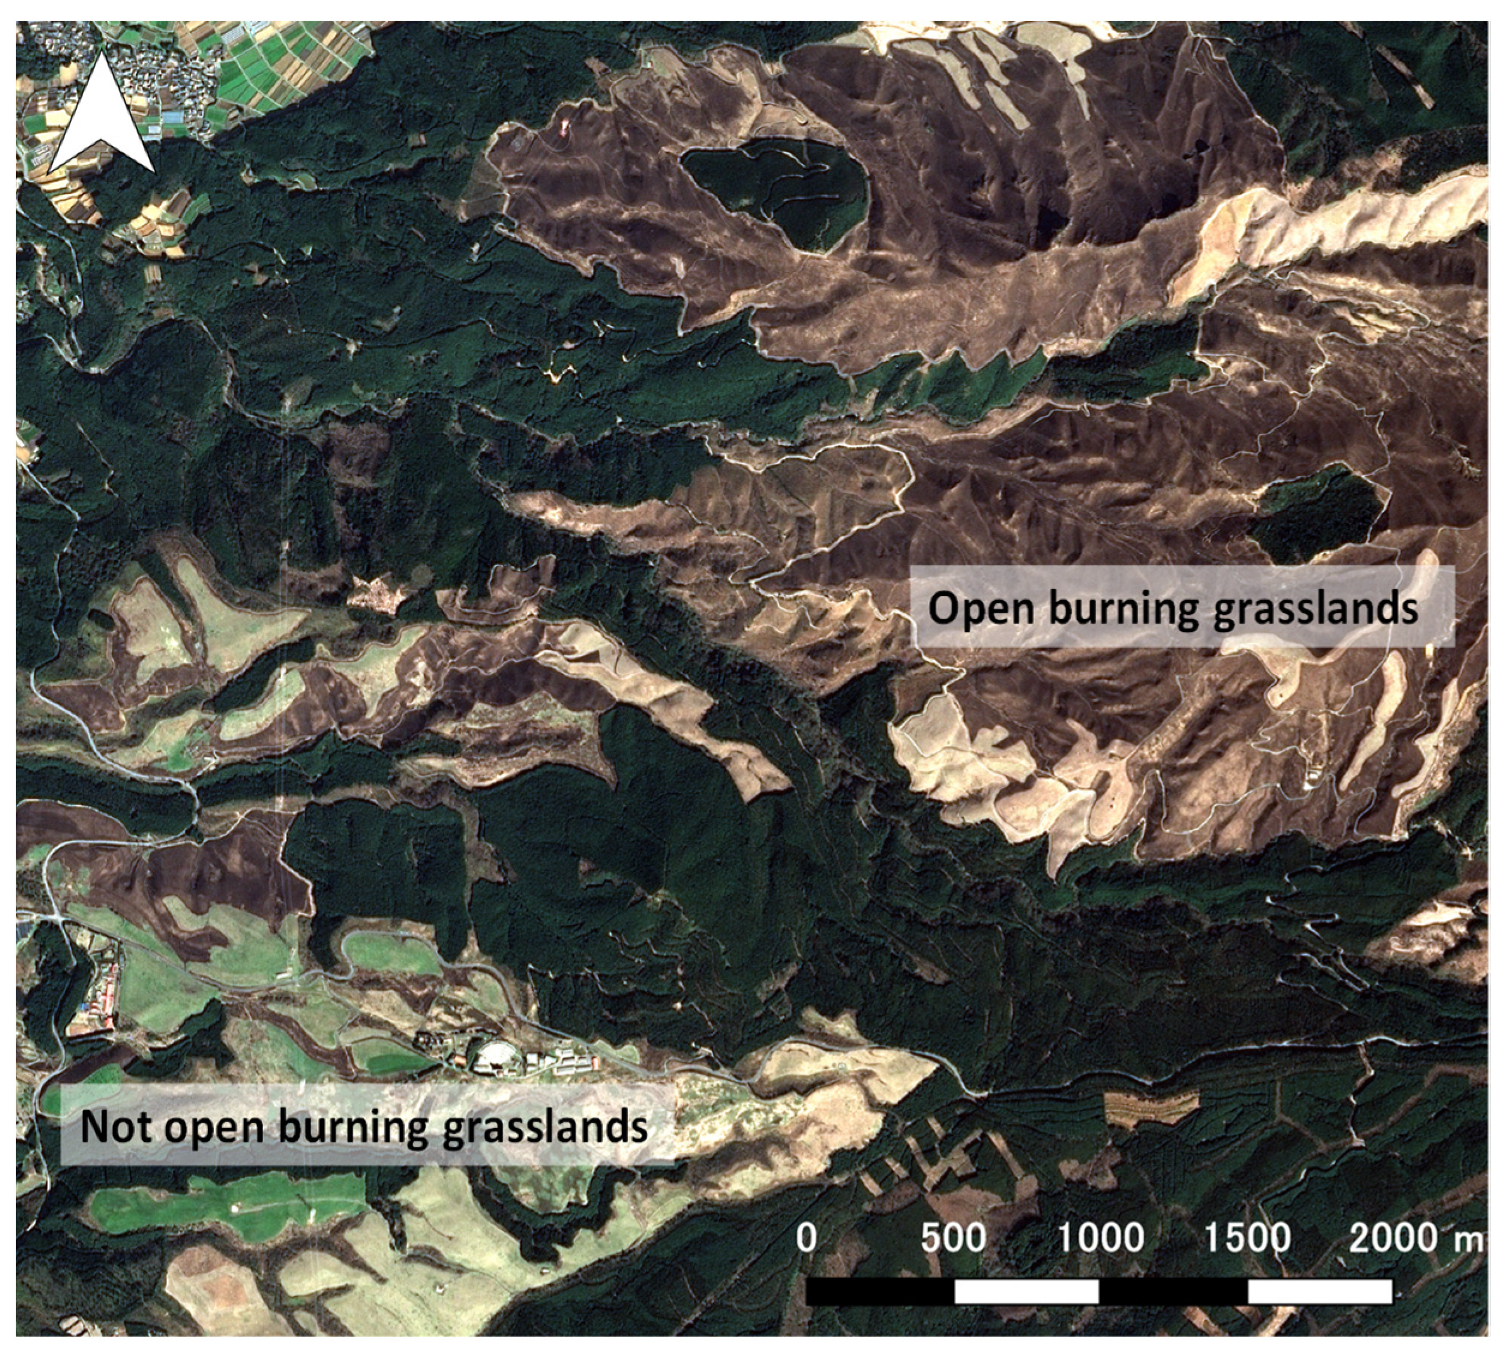
In this study, location data of paddy fields and GIS data were used to classify the damaged paddy fields, roads, water bodies, grasslands, and bare land induced by landslides before the supervised classification was conducted as described below. Damaged paddy fields are those that cannot be used due to problems such as cracks and collapse caused by earthquake. Following the study of land cover classification for the Aso caldera, which is adjacent to the Kumamoto area to the east [46], damaged paddy fields were identified by using an account book of paddy fields and the Agriculture Land Information System [52]. In general, we can obtain information on the address, area, and cultivated crops of each field from the account book and identify the location of the field from the Agriculture Land Information System by using the address. However, since there was no information on addresses in the 2016 account book, we applied the 2017 account book. Roads and water bodies were classified by using fundamental geospatial data updated on 1 October 2016 [53], with some modification. This allowed us to classify narrow farm roads and irrigation canals distributed in paddy and plowed fields. Grasslands are subject to open burning, grazing, and mowing, and display completely different characteristics (Figure 2). Since it is difficult to classify grasslands precisely in this situation, we used a vegetation map (vg67) [54] with some modification for classification. In this way, understanding the land cover characteristics shown in Figure 2 in advance, and using manual classification in some cases, they would be seen as important, for more accurate land cover mapping.
In order to identify landslides, Furukawa et al. [55] compared the three methods of NDVI filtering, spectral angle mapper, and support vector machine using high-spatial-resolution images in Hokkaido, Japan. This study showed that the NDVI filtering method was better for landslide detection. Therefore, in this study, landslide areas were identified by using the NDVI filter. We applied the following filter for the Kumamoto earthquake as demonstrated by Yamazaki and Liu [56]:
NDVIbeforeNDVIafter < −0.2,
where NDVIbefore is the NDVI value before the earthquake, and NDVIafter is the value after the earthquake. These NDVI values were obtained by calculation using reflectance in the red and near-infrared bands in the satellite images of 2 May 2015 and 29 July 2016:
NDVI = (NIRR)/(NIR + R),
where R is the reflectance of the red band and NIR is the reflectance of the near-infrared band. Eventually, the areas extracted by the filter and around the points indicated by the Geospatial Information Authority of Japan [21] were extracted as a landslide area.
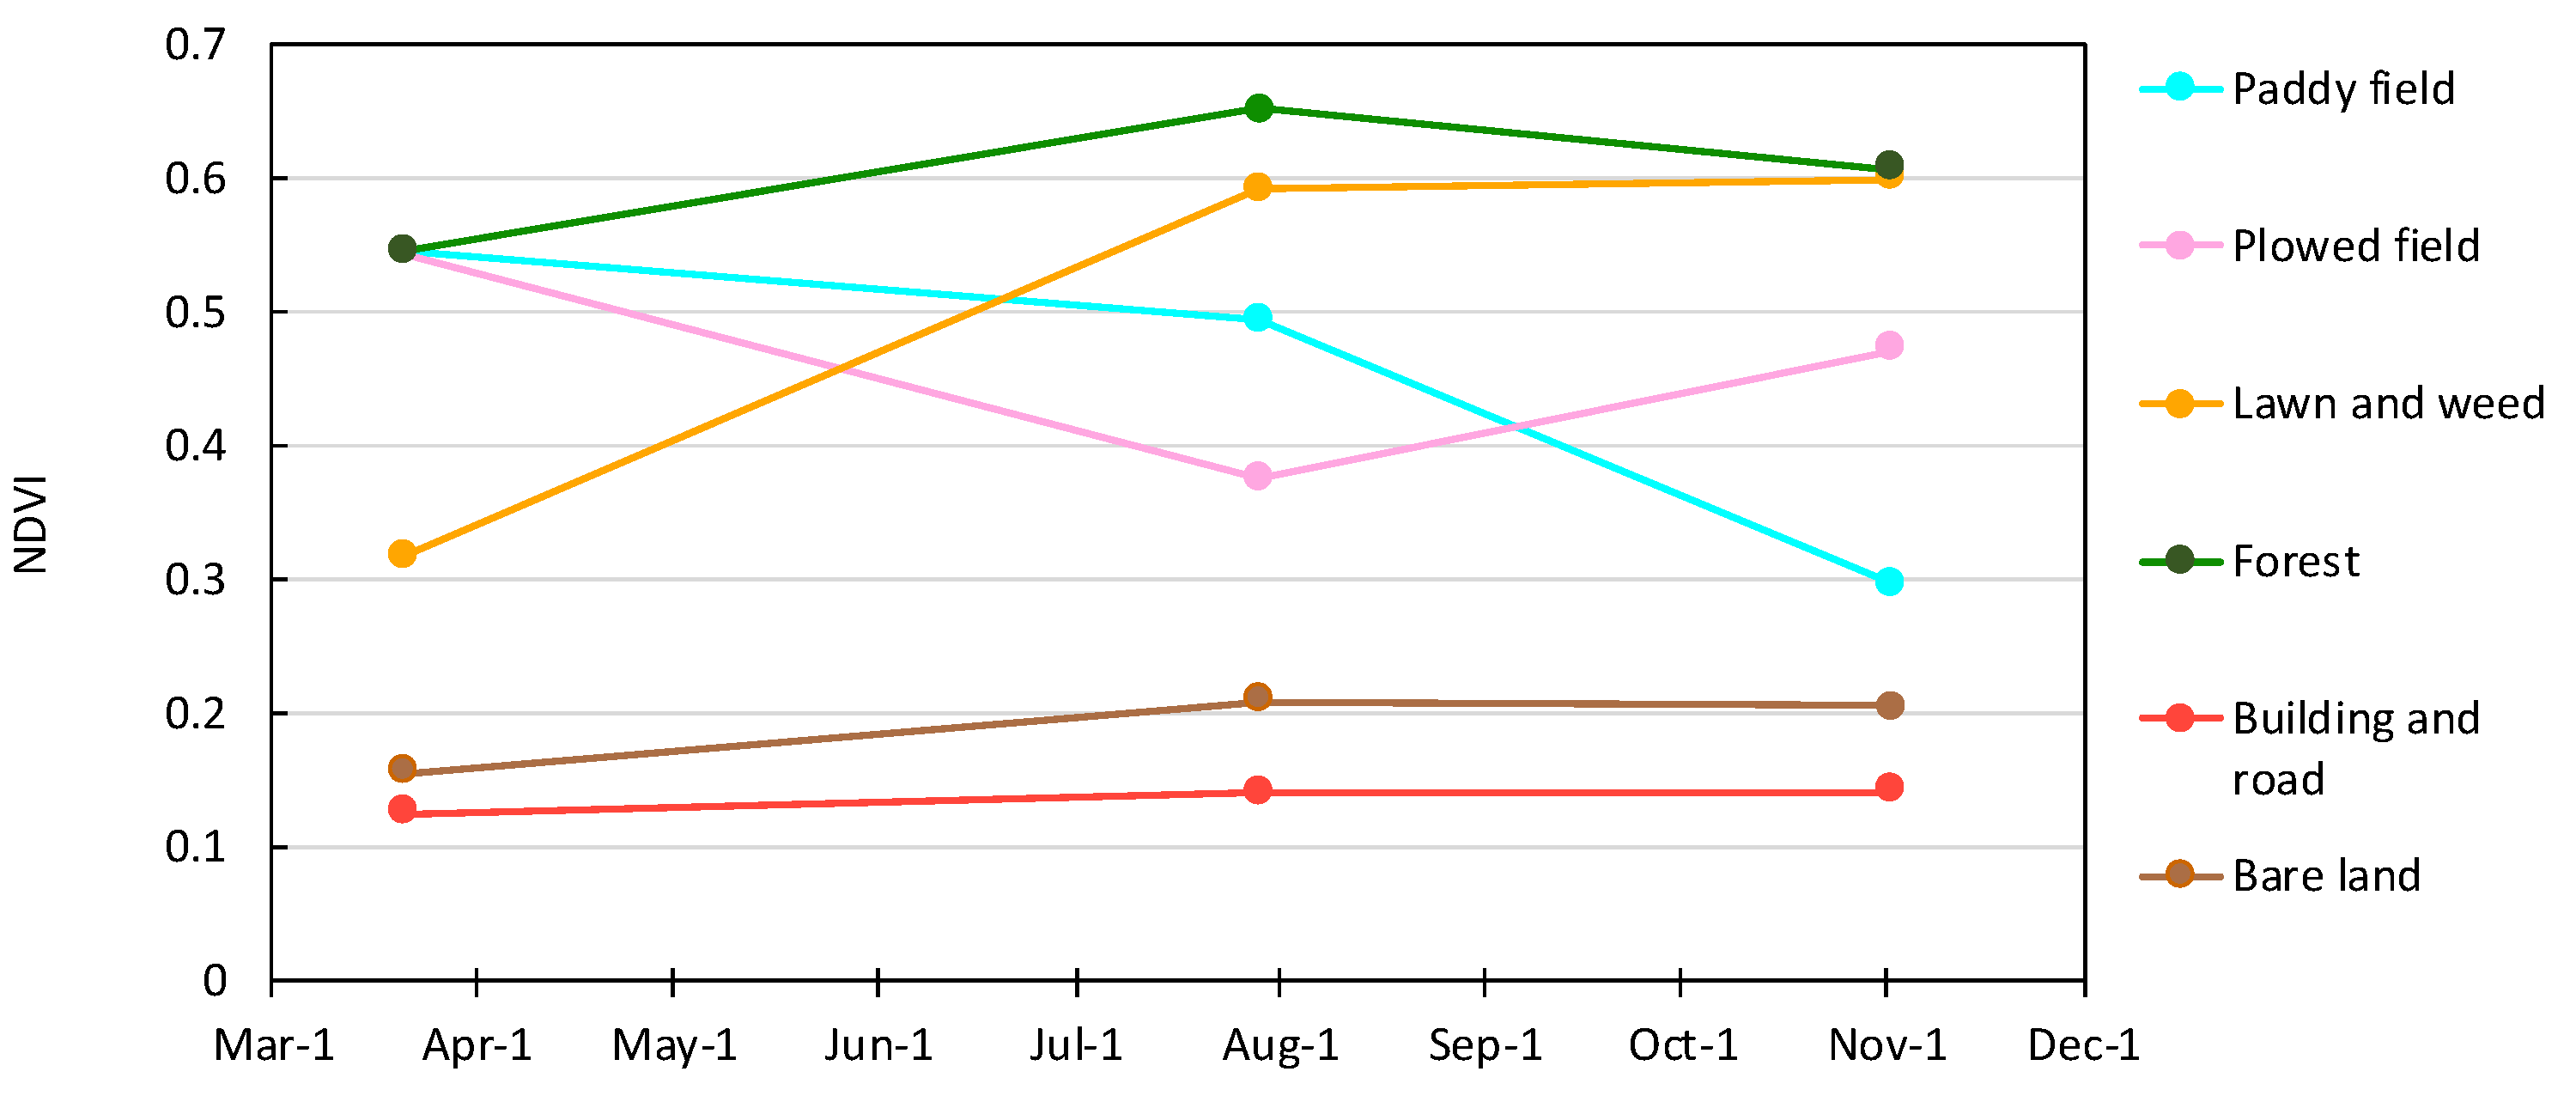
For the other land cover classes, we applied supervised classification based on the MLC method following classification workflow [57] in ENVI 5.6. Training areas were created from known areas using the region of interest (ROI) tools in ENVI 5.6. In order to improve the classification accuracy, we created a farmland mask (“Paddy field”, “Plowed field”, and “Building” (plastic greenhouse)) with reference to Sueyoshi et al. [58] and performed classification separately for farmland and other categories. Figure 3 shows the seasonal changes in NDVI values in the training area for each land cover classified by supervised classification. Although similar trends with small differences are represented between “Building and road” and “Bare land”, the other categories captured significantly different changes. Therefore, in this study, NDVI values were selected for training data in addition to RGB bands.
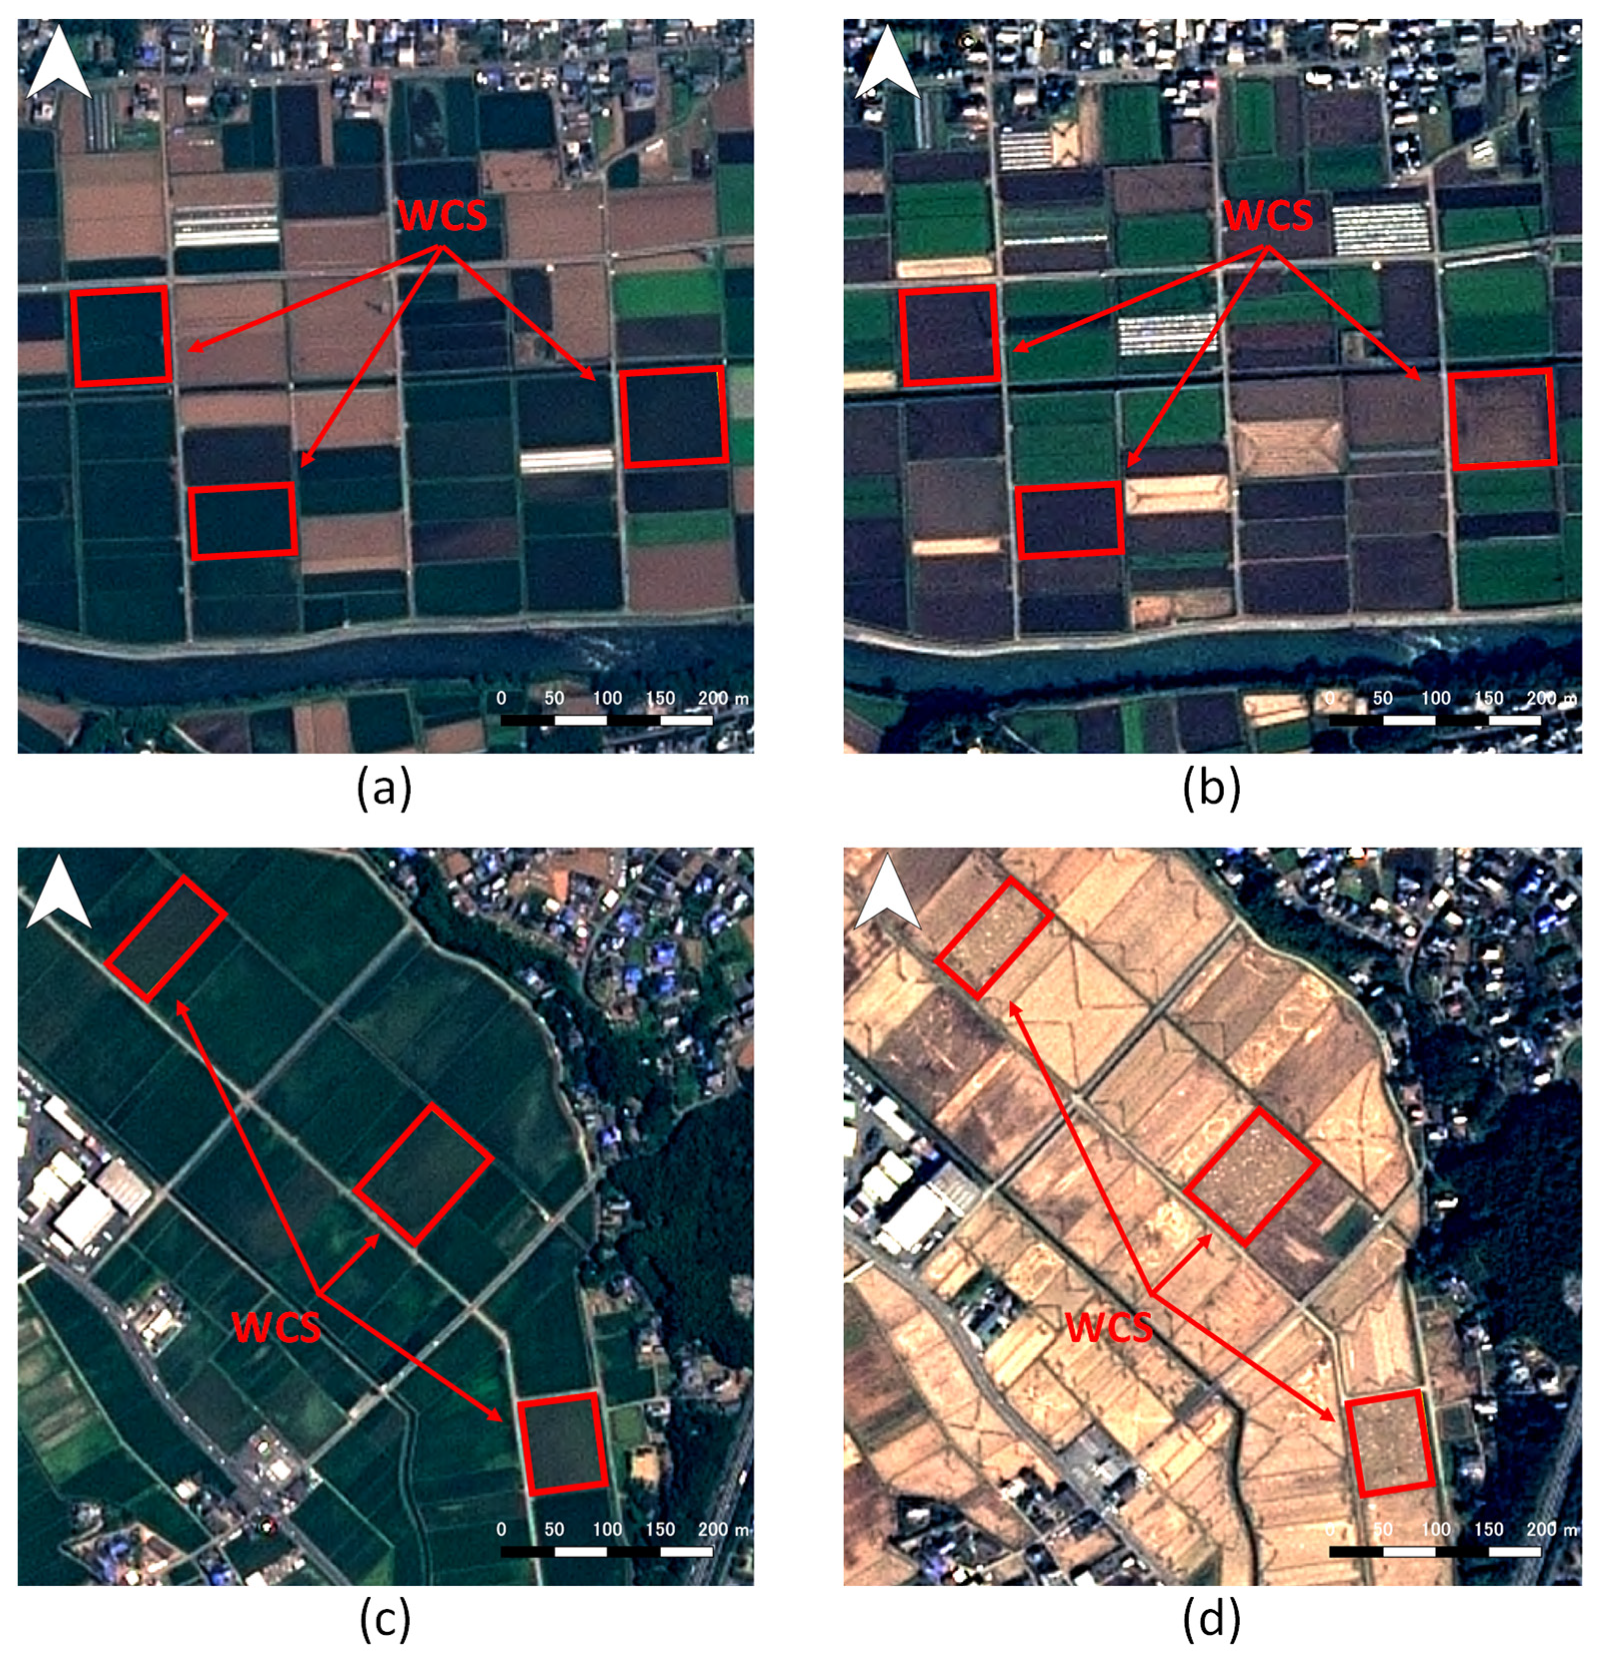
In order to classify the farmland into “Paddy field”, “Plowed field”, and “Building” (plastic greenhouse), the three RGB bands in November and the difference between NDVI values on 29 July and 2 November were used as parameters for the training data. In the mid-stream area of the Shirakawa River, some paddy fields, after harvesting rice for feed and whole crop silage (WCS), are flooded again through the artificial groundwater recharge project described above. As shown in Figure 3, although NDVI values decreased from 29 July to 2 November in paddy fields due to harvesting in both areas, paddy fields with artificial recharge tend to be darker than those without artificial recharge (Figure 4). In such fields, although the seasonal change in NDVI values is the same, misclassification of plowed fields is triggered. Therefore, in order to reduce misclassification, classification of farmland in the midstream area of the Shirakawa River and other areas was performed separately, using different training data. For the remaining categories, the three bands of RGB and NDVI in March were used as parameters for the training data. Finally, in order to clean up the classification results, a kernel filter was applied in the last step of classification workflow in ENVI 5.6. The square kernel’s center pixel was replaced with the majority class value of the kernel [57]. A typical (default) filter size of 3 × 3 was applied first, then larger filter sizes were tested. To compare the paddy fields in the classification results and the statistical data for the 11 municipalities (Figure 1b), a filter size of 21 × 21 with a smaller error was applied.

3.3. Accuracy Assessment

Accuracy assessment is a necessary step because the estimated groundwater recharge amount from an inaccurate map has no meaning. First, along with the test of the larger kernel filter, the area of paddy fields was evaluated. Then, the classification accuracy was assessed based on a confusion matrix. As quantitative classification accuracy indicators, overall accuracy, producer’s accuracy, user’s accuracy, and kappa coefficient were computed. Assessment using these criteria is a general method that is often used in studies (e.g., [32,34,35,36,37,38,42,43,44]). In order to construct the confusion matrix, 2000 random points were created in the study area as reference data by using the Create Random Points tool in ArcGIS Pro 2.8.1 (Esri Inc., Sacramento, CA, USA). Ground truth data at each point were obtained by high-resolution satellite images from SPOT 6/7, and aerial photographs from Google, the Geospatial Information Authority of Japan [59], and the Agriculture Land Information System [52]. Areas that could not be determined as grasslands, damaged paddy fields, and water bodies were excluded from the counting.

3.4. Calculation Method of Groundwater Recharge

In this study, groundwater recharge was calculated for paddy fields, plowed fields, damaged paddy fields, grassland, lawns and weeds, and forest, which are considered recharge areas. As mentioned above, in order to determine the kernel filter size, the areas of 11 current municipalities (Figure 1b) were determined as target areas for land cover classification, but groundwater recharge was calculated for the Kumamoto area (Figure 1a) sharing the groundwater basin. The method to calculate the groundwater recharge for these land cover types in the study area is summarized in previous reports [1,26].

3.4.1. Groundwater Recharge from Paddy Fields

Groundwater recharge from paddy fields during the irrigation season with small modification is expressed as follows:
Rpi = Ap × (WE),
Rpn = (Ap/2) × (WE),
where Rpi is groundwater recharge during the flooding period (m3/day), Rpn is groundwater recharge during the mid-summer drainage and interruptive irrigation period (m3/day), Ap is the area of a paddy field (m2), W is the water requirement rate (m/day), and E is evapotranspiration (m/day). A water requirement rate of approximately 1.08 km2 was set for each grid in the Kumamoto area, with 0.02–0.075 m/day [26], and the rate was averaged by aggregating the grids belonging to each municipality. The general irrigation period in the Kumamoto area is late June to early October. During this period, food rice, WCS, and feed rice will be grown in the paddy fields, and each crop will have a slightly different cultivation calendar. However, it is difficult to determine the type of crop by satellite images. In addition, the majority of paddy fields are occupied by rice for food. Considering these factors, the cultivation calendar for food rice shown in Figure 5 [60] was applied to all paddy fields in this study.

3.4.2. Groundwater Recharge Other Than Paddy Fields

Groundwater recharge for other than paddy fields, such as plowed fields, grassland, lawns and weeds, and forest, is expressed as follows:
Rn = An × (κn × PE),
where Rn is the groundwater recharge amount (m3/day), An is area (m2), κn is infiltration coefficient, P is precipitation (m/day), and n is land cover categories. Infiltration coefficients were set for each land cover type, as shown in Table 1. The coefficients were determined based on the results of several surveys conducted in the study area [26]. Areas classified as grassland and forest are mostly distributed in the mountainous region. Thus, an infiltration coefficient of 0.2 was set for grassland and forest. For paddy fields during non-irrigation season and damaged paddy fields, an infiltration coefficient of 0.7 for plowed fields was adopted. Lawns and weeds were subjected to the same coefficient as grassland, and 0.5 was applied from its distribution area. The precipitation data for the years analyzed were collected at Kumamoto Observatory (32° 48.8′ N, 130°42.4′ E) [61].

3.4.3. Evapotranspiration

Daily evapotranspiration was calculated using the Hamon method [62]:
E = (0.1651 × Ld × RHOSAT × KPEC)/1000,
where Ld is the daytime length, which is the time from sunrise to sunset in multiples of 12 h, RHOSAT is the saturated vapor density (g/m3), and KPEC is the calibration coefficient, which was set to 1.2 in this study. RHOSAT was calculated based on the daily mean air temperature (°C) and saturated vapor pressure (mb) at a given daily mean air temperature (see Lu et al. [62] for details). When the mean air temperature is less than 0, the evapotranspiration is 0. The daytime length and mean air temperature data were also collected at Kumamoto Observatory [61].

4. Results

4.1. Effect of Kernel Filter Size

Due to the high resolution of the images, a lot of noise is generated. As a visual evaluation, the smoothing effect was not clearly visible with the 3 × 3 filter (Figure 6a), while the larger 21 × 21 filter could eliminate noise significantly (Figure 6b). Figure 7 shows the sum of squared residuals (SSR) and absolute value of residual sum (AVRS) for paddy fields. SSR decreased significantly with the 17 × 17 filter, then it did not decrease much, even though the filter size increased. When the filter size was 41 × 41, it increased slightly. For AVRS, larger values were found when the filter size was 3 × 3, 9 × 9, and 41 × 41. The same as SSR, there was not much change in AVRS between 17 × 17 and 27 × 27 filter sizes, but the minimum value was found at 21 × 21. Considering that the change in SSR was small when the filter size was greater than 17 × 17 and that AVRS was at its minimum value with the 21 × 21 filter, the filter size was set to 21 × 21 in this study, as mentioned above. The relationship of the area of paddy fields between the statistical data and the classification result with the 21 × 21 kernel filter is shown in Figure 8. Since we selected the filter size with smaller residuals, the result shows that the area is close to the statistical data, and the correlation coefficient is very high at 0.997.

4.2. Classification Results

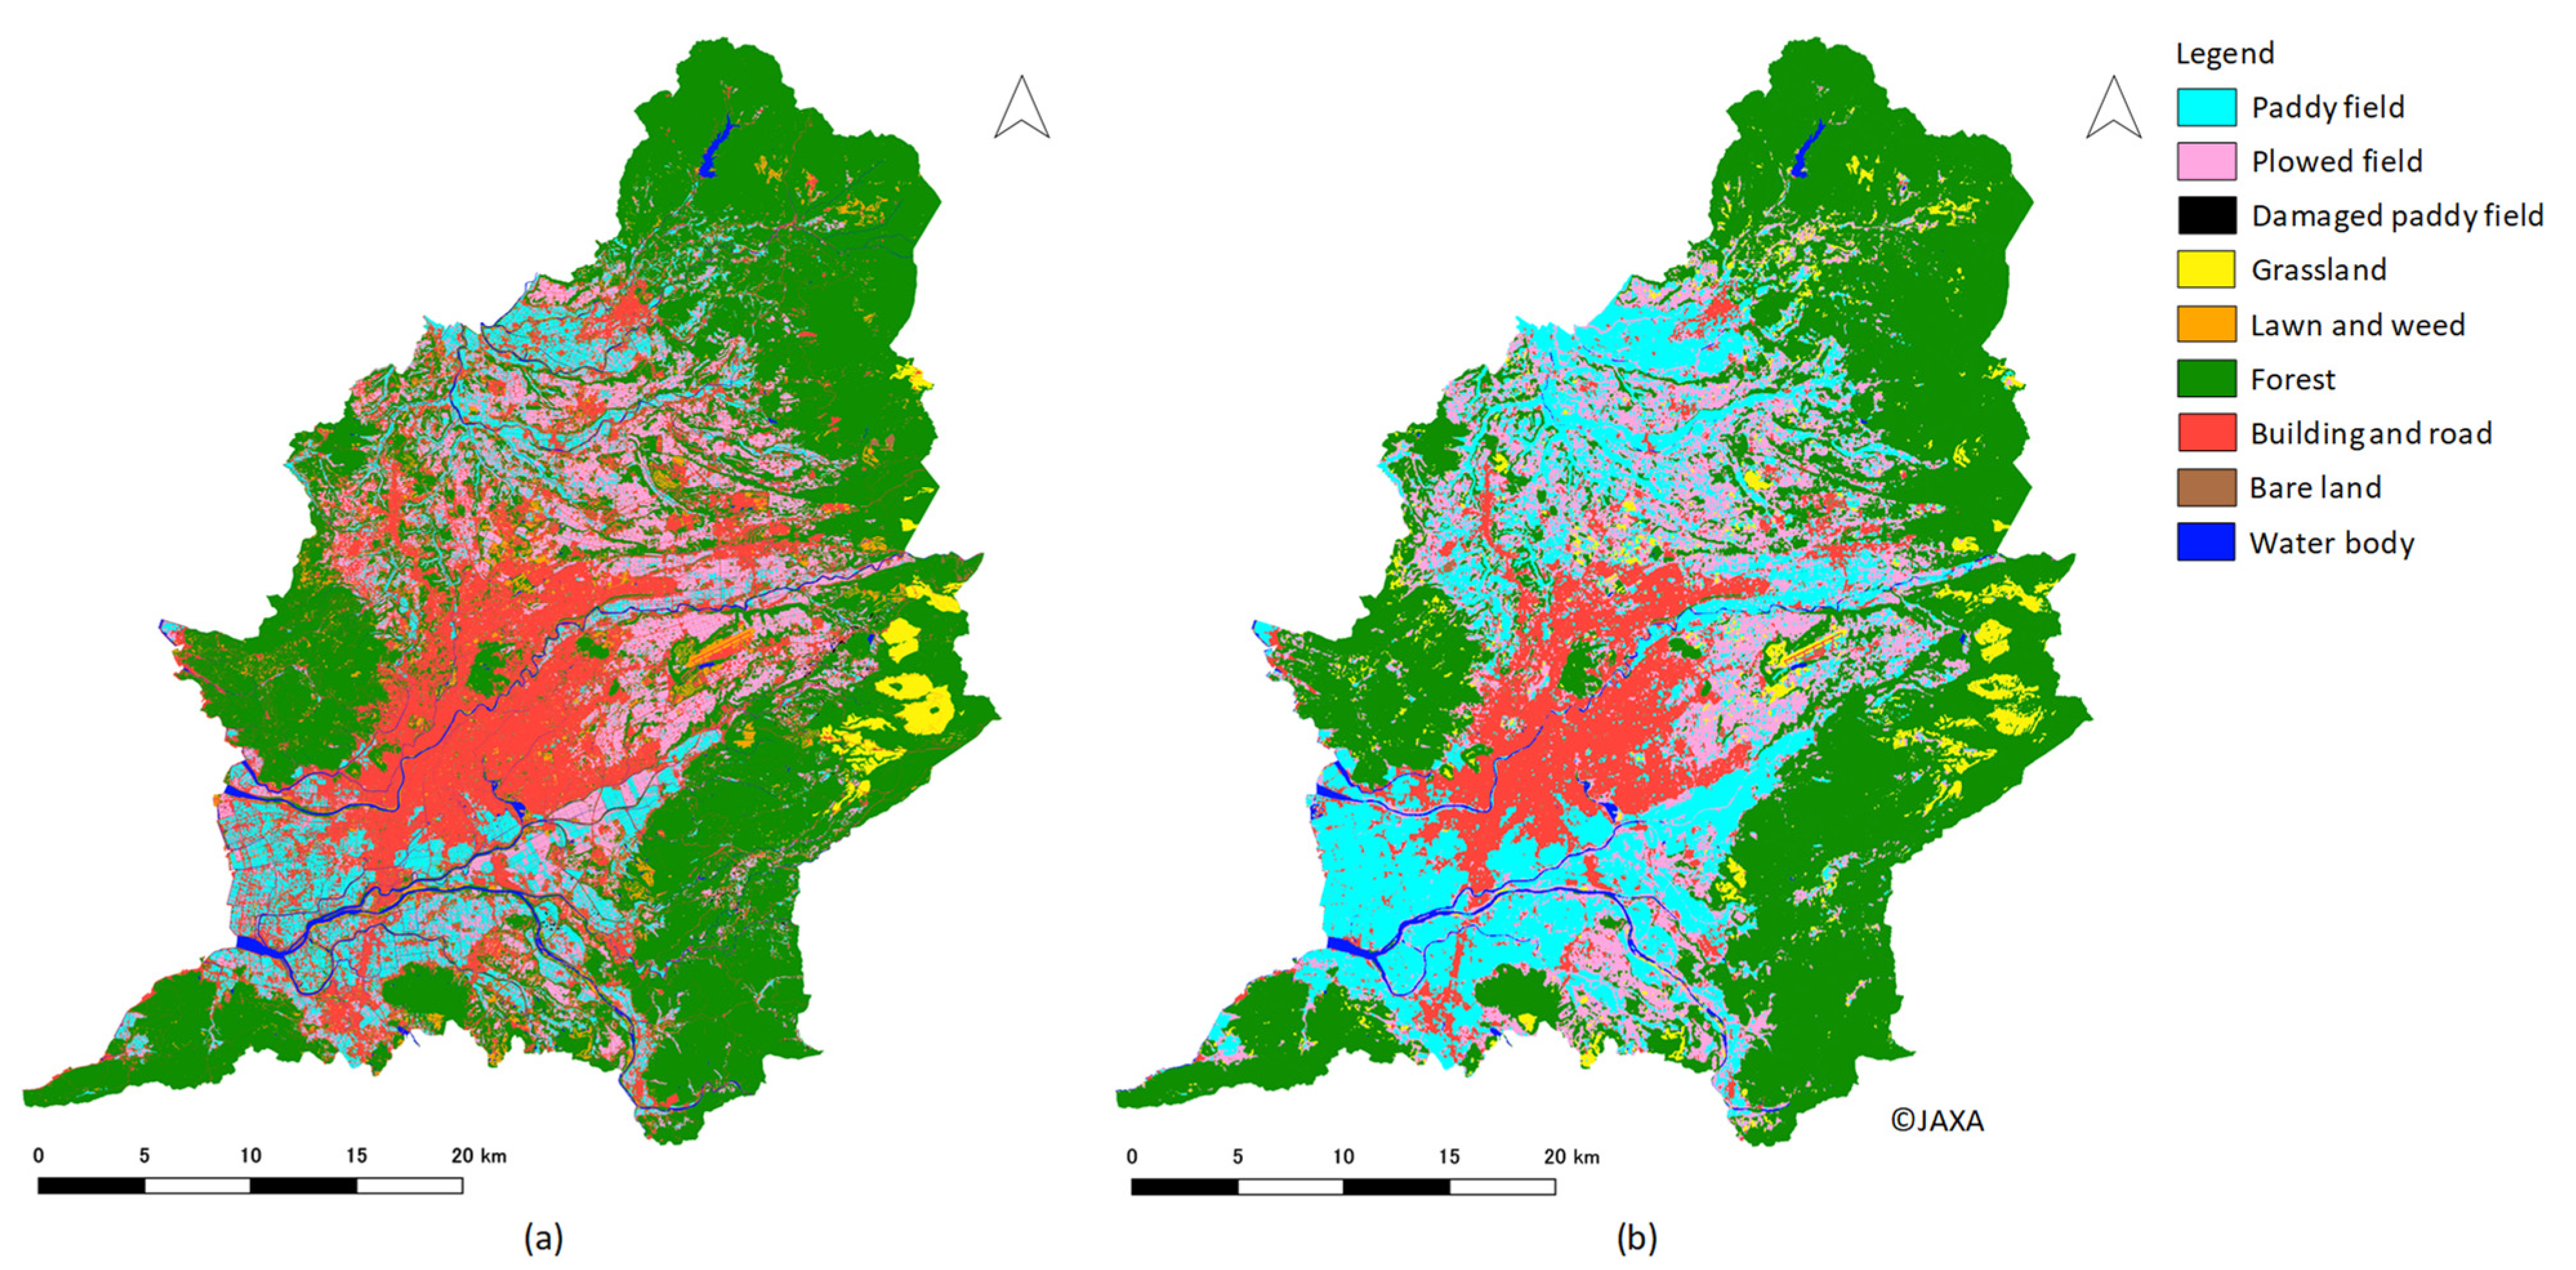
The confusion matrix constructed based on random reference points is shown in Table 2. The user’s accuracy indicated a value of 70.6 to 95.1%, and the producer’s accuracy ranged from 56.8 to 98.4%. The overall accuracy was 91.7%, with a kappa coefficient of 0.88, computed from the confusion matrix. Since we obtained kappa coefficients above 0.75, our classification result can be assessed as excellent [63]. The land cover classification result is represented in Figure 9, compared to a 30 m resolution land use and land cover map for 2014–2016 (ver. 18.03 [64]), created by the Japan Aerospace Exploration Agency (JAXA), which showed overall accuracy of 81.6% and kappa coefficient of 0.8. Actually, there are more classes on JAXA’s map (e.g., deciduous broadleaf trees and evergreen conifers), so they were unified into a forest for comparison. There are no classifications of damaged paddy fields and lawns and weeds. Although the paddy field areas differ significantly, the distribution of land cover is generally consistent between the two maps.

4.3. Land Cover

The area of nine land cover categories in the Kumamoto area is shown in Table 3. The largest area is occupied by forests, followed by buildings. These two categories account for about 69% of the total area. Most of the remaining 31% is farmland: paddy fields (8.15%), plowed fields (13.81%), and damaged paddy fields (0.09%). The area of damaged paddy field is 0.91 km2, accounting for 1.06% of the entire paddy field area of 85.76 km2. Most of the damaged paddy fields are distributed in Nishihara Village and Mifune Town, with areas of 0.47 and 0.43 km2, respectively. A fault line runs through these locations (Figure 1), causing direct damage to paddy fields. Furthermore, damage was also observed in farmland in the mountainous areas in Mifune Town. The remaining farmland can be seen in Kosa Town and Ozu Town. The area of bare land is the smallest in the Kumamoto area, excluding the damaged paddy fields induced by the earthquake. Although most of the bare land is occupied by school playgrounds, about 0.41 km2 (3.2%) of the total 12.70 km2 is the result of the recharge area (forest and grassland) being changed to bare land due to the landslides induced by earthquakes and heavy rains. Landslides caused the most damage in Ozu Town, with an area of about 0.27 km2. The second most affected municipality was Nishihara Village, with an area of 0.11 km2. Landslides were also detected in Mashiki Town, Mifune Town, and Kumamoto City, with an area of less than 10% of that of Nishihara. Looking at the land cover, if landslides had not occurred, most of the areas extracted by landslides (97.6%) would have been classified as forest, and the remaining area would have been classified as grassland.

4.4. Groundwater Recharge

The calculated groundwater recharge from each land cover considered as a recharge area is shown in Table 4. The total groundwater recharge amount in 2016 was estimated at 757.56 million m3. The target recharge of 636 million m3 [5] was achieved in 2016 due to high precipitation. The total recharge from paddy fields during irrigated and non-irrigated periods was 254.66 million m3, which was the highest in the recharge area. This is equivalent to about 33.61% of the total recharge. This ratio is almost the same as that of plowed fields, with the second highest recharge. Forests, which have the largest recharge after paddy fields and plowed fields, also showed a recharge of over 200 million m3. From the above, it can be seen that groundwater recharge from paddy fields, plowed fields, and forest accounts for the majority of the total recharge.
As mentioned above, 0.91 km2 of damaged paddy fields and 0.41 km2 of bare land due to natural disasters may have affected the groundwater recharge amount. The groundwater recharge amount in the absence of land cover changes due to natural disasters is shown in Table 5. The total recharge amount from paddy fields during the irrigated and non-irrigated seasons when there were no damaged paddy fields was 258.15 million m3. This amount is 3.49 million m3 more than in the case where there are damaged paddy fields. However, since there was recharge of 1.36 million m3 from damaged paddy fields (Table 4), their occurrence actually reduced the groundwater recharge by 2.13 million m3. On the other hand, the recharge amount of grassland and forest decreased by 0.01 and 0.16 million m3, respectively, due to landslides. These decreases are less than 10% of the value of paddy fields. Overall, recharge decreased by 2.30 million m3, which is less than 0.5% of the total recharge amount.

5. Discussion

Our study demonstrates the effect of various kernel filter sizes on the classification results. As mentioned above, the square kernel’s center pixel is replaced with the majority class value of the kernel [57]. In other words, the application of a larger kernel filter means that the class values farther from the center would also be reflected. It is found in detail that a large size filter is effective for removing noise over a wide area, unifying each class, and improving the classification accuracy for SPOT 6/7 images as shown in Figure 6, Figure 7 and Figure 8. Since high-resolution satellite images of SPOT 6/7 were used, our tests of kernel filters of different sizes demonstrated that larger filter sizes are effective and appropriate for small pixel sizes, as stated by Stuckens et al. [47]. The filter not only changed the visual appearance of the map, as shown in Figure 6a,b, but also changed the area, making it closer to the statistical data. Since our main objective was to quantify the effect on groundwater recharge amount due to natural disasters, calculating the recharge amount based on maps with low accuracy is meaningless. Thus, the smoothing step using the larger kernel filter size was essential to improve the accuracy of the map.
In addition to the use of a kernel filter, the classification method was built up by integrating previous studies demonstrating the effectiveness of using GIS data and masks regulating specific land covers. For example, the use of GIS data for narrow farm roads and irrigation canals, which are difficult to extract with satellite images, contributed to the reduction in misclassification of farmland. In addition, although paddy fields are scattered even in the central building area on JAXA’s map (Figure 9b), our farmland mask worked effectively to prevent such misclassification. In this region, where more than half of the total area is occupied by farmland, we can assume that classifying farm roads and irrigation channels, which are non-recharge areas, as farmland will lead to a substantial overestimation of the groundwater recharge amount.
In Mashiki Town, damaged paddy fields were not represented in the map, although they underwent liquefaction, cracking, and sinking due to the earthquake. This is because the paddy fields were repaired immediately after the earthquake. Consequently, rice planting was carried out as usual that year. In the Shirakawa River mid-stream area, where Ozu Town and Kikuyo Town are located, the irrigation canals were damaged, making it impossible to supply water. However, the channels caused by the earthquake were repaired in a rather short time and emergency re-construction of the channels was finished in 2017 [4]. In the following year, farming activities and artificial recharge were almost back to normal [4]. On the other hand, in Nishihara Village and Mifune Town, which account for the majority of the damaged paddy field area, the restoration of irrigation channels and farmland is still underway as of FY 2021 [65]. As can be seen, the degree of restoration varies by municipality, but it is expected that the restoration will be completed in a few years and the decrease in groundwater recharge from paddy fields will be smaller.
In order to restore groundwater recharge in landslide scars, soil must be restored. A study on natural vegetation recovery and soil development processes in a landslide scar reported that the topsoil was regenerated over time as follows [66]. Twenty years after the landslides, a humus soil layer of about 20 cm thick was formed. Fifty to sixty years after the landslides, a soil layer of about 30 to 40 cm thick was formed. Then, over 100 years after the landslides, a topsoil of about 40 to 50 cm thick was formed. More than 300 years after the landslides, the topsoil developed to a thickness of 70 to 80 cm. The topsoil was immature in terms of thickness and physical properties even more than 100 years after the landslides [66]. Therefore, it is reasonable to assume that it will take at least 100 years to recover the original groundwater recharge function in the landslide scars in the study area. In other words, restoration of landslide scars takes much longer than restoration of paddy fields.
Therefore, we should focus on reducing the recharge amount of 0.17 million m3 due to landslides. Although that is a small fraction of the total recharge amount, since the annual per capita domestic water use in the Kumamoto area in FY 2006 was about 124.8 m3 [5], that decrease means that the annual water supply for 1362 people has been lost. The annual groundwater recharge amount in FY 2024 is estimated to decrease by 9.9 million m3 from the average amount during FY 2009 to FY 2017 [22], meaning that the annual amount decreases by 1.41 million m3 every year. The decrease due to landslides accounts for 12.1% of the estimated annual decrease. From this perspective, it can be said that the decrease in recharge amount of 0.17 million m3 is not small. Therefore, it is important for sustainable groundwater use to compensate for the decreased recharge amount caused by land cover change due to natural disasters.
For example, we considered rainwater seepage pits at houses for groundwater recharge, promoted by municipalities. The recharge from a rainwater infiltration system can be calculated using Equation (5), where An is the area of the roof and κn is 0.95 [26]. The calculation for precipitation in 2016 indicated that a roof area of 75,000 m2 can recharge 0.17 million m3. In addition to rainwater seepage pits, installing permeable pavement and greening blocks is recommended for groundwater recharge [67]. Permeable pavement is constructed in a way that allows rainwater to infiltrate into the ground from the surface. Greening blocks, made of concrete or other materials, are placed at equal intervals, and the gaps are covered with turf to allow rainwater to infiltrate into the ground. These have been introduced, for example, in parking areas. As with rainwater seepage pits, the recharge from permeable pavement and greening blocks can be calculated using Equation (5), where An is the installation area and κn is 0.7 [26]. In 2016, these installations would have required an area of 103,000 m2 to recharge 0.17 million m3 of groundwater. Finally, we considered interpolating the artificial groundwater recharge project in the Shirakawa River mid-stream area. Equation (3) is simplified by ignoring evapotranspiration, and the groundwater recharge rate is estimated by setting a water requirement rate of 0.11 m/day [26]. For example, if the area is to be flooded for 30 days, it will require an area of 52,000 m2 to recharge 0.17 million m3. On the other hand, if flooding is carried out for 90 days, the required area can be reduced to 17,200 m2. The results of these calculations indicate that a reasonable effort is required to recharge lost groundwater.

6. Conclusions

This study created a land cover map, which covers the Kumamoto area, representing damage resulting from events such as landslides induced by the Kumamoto earthquake and heavy rainfall in 2016. In the process of map creation, we showed that a large kernel filter removed more noise over a wide area, GIS data and masks regulating specific land covers contribute significantly to improving the map accuracy. The study further quantified the effects on the groundwater recharge amount due to the change of land cover in the Kumamoto area by using the created land cover map and revealed that the reduction amount due to landslides was only a small portion of the total recharge. However, since the reduction amount corresponds to 12.1% of the recent annual decrease in groundwater recharge, we concluded that it is necessary to compensate for the lost recharge for sustainable groundwater use. After studying some methods to compensate the groundwater recharge, we found that it would take a lot of effort in all cases. The results of the analysis of groundwater recharge and the suggestions for groundwater conservation presented in this study can be used as useful data contributing to groundwater conservation measures, as mentioned at the beginning.
Maruyama and Ikawa [68] reported that the Kumamoto earthquake may have changed the water requirement rate in the paddy fields. In order to understand the impact of natural disasters on groundwater recharge, not only land cover changes but also changes in the water requirement rate, as indicated by Maruyama and Ikawa [68], should be considered. However, the study of paddy fields [68] is limited to a few areas. As far as we know, there is no publication reporting changes in the water requirement rate due to earthquakes in the Kumamoto area. Specifically, we were not able to consider the change in the water requirement rate. The restoration work and the resulting changes in land use depend, to some extent, on the efforts and budgets of the national and local governments and are largely anthropogenic factors, while the restoration of vegetation and soil development in landslide scars is greatly influenced by natural factors. Specifically, it is difficult to predict exactly how much time it will take to reach the previous land cover. In terms of classification methods, the use of satellite images with high spatial resolution does not necessarily result in a higher classification accuracy. One reason for this is that satellite images with high spatial resolution are more affected by noise. These matters represent the limitations of the study or potential weaknesses of the research tools.
As a future study, we first need to investigate how much the water requirement rate of the paddy fields in the study area, for example, was changed by the earthquake. This study is also essential for administrative organizations to estimate groundwater recharge amounts with higher accuracy.

Author Contributions

Conceptualization, Y.I.; methodology, H.A.; validation, H.A.; formal analysis, H.A.; investigation, H.A.; resources, Y.I.; data curation, H.A. and Y.I.; writing—original draft preparation, H.A.; writing—review and editing, Y.I.; visualization, H.A.; supervision, Y.I.; project administration, Y.I.; funding acquisition, Y.I. All authors have read and agreed to the published version of the manuscript.

Funding

This research was performed with support by the Environment Research and Technology Development Fund (JPMEERF19S20505) of the Environmental Restoration and Conservation Agency of Japan.

Institutional Review Board Statement

Not applicable.

Informed Consent Statement

Not applicable.

Conflicts of Interest

The authors declare no conflict of interest.

References

  1. Kumamoto Prefecture and Kumamoto City. Report on Comprehensive Survey on Groundwater in Kumamoto Area in 1994; Kumamoto Prefecture and Kumamoto City: Kumamoto, Japan, 1995. [Google Scholar]
  2. Ide, K.; Suzuki, H.; Koga, H.; Shimada, J. Compensation method of groundwater level corresponding to the wellhead elevation change after the Kumamoto Earthquake. J. Groundw. Hydrol. 2019, 61, 197–203. [Google Scholar] [CrossRef] [Green Version]
  3. Imatsuji, G.; Ichikawa, T.; Aramaki, S. On the spring rate change and those mechanizm in the Ezu Lake and Suizenji, Kumamoto. Bull. Sch. Ind. Eng. Tokai Univ. 2008, 1, 46–52. [Google Scholar]
  4. Ichikawa, T.; Nakagawa, K.; Berndtsson, R. Earthquake effects on artificial groundwater recharge efforts in south Japan. Environ. Earth Sci. 2020, 79, 142. [Google Scholar] [CrossRef]
  5. Comprehensive Conservation and Management Plan for Groundwater in Kumamoto Area. Available online: https://www.pref.kumamoto.jp/uploaded/attachment/51663.pdf (accessed on 16 February 2021).
  6. Shimada, J. Recent challenges for sustainable groundwater management at Kumamoto Area, based on the regional groundwater flow system -Pumping permission for the regional groundwater management. J. Groundw. Hydrol. 2013, 55, 157–164. [Google Scholar] [CrossRef] [Green Version]
  7. Ozasa, Y. Regional characteristics of groundwater quality in Kumamoto Prefecture—A visualization study using grid maps. J. Environ. Lab. Assoc. 2005, 30, 239–245. [Google Scholar]
  8. Tomiie, K.; Itomitsu, N.; Matsuyama, K.; Kakimoto, R.; Kawagoshi, Y. Nitrate-nitrogen concentration in groundwater of Kumamoto urban area and determination of its contributors using geographical information system and nitrogen stable isotope analysis. J. Jpn. Soc. Water Environ. 2011, 34, 1–9. [Google Scholar] [CrossRef] [Green Version]
  9. Hosono, T.; Tokunaga, T.; Kagabu, M.; Nakata, H.; Orishikida, T.; Lin, I.-T.; Shimada, J. The use of δ15N and δ18O tracers with an understanding of groundwater flow dynamics for evaluating the origins and attenuation mechanisms of nitrate pollution. Water Res. 2013, 47, 2661–2675. [Google Scholar] [CrossRef]
  10. Hirohata, M.; Ozasa, Y.; Matsuzaki, T.; Fujita, I.; Matsuoka, R.; Watanabe, S. The mechanism of groundwater pollution by nitrate-nitrogen at U-town in Kumamoto Prefecture. J. Groundw. Hydrol. 1999, 41, 291–306. [Google Scholar] [CrossRef]
  11. Hosono, T.; Yamada, C.; Shibata, T.; Tawara, Y.; Wang, C.-Y.; Manga, M.; Rahman, A.T.M.S.; Shimada, J. Coseismic groundwater drawdown along crustal ruptures during the 2016 Mw 7.0 Kumamoto Earthquake. Water Resour. Res. 2019, 55, 5891–5903. [Google Scholar] [CrossRef] [Green Version]
  12. Hosono, T.; Yamada, C.; Manga, M.; Wang, C.-Y.; Tanimizu, M. Stable isotopes show that earthquakes enhance permeability and release water from mountains. Nat. Commun. 2020, 11, 2776. [Google Scholar] [CrossRef] [PubMed]
  13. Kagabu, M.; Ide, K.; Hosono, T.; Nakagawa, K.; Shimada, J. Describing coseismic groundwater level rise using tank model in volcanic aquifers, Kumamoto, southern Japan. J. Hydrol. 2020, 582, 124464. [Google Scholar] [CrossRef]
  14. Ide, K.; Hosono, T.; Kagabu, M.; Fukamizu, K.; Tokunaga, T.; Shimada, J. Changes of groundwater flow systems after the 2016 Mw 7.0 Kumamoto earthquake deduced by stable isotopic and CFC-12 compositions of natural springs. J. Hydrol. 2020, 583, 124551. [Google Scholar] [CrossRef]
  15. Miyakoshi, A.; Taniguchi, M.; Ide, K.; Kagabu, M.; Hosono, T.; Shimada, J. Identification of changes in subsurface temperature and groundwater flow after the 2016 Kumamoto earthquake using long-term well temperature–depth profiles. J. Hydrol. 2020, 582, 124530. [Google Scholar] [CrossRef]
  16. Tawara, Y.; Hosono, T.; Fukuoka, Y.; Yoshida, T.; Shimada, J. Quantitative assessment of the changes in regional water flow systems caused by the 2016 Kumamoto Earthquake using numerical modeling. J. Hydrol. 2020, 583, 124559. [Google Scholar] [CrossRef]
  17. Nakagawa, K.; Yu, Z.-Q.; Berndtsson, R.; Hosono, T. Temporal characteristics of groundwater chemistry affected by the 2016 Kumamoto earthquake using self-organizing maps. J. Hydrol. 2020, 582, 124519. [Google Scholar] [CrossRef]
  18. Nakagawa, K.; Shimada, J.; Yu, Z.-Q.; Ide, K.; Berndtsson, R. Effects of the Japanese 2016 Kumamoto earthquake on nitrate content in groundwater supply. Minerals 2021, 11, 43. [Google Scholar] [CrossRef]
  19. Ishii, E.; Watanabe, Y.; Agusa, T.; Hosono, T.; Nakata, H. Acesulfame as a suitable sewer tracer on groundwater pollution: A case study before and after the 2016 Mw 7.0 Kumamoto earthquakes. Sci. Total Environ. 2021, 754, 142409. [Google Scholar] [CrossRef]
  20. Kanamori, N. Damage to agriculture caused by the 2016 Kumamoto earthquake and the efforts of extension organizations. Rep. Kyushu Branch Crop Sci. Jpn. 2017, 83, 57–60. [Google Scholar]
  21. The 2016 Kumamoto Earthquake—Landslide Distribution Map Seen from the Sky (by Aerial Photo Reading) in Aso and Kumamoto Area. Available online: https://www.gsi.go.jp/common/000143459.pdf (accessed on 2 March 2021).
  22. Third Action Plan Based on the Comprehensive Conservation and Management Plan for Groundwater in Kumamoto Area. Available online: https://www.pref.kumamoto.jp/soshiki/49/5554.html (accessed on 15 October 2021).
  23. Fauzia; Surinaidu, L.; Rahman, A.; Ahmed, S. Distributed groundwater recharge potentials assessment based on GIS model and its dynamics in the crystalline rocks of South India. Sci. Rep. 2021, 11, 11772. [Google Scholar] [CrossRef]
  24. Ahirwar, S.; Malik, M.S.; Ahirwar, R.; Shukla, J.P. Identification of suitable sites and structures for artificial groundwater recharge for sustainable groundwater resource development and management. Groundw. Sustain. Dev. 2020, 11, 100388. [Google Scholar] [CrossRef]
  25. Batarseh, M.; Imreizeeq, E.; Tilev, S.; Al Alaween, M.; Suleiman, W.; Al Remeithi, A.M.; Al Tamimi, M.K.; Al Alawneh, M. Assessment of groundwater quality for irrigation in the arid regions using irrigation water quality index (IWQI) and GIS-Zoning maps: Case study from Abu Dhabi Emirate, UAE. Groundw. Sustain. Dev. 2021, 14, 100611. [Google Scholar] [CrossRef]
  26. Calculation Method of Estimated Recharge Due to Groundwater Recharge Measures in Priority Areas (Kumamoto Area). Available online: https://www.pref.kumamoto.jp/uploaded/attachment/51876.pdf (accessed on 16 February 2021).
  27. Liu, W.; Yamazaki, F.; Maruyama, Y. Detection of earthquake-induced landslides during the 2018 Kumamoto earthquake using multitemporal airborne lidar data. Remote Sens. 2019, 11, 2292. [Google Scholar] [CrossRef] [Green Version]
  28. Gautam, N.C.; Chennaiah, G.C. Land-use and land-cover mapping and change detection in Tripura using satellite LANDSAT Data. Int. J. Remote Sens. 1985, 6, 517–528. [Google Scholar] [CrossRef]
  29. Tin-Seong, K. Integrating GIS and remote sensing techniques for urban land-cover and land-use analysis. Geocarto Int. 1995, 10, 39–49. [Google Scholar] [CrossRef]
  30. Yang, X.; Lo, C.P. Using a time series of satellite imagery to detect land use and land cover changes in the Atlanta, Georgia metropolitan area. Int. J. Remote Sens. 2002, 23, 1775–1798. [Google Scholar] [CrossRef]
  31. Chen, Y.; Shi, P.; Fung, T.; Wang, J.; Li, X. Object-oriented classification for urban land cover mapping with ASTER imagery. Int. J. Remote Sens. 2007, 28, 4645–4651. [Google Scholar] [CrossRef]
  32. Leinenkugel, P.; Kuenzer, C.; Oppelt, N.; Dech, S. Characterisation of land surface phenology and land cover based on moderate resolution satellite data in cloud prone areas—A novel product for the Mekong Basin. Remote Sen. Environ. 2013, 136, 180–198. [Google Scholar] [CrossRef]
  33. Vittek, M.; Brink, A.; Donnay, F.; Simonetti, D.; Desclée, B. Land cover change monitoring using landsat MSS/TM satellite image data over west Africa between 1975 and 1990. Remote Sens. 2014, 6, 658–676. [Google Scholar] [CrossRef] [Green Version]
  34. Jia, K.; Liang, S.; Wei, X.; Yao, Y.; Su, Y.; Jiang, B.; Wang, X. Land cover classification of landsat data with phenological features extracted from time series MODIS NDVI data. Remote Sens. 2014, 6, 11518–11532. [Google Scholar] [CrossRef] [Green Version]
  35. Soffianian, A.; Madanian, M. Monitoring land cover changes in Isfahan Province, Iran using Landsat satellite data. Environ. Monit. Assess. 2015, 187, 543. [Google Scholar] [CrossRef]
  36. Marie Mireille, N.; MMwangi, H.M.; Mwangi, J.K.; Mwangi Gathenya, J. Analysis of land use change and its impact on the hydrology of Kakia and Esamburmbur sub-watersheds of Narok county, Kenya. Hydrology 2019, 6, 86. [Google Scholar] [CrossRef] [Green Version]
  37. Matlhodi, B.; Kenabatho, P.K.; Parida, B.P.; Maphanyane, J.G. Evaluating land use and land cover change in the Gaborone dam catchment, Botswana, from 1984–2015 using GIS and remote sensing. Sustainability 2019, 11, 5174. [Google Scholar] [CrossRef] [Green Version]
  38. Mawenda, J.; Watanabe, T.; Avtar, R. An analysis of urban land use/land cover changes in Blantyre City, Southern Malawi (1994–2018). Sustainability 2020, 12, 2377. [Google Scholar] [CrossRef] [Green Version]
  39. Duan, C.; Shi, P.; Song, M.; Zhang, X.; Zong, N.; Zhou, C. Land use and land cover change in the Kailash Sacred Landscape of China. Sustainability 2019, 11, 1788. [Google Scholar] [CrossRef] [Green Version]
  40. Ojeda Olivares, E.A.; Sandoval Torres, S.; Belmonte Jiménez, S.I.; Campos Enríquez, J.O.; Zignol, F.; Reygadas, Y.; Tiefenbacher, J.P. Climate change, land use/land cover change, and population growth as drivers of groundwater depletion in the Central Valleys, Oaxaca, Mexico. Remote Sens. 2019, 11, 1290. [Google Scholar] [CrossRef] [Green Version]
  41. Nath, B.; Niu, Z.; Singh, R.P. Land Use and Land Cover changes, and environment and risk evaluation of Dujiangyan city (SW China) using remote sensing and GIS techniques. Sustainability 2018, 10, 4631. [Google Scholar] [CrossRef] [Green Version]
  42. Guerrero-Morales, J.; Fonseca, C.R.; Goméz-Albores, M.A.; Sampedro-Rosas, M.L.; Silva-Gómez, S.E. Proportional variation of potential groundwater recharge as a result of climate change and land-use: A study case in Mexico. Land 2020, 9, 364. [Google Scholar] [CrossRef]
  43. Mugo, R.; Waswa, R.; Nyaga, J.W.; Ndubi, A.; Adams, E.C.; Flores-Anderson, A.I. Quantifying land use land cover changes in the Lake Victoria basin using satellite remote sensing: The trends and drivers between 1985 and 2014. Remote Sens. 2020, 12, 2829. [Google Scholar] [CrossRef]
  44. Zhang, F.; Tiyip, T.; Feng, Z.D.; Kung, H.-T.; Johnson, V.C.; Ding, J.L.; Tashpolat, N.; Sawut, M.; Gui, D.W. Spatio-temporal patterns of land use/cover changes over the past 20 years in the middle reaches of the Tarim river, Xinjiang, China. Land Degrad. Dev. 2015, 26, 284–299. [Google Scholar] [CrossRef]
  45. Bakr, N.; Afifi, A.A. Quantifying land use/land cover change and its potential impact on rice production in the Northern Nile Delta, Egypt. Remote Sens. Appl. Soc. Environ. 2019, 13, 348–360. [Google Scholar] [CrossRef]
  46. Amano, H.; Iwasaki, Y. Land cover classification by integrating NDVI time series and GIS data to evaluate water circulation in Aso caldera, Japan. Int. J. Environ. Res. Public Health 2020, 17, 6605. [Google Scholar] [CrossRef]
  47. Stuckens, J.; Coppin, P.R.; Bauer, M.E. Integrating contextual information with per-pixel classification for improved land cover classification. Remote Sens. Environ. 2000, 71, 282–296. [Google Scholar] [CrossRef]
  48. Kagabu, M.; Matsunaga, M.; Ide, K.; Momoshima, N.; Shimada, J. Groundwater age determination using 85Kr and multiple age tracers (SF6, CFCs, and 3H) to elucidate regional groundwater flow systems. J. Hydrol. Reg. Stud. 2017, 12, 165–180. [Google Scholar] [CrossRef]
  49. Kumahara, Y.; Okada, S.; Inohara, K.; Kaneda, H.; Gotou, H.; Tsutsumi, H. 1:25,000 Active Fault Map Kumamoto; Revised Edition; Geospatial Information Authority of Japan: Ibaraki, Japan, 2017. [Google Scholar]
  50. Suzuki, Y.; Ishimura, D.; Kumaki, Y.; Kumahara, Y.; Chida, N.; Nakata, T.; Nakano, T. 1:25,000 Active Fault Map Aso; Geospatial Information Authority of Japan: Ibaraki, Japan, 2017. [Google Scholar]
  51. Gotou, H.; Inohara, K.; Kumahara, Y.; Koyama, T.; Chida, N.; Nakata, T. 1:25,000 Active Fault Map Yatsushiro; Revised Edition; Geospatial Information Authority of Japan: Ibaraki, Japan, 2018. [Google Scholar]
  52. Agriculture Land Information System. Available online: https://www.alis-ac.jp/ (accessed on 26 July 2021).
  53. Fundamental Geosapatial Data Download Service. Available online: https://fgd.gsi.go.jp/download/menu.php (accessed on 27 April 2021).
  54. The Results of the National Surveys on the Natural Environment. Available online: http://gis.biodic.go.jp/webgis/sc-023.html (accessed on 28 January 2020).
  55. Furukawa, F.; Morimoto, J.; Yoshimura, N.; Kaneko, M. Comparison of Conventional Change Detection Methodologies Using High-Resolution Imagery to Find Forest Damage Caused by Typhoons. Remote Sens. 2020, 12, 3242. [Google Scholar] [CrossRef]
  56. Yamazaki, F.; Liu, W. Remote sensing technologies for post-earthquake damage assessment: A case study on the 2016 Kumamoto earthquake. In Proceedings of the 6th ASIA Conference on Earthquake Engineering, Cebu City, Philippines, 22–24 September 2016. [Google Scholar]
  57. L3 Harris Geospatial Documentation Center. Available online: https://www.l3harrisgeospatial.com/docs/classification.html (accessed on 26 July 2021).
  58. Sueyoshi, E.; Tsudome, Y.; Baba, M. Survey of land use in the Kumamoto area using satellite images. Annu. Rep. Kumamoto City Environ. Res. Inst. 2005, 60–66. [Google Scholar]
  59. Map and Aerial Photo Viewing Service. Available online: https://mapps.gsi.go.jp/maplibSearch.do#1 (accessed on 13 July 2021).
  60. Ichikawa, T. Report on the Evaluation of Recharge Capacity by Paddy Fields in Kumamoto Plain and Aso Caldera; Tokai University: Kumamoto, Japan, 2021; 105p. [Google Scholar]
  61. Past Weather Data. Available online: https://www.data.jma.go.jp/obd/stats/etrn/index.php?prec_no=86&block_no=47819 &year =& month=&day=&view= (accessed on 16 February 2021).
  62. Lu, J.; Sun, G.; McNulty, S.G.; Amatya, D.M. A comparison of six potential evapotranspiration methods for regional use in the southeastern United States. J. Am. Water Resour. Assoc. 2005, 41, 621–633. [Google Scholar] [CrossRef]
  63. Zhang, F.; Kung, H.-T.; Johnson, V.C. Assessment of land-cover/land-use change and landscape patterns in the two national nature reserves of Ebinur Lake Watershed, Xinjiang, China. Sustainability 2017, 9, 724. [Google Scholar] [CrossRef] [Green Version]
  64. High-Resolution Land Use and Land Cover Map of Japan (Released in March 2018/Version 18.03). Available online: https://www.eorc.jaxa.jp/ALOS/en/lulc/lulc_index.htm (accessed on 2 August 2021).
  65. FY2021 Vision for Strengthening Profitability of Paddy Fields in Kumamoto Prefecture. Available online: https://www.pref.kumamoto.jp/soshiki/76/102900.html (accessed on 11 October 2021).
  66. Matsumoto, M.; Shimokawa, E.; Jitousono, T. A natural revegetation process on shallow landslide scars. J. Jpn. For. Soc. 1999, 81, 65–73. [Google Scholar]
  67. Conservation Measures Guideline for Groundwater in Kumamoto City. Available online: https://www.city.kumamoto.jp/kankyo/common/UploadFileDsp.aspx?c_id=5&id=20309&set_doc=1&set_file_field=1 (accessed on 16 February 2021).
  68. Maruyama, A.; Ikawa, H. Impacts of the 2016 Kumamoto earthquake on water-table reduction rate in paddy fields. Mem. Natl. Agric. Rec. Cent. Kyushu Okinawa Reg. 2019, 95, 10–17. [Google Scholar]
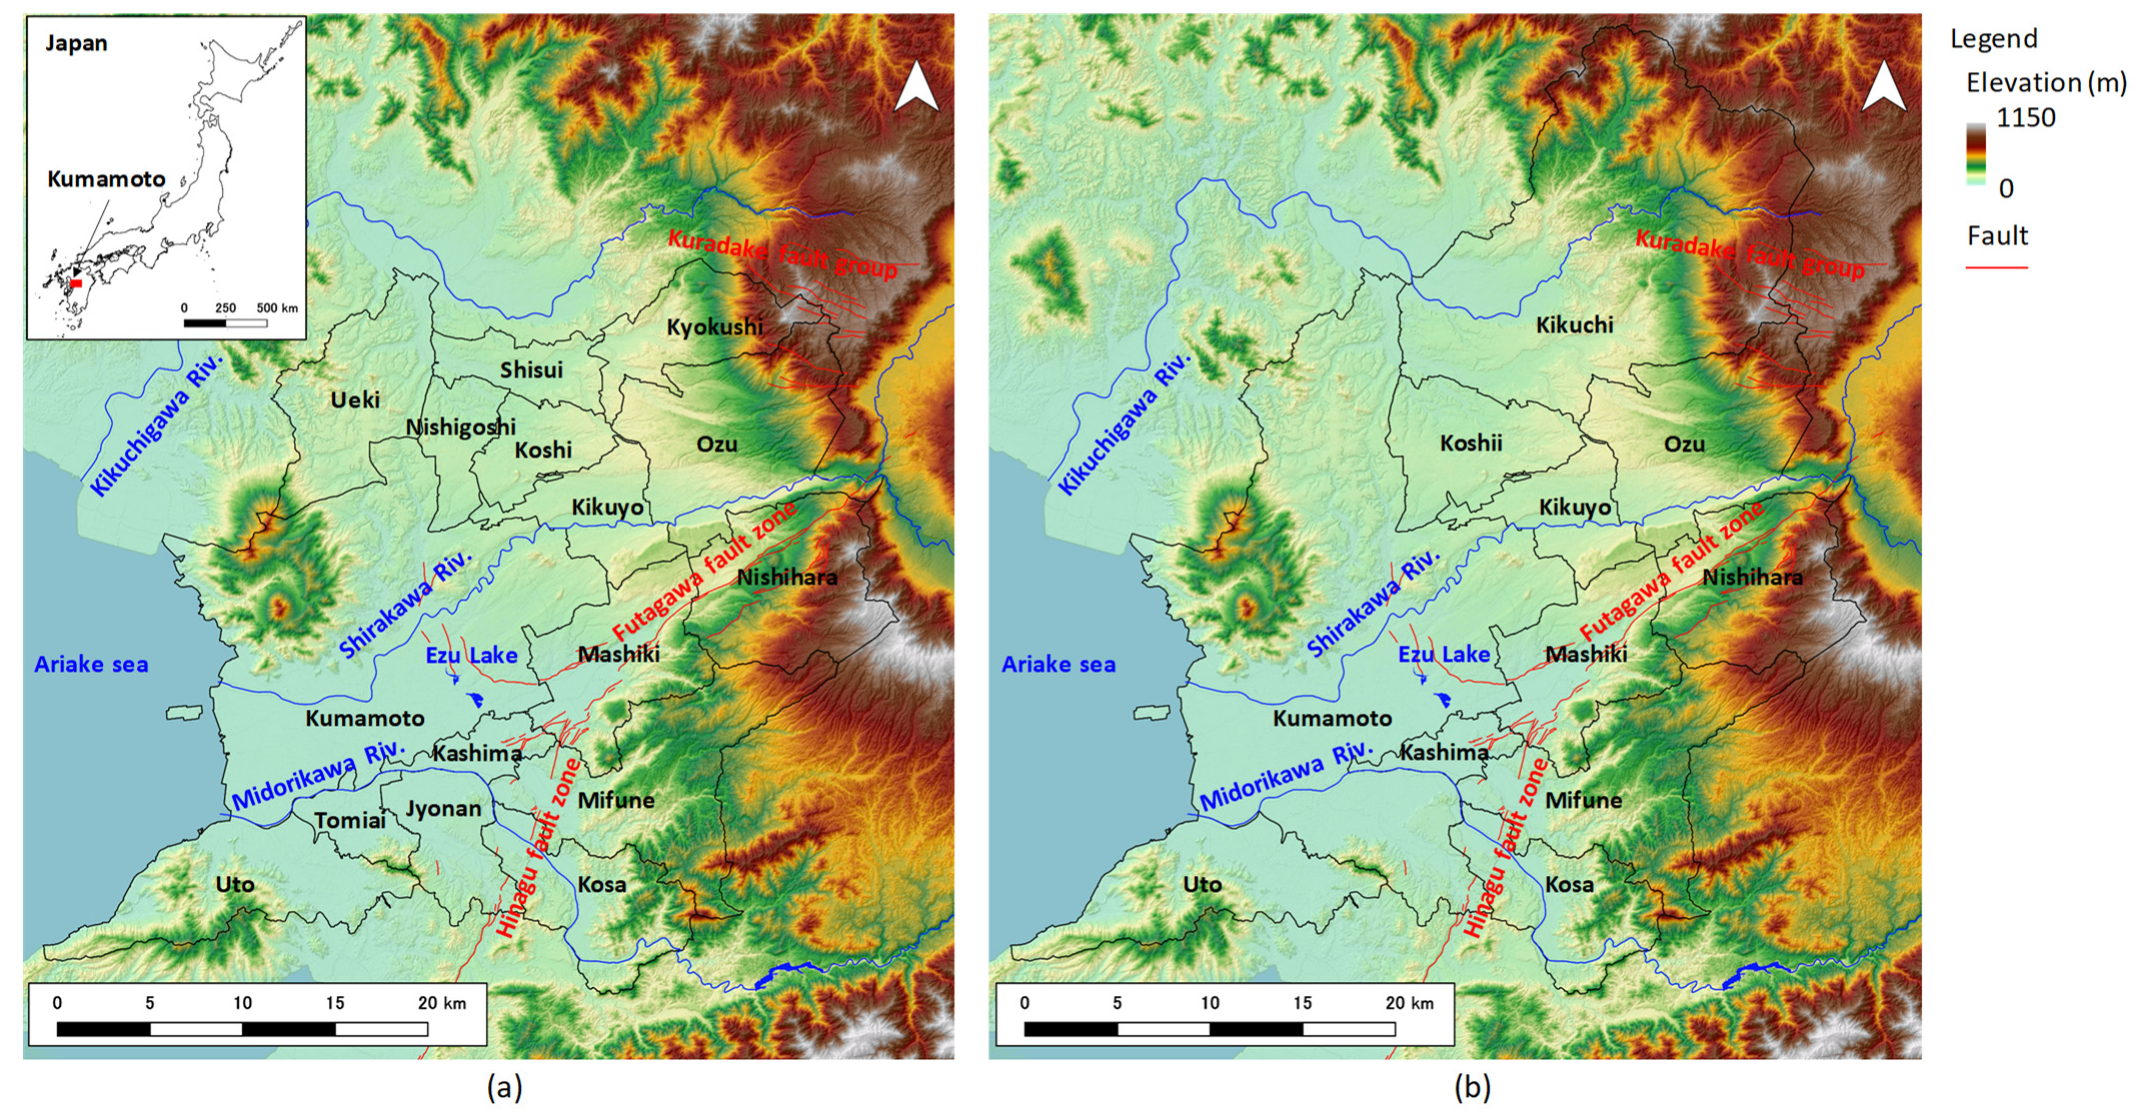
Figure 1. Kumamoto City and surrounding municipal boundaries: (a) 16 former municipalities (Kumamoto area) and (b) 11 current municipalities. The faults in the Kumamoto area can be mainly classified into Futagawa fault zone, Hinagu fault zone, and Kuradake fault group. These fault lines refer to Kumahara et al. [49], Suzuki et al. [50], and Gotou et al. [51]. The difference between two maps (a,b), is Kikuchi City on the upper right of (b). Kikuchi City consolidated Shisui Town and Kyokushi Village shown in (a). Therefore, the area of (b) is wider than that of (a) due to adding Kikuchi City. Land cover classification was performed in the wider area of (b) in order to compare classification results and statistical data of paddy fields as shown in later because the statistical data was recorded for each of the 11 current municipalities. The groundwater recharge was calculated in the narrower area of (a) sharing a large groundwater basin. Namely, we used different areas to classify land cover and calculate the groundwater recharge. However, there is no problem because land covers were classified for all target areas to calculate groundwater recharge.
Sustainability 14 00545 g001
Figure 2. Grasslands of different land use in Nishihara Village in satellite image of 21 March 2016. The upper grasslands show dark brown due to the open burning that took place in March. The open burning is a long standing traditional event conducted for the main purpose of exterminating harmful insects, preventing the transition of grasslands to forests, and conservation of biodiversity. On the other hand, the lower grasslands, which are not burned and used for grazing and mowing, show a light green color. Even in grasslands, the colors in two areas are completely different.
Sustainability 14 00545 g002
Figure 3. Seasonal changes in average NDVI values for each land cover type in 2016. Although “Forest” and “Lawn and weed” showed similar seasonal changes, increased NDVI values from 21 March to 29 July varied greatly. NDVI values of “Paddy field” showed different seasonal changes from other land cover types and “Plowed field”. NDVI value of “Bare land” is the second smallest and showed a slight increase from 21 March to 29 July. NDVI value of “Building and road” was the lowest and almost the same in three seasonal images. Since the two categories, “Building and road” and “Bare land”, do not change seasonally, they are not influenced by the season of observed images.
Sustainability 14 00545 g003
Figure 4. Changes in paddy fields for WCS from (a,c) 29 July to (b,d) 2 November in mid-stream area of (a,b) Shirakawa River and (c,d) others. Red polygons are paddy fields where WCS is grown.
Sustainability 14 00545 g004
Figure 5. Cultivation calendar for paddy fields. First, paddy fields are flooded from 20 June to 17 July. Then interruptive irrigation and mid-summer drainage last for 6 and 8 days, respectively. After that, paddy fields are flooded again until 14 September. Finally, interruptive irrigation is carried out for 21 days. Since paddy fields are not always flooded during the mid-summer drainage and interruptive irrigation period, it is important to calculate the groundwater recharge according to the cultivation calendar.
Sustainability 14 00545 g005
Figure 6. Smoothing effects with different kernel filter sizes: (a) 3 × 3 and (b) 21 × 21. With 3 × 3 filter, there is much noise. Larger 21 × 21 filter removes noise and makes each land cover coherent.
Sustainability 14 00545 g006
Figure 7. Changes in (a) sum of squared residuals and (b) absolute value of residual sum for paddy fields with different kernel filter size. Residual values were calculated based on classification results and statistical data in 11 current municipalities (Figure 1b). Statistical data of Kumamoto City did not include enough on three towns (Ueki, Jonan, and Tomiai) integrated into Kumamoto City, so their domain and data were excluded.
Sustainability 14 00545 g007
Figure 8. Relationship of area of paddy fields between statistical data and classification result with 21 × 21 kernel filter. Each plot corresponds to 11 current municipalities in Figure 1b.
Sustainability 14 00545 g008
Figure 9. (a) Land cover classification result and (b) JAXA’s map, provided by 30 m high-resolution land use and land cover map of Japan (2014–2016) (ver. 18.03, 10 categories) (Japan Aerospace Exploration Agency) in 11 current municipalities (Figure 1b), Japan in 2016. Since Jaxa’s map represents average land use and land cover from 2014 to 2016, it does not represent changes due to earthquake and heavy rainfall. Owing to the farmland mask and GIS data, our classification results represent a significantly different map compared to JAXA’s map in the agricultural area.
Sustainability 14 00545 g009
Table 1. Infiltration coefficient for each land cover type. Since most of the rainfall in the mountainous area is discharged into rivers by direct runoff and base flow, the lowest infiltration coefficient is set on grassland and forest in mountainous area.
Land Cover TypeInfiltration Coefficient
Plowed field0.7
Grassland and forest in mountainous area0.2
Grassland and forest outside of mountainous area0.5
Table 2. Confusion matrix between classification results and ground truth data in 11 current municipalities (Figure 1b), Japan in 2016. Ground truth data at a total of 1923 points were compared with classification results.
Land CoverPaddy
Field
Plowed FieldLawn and WeedForestBuilding and RoadBare LandTotalProducer’s Accuracy (%)
Paddy field14836001018580.0
Plowed field12211009023290.9
Lawn and weed00633014411156.8
Forest00493610195198.4
Building and road17716394042592.7
Bare land00223121963.2
Total16125476984431171923
User’s
accuracy (%)
91.983.182.995.191.470.6
Table 3. Area of each land cover category in Kumamoto area (Figure 1a), Japan in 2016. The area of each land cover was determined by using Add Geometry Attributes of Geoprocessing tool in ArcGIS Pro 2.8.1 (Esri Inc.).
Paddy
Field
Plowed FieldDamaged Paddy FieldGrasslandLawn and WeedForestBuilding and RoadBare LandWater BodyTotal
km284.85143.750.9116.0745.08452.68261.5012.7023.041040.58
%8.1513.810.091.544.3343.5025.131.222.2199.98
Table 4. Groundwater recharge amounts from recharge area in Kumamoto area (Figure 1a), Japan in 2016.
Paddy Field in Irrigation SeasonPaddy Field
in Non-
Irrigation Season
Plowed FieldDamaged Paddy FieldGrasslandLawn and WeedForestTotal
Million m3186.7667.90239.901.367.1553.01201.48757.56
%24.658.9631.670.180.947.0026.60100.00
Table 5. Groundwater recharge amount from recharge area in the absence of land cover change due to natural disasters in Kumamoto area (Figure 1a), Japan in 2016.
Paddy Field in Irrigation SeasonPaddy Field
in Non-
Irrigation Season
Plowed FieldDamaged Paddy FieldGrasslandLawn and WeedForestTotal
Million m3189.6968.46239.900.007.1653.01201.64759.86
%24.969.0131.570.000.946.9826.54100.00
Publisher’s Note: MDPI stays neutral with regard to jurisdictional claims in published maps and institutional affiliations.