Article

Heat Flux and Thermal Characteristics of Electrically Heated Windows: A Case Study

Department of Architecture Engineering, Hanbat National University, Daejeon 34158, Korea
*
Author to whom correspondence should be addressed.
Sustainability 2022, 14(1), 481; https://doi.org/10.3390/su14010481
Submission received: 18 November 2021 / Revised: 18 December 2021 / Accepted: 30 December 2021 / Published: 3 January 2022

Abstract

:
Energy loss through windows can be high relatively compared to other opaque surfaces because insulation performance of fenestration parts is lower in the building envelope. Electrically heated window systems are used to improve the indoor environment, prevent condensation, and increase building energy efficiency. The purpose of this study is to analyze the thermal behaviors of a heated window under a field experiment condition. Experiments were conducted during the winter season (i.e., January and February) with the energy-efficient house that residents occupy. To collect measured data from the experimental house, temperature and heat flux meter sensors were used for the analysis of heat flow patterns. Such measured data were used to calculate heat gain ratios and compare temperature and dew point distribution profiles of heated windows with input power values under the changed condition in the operating temperature of the heated glazing. Results from this study indicated that the input average heat gain ratio was analyzed to be 75.2% in the south-facing and 83.8% in the north-facing at nighttime. Additionally, compared to January, reducing the operating temperature of the heated glazing by 3 °C decreased the input energy in February by 44% and 41% for the south-facing and north-facing windows, respectively. Through such field measurement study, various interesting results that could not be found in controlled laboratory chamber conditions were captured, indicating that the necessity of establishing various control strategies should be considered for the development and commercialization of heated windows.

1. Introduction

Windows are one of the most important architectural elements in a building and an important factor in building energy performance. Windows play a crucial role in determining visual comfort by providing views to the outside and spatial comfort through ventilation for the occupants [1] and introducing natural light. Today, curtain walls are becoming increasingly popular for aesthetic reasons, as most people prefer office space with a view [2]. In typical residential buildings, large windows or balcony windows without railings are often installed in living rooms for visual comfort. Large windows are commonly designed on the south-facing walls of passive houses in the Northern Hemisphere to obtain as much solar heat as possible [3,4].
However, an increase in the relative window area causes various problems. Condensation on the glazing surface is relatively frequent because energy loss through windows is more than 30% which is the most vulnerable part of the building envelope to poor heat insulation [5]. Condensation mainly occurs when hot and humid air in the indoor space comes into contact with an inner window surface that is below the dew point [6]; this reduces the scenic views and visibility, which are the most important functions of a window [7]. For this reason, occupants report feeling more uncomfortable with condensation than heat loss [8]. An increase in the relative window area also means an increase in the close area of the window frame, which is highly related to energy loss in the building envelope [9,10]. This is the reason various studies are being conducted to reduce energy loss by window frames [11,12,13] However, the most significant problem with large windows is the formation of cold indoor airflow in winter due to radiation transfer through the cold glazing surface caused by cold drafts, which lowers the thermal comfort levels of occupants [14,15]. To address this problem, an appropriate selection of various high-performance windows is crucial [16]. Malvoni et al. [17], by emphasizing the importance of a window design strategy for high-energy performance building, analyzed heat loss viathe characteristics of the window frame through the thermal performance evaluation of the window frame according to UNI EN ISO 10077-2. As alternatives to typical window glazing, Low-e coatings, gas-filled windows, vacuum windows, and double- or triple-glazed windows can be used [18,19,20,21]. Additionally, heating technology can be combined with these glazing types to more effectively address the problems mentioned above.
Heated glazing, where the glass surface is heated by applying electric power to the electrically conductive coating on one side of the glass, is mainly used to prevent condensation in buildings and other applications, such as food storage and automobiles, and aviation [22]. In previous research, Kurnitski et al. [23] analyzed the efficiency and practical application of heated glazing and confirmed that windows with high heat insulation exhibit high efficiency and depend on the heat flux from the outer surface (U-value). Moreau et al. [24] developed a building energy analysis model for heated glazing and found that energy saving was possible via the installation of heated glazing on the northern or eastern sides, contrary to the expectation that heated glazing would increase building energy consumption. Cakó et al. [25] researched thermal comfort according to the measured distance from heated glazing using predicted mean vote measurements and an experimental manikin, and found that the dissatisfaction index was less than 5% when the surface temperature was present approximately 40 °C or higher. Furthermore, Kaboré et al. [26] emphasized the various benefits of heated glazing and proved its ability to reduce heating energy by up to 13% through experiments.
Nevertheless, further research is required to improve functional windows’ technical capability and marketability to balance the aforementioned benefits and limitations [27]. Moreover, research on the practical application of such operating windows is required to integrate high-performance window systems and large window areas in modern building interiors [28]. However, few studies have analyzed the application of heated glazing to actual buildings; thus, additional research is still required to satisfy the aesthetic, thermal, and visual comfort functions of heated windows in buildings. Therefore, this study analyzes the heat flux patterns of heated glazing in a typical residential building under actual operating conditions instead of limited experimental conditions, which is important for evaluating the optimal control method and design of heated glazing. Experiments were performed in a detached house with occupants in Gwangju-si, Gyeonggi-do, South Korea (latitude: 36°, longitude: 127°), with heated glazing installed on the southern and northern sides of the house. The experiments include the influence of internal heating elements, such as human bodies, lighting, electrical devices, cooking, and heating. Experiments were conducted for 2 months from January to February 2021. The experiment in January was conducted under different heated glazing operating temperatures, whereas the experiment in February was performed at a fixed operating temperature. The main purpose of this study was first to understand the characteristics of heated windows through the comparative analysis of thermal characteristics and energy input requirement of heated windows according to the set temperature. In order to find a way to maximize window efficiency, it was judged that it is a very basic and essential research step to analyze the basic heat flow according to the surrounding conditions.

2. Methodology

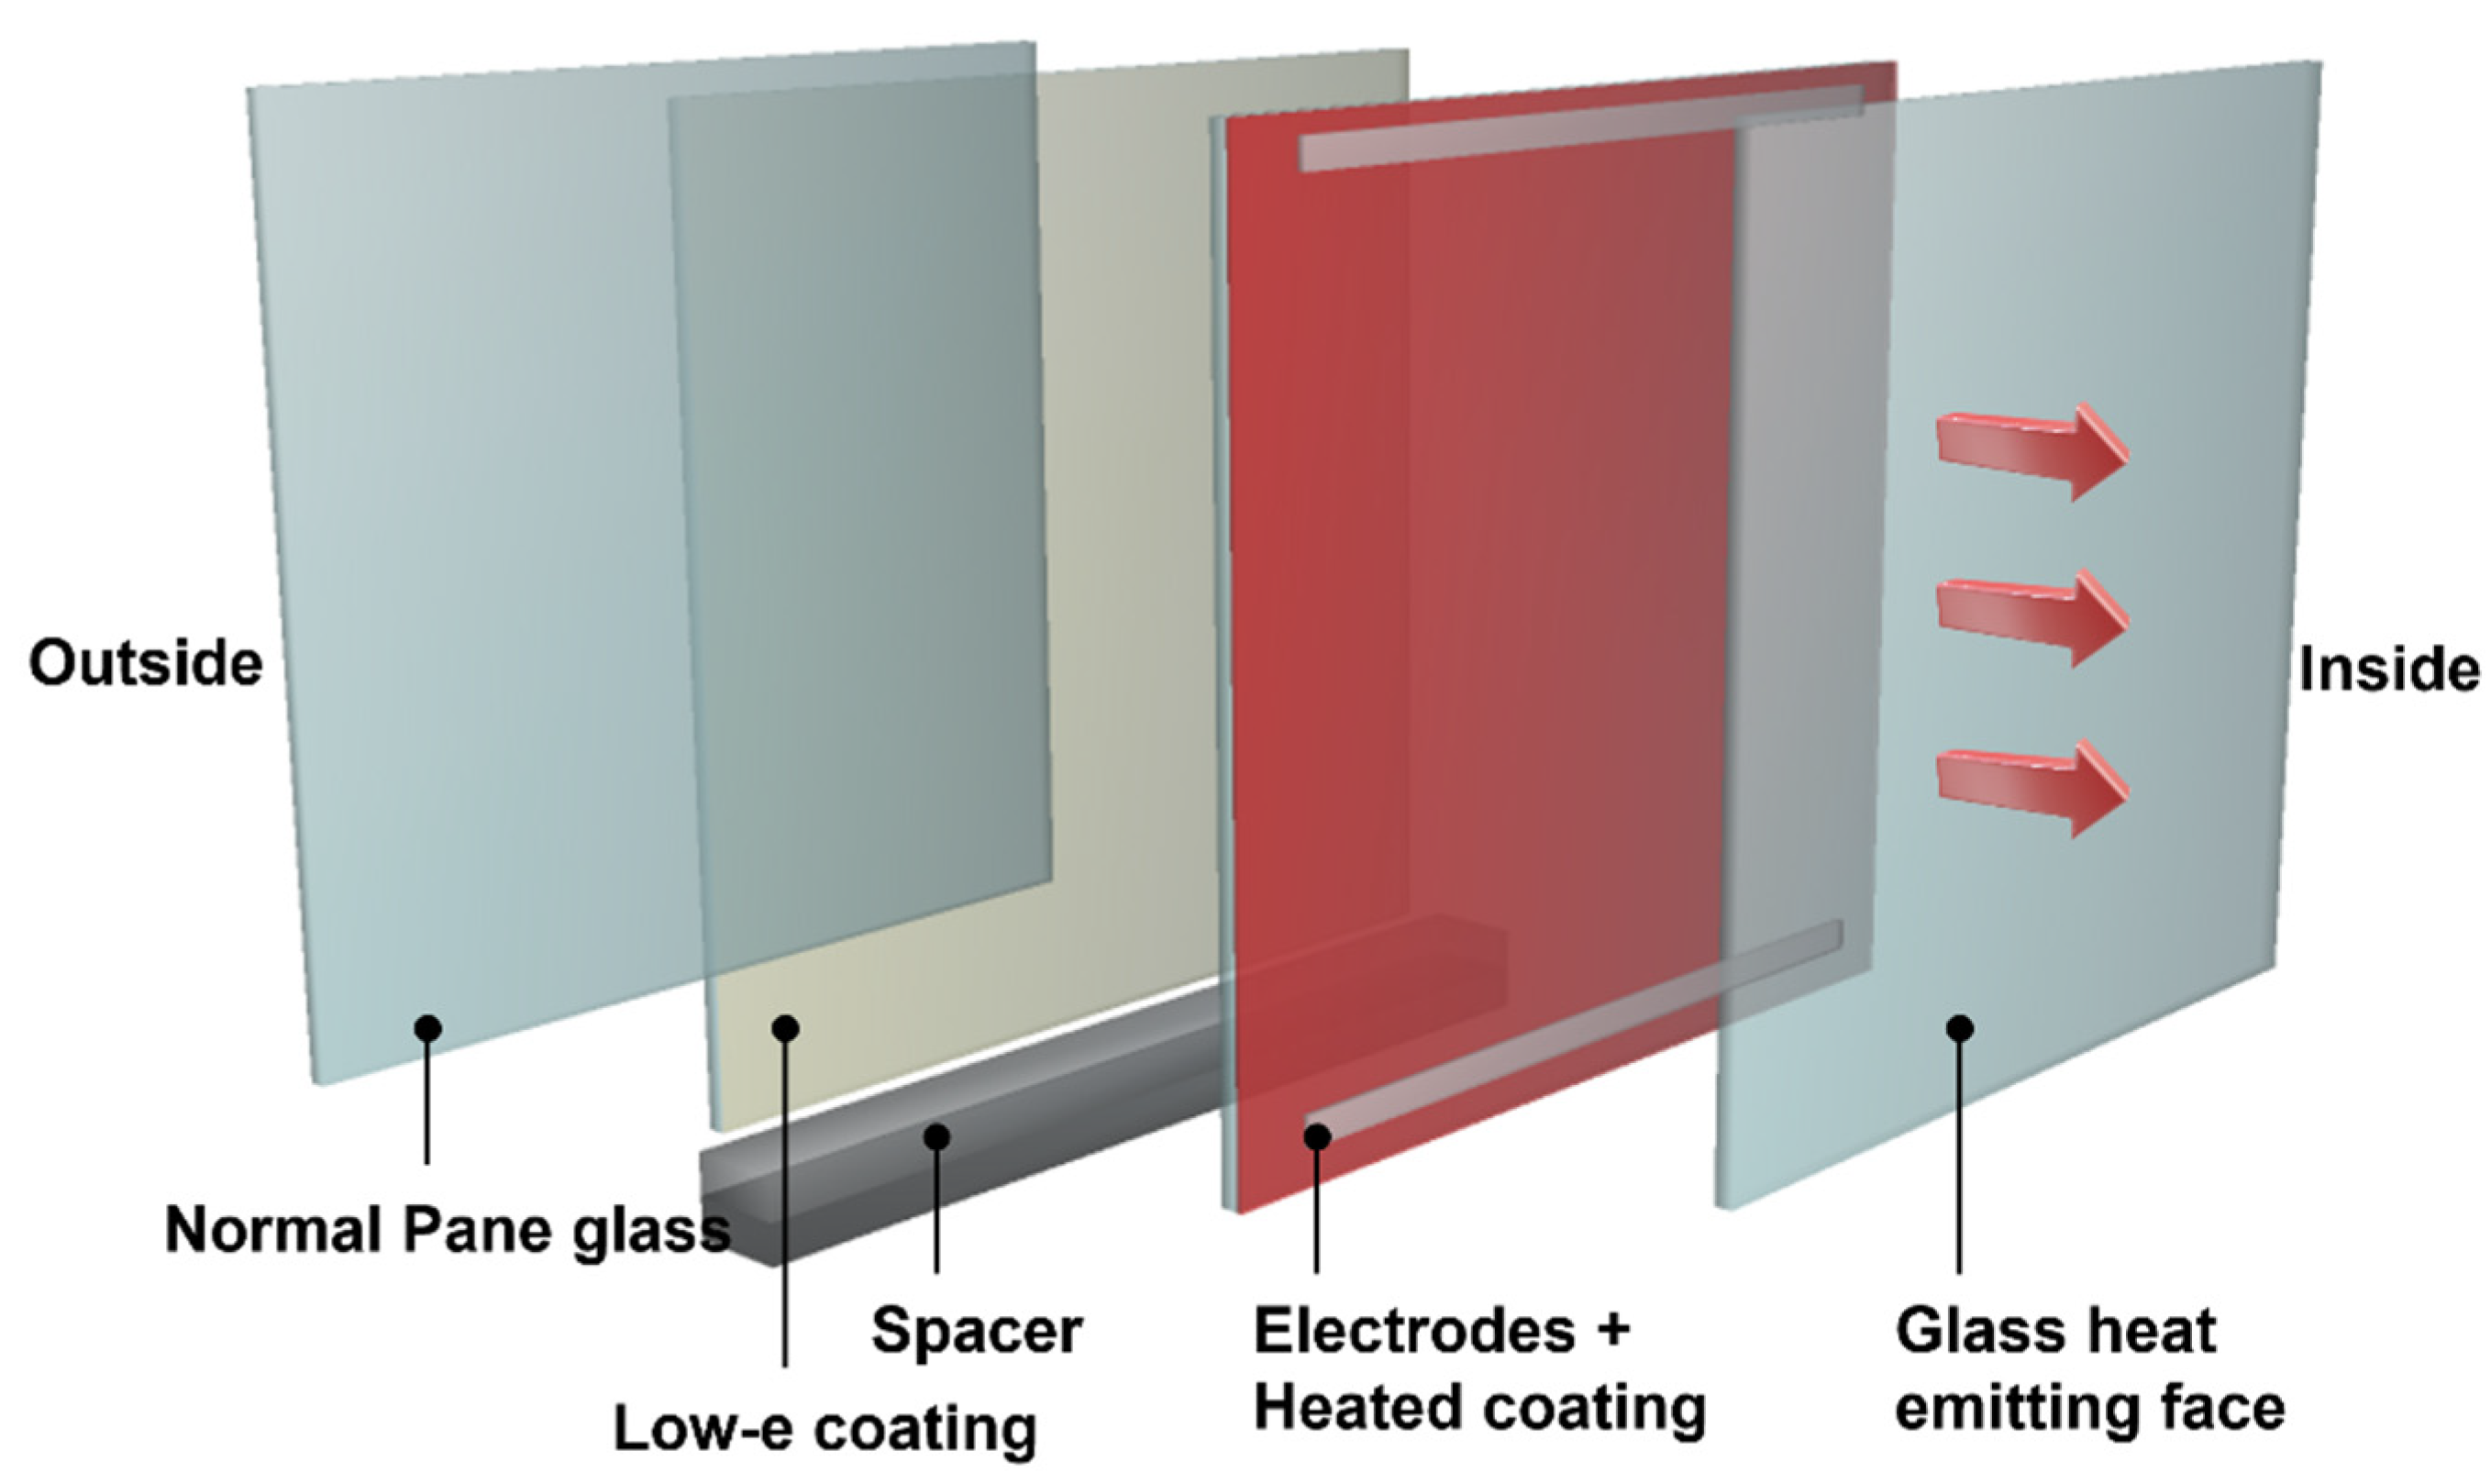
2.1. Overview of Heated Window Systems

Heated glazing methods mainly involve inserting either heating film or heating wires and a conductive film coating. The transparent conductive film, a representative heating film, is made by depositing silver nanowire (AgNW) on the base film [29]. It is used for display glass due to its high transmissivity and is generally utilized in fields that operate with a low input voltage [30]. Conversely, heated glazing based on electrically resistant nichrome heating wires is mainly used to prevent frost on the rear glass of automobiles. In this study, we employed heated glazing made by depositing a transparent conductive oxide film consisting of fluorine tin oxide (FTO), heated through sheet resistance by forming a heating layer on one side of the glazing and connecting electrodes [31]. The basic structure of the FTO-coated heated window is shown in Figure 1. Glass with a Low-e coating was used to minimize heat flow to the outside, and the cavity was filled with gas with low thermal conductivity, that is, argon. Recently, the related research for quality improvement of graphene materials is being actively conducted [32], its utilization is expected to be very high, and the possibility of practical use has been proven through producing a uniform large-area graphene glass [33]. Graphene is emerging as a core material for the development of heated windows due to its high utility in electrical applications such as exceptional conductivity and thermal superiority [34,35].

2.2. Method and Process

Figure 2 depicts the flow chart of the analysis process for this study. First, temperature sensors and heat flow meters were installed for each location, and pre-testing was performed to check the operation of the sensor. Network function providing equipment and internet router was installed to enable real-time monitoring and data collection. At the same time as the experiment, the outdoor air temperature and irradiance data were collected and then used for the analysis of thermal behaviors and heat flow patterns.

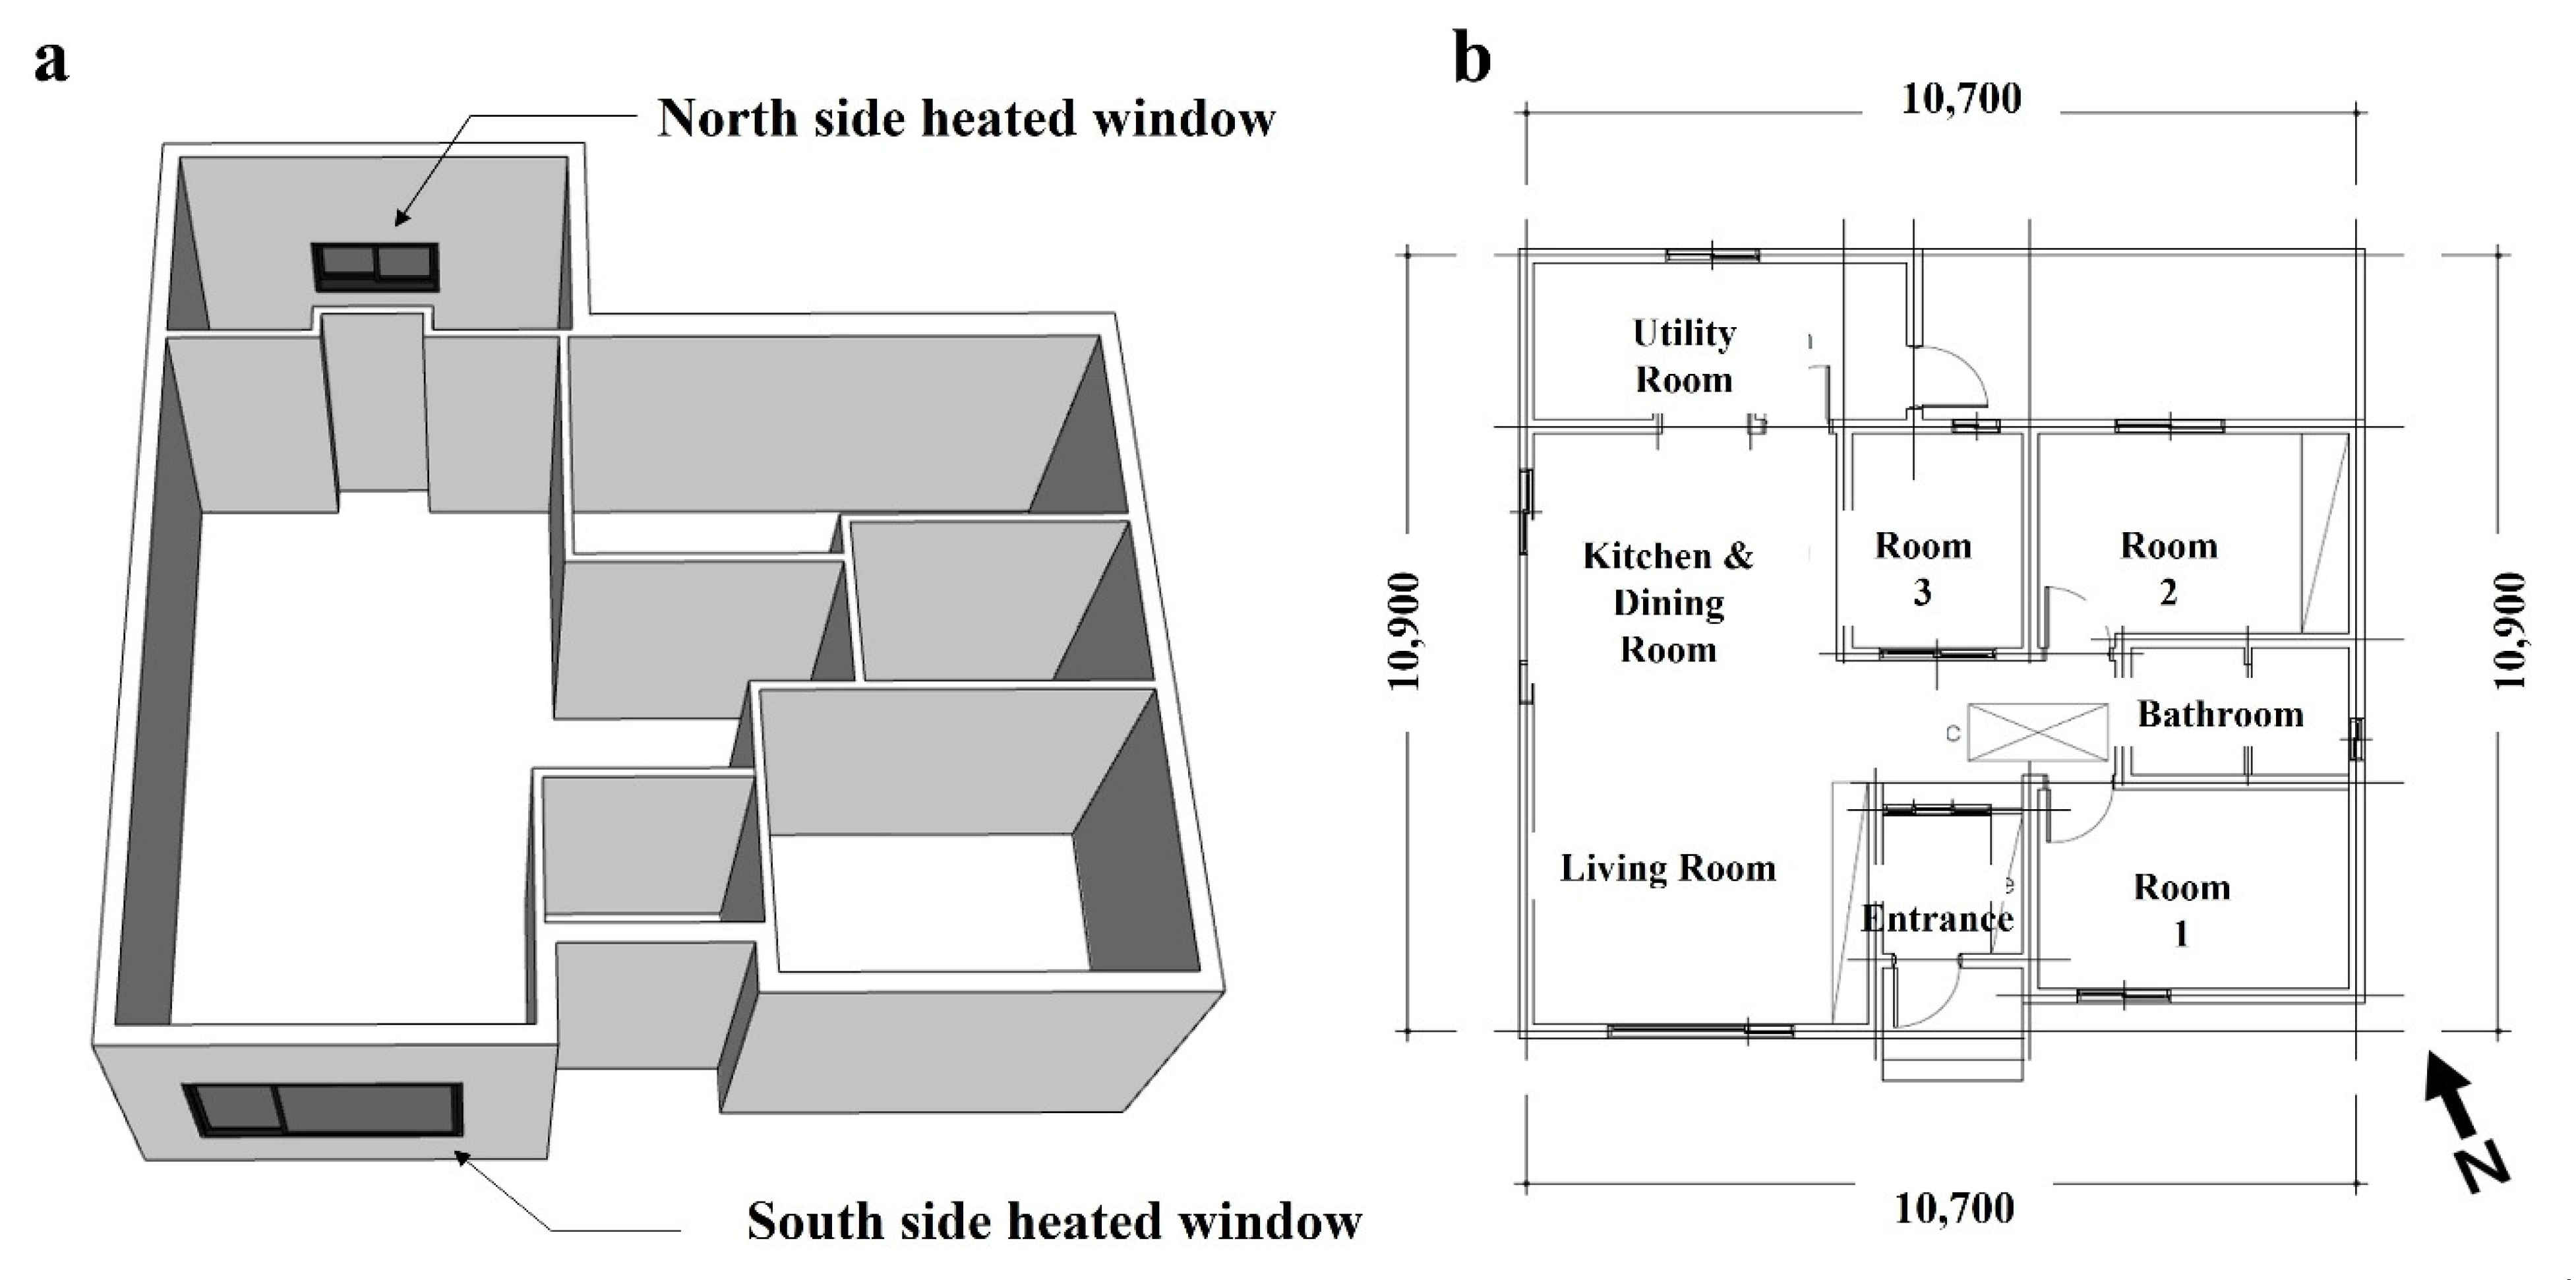
2.3. Description of the Heated Window System Applied to a Zero-Energy House

A residential building located in Gwangju-si, Gyeonggi-do, Korea was used as a case study for the experiments. This building is an all-electric zero-energy detached house with a floor area of approximately 98 m2. Detailed technical information on this building and the applied passive and active elements can be found in Lee et al. [36]. The experiments were performed in winter to analyze the heat flux patterns of the heated windows. The operation of the heated window was controlled according to the temperature set directly by the user.
The heated glazing analyzed in this study was located in one window in the living room on the south-facing side of the house and in one window in the utility room on the north-facing side of the house, as shown in Figure 3. As the experimental environment of the south-facing window was the living room and kitchen space, it was affected by floor heating, intermittent cooking, lighting, and heat from human bodies. The utility room on the northern side of the house was affected by a small amount of heat from the refrigerator but no floor heating and was used for storage. The heating energy accounted for approximately 41% (3071 kWh/a) of the total annual energy consumption of the target house (7483 kWh/a). During the experimental period, the average indoor air temperature was maintained at 28 °C or higher, which was somewhat higher than the generally recommended indoor temperature in winter (20 °C). Figure 4 shows the experimental setup and a schematic diagram of the layers in the target windows. The south-facing window area was 4.32 m2 (2.4 m ∗ 1.8 m) and that of the north-facing window was 1.08 m2 (1.2 m ∗ 0.9 m). The applied heated window combined low-e coated glass with a vacuum window, exhibiting significant insulation performance with a U-value of 0.532 W/m2·K. To analyze the heat flow of the heated windows, heat flux meters were installed at the center of the inner and outer surfaces of the south-facing and north-facing windows.

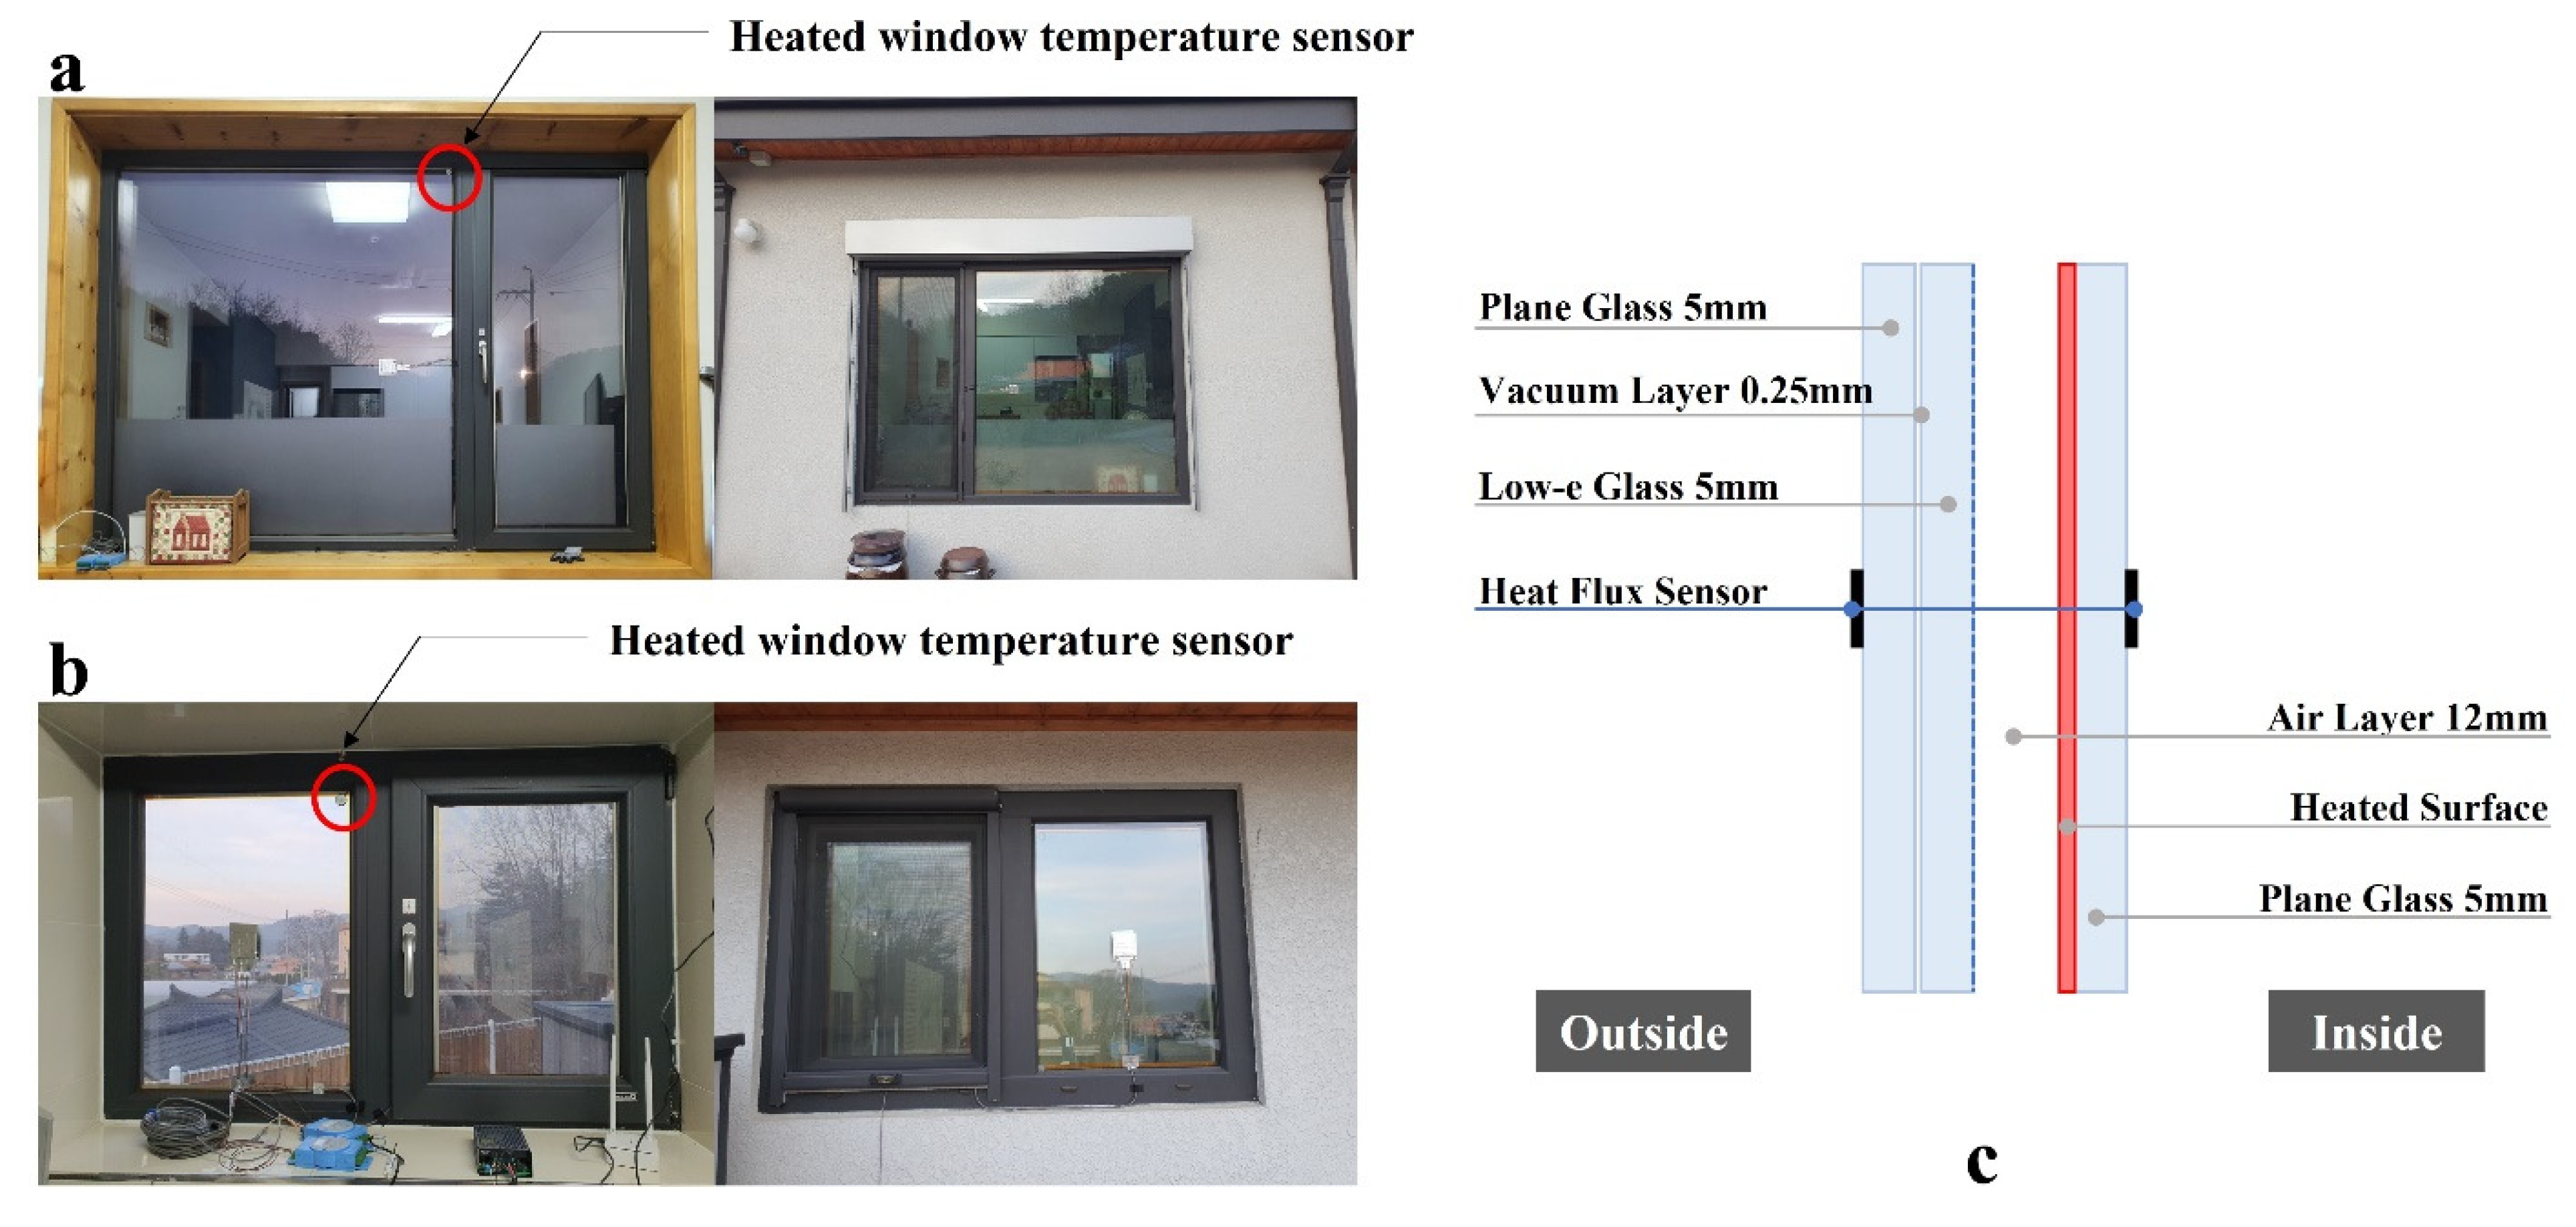
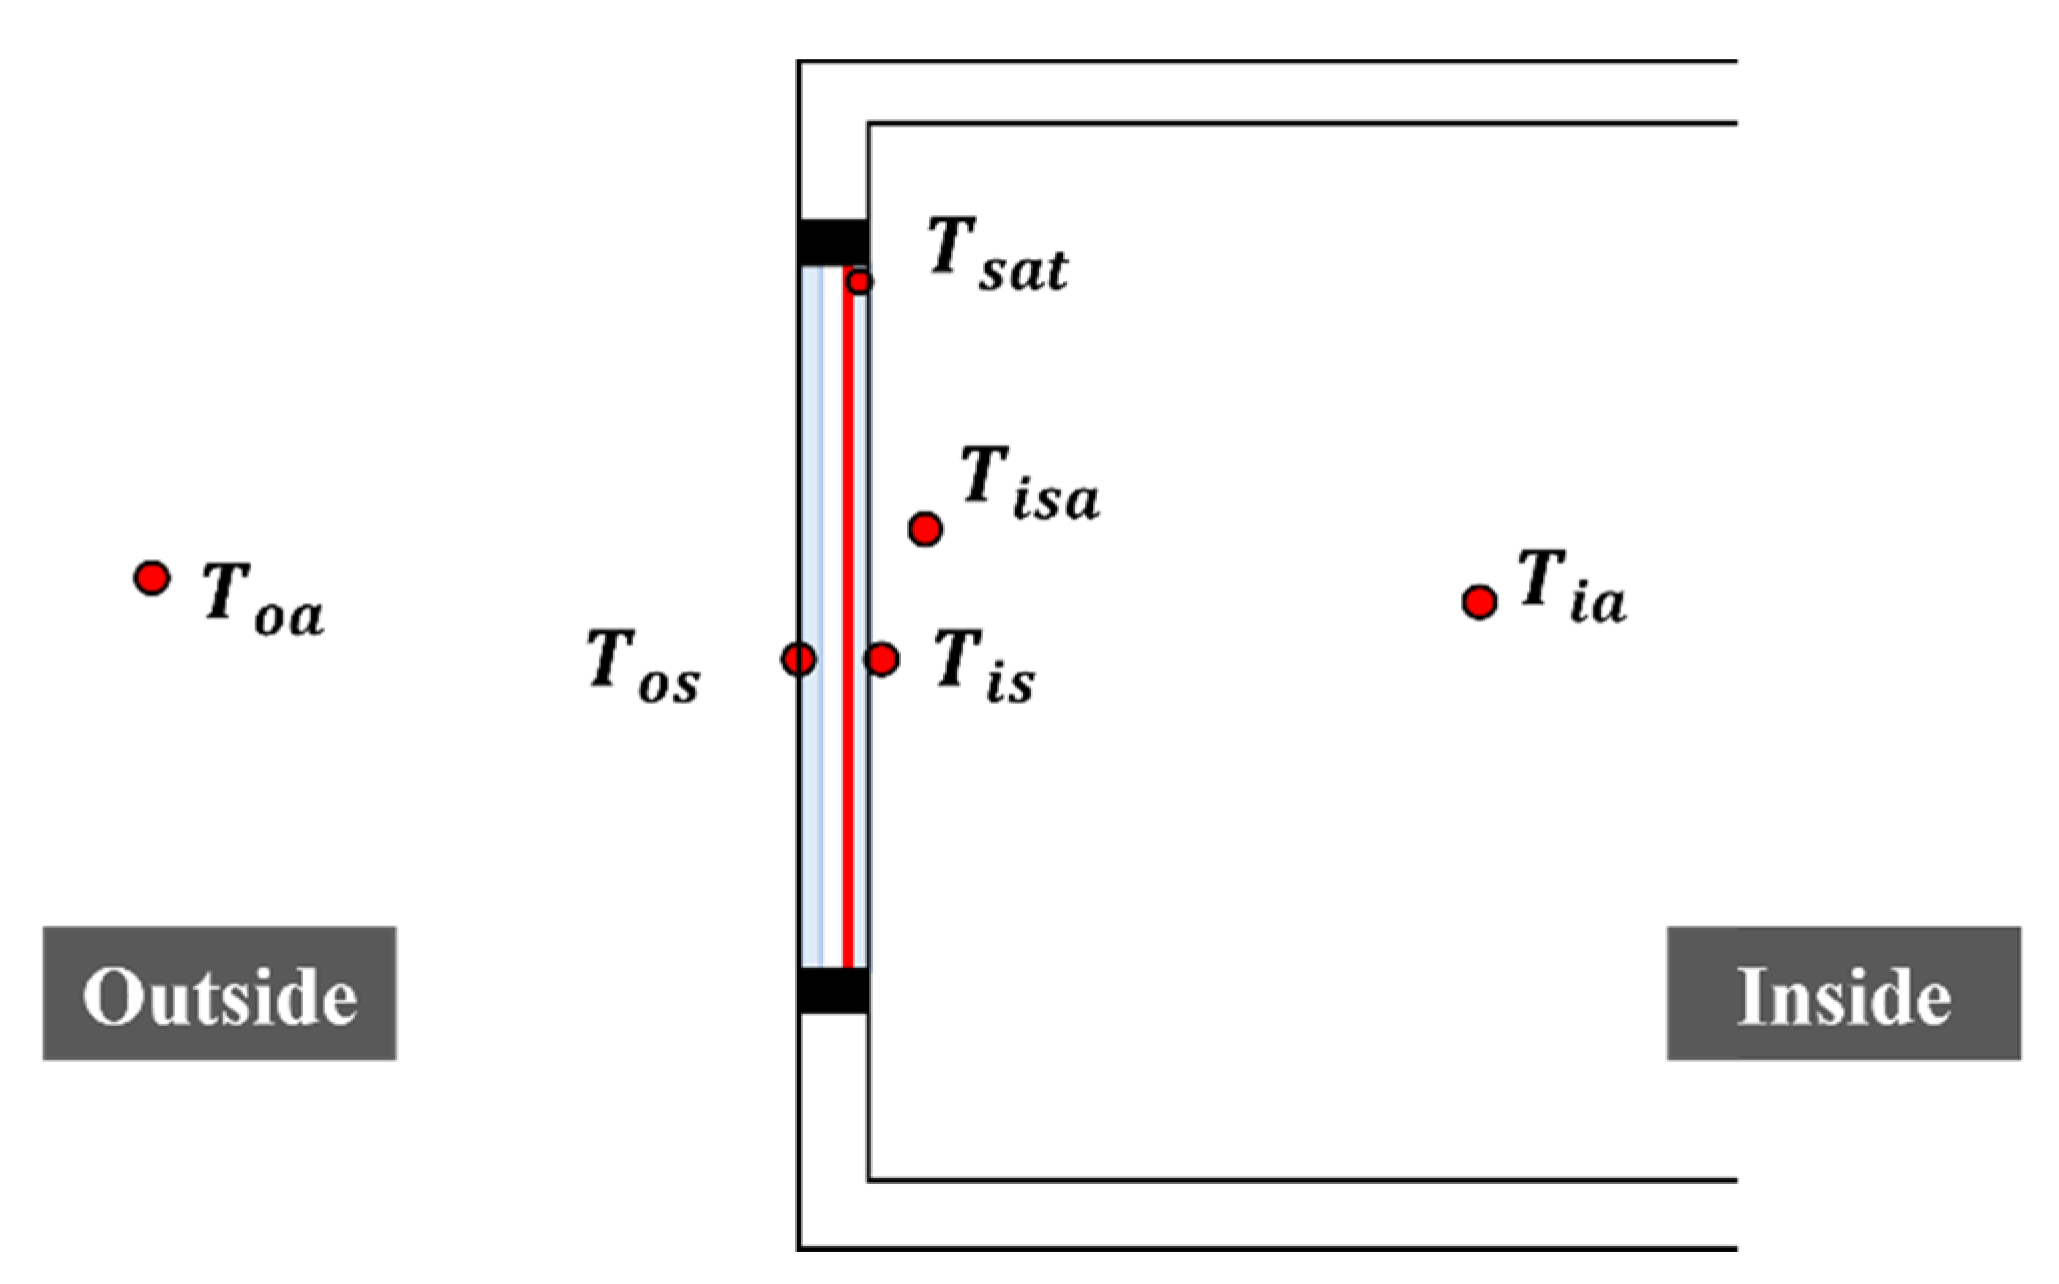
2.4. Temperature and Heat Flux Measurement

Figure 5 shows the temperature measurement points. The glass’s inner and outer surface temperatures were measured, and each room’s air temperature and relative humidity were also considered for the measurement. In addition, a temperature sensor was installed to measure the air temperature at a distance of 5 cm from the indoor glass surface, that is, the radiation temperature from the surface of the heated window. T h w s , the temperature sensor for controlling the heated window was located at the upper edge of each window. Table 1 shows the EKO heat flux meter (MF-200) [37] used in the experiments. The heat flow of this sensor was calculated using Equation (1).
Q = E/K
where Q is the heat flow flux (W/m2), E is the output voltage from the sensor (mV), and K is the sensitivity of the sensor (mV/W∙m−2).

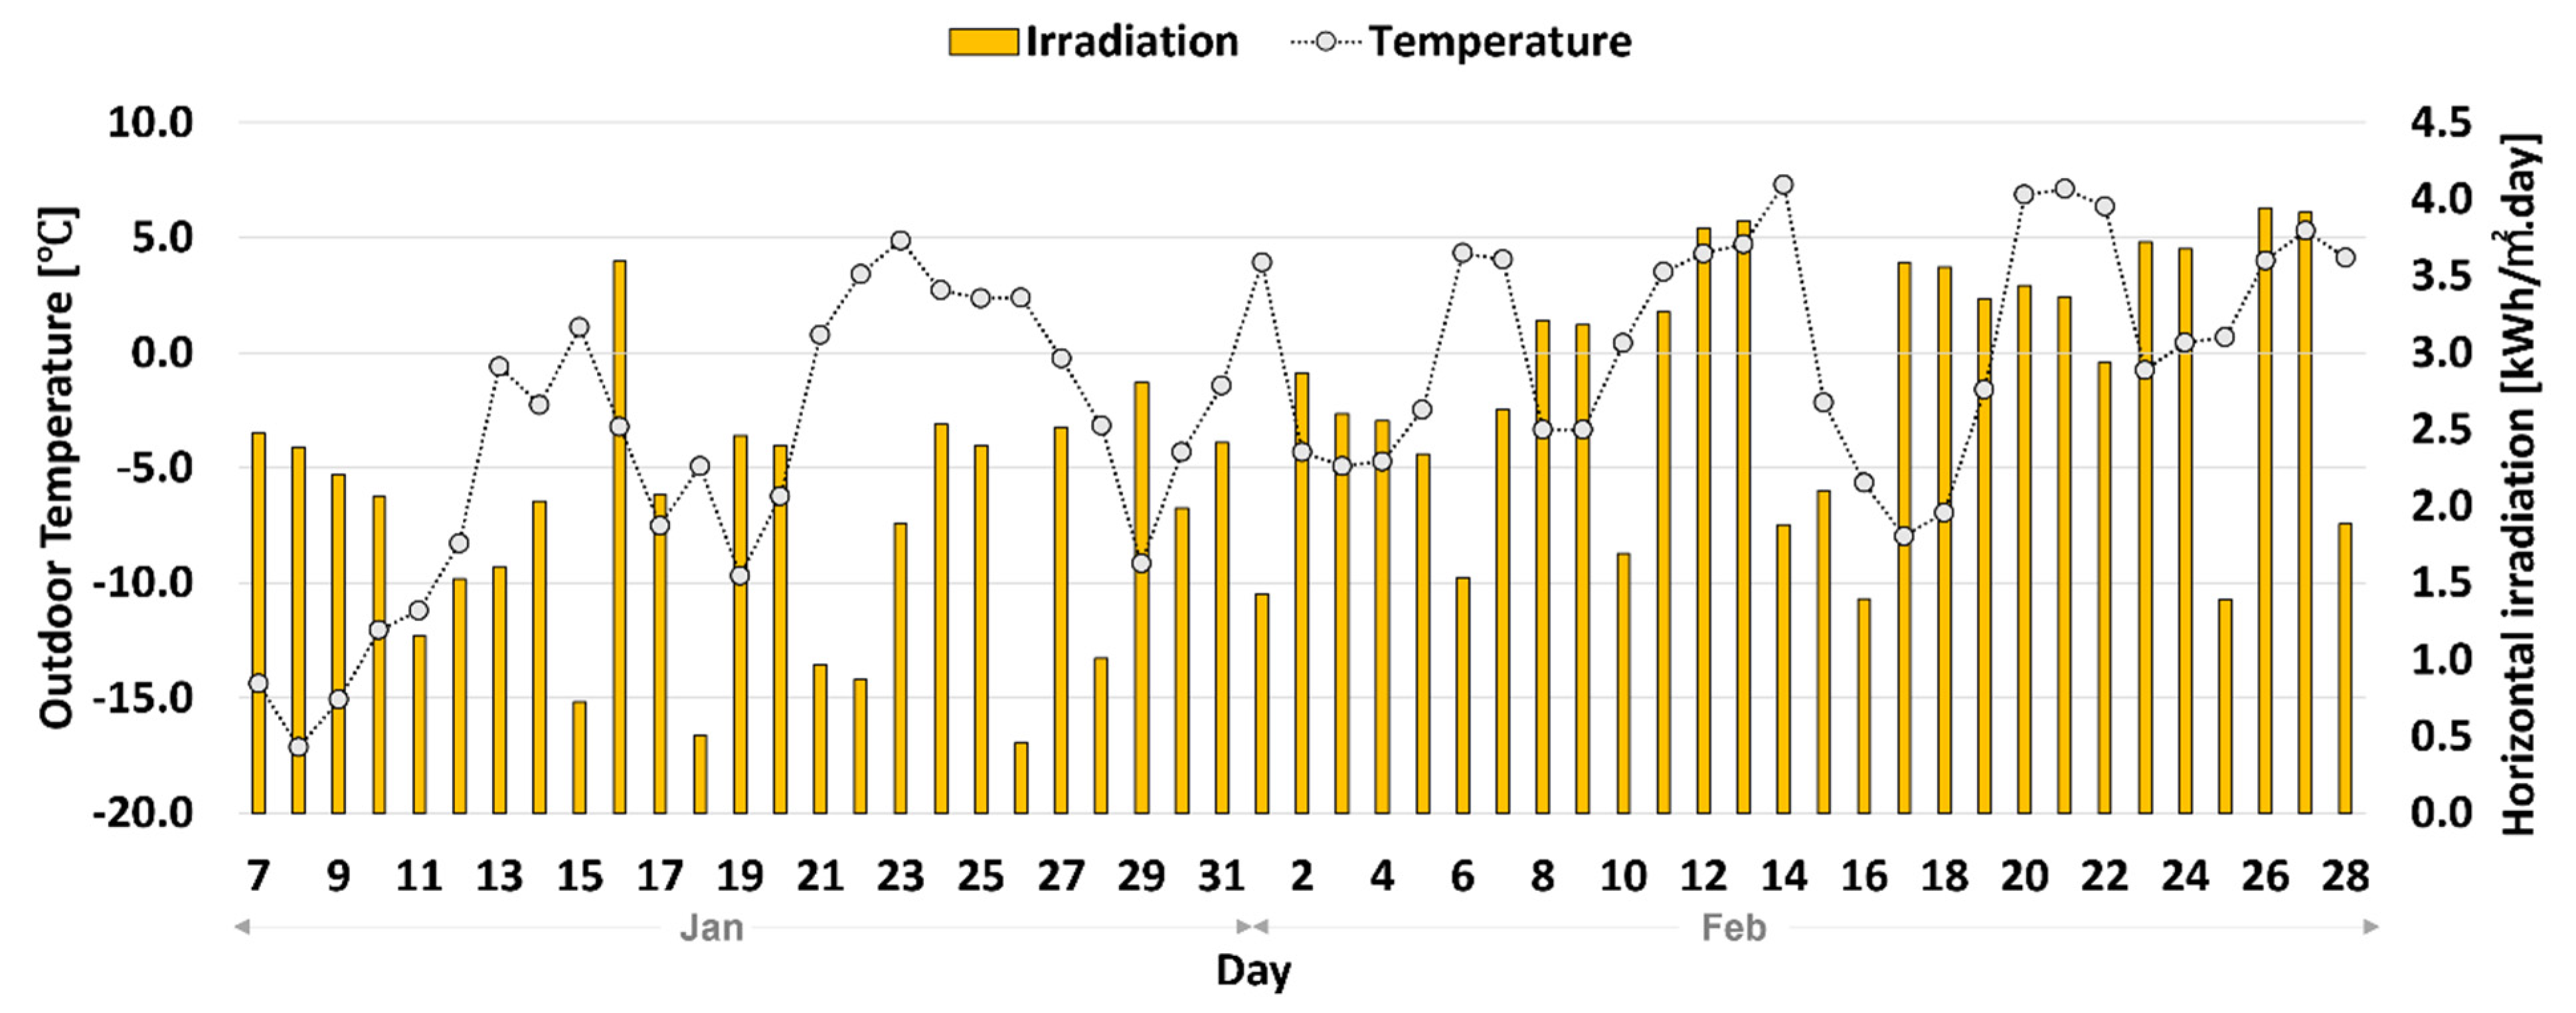
2.5. Measurement Procedure and Outdoor Conditions

The experiments were conducted in winter (January and February). In January, an experiment was conducted under three temperature conditions to analyze the heat flux patterns of the heated windows according to the setpoint temperature by selecting representative dates for the entire analysis period. Each experimental temperature condition was maintained for a week. In February, a month-long experiment was conducted at a fixed setpoint temperature. Table 2 summarizes the experimental conditions. According to ISO 9869-1 ‘Data acquisition’ [38], the test period was at least 7 days.
Figure 6 is a conceptual diagram of the heat flow from the heated window, where W ˙ is the input power for window heating. Q ˙ i n is the amount of heat flow measured through the internal heat flow meter, which is always positive because the heat flow meter is turned on for 24 h, and the glass surface temperature is always higher than the surrounding temperature. Q ˙ o u t is the value measured through the external heat flow meter, which is negative when heat is lost to the outside or positive when heat is gained to the inside under the influence of high solar irradiation and outdoor air temperature. Therefore, when the value of Q ˙ o u t was positive, the heated window efficiency was assumed to be 100% because heat was obtained from both the inner and outer surfaces of the room. When the value of Q ˙ o u t was negative, heat was lost to the outside and the efficiency (ηgain) was derived through Equation (2).
η g a i n = Q i n Q i n + Q o u t × 100 %
Dew point temperature analyses were performed to confirm the presence of condensation during the experiment period and to analyze the change in dew point temperature according to the operating temperature of the heated windows. The dew point (D.P) of the heated window was derived through Equation (3) [39], which is a function of the relative humidity of the room (RH) and the inner surface temperature of the glass (T):
D . P = 243.12 × { l n ( R H 100 ) + 17.62 × T 243.12 + T } 17.62 { l n ( R H 100 ) + 17.62 × T 243.12 + T }
Figure 7 shows the test area and detailed information using the Köppen–Geiger climate map [40]. Köppen climate classification is a very useful and widely used stable data [41]. Climate conditions such as temperature and irradiation were reviewed through the actual data of the region, as shown in Figure 8.
Figure 8 shows the outdoor temperature and solar irradiation during the experimental period. January and February are generally the coldest months of the year in South Korea, and the coldest days were selected for the experiments because the heated window is favorable for heating. As a result during the experimental period, the average daily irradiation and outdoor air temperature were 142.3 Wh/m2 and −3.8 °C in January and 249.8 Wh/m2 and 0.4 °C in February, indicating a slightly milder climate in February than in January.

3. Results and Discussion

First, we discuss the analysis results according to the operating temperature of the heated window in Section 3.1. For each case, the average heat flow and temperature distribution values during the analysis period were analyzed, where the raw data were measured every minute; periods that exhibited measurement errors during the measurement period were excluded from the analysis. Daytime and nighttime were distinguished based on the irradiation values (irradiation = 0 W/m2: nighttime, irradiation ≠ 0 W/m2: daytime). Table 3 summarizes each case’s daytime, nighttime, and daily average values according to the setpoint temperature. We then compare the average results from January with those from February in Section 3.2.

3.1. Effect of the Setpoint Temperature

In case 1, the operating temperature of the heated window (Tsat) was set to the highest value of 30 °C. During the analysis period, the average irradiation was 163.2 W/m2. The average daily outdoor air temperatures were −10.5 °C during the nighttime and −7.0 °C during the daytime; thus, the experiments were conducted under the lowest outdoor air conditions during the entire analysis period. The T i s value of the south-facing heated window increased to a maximum of 46 °C under the influence of daytime irradiation; however, similar temperatures (approximately 38 °C) were maintained for both the north-facing and south-facing heated windows during the nighttime, which were approximately 8 °C higher than T s a t . The average outer surface temperature of the glass, T o s , for the south-facing heated window was −3.3 °C; therefore, the temperature difference between the inner and outer surfaces was approximately 41.7 °C or more. The indoor air temperature, T i a , of the living room on the southern side of the house was 28.4 °C, and the inner surface air temperature at a distance of 5 cm from the glass, T i s a , was approximately 1 °C higher (29.3 °C). The average daily temperature difference between T i s and T i s a was 9.0 °C for the south-facing heated window and 13.9 °C for the north-facing heated window, indicating a larger temperature difference on the northern side of the house. For the north-facing heated window, T o s was −5.7 °C and the temperature difference between the inner and outer surfaces was approximately 43.6 °C, which was larger than that for the south-facing heated window. The average air temperature of the utility room on the northern side of the house was approximately 4 °C less than T i s a . Moreover, the energy input of the north-facing heated window was approximately 51.2% larger than that of the south-facing heated window.
In case 2 (Tsat = 29 °C), the average irradiation of the analysis period was 141.4 W/m2, and the average daily nighttime and daytime outdoor air temperatures were −5.9 °C and −2.3 °C, respectively, which were approximately 5 °C higher than those in the previous analysis period, despite the lower irradiation. T i s for the south-facing and north-facing heated windows during the nighttime was approximately 36 °C, which was approximately 7 °C higher than T s a t . The average T o s for the south-facing heated window was 1.7 °C. The temperature difference between the inner and outer surfaces was approximately 34.8 °C, which was less than that in case 1. The temperature difference between T i a and T i s a was the same as that in case 1 for the south-facing heated window but was approximately 3.5 °C for the north-facing heated window. The average daily temperature difference between T i s and T i s a was 7.8 °C for the south-facing heated window and 12.4 °C for the north-facing heated window. For the north-facing heated window, the average T o s was −1.1 °C and the inner surface temperature of the glass was 35.8 °C, resulting in a temperature difference of 36.9 °C, which was slightly larger than that for the south-facing heated window. The energy input of the north-facing heated window was approximately 50.0% larger than that of the south-facing heated window.
In case 3 (Tsat = 28 °C), the average irradiation of the analysis period was 176.5 W/m2, and the average daily nighttime and daytime outdoor air temperatures were −2.2 °C and 2.2 °C, respectively. Thus, the irradiation and outdoor air temperatures were higher than those in case 2. The nighttime T i s of the south-facing and north-facing heated windows was approximately 36 °C, which was about 8 °C higher than T s a t . T o s was 5.3 °C for the south-facing heated window, which was higher than that in case 2. The average daily temperature difference between the inner and outer surfaces was approximately 31.6 °C, which was less than that in case 2. The average daily temperature difference between T i s and T i s a was 5.8 °C for the south-facing heated window and 9.2 °C for the north-facing heated window. The energy input of the north-facing heated window was approximately 45.9% larger than that of the south-facing heated window.
Case 4 shows the analysis results from the experiments in February, when the heating window’s operating temperature was fixed at 27 °C. The experiment was performed under higher average irradiation and outdoor air temperatures than the January experimental period (cases 1 to 3). Nighttime T i s values for the south-facing and north-facing heated windows were approximately 33 °C, which were about 6 °C higher than T s a t . The T o s value for the south-facing heated window was 6.0 °C and the average daily temperature difference between this value and the inner surface temperature of the glass was 27.7 °C, which was much smaller than the values recorded in January. The temperature difference between T i a and T i s a was 5.5 °C for the south-facing heated window and 8.6 °C for the north-facing heated window. Moreover, the energy input of the north-facing heated window was approximately 41.6% larger than that of the south-facing heated window.

3.2. Comprehensive Analysis

The above results were then comprehensively analyzed. Figure 9 shows a comparison of the heat gain ratio and input energy between south-facing and north-facing heated windows. Only the nighttime results were compared to exclude the influence of irradiation. As a result, an average heat gain ratio was analyzed 75.2% for the south-facing and 83.8% for the north-facing. No significant difference was observed in the heat gain ratio between cases for both south-facing and north-facing heated windows. However, the input energy for heating in February (case 4) was reduced by up to 44.6% from case 1 for the south-facing heated window and by 41.3% for the north-facing heated window. Figure 10 shows the outdoor air temperature and the temperatures at each measurement point in January and February. Temperatures were often higher for the north-facing heated window than for the south-facing heated window; this phenomenon was observed more frequently in February than in January. This is because the heated glazing system of the south-facing heated window was mostly turned off during the daytime; thus, the temperature of the glass naturally rose to the maximum temperature then dropped rapidly at sunset. This phenomenon was observed as the setpoint temperature of the heated window decreased. Conversely, the heated glazing system of the north-facing heated window was mostly turned on during both the daytime and nighttime, allowing the temperature of the glass surface to be maintained at room temperature.

3.3. Heated Window Heat Flux Patterns

The heat flux patterns of the heated windows were analyzed according to the operating period. As the influence of irradiation differs depending on the installation orientation of the window, the heat flux patterns of the north-facing and south-facing heated windows were analyzed separately. In addition, as the on-off status was changed continuously according to the temperature, and more detailed pattern analysis was possible when the analysis was conducted in minutes rather than in hours, the analysis was conducted using data acquired every minute. As a result, three heat flux patterns were observed during the entire analysis period, which occurred on a daily basis.
The south-facing and north-facing heated windows exhibited three heat flux patterns per day, as shown in Figure 11 and Figure 12. For pattern (a), which was observed between 00:00 and 07:00 and between 18:00 and 23:00 (irradiance = 0 W/m2), the sensitivity analysis results for the outdoor air temperature and heat gain ratio showed that the efficiency of the heated window decreased as the outdoor air temperature increased. For pattern (b), which was observed between 08:00 and 10:00, the efficiency of the heated window increased as the outdoor air temperature increased. There was no significant correlation between outdoor air temperature and heat flow for pattern (c), which occurred between 11:00 and 17:00, with the highest average irradiation of approximately 340 W/m2. Figure 13 and Figure 14 show the analysis results per minute for a representative day; on this day, the three heat flux patterns were most clearly identified due to the most stable irradiation. From 11:00 to 17:00, the south-facing heated window was not in operation during the daytime due to high irradiation, and the inner surface temperature of the glass increased to a maximum of 46 °C. At the same time, the temperature of the glass on the northern side increased to a maximum of 33 °C, but the heated window was continuously operated. Large input energy was required to increase the temperature of the glass lowered by repeated on-off operation. The peak load in the corresponding period was 356 W/m2, which was higher than the peak load during the nighttime (331 W/m2). The heated window efficiency when the window was not in operation, i.e., during the nighttime, tended to increase as both the inner surface temperature of the glass and the temperature difference with the indoor air temperature increased. Figure 15 shows the outdoor conditions and heat flux patterns of the south-facing and north-facing heated windows on the representative day. The same heat flux patterns were observed during both the January and February analysis periods.

4. Conclusions

In this study, the heat flux patterns of heated windows were investigated in an occupied house over two months according to the installation location, window orientation, and operating temperature. Heat flux meters were installed for heat flow analysis, and temperature sensors were installed at each location for temperature analysis. The heat gain to the indoor space was expressed as the efficiency of the heated window. The key outcomes of this study are as follows.
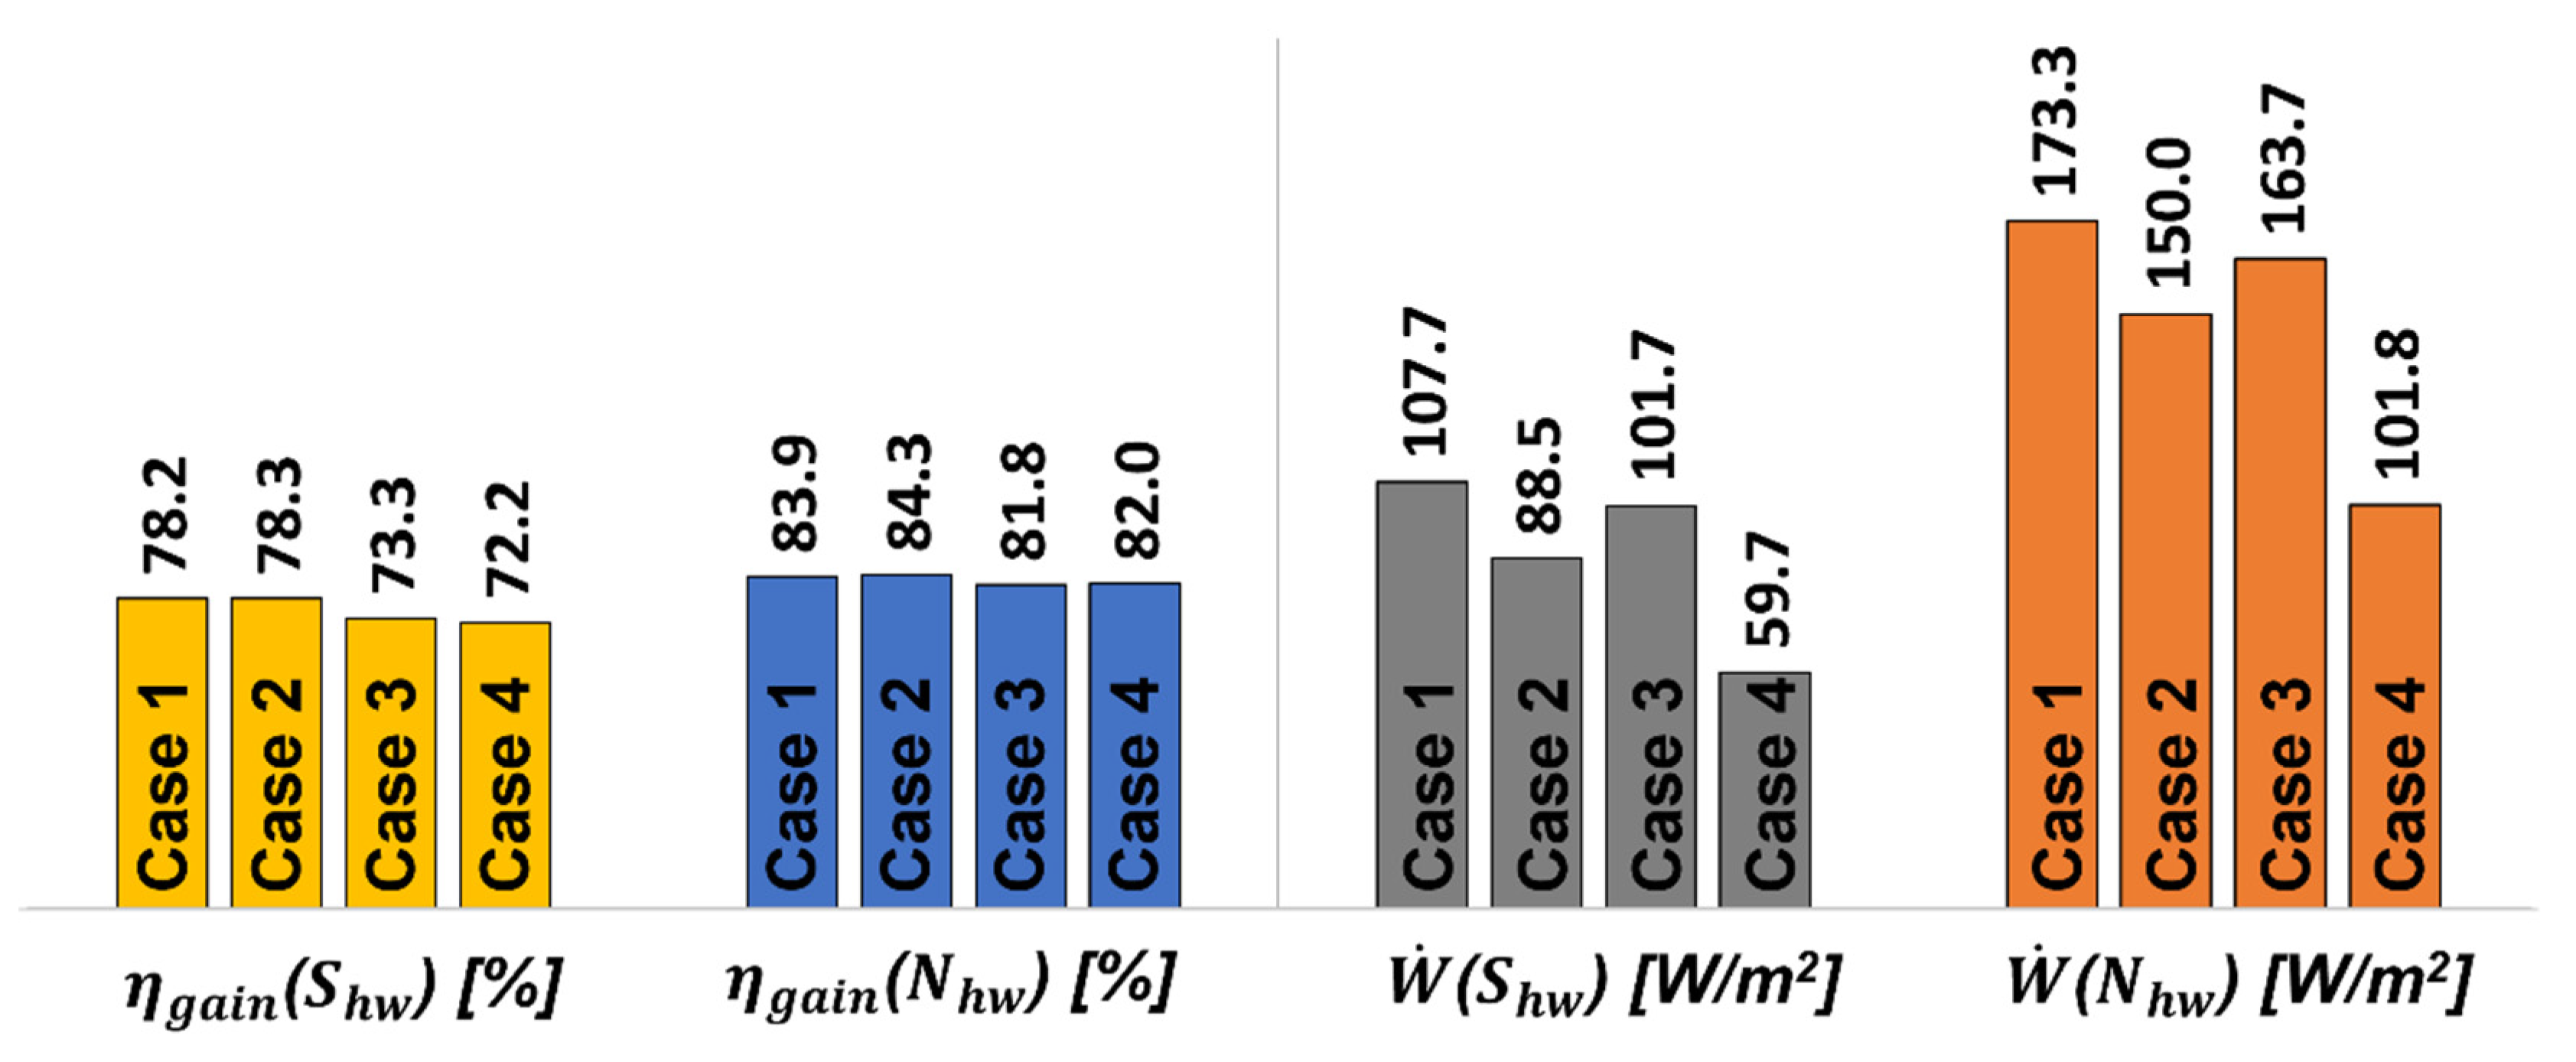
  • A comparison of the orientation of the heated window revealed that the south-facing heated window located in the living room, with high irradiation and many internal heating elements, required smaller energy input. However, the measured heat gain ratio was higher for the north-facing heated window in the utility room.
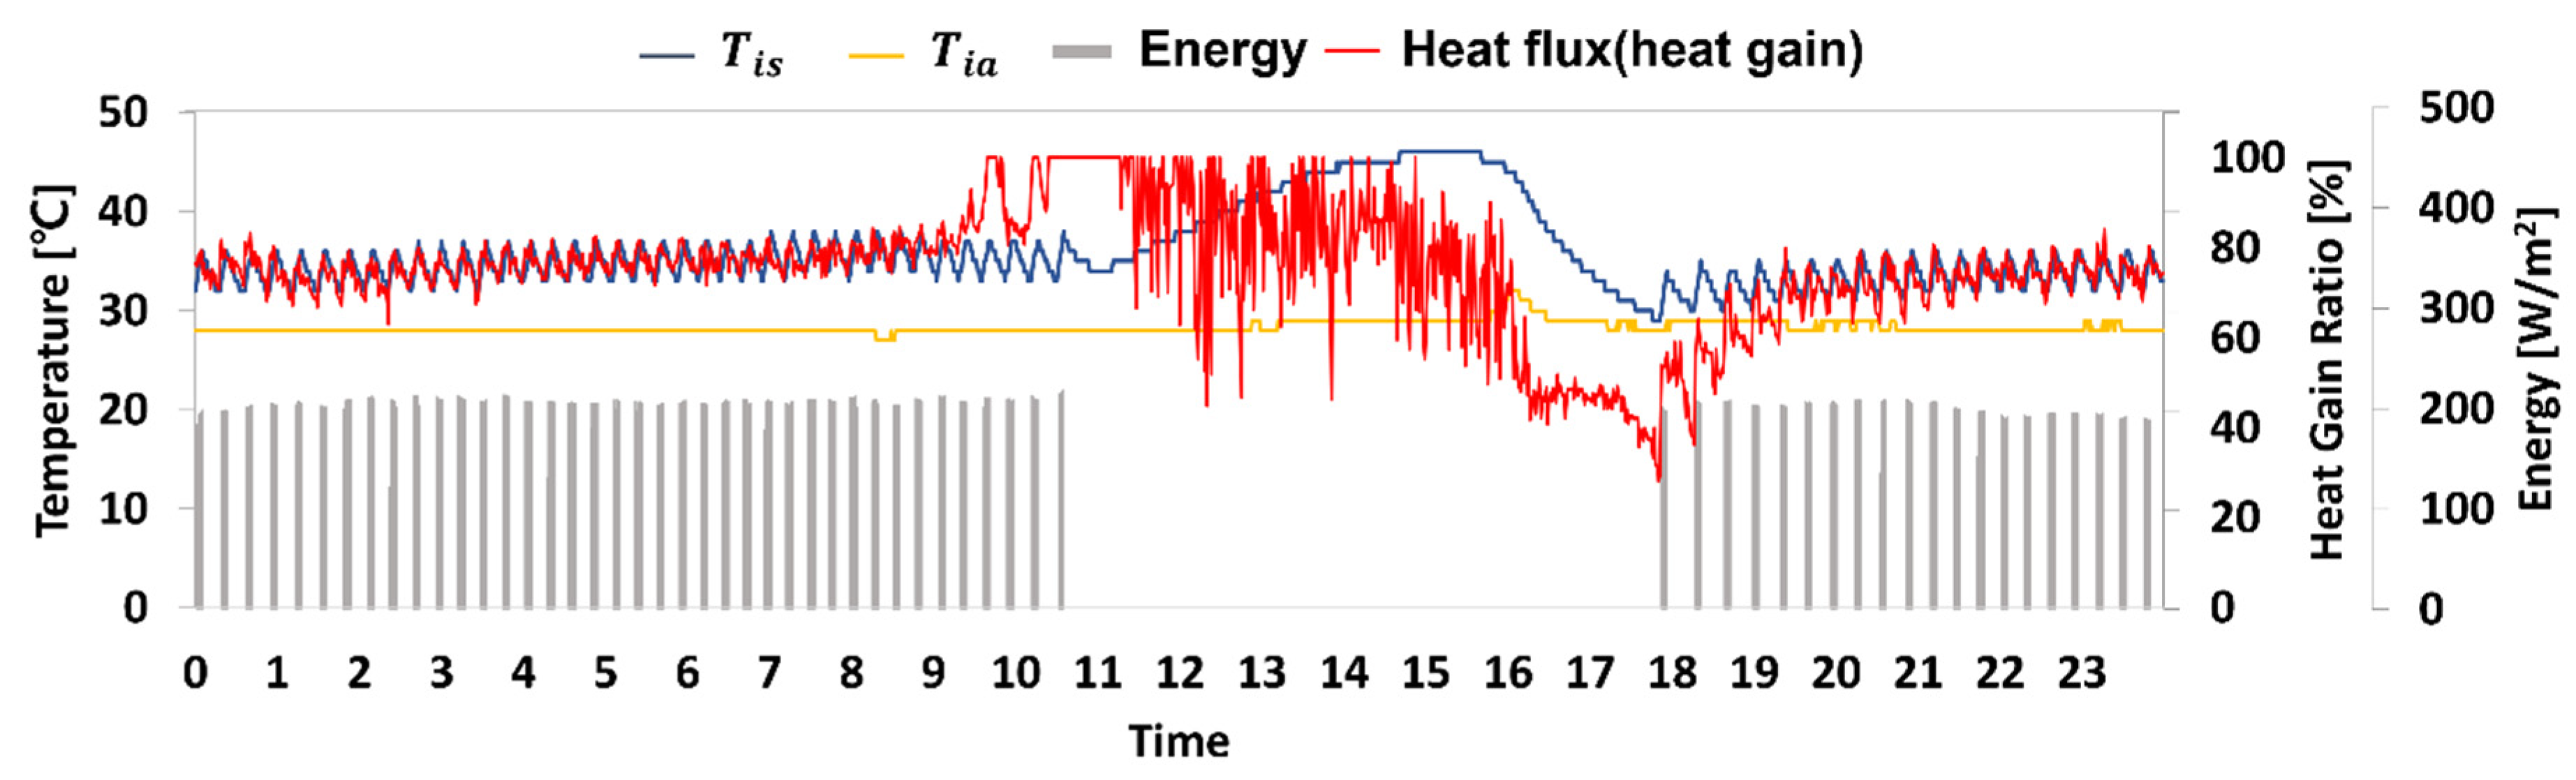
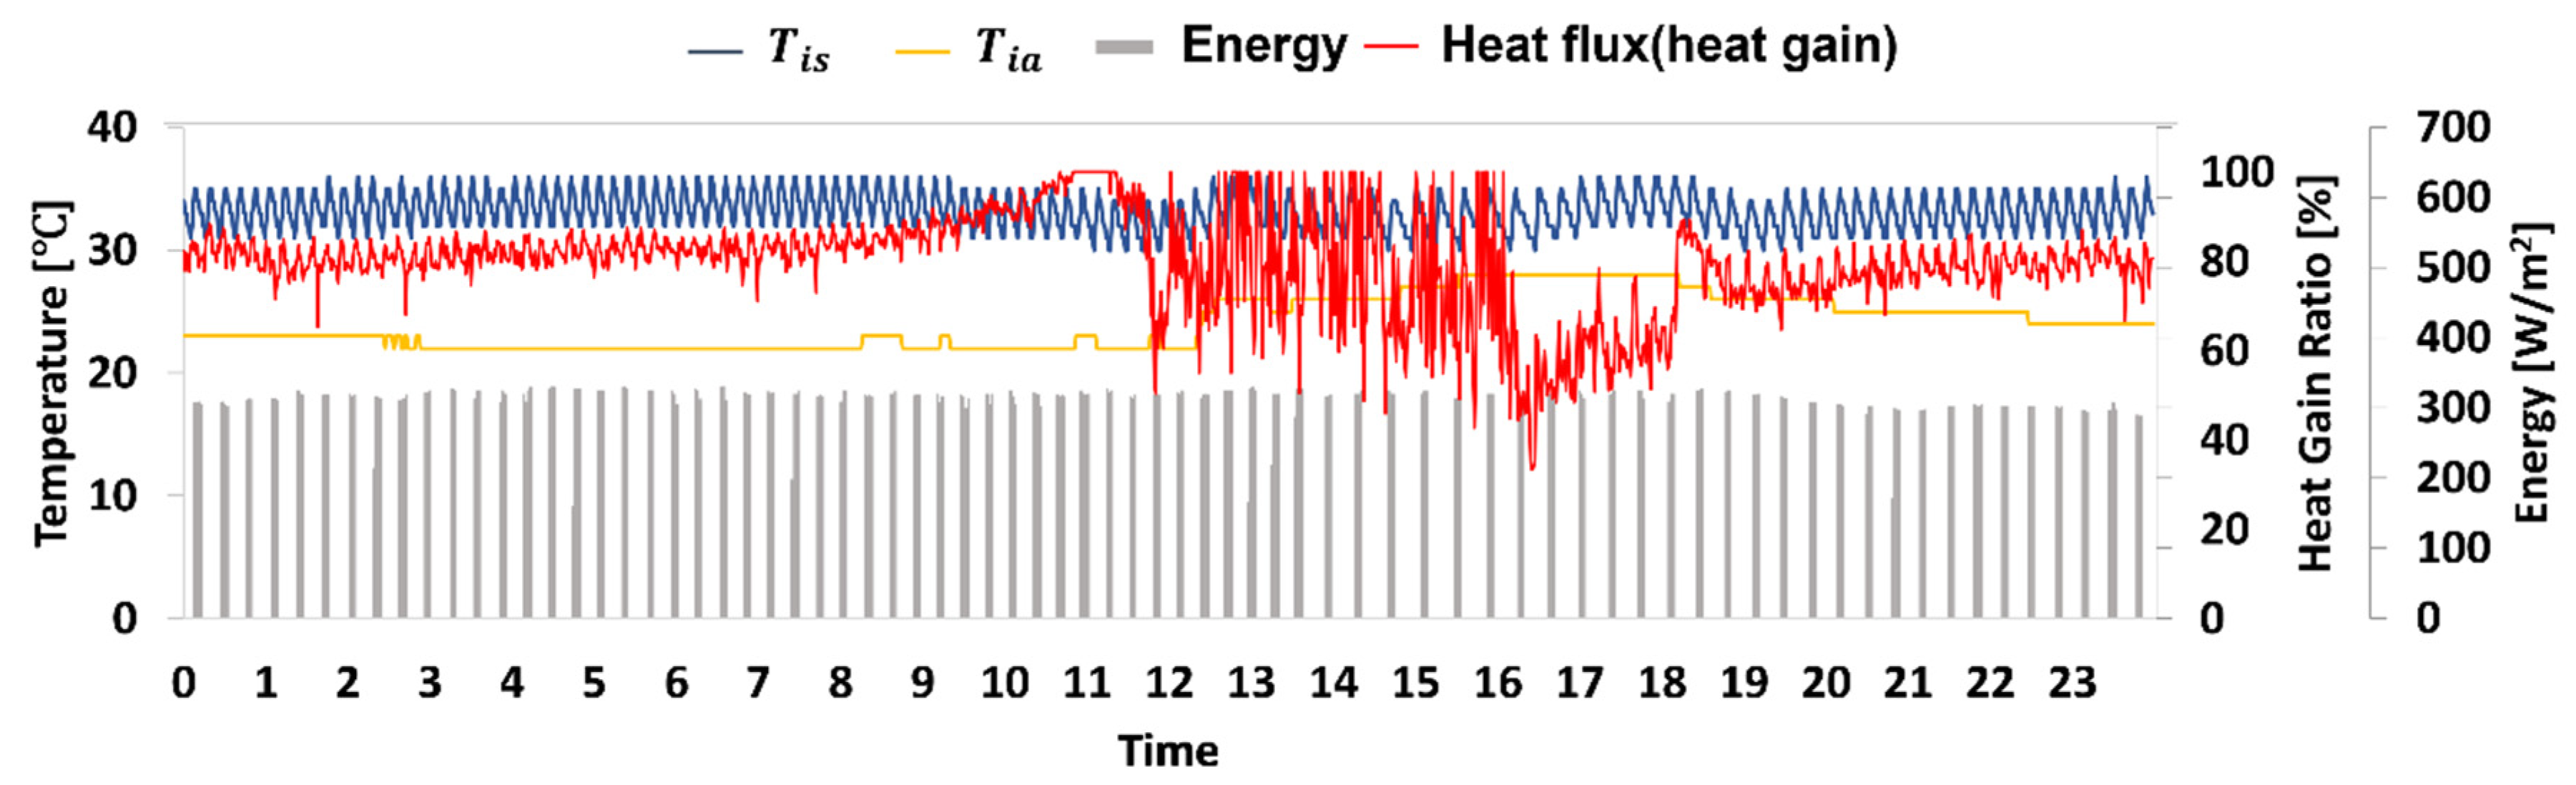
  • There was no significant difference in the heat gain ratio according to the operating temperature for either the south-facing or north-facing heated window. However, a reduction in the operating temperature by 3 °C reduced the input energy by up to 44.6% for the south-facing heated window and up to 41.3% for the north-facing heated window.
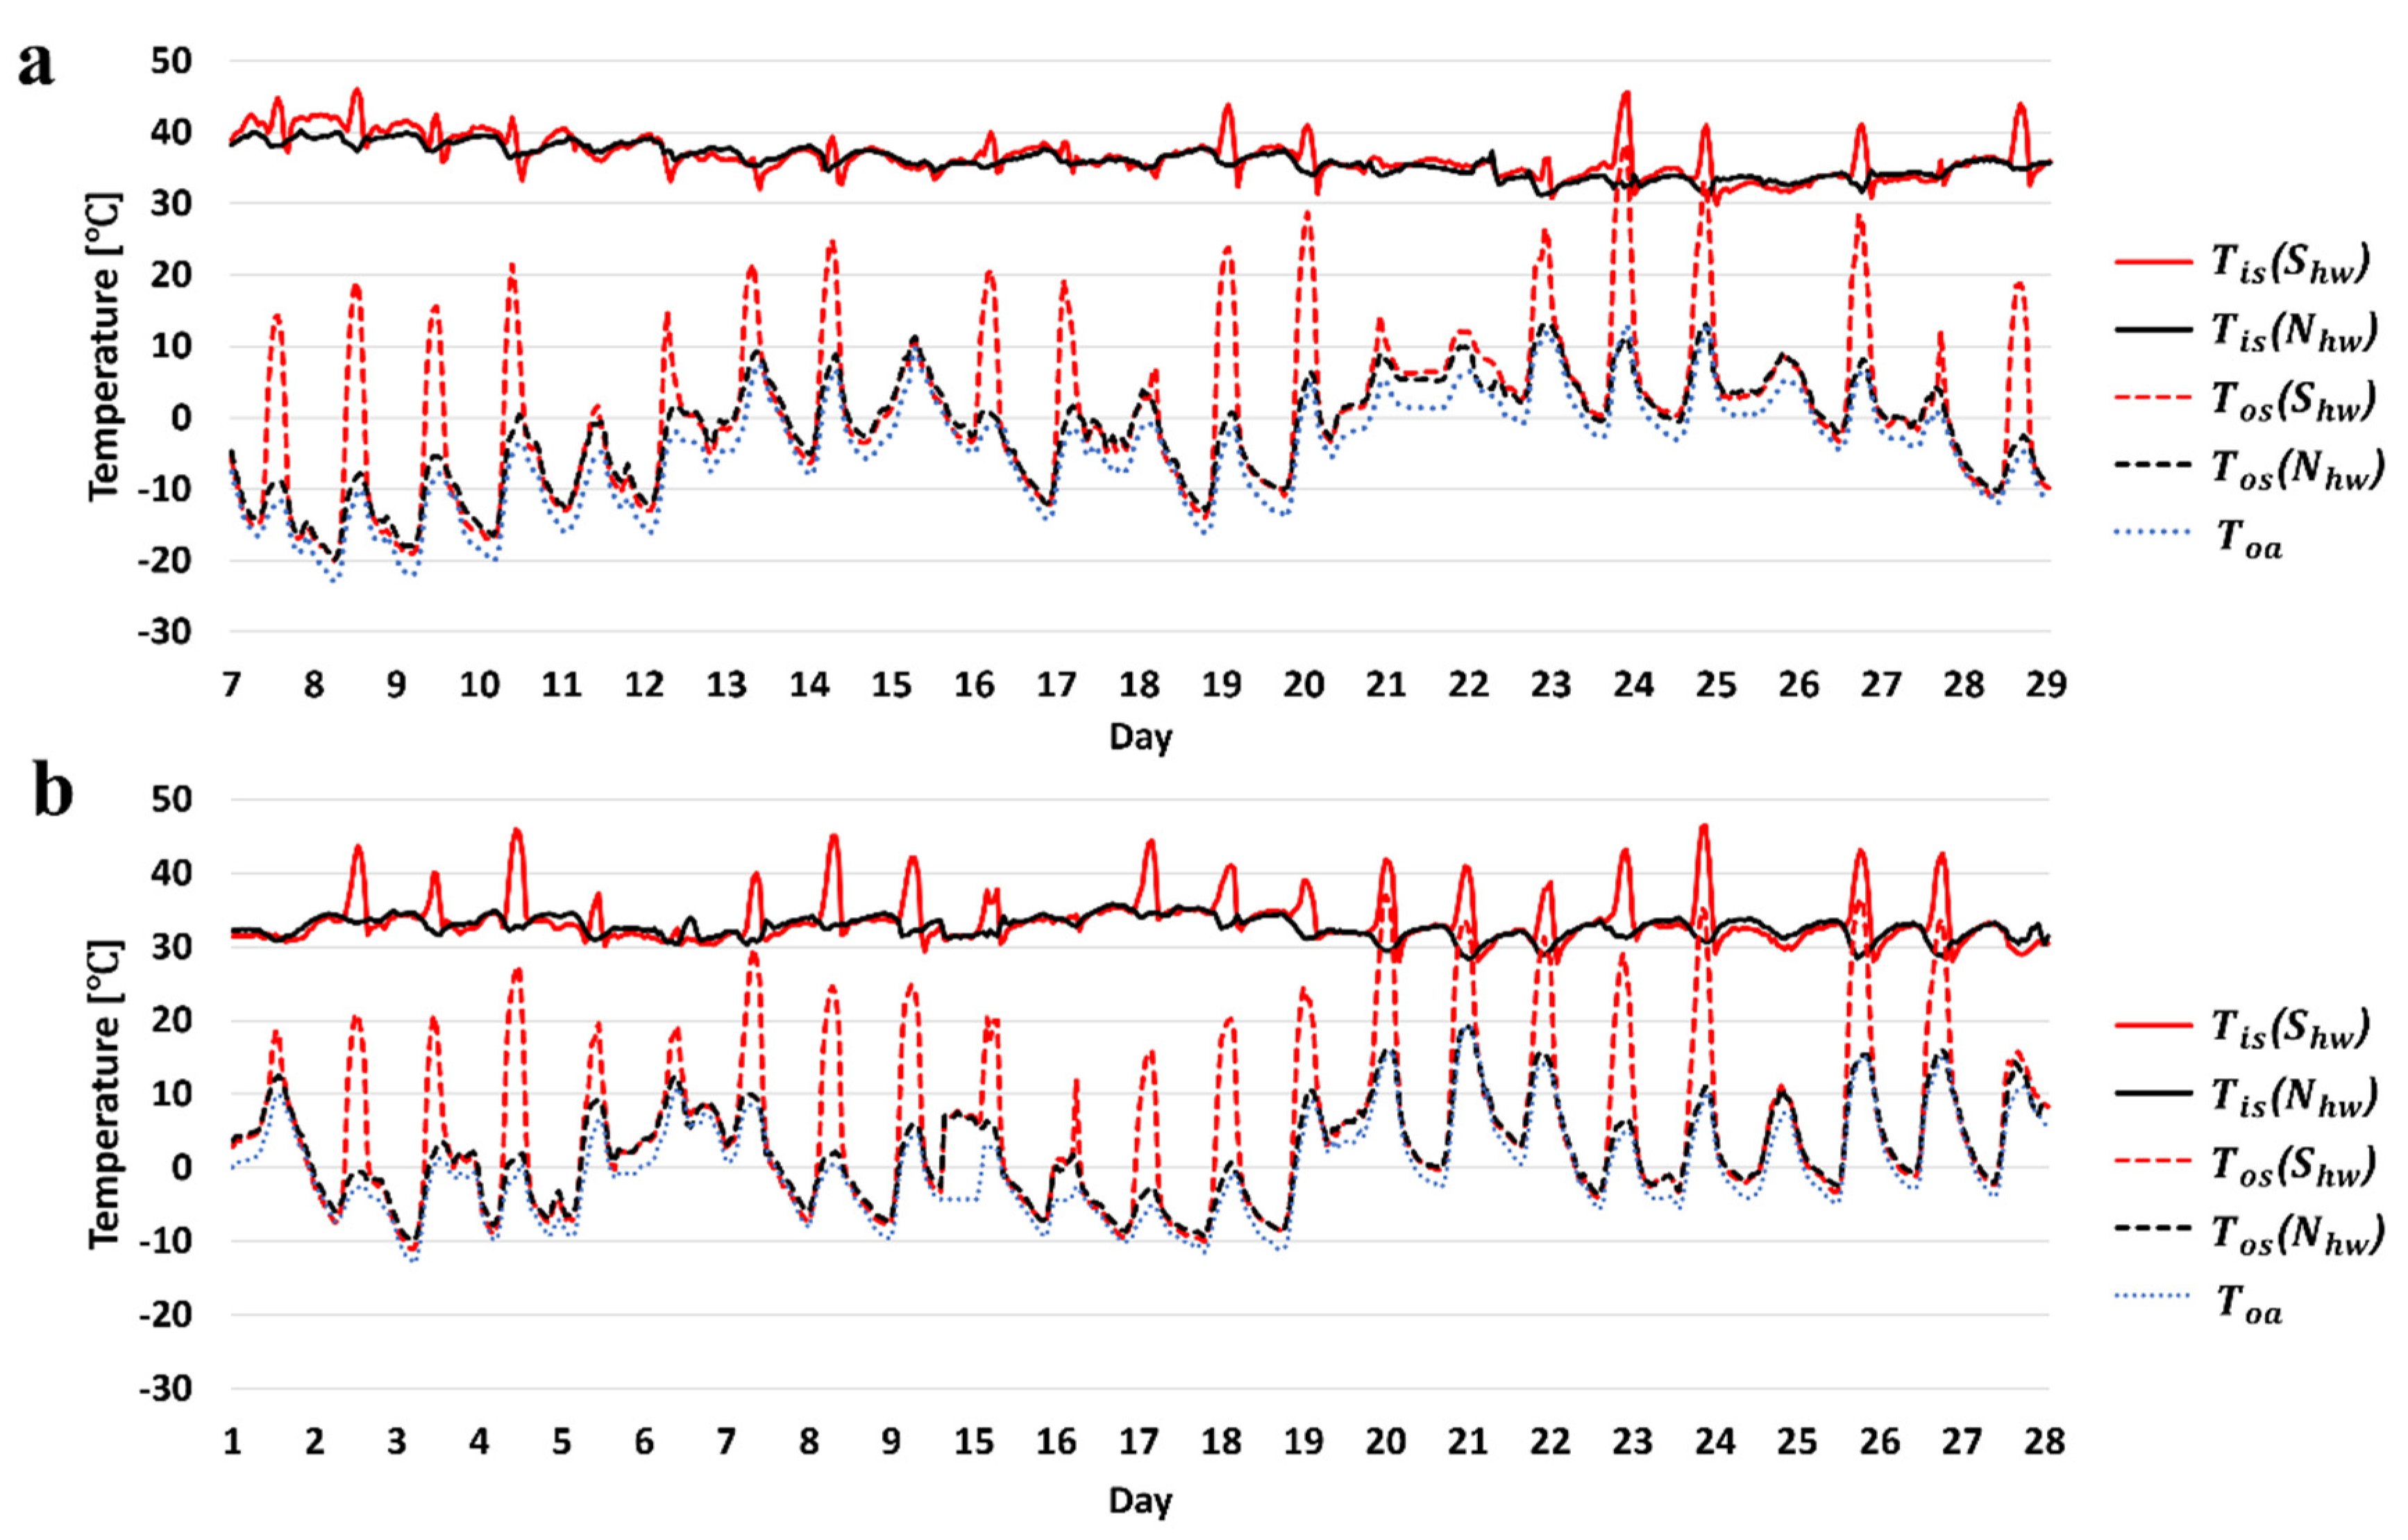
  • The heated windows operated at a much higher temperature than the setpoint temperature due to the position of the temperature sensor for heated window control. A temperature difference of approximately 7 °C or more was observed between the position of the temperature sensor used to determine the on/off status of the heated window and the center of the glass where sensors were installed for the experiments in both January and February. No condensation problem was observed because temperatures were maintained at approximately 20 °C higher than the average dew point of the glass surface for both the south-facing and north-facing heated windows. This indicates when installing a heated window for the primary purpose of preventing condensation, it is necessary to derive an appropriate set temperature to prevent excessive energy consumption.
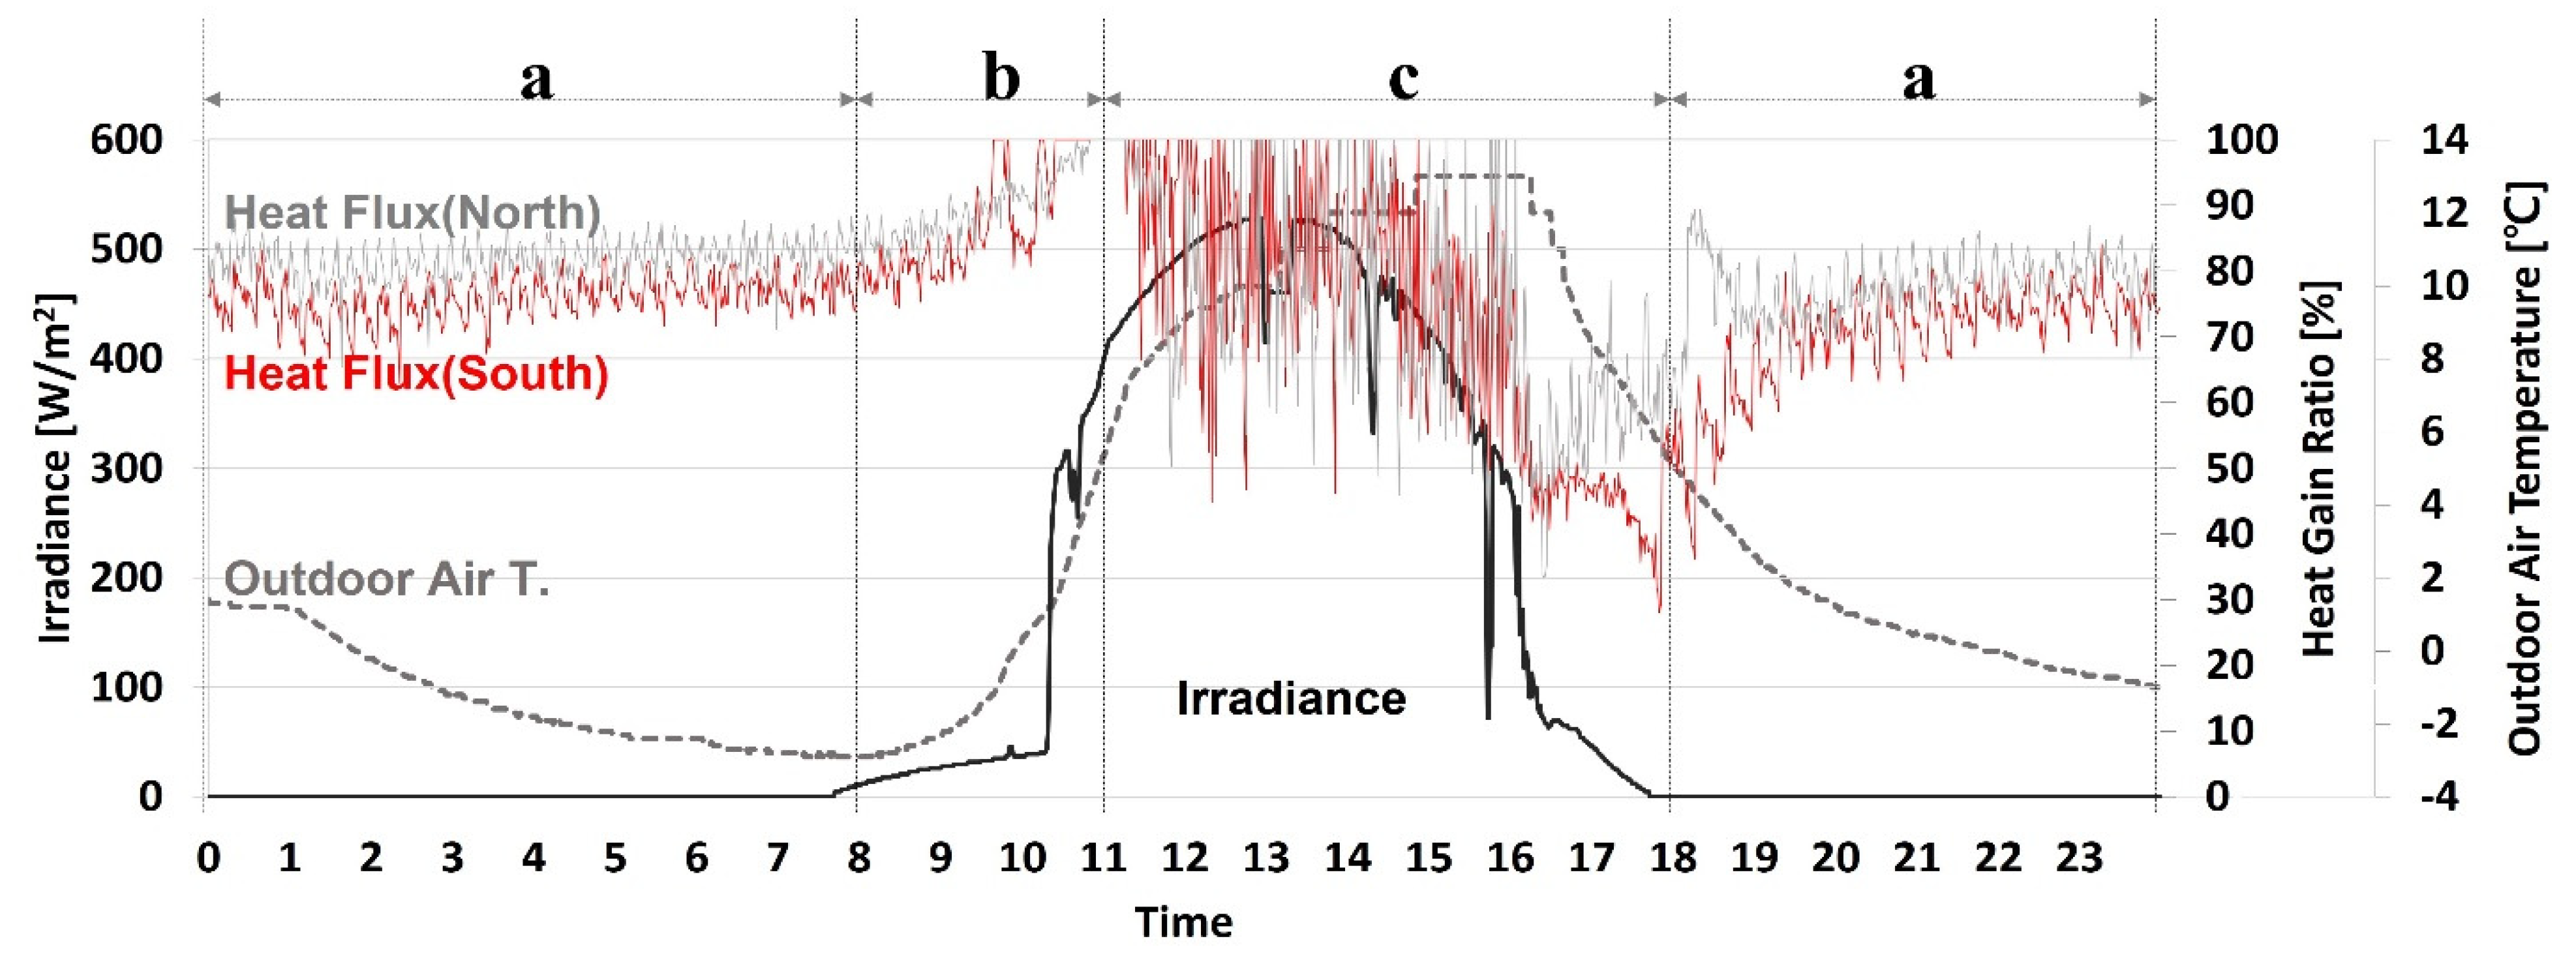
  • Three heat flux patterns of the heated window were observed each day. In pattern (a), the efficiency increased as the outdoor air temperature decreased. In pattern (b), the efficiency increased as the outdoor air temperature increased. In pattern (c), which was observed during the daytime, the heat flow was unstable, and no correlation was observed with the outdoor air temperature. These daily patterns occurred in both January and February.
This study confirmed that the heated window operation method must consider the basic heated window type and the dominant function required from the heated window. Specifically, it is necessary to consider an appropriate setpoint temperature according to the purpose of the heated window, such as condensation prevention, heating, or indoor comfort. In addition, the significant difference observed between the temperature measured by the temperature sensor for heated window control and the average temperature at the center of the heated window may lead to excessive energy use; therefore, it is necessary to consider the position of the temperature sensor for heated window control or employ a setpoint temperature that takes this temperature difference into account. Finally, we confirmed that the energy input might vary depending on the operating temperature, even in the same winter period. This suggests that the setpoint temperature should be specifically planned according to the installation purpose of the heated window. Therefore, a suitable operating schedule (e.g., daytime operation, nighttime operation, and monthly, daily, and hourly operation) should also be considered. Furthermore, various scenarios for setting the operating temperature should be designed according to the purpose of the heated window, and continuous research is required to establish optimal strategies, including the ideal heated window operation method for reducing the energy input according to the setpoint temperature, and combining the use of heated windows with renewable energy.
These analysis results can confirm various results that could not be found in conventional controlled laboratories. It was discovered that problems that may occur when the actual commercialized model is applied (e.g., deviation from the set temperature according to the position of the operating temperature sensor) were discovered, and it was found that excessive energy may be input than expected due to this. In addition, it was possible to confirm various heat flow patterns due to the ever-changing external air conditions. Based on these results, various variables to be considered for future research on the development and commercialization of heated windows were presented, and it was confirmed that it was necessary to establish a diversified strategy for the optimal operation of the heated windows.

Author Contributions

Conceptualization, R.L.; methodology, J.Y.; formal analysis H.L. and J.Y.; investigation R.L.; writing—original draft preparation, R.L. and J.Y; project administration, E.K. and H.L.; data curation, E.K. and H.L.; writing—review and editing R.L. and J.Y. All authors have read and agreed to the published version of the manuscript.

Funding

This work was supported by the Korea Agency for Infrastructure Technology Advancement (KAIA) grant (21CTAP-C163698-01).

Institutional Review Board Statement

Not applicable.

Informed Consent Statement

Not applicable.

Data Availability Statement

Not applicable.

Conflicts of Interest

The authors declare no conflict of interest.

Nomenclature

D.P.dew point [°C]
HWheated window
onheating on
offheating off
W ˙ 
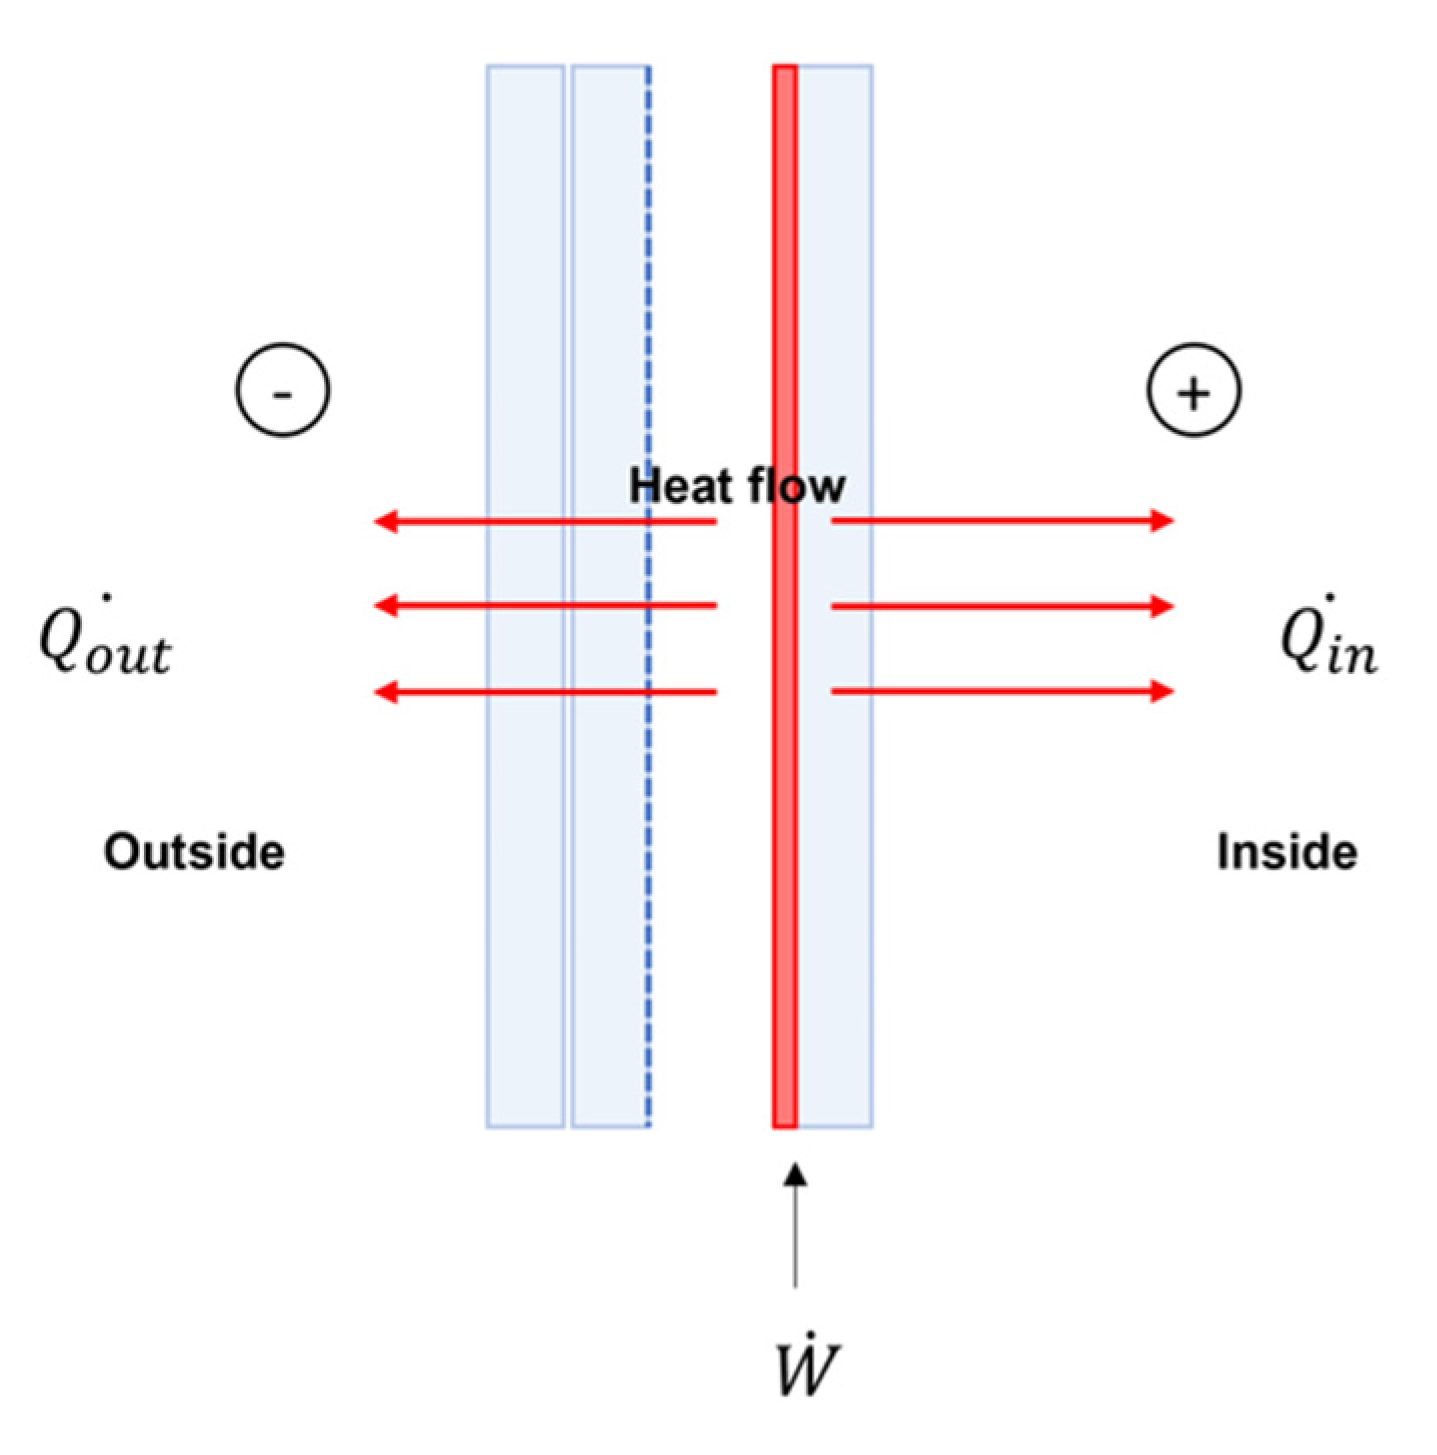
input power for window heating [W/m2]
Q i n inside surface heat flux [W/m2]
Q o u t outside surface heat flux [W/m2]
S h w south-facing heated window
N h w north-facing heated window
T i a indoor air temperature [°C]
T i s inner surface temperature of glass [°C]
T i s a inner surface air temperature (at a distance of 5 cm from the glass) [°C]
T o a outdoor air temperature [°C]
T o s outer surface temperature of glass [°C]
T s a t setpoint temperature for heated window control [°C]
T temperature difference [°C]
η g a i n efficiency of heated window; heat gain ratio [%]

References

  1. Wang, L.; Greenberg, S. Window operation and impacts on building energy consumption. Energy Build. 2015, 92, 313–321. [Google Scholar] [CrossRef]
  2. Elsadek, M.; Liu, B.; Xie, J. Window view and relaxation: Viewing green space from a high-rise estate improves urban dwellers’ wellbeing. Urban. For. Urban Green. 2020, 55, 126846. [Google Scholar] [CrossRef]
  3. Persson, M.L.; Roos, A.; Wall, M. Influence of window size on the energy balance of low energy houses. Energy Build. 2006, 38, 181–188. [Google Scholar] [CrossRef]
  4. Badescu, V.; Staicovici, M.D. Renewable energy for passive house heating: Model of the active solar heating system. Energy Build. 2006, 38, 129–141. [Google Scholar] [CrossRef]
  5. Arici, M.; Karabay, H.; Kan, M. Flow and heat transfer in double, triple and quadruple pane windows. Energy Build. 2015, 86, 394–402. [Google Scholar] [CrossRef]
  6. Werner, A.; Roos, A. Condensation tests on glass samples for energy efficient windows. Sol. Energy Mater. Sol. Cells 2007, 91, 609–615. [Google Scholar] [CrossRef]
  7. Werner, A.; Roos, A. Simulations of coatings to avoid external condensation on low U-value windows. Opt. Mater. (Amst). 2008, 30, 968–978. [Google Scholar] [CrossRef]
  8. Kim, J.; Kim, T.; Leigh, S.B. Double window system with ventilation slits to prevent window surface condensation in residential buildings. Energy Build. 2011, 43, 3120–3130. [Google Scholar] [CrossRef]
  9. Cuce, E. Role of airtightness in energy loss from windows: Experimental results from in-situ tests. Energy Build. 2017, 139, 449–455. [Google Scholar] [CrossRef]
  10. Jiang, W.; Liu, B.; Zhang, X.; Zhang, T.; Li, D.; Ma, L. Energy performance of window with PCM frame. Sustain. Energy Technol. Assess. 2021, 45, 101109. [Google Scholar] [CrossRef]
  11. Lechowska, A.A.; Schnotale, J.A.; Baldinelli, G. Window frame thermal transmittance improvements without frame geometry variations: An experimentally validated CFD analysis. Energy Build. 2017, 145, 188–199. [Google Scholar] [CrossRef]
  12. Khetib, Y.; Alotaibi, A.A.; Alshahri, A.H.; Rawa, M.; Cheraghian, G.; Sharifpur, M. Impact of phase change material on the amount of emission in the double-glazed window frame for different window angles. J. Energy Storage 2021, 44, 103320. [Google Scholar] [CrossRef]
  13. Simko, T.; Moore, T. Optimal window designs for Australian houses. Energy Build. 2021, 250, 111300. [Google Scholar] [CrossRef]
  14. Ge, H.; Fazio, P. Experimental investigation of cold draft induced by two different types of glazing panels in metal curtain walls. Build. Environ. 2004, 39, 115–125. [Google Scholar] [CrossRef]
  15. Zhang, E.; Duan, Q.; Wang, J.; Zhao, Y.; Feng, Y. Experimental and numerical analysis of the energy performance of building windows with solar NIR-driven plasmonic photothermal effects. Energy Convers. Manag. 2021, 245, 114594. [Google Scholar] [CrossRef]
  16. Ihm, P.; Park, L.; Krarti, M.; Seo, D. Impact of window selection on the energy performance of residential buildings in South Korea. Energy Policy 2012, 44, 1–9. [Google Scholar] [CrossRef]
  17. Malvoni, M.; Baglivo, C.; Congedo, P.M.; Laforgia, D. CFD modeling to evaluate the thermal performances of window frames in accordance with the ISO 10077. Energy 2016, 111, 430–438. [Google Scholar] [CrossRef]
  18. Gläser, H.J.; Ulrich, S. Condensation on the outdoor surface of window glazing—Calculation methods, key parameters and prevention with low-emissivity coatings. Thin. Solid Films 2013, 532, 127–131. [Google Scholar] [CrossRef]
  19. Shin, M.S.; Rhee, K.N.; Yu, J.Y.; Jung, G.J. Determination of equivalent thermal conductivity of window spacers in consideration of condensation prevention and energy saving performance. Energies 2017, 10, 717. [Google Scholar] [CrossRef] [Green Version]
  20. Jeong, C.H.; Yeo, M.S.; Kim, K.W. Experimental study on insulation performance and condensation characteristics of a vacuum insulated glass window. J. Asian Archit. Build. Eng. 2015, 14, 717–724. [Google Scholar] [CrossRef] [Green Version]
  21. Saadatian, S.; Freire, F.; Simões, N. Embodied impacts of window systems: A comparative assessment of framing and glazing alternatives. J. Build. Eng. 2021, 35. [Google Scholar] [CrossRef]
  22. Jammulamadaka, H.S. Evaluation of Energy Efficiency Performance of Heated Windows; West Virginia University: Morgantown, WV, USA, 2017. [Google Scholar] [CrossRef] [Green Version]
  23. Kurnitski, J.; Jokisalo, J.; Palonen, J.; Jokiranta, K.; Seppänen, O. Efficiency of electrically heated windows. Energy Build. 2004, 36, 1003–1010. [Google Scholar] [CrossRef] [Green Version]
  24. Moreau, A.; Sc, M.A.; Sansregret, S.; Sc, E.M.A.; Fournier, M.; Sc, M.A. Modeling and Study of the Impacts of Electrically Heated Windows on the Energy Needs of Buildings. Int. Conf. HEAT Transf. Therm. Eng. Environ. 2008, 76–83. [Google Scholar]
  25. Cakó, B.; Lovig, D.; Ózdi, A. Measuring the effects of heated windows on thermal comfort. Pollack Period. 2021, 1–6. [Google Scholar] [CrossRef]
  26. Kaboré, M.; Michaux, G.; Le Dréau, J.; Salagnac, P.; Greifet, R. Parametric study of the thermal performance of a single-family house equipped with an airflow window integrating a heated glazing. Build. Simul. Conf. Proc. 2019, 3, 2019–2025. [Google Scholar] [CrossRef]
  27. Tällberg, R.; Jelle, B.P.; Loonen, R.; Gao, T.; Hamdy, M. Comparison of the energy saving potential of adaptive and controllable smart windows: A state-of-the-art review and simulation studies of thermochromic, photochromic and electrochromic technologies. Sol. Energy Mater. Sol. Cells 2019, 200, 109828. [Google Scholar] [CrossRef] [Green Version]
  28. Heiz, B.P.V.; Su, L.; Pan, Z.; Wondraczek, L. Fluid-Integrated Glass–Glass Laminate for Sustainable Hydronic Cooling and Indoor Air Conditioning. Adv. Sustain. Syst. 2018, 2, 1–8. [Google Scholar] [CrossRef] [Green Version]
  29. Leem, D.S.; Edwards, A.; Faist, M.; Nelson, J.; Bradley, D.D.C.; De Mello, J.C. Efficient organic solar cells with solution-processed silver nanowire electrodes. Adv. Mater. 2011, 23, 4371–4375. [Google Scholar] [CrossRef]
  30. Wang, Y.; Du, D.; Yang, X.; Zhang, X.; Zhao, Y. Optoelectronic and electrothermal properties of transparent conductive silver nanowires films. Nanomaterials 2019, 9, 904. [Google Scholar] [CrossRef] [PubMed] [Green Version]
  31. Kim, K.; Hong, Y.; Application, F.; Data, P. Heating Glass and Manufacturing Method Thereof. U.S. Patent 8,916,805, 12 December 2014. [Google Scholar]
  32. Yu, W.; Sisi, L.; Haiyan, Y.; Jie, L. Progress in the functional modification of graphene/graphene oxide: A review. RSC Adv. 2020, 10, 15328–15345. [Google Scholar] [CrossRef]
  33. Chen, X.D.; Chen, Z.; Jiang, W.S.; Zhang, C.; Sun, J.; Wang, H.; Xin, W.; Lin, L.; Priydarshi, M.K.; Yang, H. mfl. Fast Growth and Broad Applications of 25-Inch Uniform Graphene Glass. Adv. Mater. 2017, 29, 1–9. [Google Scholar] [CrossRef]
  34. Tiwari, S.K.; Sahoo, S.; Wang, N.; Huczko, A. Graphene research and their outputs: Status and prospect. J. Sci. Adv. Mater. Devices 2020, 5, 10–29. [Google Scholar] [CrossRef]
  35. Yoo, B.; Han, S. Low-resistance Transparent Plane Heating System using CVD Graphene Key Words: CVD graphene, transparent plane heating system, PWM control, 4-layer Graphene. Korea Inf. Electron. Commun. Technol. 2019, 12, 218–223. [Google Scholar]
  36. Lee, H.; Choi, M.; Lee, R.; Kim, D.; Yoon, J. Energy performance evaluation of a plus energy house based on operational data for two years: A case study of an all-electric plus energy house in Korea. Energy Build. 2021, 252, 111394. [Google Scholar] [CrossRef]
  37. eko-eu.com. Available online: https://eko-eu.com/products/material-analysis/heat-flux-sensors/mf-200-heat-flux-sensor (accessed on 10 December 2021).
  38. ISO 9869-1:2014(E), ISO INTERNATIONAL STANDARD Thermal Insulation—Building. Available online: https://www.iso.org/standard/59697.html (accessed on 10 December 2021).
  39. Kingsley, E.; Samuel, O.; Isaac, C.; Esosa, E. Approximation of the Dew Point Temperature Using a Cost Effective Weather Monitoring System. Phys. Sci. Int. J. 2017, 14, 1–6. [Google Scholar] [CrossRef]
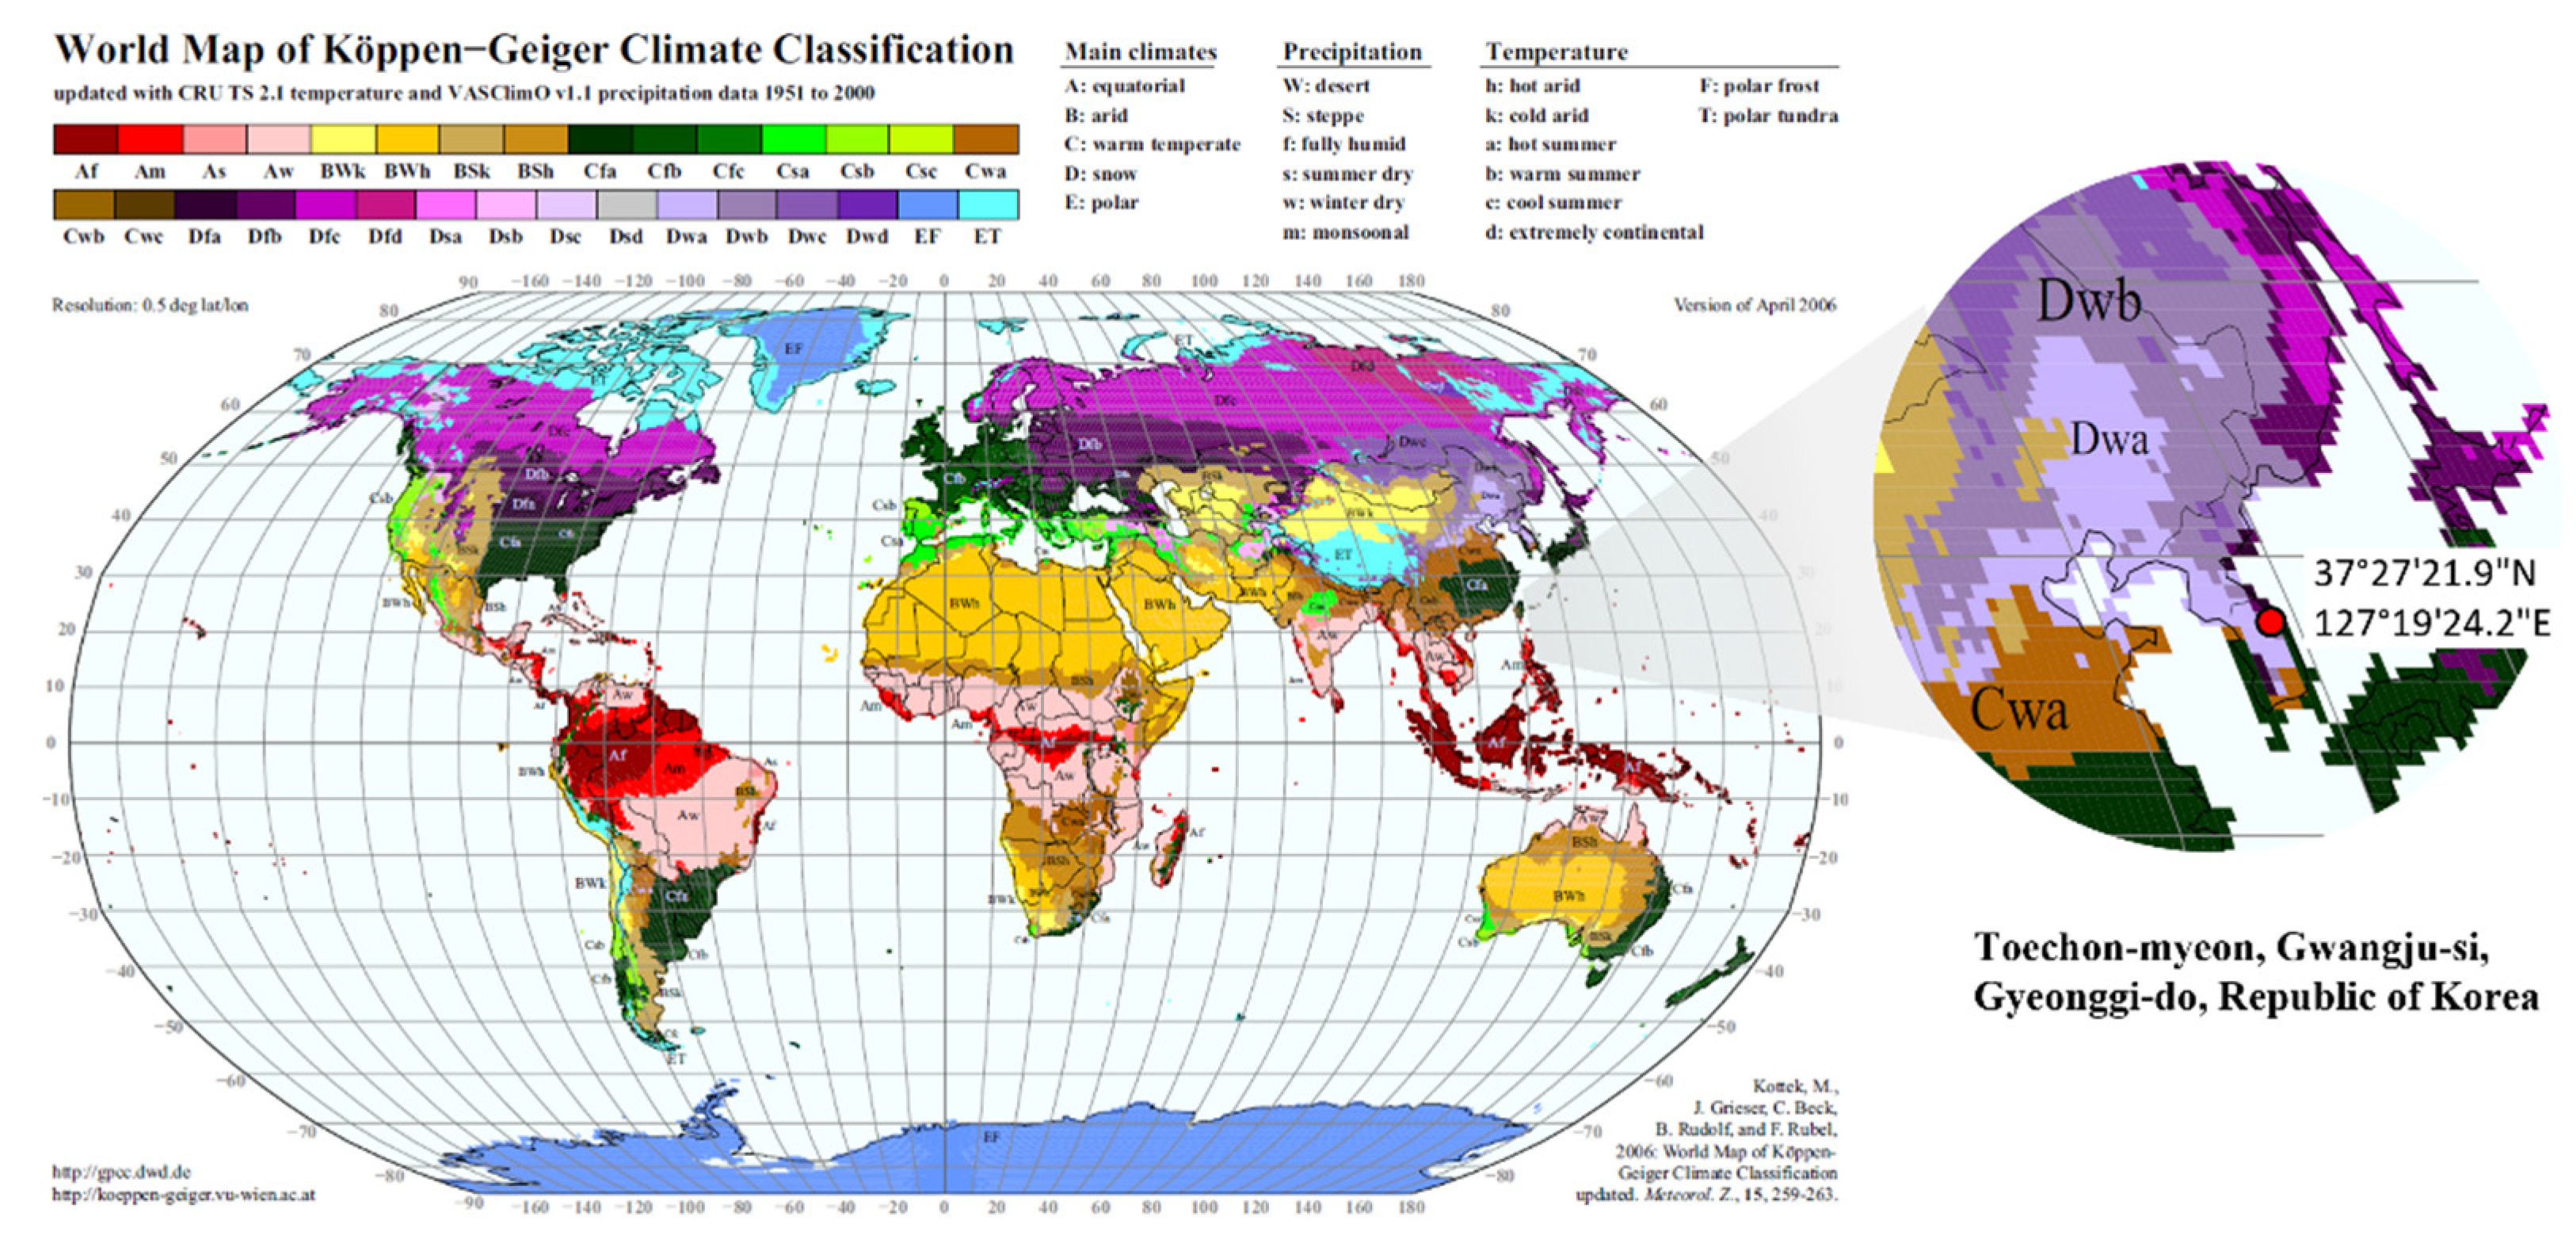
  40. WORLD MAPS OF KÖPPEN-GEIGER CLIMATE CLASSIFICATION Tilgjengeleg på. Available online: http://koeppen-geiger.vu-wien.ac.at/present.htm (accessed on 10 December 2021).
  41. Chen, D.; Chen, H.W. Using the Köppen classification to quantify climate variation and change: An example for 1901–2010. Environ. Dev. 2013, 6, 69–79. [Google Scholar] [CrossRef]
Figure 1. Schematic diagram of the heated window employed in this study.
Sustainability 14 00481 g001
Figure 2. Flow chart of the study.
Sustainability 14 00481 g002
Figure 3. (a) Model and (b) floor plan of the building.
Sustainability 14 00481 g003
Figure 4. Inside and outside views of (a) the south-facing window and (b) the north-facing window; (c) schematic diagram of the vacuum-heated window.
Sustainability 14 00481 g004
Figure 5. Temperature measurement points used in the experiments.
Sustainability 14 00481 g005
Figure 6. Heat fluxes in the heated window.
Sustainability 14 00481 g006
Figure 7. The Köppen–Geiger climate classification and information of the experimental region.
Sustainability 14 00481 g007
Figure 8. Outdoor temperature and irradiation during the experimental period.
Sustainability 14 00481 g008
Figure 9. Comparison of the nighttime heat gain ratio and input energy of heating windows between north-facing and south-facing windows and among the four cases.
Sustainability 14 00481 g009
Figure 10. Temperature variations at each measurement point on the heated windows: (a) January (case 1–3); (b) February (case 4).
Sustainability 14 00481 g010
Figure 11. Daily heat flux patterns for the south-facing heated window: (a) 00:00–07:00 and 18:00–23:00 (irradiance = 0 W/m2) sensitivity analysis, (b) 08:00–10:00 sensitivity analysis, and (c) 11:00–17:00 sensitivity analysis.
Sustainability 14 00481 g011
Figure 12. Daily heat flux patterns for the north-facing heated window: (a) 00:00–07:00 and 18:00–23:00 (irradiance = 0 W/m2) sensitivity analysis, (b) 08:00–10:00 sensitivity analysis, and (c) 11:00–17:00 sensitivity analysis.
Sustainability 14 00481 g012
Figure 13. Temperature and heat flux patterns under on–off operation for the south-facing heated window on a representative day.
Sustainability 14 00481 g013
Figure 14. Temperature and heat flux patterns under on–off operation for the north-facing heated window on a representative day.
Sustainability 14 00481 g014
Figure 15. Outdoor conditions and heat flux patterns on a representative day.
Sustainability 14 00481 g015
Table 1. Sensor specifications of the heat flux meter.
CharacteristicsLow Thermal Resistance (Thin Type) Compact
Operation temperature (°C)−20 to +120 (sensor); −25 to +60 (cable)
General sensitivity (mV/W·m−2)0.006
Repeatability (%)±2
Internal resistance (Ω)15–30
Thermal resistance (m2·°C/W)3.04 × 10−3
Dimensions (mm)50 × 50 × 0.7
Table 2. Experimental conditions employed in this study.
MonthCase T s a t (°C) Measurement Period (days)Rated Power (W)
January1307300
2297
3287
February42728300
Table 3. Thermal analysis results of the heated windows for each case.
Period Q i n   [ W / m 2 ] Q o u t [ W / m 2 ] T i s [°C] T i s a [°C] T i a [°C] D.P [°C]
Case 1
south-facing window
daytime97.4−32.938.029.728.616.9
nighttime115.7−31.938.629.128.217.0
all day107.6−32.438.429.328.416.9
Case 1
north-facing window
daytime141.6−24.437.524.020.116.4
nighttime149.1−28.838.224.020.015.7
all day145.8−26.837.924.020.116.0
Case 2
south-facing window
daytime90.7−27.036.628.927.116.0
nighttime95.3−26.436.428.427.115.7
all day93.2−27.736.528.627.115.8
Case 2
north-facing window
daytime126.0−21.235.523.219.714.1
nighttime129.1−24.136.223.620.114.1
all day127.7−22.735.823.419.914.1
Case 3
south-facing window
daytime68.8−24.535.329.328.717.1
nighttime65.6−23.233.928.328.515.6
all day67.1−23.834.628.828.616.3
Case 3
north-facing window
daytime88.8−18.033.424.523.318.7
nighttime95.0−21.034.024.523.118.3
all day92.2−19.633.724.523.218.5
Case 4
south-facing window
daytime72.0−26.134.828.928.216.5
nighttime58.4−22.032.527.428.214.2
all day65.0−24.033.628.128.215.3
Case 4
north-facing window
daytime83.6−15.632.123.623.018.3
nighttime93.2−20.333.123.823.019.2
all day88.5−18.032.623.723.018.8
Publisher’s Note: MDPI stays neutral with regard to jurisdictional claims in published maps and institutional affiliations.

