Article

Statistical Modeling of Energy Harvesting in Hybrid PLC-WLC Channels

by
Victor Fernandes
1,*,
Thiago F. A. Nogueira
2,
H. Vincent Poor
3 and
Moisés V. Ribeiro
2
1
Department of Telecommunications Engineering, Fluminense Federal University, Niterói 24210 240, RJ, Brazil
2
Department of Electrical Engineering, Federal University of Juiz de Fora, Juiz de Fora 36036 330, MG, Brazil
3
Department of Electrical and Computer Engineering, Princeton University, Princeton, NJ 08544, USA
*
Author to whom correspondence should be addressed.
Sustainability 2022, 14(1), 442; https://doi.org/10.3390/su14010442
Submission received: 29 October 2021 / Revised: 20 December 2021 / Accepted: 23 December 2021 / Published: 31 December 2021
(This article belongs to the Special Issue Energy Efficiency in Power Lines)

Abstract

:
This work introduces statistical models for the energy harvested from the in-home hybrid power line-wireless channel in the frequency band from 0 to 100 MHz. Based on numerical analyses carried out over the data set obtained from a measurement campaign together with the use of the maximum likelihood value criterion and the adoption of five distinct power masks for power allocation, it is shown that the log-normal distribution yields the best model for the energies harvested from the free-of-noise received signal and from the additive noise in this setting. Additionally, the total harvested energy can be modeled as the sum of these two statistically independent random variables. Thus, it is shown that the energies harvested from this kind of hybrid channel is an easy-to-simulate phenomenon when carrying out research related to energy-efficient and self-sustainable networks.

1. Introduction

Several initiatives have been pursued to explore renewable energy sources and to increase the energy efficiency of electric power grids. Distinct sectors associated with the ongoing and necessary modernization of our society rely heavily on the intensive use of energy. These include the telecommunications sector, which is responsible for something between 2 and 3% of the global energy demand [1]. The energy demand of the telecommunications sector will only increase with the massive deployment of 5G and 6G technologies because of the necessity of offering ubiquitous data communication systems for dealing with the explosive deployment of IoT, Smart Grid (SGs), Smart Cities, and Industry 4.0 technologies.
Given the necessity of providing everything, everywhere, and anytime connectivity to large numbers of applications with disparate energy consumption requirements, several research directions are being traced and, among them, the use of the hybridism concept in data communications systems is being investigated [2,3,4,5,6,7,8,9]. For instance, ref. [10,11,12,13,14] discussed the challenges, drawbacks, and benefits related to the joint use of power line communication (PLC), wireless communication (WLC), and visible light communication (VLC) for data communication purposes. However, in some cases, the concatenation of these channels can show interesting opportunities for assisting the aforementioned applications.
Regarding the combination of PLC and WLC technologies, it has been demonstrated that the well-established use of unshielded power lines produces unwanted electromagnetic radiation [15,16,17] that, under a different perspective, can be exploited to constitute new telecommunication infrastructure. In this regard, ref. [18] explored this perspective and, based on a measurement campaign, pointed out the usefulness of unshielded power lines for data communication purposes. Essentially, [18] showed that PLC and WLC devices operating in the same frequency band (i.e., 1.7 –100 MHz) may communicate with each other if WLC devices locate up to 6 meters from the power outlet, which the PLC device is connected to. Consequently, ref. [18] introduced the hybrid PLC-WLC channel, which is a concatenation of PLC and WLC channels, to model this new data communication medium. Further, the authors extended this investigation to the statistical modeling of the parameters that describe such a hybrid channel [19]. The quantification of the hidden potential of the unwanted radiation in unshielded power lines has been stimulating a great interest in increasing flexibility and coverage of data communication systems based on PLC systems.
To advance the investigation of hybrid PLC-WLC systems, it is necessary to develop energy-efficient strategies for powering PLC and WLC nodes. Energy harvesting (EH) is a natural approach to this problem. EH is defined as the process of converting the energy captured from external sources in any form (e.g., solar [20], thermal [21], electromagnetic radiation [22], among others [23]) into electric energy. In this context, [24] showed that hybrid PLC-WLC channels can bring benefits not only related to introducing flexible PLC systems but also to perform EH when the dedicated radio-frequency EH approach [25,26] applies. More specifically, ref. [24] concluded that feasible values of energy can be harvested from hybrid PLC-WLC channels with high probability. Consequently, low-power devices can successfully make use of it for data communication.
Aiming to advance the discussion about EH in hybrid PLC-WLC channels and to introduce tools to facilitate further investigations driven by the necessity of increasing the energy efficiency of electric power grids, this work focused on the statistical modeling of the energy that can be harvested from these channels by PLC and WLC devices. Considering the use of a data set obtained from a measurement campaign carried out using in-home facilities and the frequency bandwidth 0–100 MHz, this study offers the following contributions:
  • Introduction of statistical models of the harvested energy from the free-of-noise (FoN) received signal, the additive noise, and the total received signal.
  • Comparisons among complementary cumulative distribution function (CCDFs) related to the data set and the proposed model, when five distinct power masks and two typical distance ranges of the WLC device from the outlet are considered.
The investigations discussed in this paper allow us to come up with the following findings:
  • Supported by the use of a statistical criterion, the random variable that best models the harvested energy from the FoN received signal and the additive noise has a log-normal distribution. Therefore, the harvested energy from the combination of them is also a random variable with a log-normal distribution.
  • The harvested energy is turned into an easy-to-simulate feature for assisting the proposition of tools, approaches, and devices for harvesting energy from hybrid PLC-WLC channels, and, as a consequence, for introducing energy-efficient and self-sustainable networks. In other words, hybrid PLC-WLC channels are appealing for applying EH techniques in sensors networks, due to the large numbers of connected devices and the difficulty of powering them otherwise.
The rest of this paper is organized as follows: Section 2 introduces the research problem, while Section 3 addresses the mathematical formulation for harvesting energy from hybrid PLC-WLC channels. Section 4 focuses on briefly describing how the data set was obtained. Section 5 addresses statistical analyses and modeling, while concluding remarks are given in Section 6.

2. Problem Formulation

According to [24], Figure 1 shows the environment from which hybrid PLC-WLC channels emerge. Essentially, these channels characterize the medium where the PLC device establishes half-duplex data communication with the nearby WLC device. The half-duplex mode is determined by the use of the same frequency band for data communication by both devices. In the way it is designed, this data communication may take place in two possible and opposite directions, which are the PLC-to-WLC (PLC → WLC) and WLC-to-PLC (WLC → PLC) ones. The former occurs when the PLC device injects a signal into the electromagnetic unshielded power line through the PLC coupler [27], which radiates an electromagnetic field in the vicinity of the power line, making it detectable by the antenna of the WLC device. On the other hand, the latter occurs when the WLC device transmits an electromagnetic signal, which is partially induced into the power line and then captured by the PLC device. Note that in this kind of hybrid medium, the electric power grid and the air are seen as only one data communication medium, in which nodes are connected to power lines by using a PLC coupler or to the air by using an antenna. Thus, this kind of data communication path is termed hybrid PLC-WLC channel, which is different from the hybrid PLC/WLC channel that stands for the parallel use of PLC and WLC media [2,3,4,5,6].
For the sake of simplicity, the term hybrid PLC-WLC channel will be used to designate both PLC → WLC and WLC → PLC concatenated channels due to the symmetry of the channel impulse response (CIRs) related to both directions when the access impedance of modems are equal [18]. Assuming that the transmitted signal and the additive noise are, at least, wide sense stationary random processes, and the hybrid PLC-WLC channel is a linear and stochastic system, the mathematical formulations in [24] state that the output of this stochastic system (i.e., the total received signal) is a random process that can be represented by
Y q ( t ) = Y ~ q ( t ) + V q ( t ) , = X q ( τ ) h q ( t , τ ) d τ + V q ( t ) ,
in which Y ~ q ( t ) is a sample function of the FoN received signal; V q ( t ) is the sample function of the additive noise at the receiver’s input; X q ( t ) is a sample function of the transmitted signal; h q ( t , τ ) is a sample function of the CIR of the hybrid PLC-WLC channel at the instant t, when an impulse is applied at the instant τ at the channel’s input; q { PLC → WLC, WLC → PLC} denote the data communication links associated with the two aforementioned directions, where V PLC WLC ( t ) refers to the WLC additive noise as well as V WLC PLC ( t ) represents the PLC additive noise. Note that X q ( t ) and V q ( t ) are independent stochastic processes.
Together with the introduction of this new hybrid medium for data communication arises the opportunity for bringing an energy perspective to it. In other words, if hybrid PLC-WLC channels can be used for data communication, then it is also possible to take advantage of it as a new source of energy. The energy in the unwanted interference for PLC and WLC devices operating in the same frequency band can be of tremendous importance for future low-power devices. Reusing, or harvesting, this energy can bring new possibilities in terms of sustainability for low-power devices. For instance, two off-grid devices could maintain data communication with each other by means of such hybrid channels, whereas one is powered by harvested energy and the other is not. Specifically, the device that has a power supply is capable of transmitting energy to the other by means of the EH in hybrid PLC-WLC channels. Expanding this idea for a high-density network (e.g., sensors network) would result in an even higher level of energy exchange among PLC and WLC nodes, and, as a consequence, a large number of devices would be fed.
As the received signals at the input of the PLC and WLC devices are useful for EH purposes, it is relevant to statistically quantify the amount of energy that can be harvested at the input of these devices for assisting the introduction of energy-efficient and self-sustainable data networks. Moreover, it is of utmost importance to come up with a sort of modeling of energy harvested from a measured data set related to the hybrid PLC-WLC medium. In this regard, the following research question arises: Can we derive simple modeling of the harvested energy from hybrid PLC-WLC channels when the dedicated approach applies? The next sections will provide an answer to this research question.

3. Harvesting Energy from the Hybrid Channel

This section deals with the mathematical formulation of the harvested energy obtained from hybrid PLC-WLC channels by considering five distinct power masks. To this end, Section 3.1 presents the FoN received signal’s power formulation, and Section 3.2 does the same for the additive noise’s power. Further, Section 3.3 discusses the mathematical formulation of the total harvested energy from the total received signal, while Section 3.4 presents the five possible power maskings.

3.1. FoN Received Signal’s Power

We define X q ( t ) as the resulting signal after the submission of the generated signal to a bit and power allocation technique and X ~ q ( t ) as the signal generated by the transmitter. The power spectral densities of X q ( t ) and X ~ q ( t ) are given by S X q ( f ) = ϱ q ( f ) S X ~ q ( f ) and S X ~ q ( f ) = 1 , B w f 0 , respectively, in which B w is the frequency bandwidth. The multiplication of S X ~ q ( f ) by ϱ q ( f ) is made in order to facilitate the application of a power mask, ϱ q ( f ) , for correctly allocating the transmission power, which is given by P x q = ϱ q ( f ) d f , in the signal generated by the transmitter.
Let H q ( t , f ) = F { h q ( t , τ ) } be the channel frequency response (CFR) of the sample function of the CIR of the hybrid PLC-WLC channel in the instant t when an impulse was applied in the instant τ , where F { · } is the Fourier transform operator. Additionally, the CFR of hybrid PLC-WLC channels are considered time-invariant during its coherence time, T c R + , then, H q ( t , f ) = H i q ( f ) | t [ i T c , ( i + 1 ) T c ] , i Z + . That said, the FoN received signal’s power at the output of a hybrid PLC-WLC channel within the time interval T c is given by
P Y ~ , i q = B w ϱ i q ( f ) | H i q ( f ) | 2 d f ,
in which ϱ i q ( f ) and | H i q ( f ) | 2 denote the power mask adopted in the i th channel realization and the squared magnitude of H i q ( f ) , respectively.
If we define T A C R + as the cycle of the alternating current (AC) mains voltage signal, then the FoN received signal’s expected power per cycle of the AC mains voltage signal can be expressed as
P Y ~ , c q = i = 1 N P P Y ~ , i q p i ,
in which p i is the probability of the i th channel realization’s occurrence and { N P Z | N P = T A C / T c } , where x = max { m Z | m x } is the number of times that the cycle of the AC mains voltage signal is greater than the coherence time.

3.2. Additive Noise’s Power

The additive noise represents the summation of all components of the receiver device’s input noise, and, as a consequence, we deal with both PLC and WLC additive noises, which have distinct characteristics. The PLC additive noise is modeled as a cyclostationary random process [28], and, thus, it has both a periodic mean value and an autocorrelation function with respect to the cycle of the AC mains voltage signal. On the other hand, the WLC additive noise is modeled as a colored Gaussian random process. For both of them, an estimate of the additive noise’s average power per cycle of the AC mains voltage signal is evaluated as
P V , c q = 1 T A C T A C | V q ( t ) | 2 d t .

3.3. Total Harvested Energy per Cycle

We assume that the electronic circuit responsible for harvesting and storing the energy from the hybrid PLC-WLC channel has an overall efficiency factor [29], η q R + , 1 η q > 0 . Consequently, the total harvested energy (i.e., the energy harvested from the total received signal) during a time interval equal to T A C can be modeled as a random variable as follows
E Y q = η q P Y , c q T A C , = η q P Y ~ , c q T A C + η q P V , c q T A C , = E Y ~ q + E V q ,
where P Y , c q is the total received signal’s expected power per cycle of the AC mains voltage signal. Further, E Y ~ q is a random variable that models the harvested energy from the FoN received signal of the hybrid PLC-WLC channel, while E V q is a random variable that models the harvested energy from the additive noise. Additionally, expected values of E Y ~ q , E V q , and E Y q are expressed as μ E Y ~ q = E { E Y ~ q } , μ E V q = E { E V q } , and μ E Y q = E { E Y q } = μ E Y ~ q + μ E V q , respectively, in which E { · } denotes the expectation operator.

3.4. Harvesting Energy Based on Power Masking

According to [24], five different power masks can be applied to the generated signal. These power masks vary from practical to theoretical assumptions by the transmitter (PLC or WLC device), and they are detailed in the following:
  • Power Mask #1 (Uniform): the transmission power P x q is equally distributed all over the whole frequency bandwidth. Mathematically, ϱ q ( f ) = P x q / B w , f S B w , in which S B w denotes the range of frequencies that are contained in the transmission frequency band.
  • Power Mask #2 (IEEE 1901): the transmission power P x q is unequally distributed in two frequency ranges, in which ϱ q ( f ) = ( K 55 ) dBm/Hz is used in the frequency band covered by 1.7–30 MHz, and ϱ q ( f ) = ( K 85 ) dBm/Hz applies in the frequency band delimited by 30–100 MHz. The proportionality factor K P x q 20 is used to correctly distribute the transmission power respecting the aforementioned power densities, and it is given in dB, whereas P x q and 20 are dBm values.
  • Power Mask #3 (Uniform B u ): the transmission power P x q is equally distributed to a shortened frequency bandwidth B u < B w by means of the median operator. For applying the median operator, | H q ( f ) | 2 ¯ = E | H i q ( f ) | 2 is discretized as
    | H q [ k ] | 2 ¯ = | H q ( f ) | 2 ¯ | f = k B s , k = 0 , 1 , , N 1 ,
    where N is the discretized CFR’s length of the hybrid PLC-WLC channel, and B s = B w / N is the subchannel bandwidth. This shortened frequency bandwidth, B u , covers a range of frequencies that is centered at the frequency f c = N C f s , in which | H q [ N C ] | 2 ¯ = max k { | H q [ k ] | 2 ¯ } and is upper and lower bounded by the frequencies f c ± f u . Such bounds are given by maximizing B u subjected to 10 log 10 ( | H q [ N C ] | 2 ¯ median { | H q [ ] | 2 ¯ } ) A dB, where { N C N u , N C ( N u 1 ) , , N C , , N C + ( N u 1 ) , N C + N u } , N u = f u / f s , and x = min { n Z | n x } . In the way it was designed, it is ensured that | H q [ ] | 2 ¯ has an odd length equal to 2 N u + 1 , and its median is given by the N u -th term. That said, ϱ q ( f ) = P x q / B u , f S B u , in which S B u denotes the range of frequencies that follow this restriction.
  • Power Mask #4 (Optimal B o ): the transmission power P x q is allocated to the set of frequency tones associated with the highest squared magnitudes of the CFR. This kind of power allocation is performed in the frequency bandwidth equal to B o = γ B w , 1 γ > 0 , and ϱ q ( f ) = P x q / B o , f S B o , in which S B o denotes the set of frequencies of the highest squared magnitudes of the CFR.
  • Power Mask #5 (single tone): the transmission power P x q is totally allocated to the single frequency tone associated with the unique highest squared magnitude of the CFR. The bandwidth of this sole tone is equal to the bandwidth occupied by one subchannel, B s , i.e., ϱ q ( f ) = P x q / B s , f S B s , in which S B s denotes the range of frequencies occupied by the single tone with the highest squared magnitude value of the CFR.
It is important to point out that Power Masks #1, #2, and #3 apply the uniform power allocation, in which Power Masks #1 and #2 do not require the knowledge of channel state information (CSI), while Power Mask #3 depends on the statistical average of CFRs. Regarding Power Masks #4 and #5, the power allocation of the transmission power is no longer uniform. In fact, Power Mask #4 equally allocates the transmission power to a part of the frequency band associated with the highest magnitudes of CFR, which may not be consecutive, while Power Mask #5 allocates the transmission power to a single frequency tone. Therefore, Power Masks #4 and #5 rely on the knowledge of the complete CSI at each time period that corresponds to the coherence time of the hybrid PLC-WLC channel.
Note that Power Masks #1 and #2 are simple to implement due to their uniform shape and independence of CSI. Furthermore, Power Mask #3 requires the knowledge of the statistical average of the squared magnitude of the CFR; however, it is still based on the uniform power allocation. As a result, Power Mask #3 offers the best trade-off between practical and theoretical assumptions. Lastly, Power Masks #4 and #5 require complete CSI during a time interval corresponding to the coherence time of the hybrid PLC-WLC channel, which make them the most theoretical power masks. In possession of this set of distinct power masks, it is possible to analyze a variety of possibilities ranging from the less complex/practical case (Power Mask #1) to the most complex/theoretical case (Power Mask #5) for performing dedicated EH.

4. Data Set

The measured data set consists of a total of 175,428 estimates of the hybrid PLC-WLC CFRs provided by [18] and millions of samples of the PLC and WLC additive noises, which were acquired at the inputs of both PLC and WLC devices, respectively. In order to obtain this data set, the indoor facilities of seven residences were considered [30], where the measurement campaign was carried out. These residences are located at Juiz de Fora, a city belonging to Minas Gerais State, in Brazil. The measurement setup is presented in [18] and the methodology in [31], while the equipment and coupling are discussed in [27,32], respectively. Basically, the measurement setup is composed of the following components [18]:
  • PLC device: it is connected to the power outlet by means of the PLC coupler, and is responsible for injecting and extracting sounding signals into and from the power line, respectively.
  • PLC coupler: it is a passband analog filter that promotes the interface between the PLC device and the power line. Additionally, it blocks the AC mains signal to prevent damage to the PLC device and limits the frequency band of injected and extracted signals.
  • WLC device: it is connected to the air by means of the antenna and is responsible for injecting and extracting sounding signals into and from the wireless medium, respectively.
  • Antenna: it is a transducer designed to convert electric signals into electromagnetic waves and vice-versa.
Two typical distance ranges of the WLC device from the outlet in which the PLC device is connected were considered during the measurement campaign, which define two kinds of hybrid PLC-WLC channels:
  • Hybrid short-path (SP) PLC-WLC channel: it defines a kind of a channel in which the WLC device is randomly positioned within a 2 m radius circle centered at the outlet in which the PLC device is connected.
  • Hybrid long-path (LP) PLC-WLC channel: it refers to the channel in which the WLC device is randomly placed into an area defined as a swept circle, having an outer and inner radius of 6 m and 2 m, respectively, centered in the outlet in which the PLC device is connected.
The estimation of the hybrid SP and LP PLC-WLC channels were realized by sending consecutively Hermitian symmetric orthogonal frequency-division multiplexing symbols, at each time interval equal to T sym = ( 2 N + L c p ) T s , through these media. Such parameters and other relevant ones regarding the channels and power masks are summarized in Table 1 (see [24] for more details).

5. Statistical Analyses and Modeling

The statistical modelings consist of fitting the harvested energy from the data set (CFRs and additive noises), assuming the five power masks and distinct values of both the transmission power and the overall efficiency factor, with a given statistical distribution such that its probability density function approximates the harvested energy’s histogram shape based on a certain statistic criterion. In other words, the parameters of each statistical distribution (i.e., S r v = { Log - normal , Beta , Exponential , and Rayleigh } ) are varied, and the one with the maximum log-likelihood value (LLV) in relation to the histogram generated with the samples of the harvested energy is selected. The elements of the set of statistical distributions, S r v , were chosen in order to represent the statistical distributions that model random variables belonging to R + and that are commonly used in the telecommunications field. Concerning the choice of fitting criterion, the maximization of LLV, often known as maximum likelihood estimation in its non-logarithmic form, is widely adopted in the literature [19,33,34] because it is typically used as the strongest indication in comparison to other criteria such as the Akaike information criterion, the Bayesian information criterion, and the efficient determination criterion. Based on this discussion, the likelihood of parameters θ = { θ 1 , θ 2 , , θ k } for an independent and identically distributed random sample data set X = { x 1 , x 2 , , x n } is
( θ ) = i = 1 n f ( θ | x i ) ,
in which f ( θ | x i ) is the likelihood of parameters θ for a single outcome x i X . Thus, the LLV is expressed as
L ( θ ) = ln { ( θ ) } = i = 1 n ln { f ( θ | x i ) } .
Once the statistical distribution is selected, its parameters can be obtained through the maximization of LLVs as
θ ^ = arg max θ L ( θ ) .
In this regard, Table 2, Table 3 and Table 4 list the highest LLVs for the harvested energy from the FoN received signal of hybrid SP PLC-WLC channels, hybrid LP PLC-WLC channels, and from the additive noises, respectively, when each statistical distribution in S r v is considered, P x q = 20 dBm, and η q = 1 , q . With the exception of the WLC additive noise, the log-normal distribution yields the highest LLVs among the ones belonging to the S r v set. Concerning the WLC additive noise, it can be seen in Table 4 that the LLV difference between beta and log-normal distributions is almost negligible. Mathematically, the difference between these values does not exceed 0.5 % , which makes them very close approximations to each other. Although the beta distribution is the best-fitting distribution for the WLC additive noise, the log-normal distribution is easier to handle mathematically than the beta one, and, as a consequence, the log-normal distribution is used for the statistical modeling of the WLC additive noise. In this regard, the log-normal distribution is described by two parameters ( μ and σ ), and these parameters are directly related to its mean and variance [35], respectively, by
m = e μ + σ 2 / 2
and
v = e 2 μ + σ 2 ( e σ 2 1 ) .
By means of the LLVs in Table 2, Table 3 and Table 4, one can conclude that the log-normal distribution yields the best representation of the harvested energy from FoN received signals and additive noises in hybrid PLC-WLC channels. In addition, the harvested energy from the total received signal (FoN received signal + additive noise) straightforwardly made the summation of these two distinct parts, and, consequently, it is modeled as the summation of these two log-normally distributed random variables. Mathematically, the total harvested energy from hybrid PLC-WLC channels during T A C is a random variable expressed as
E Y q = E Y ~ q + E V q ,
in which E Y ~ q exp ( Z E Y ~ q ) and E V q exp ( Z E V q ) are random variables with log-normal distribution that model the harvested energy of the FoN received signal and additive noises during T A C , respectively. Furthermore, Z E Y ~ q N ( μ Y ~ q , σ Y ~ q 2 ) is normally distributed with mean μ Y ~ q and variance σ Y ~ q 2 , while Z E V q N ( μ V q , σ V q 2 ) is normally distributed with mean μ V q and variance σ V q 2 . Note that (12) allows to easily obtain the total harvested energy of a WLC or PLC device, which is immersed in a environment characterized by hybrid PLC-WLC channels. This can be accomplished by substituting q by PLC WLC or WLC PLC .
As expected, changing P x q and η q only affects the amplitude of harvested energies. Therefore, for a given power mask, σ does not change for distinct values of P x q and η q . However, it is observed that there is a logarithmic relation between μ and η q as well as between μ and P x q . Mathematically, for the harvested energy from the FoN received signal, this relation can be expressed as
μ Y ~ q ( η q , P x q ) = μ 0 + ln ( η q P x q ) ,
where P x q is the value of transmission power in mW, and μ 0 represents the parameter μ of a log-normal distribution when P x q = 1 mW and η q = 1 . The parameters ( μ 0 , σ Y ~ q ) are obtained by means of (9) and are given in Table 5 for the five distinct power masks and distinct channel distance ranges.
Additionally, PLC and WLC additive noises can be similarly modeled. Nevertheless, it is important to emphasize that P x q does not affect the modeling of the harvested energy from additive noises because it only influences the FoN received signal. Therefore, the relation between μ and η q for the harvested energy from additive noises is given by
μ V q ( η q ) = μ 0 + ln ( η q ) ,
in which μ 0 denotes the μ parameter of the log-normal distribution for η q = 1 . The parameters ( μ 0 , σ V q ) are also obtained by evaluating (9) and are given in Table 6 by considering q = PLC WLC and q = WLC PLC , respectively.
In the following, Section 5.1 and Section 5.2 detail two cases for the application of the presented statistical modeling. The first case assumes that a WLC device harvests energy from the total received signal that was transmitted by a PLC device, through the hybrid SP PLC-WLC channel, with Power Mask #2 and P x PLC WLC = 23 dBm because the given power mask and the amount of transmission power are usually adopted by broadband-PLC devices. Additionally, a practical value of the overall efficiency factor for WLC device’s EH circuitry is used, η PLC WLC = 0.5 . The second case provides an evaluation of the harvested energy by a PLC device from the total received signal that was transmitted by a WLC device, through the hybrid LP PLC-WLC channel, using Power Mask #1 and P x WLC PLC = 20 dBm because the chosen power mask and the value of transmission power are commonly adopted by WLC devices. Furthermore, the overall efficiency factor of the PLC device’s EH circuitry is expected to be low due to time-varying access impedance of electric power systems; thus, η WLC PLC = 0.2 is adopted.

5.1. WLC Device-Harvesting Energy

Let us assume that the WLC device has η PLC WLC = 0.5 and harvests its energy from a hybrid SP PLC-WLC channel, while the PLC device uses Power Mask #2 and P x PLC WLC = 23 dBm. The total harvested energy during T A C is modeled as a random variable equal to E Y PLC WLC = E Y ~ PLC WLC + E V PLC WLC , where
E Y ~ PLC WLC exp N ( μ Y ~ PLC WLC , σ Y ~ PLC WLC 2 )
and
E V PLC WLC exp N ( μ V PLC WLC , σ V PLC WLC 2 ) .
The two log-normal μ parameters can be calculated using (13) and (14) with the values presented in Table 5 and Table 6, while σ parameters are taken directly from these tables. As a result, μ Y ~ PLC WLC = 14.7550 and μ V PLC WLC = 15.5414 as well as σ Y ~ PLC WLC = 1.0494 and σ V PLC WLC = 1.6263 . These values are obtained as follows:
μ Y ~ PLC WLC = 19.3577 + ln ( 0.5 · 199.5 ) = 14.7550
and
μ V PLC WLC = 14.8483 + ln ( 0.5 ) = 15.5414 .
Quantitatively, the harvested energy from the FoN received signal that was transmitted by the PLC device, through the hybrid SP PLC-WLC channel, and received by the WLC device during T A C follows a log-normal distribution with mean and standard deviation values approximately equal to 0.68   μ J and 0.96   μ J, respectively. Additionally, the WLC additive noise resulted in an energy amount described by a log-normal distribution with mean and standard deviation equal to 0.67   μ J and 2.42   μ J, respectively, at the WLC device’s energy storage element. By assuming their mean values, the summation of the harvested energies would result in 1.35   μ J of average energy during T A C . Note that, in this case, both the FoN received signal and the WLC additive noise contributes similarly to the total harvested energy.

5.2. PLC Device-Harvesting Energy

In this case, the PLC device has η WLC PLC = 0.2 and harvests the energy from a hybrid SP PLC-WLC channel, while the WLC device uses Power Mask #1 and P x WLC PLC = 20 dBm. Thus, the total harvested energy during T A C is a random variable given by E Y WLC PLC = E Y ~ WLC PLC + E V WLC PLC , in which
E Y ~ WLC PLC exp N ( μ Y ~ WLC PLC , σ Y ~ WLC PLC 2 )
and
E V WLC PLC exp N ( μ V WLC PLC , σ V WLC PLC 2 ) .
Again, the μ parameters of E Y ~ WLC PLC and E V WLC PLC can be calculated using (13) and (14), supported by the values presented in Table 5 and Table 6, while σ parameters are taken directly from these tables. Consequently, μ Y ~ WLC PLC = 15.5844 and μ V WLC PLC = 13.4211 . Additionally, σ Y ~ WLC PLC = 0.7088 and σ V WLC PLC = 1.7687 . These values are obtained as follows:
μ Y ~ WLC PLC = 18.5801 + ln ( 0.2 · 100 ) = 15.5844
and
μ V WLC PLC = 11.8117 + ln ( 0.2 ) = 13.4211 .
The FoN received signals originated in the WLC device, transmitted through the hybrid SP PLC-WLC channel, and received by the PLC device, which resulted in a harvested energy that follows a log-normal distribution with mean and standard deviation that are approximately equal to 0.22   μ J and 0.18   μ J, respectively. Additionally, the PLC additive noise produced an energy amount described by a log-normal distribution with mean and standard deviation equal to 7.09   μ J and 33.13   μ J, respectively, at the PLC device’s energy storage element. As a result, the average harvested energy during T A C is equal to 7.31   μ J. Here, the PLC additive noise has a considerable contribution to the total harvested energy.

5.3. Statistical Models versus Measured Data Set

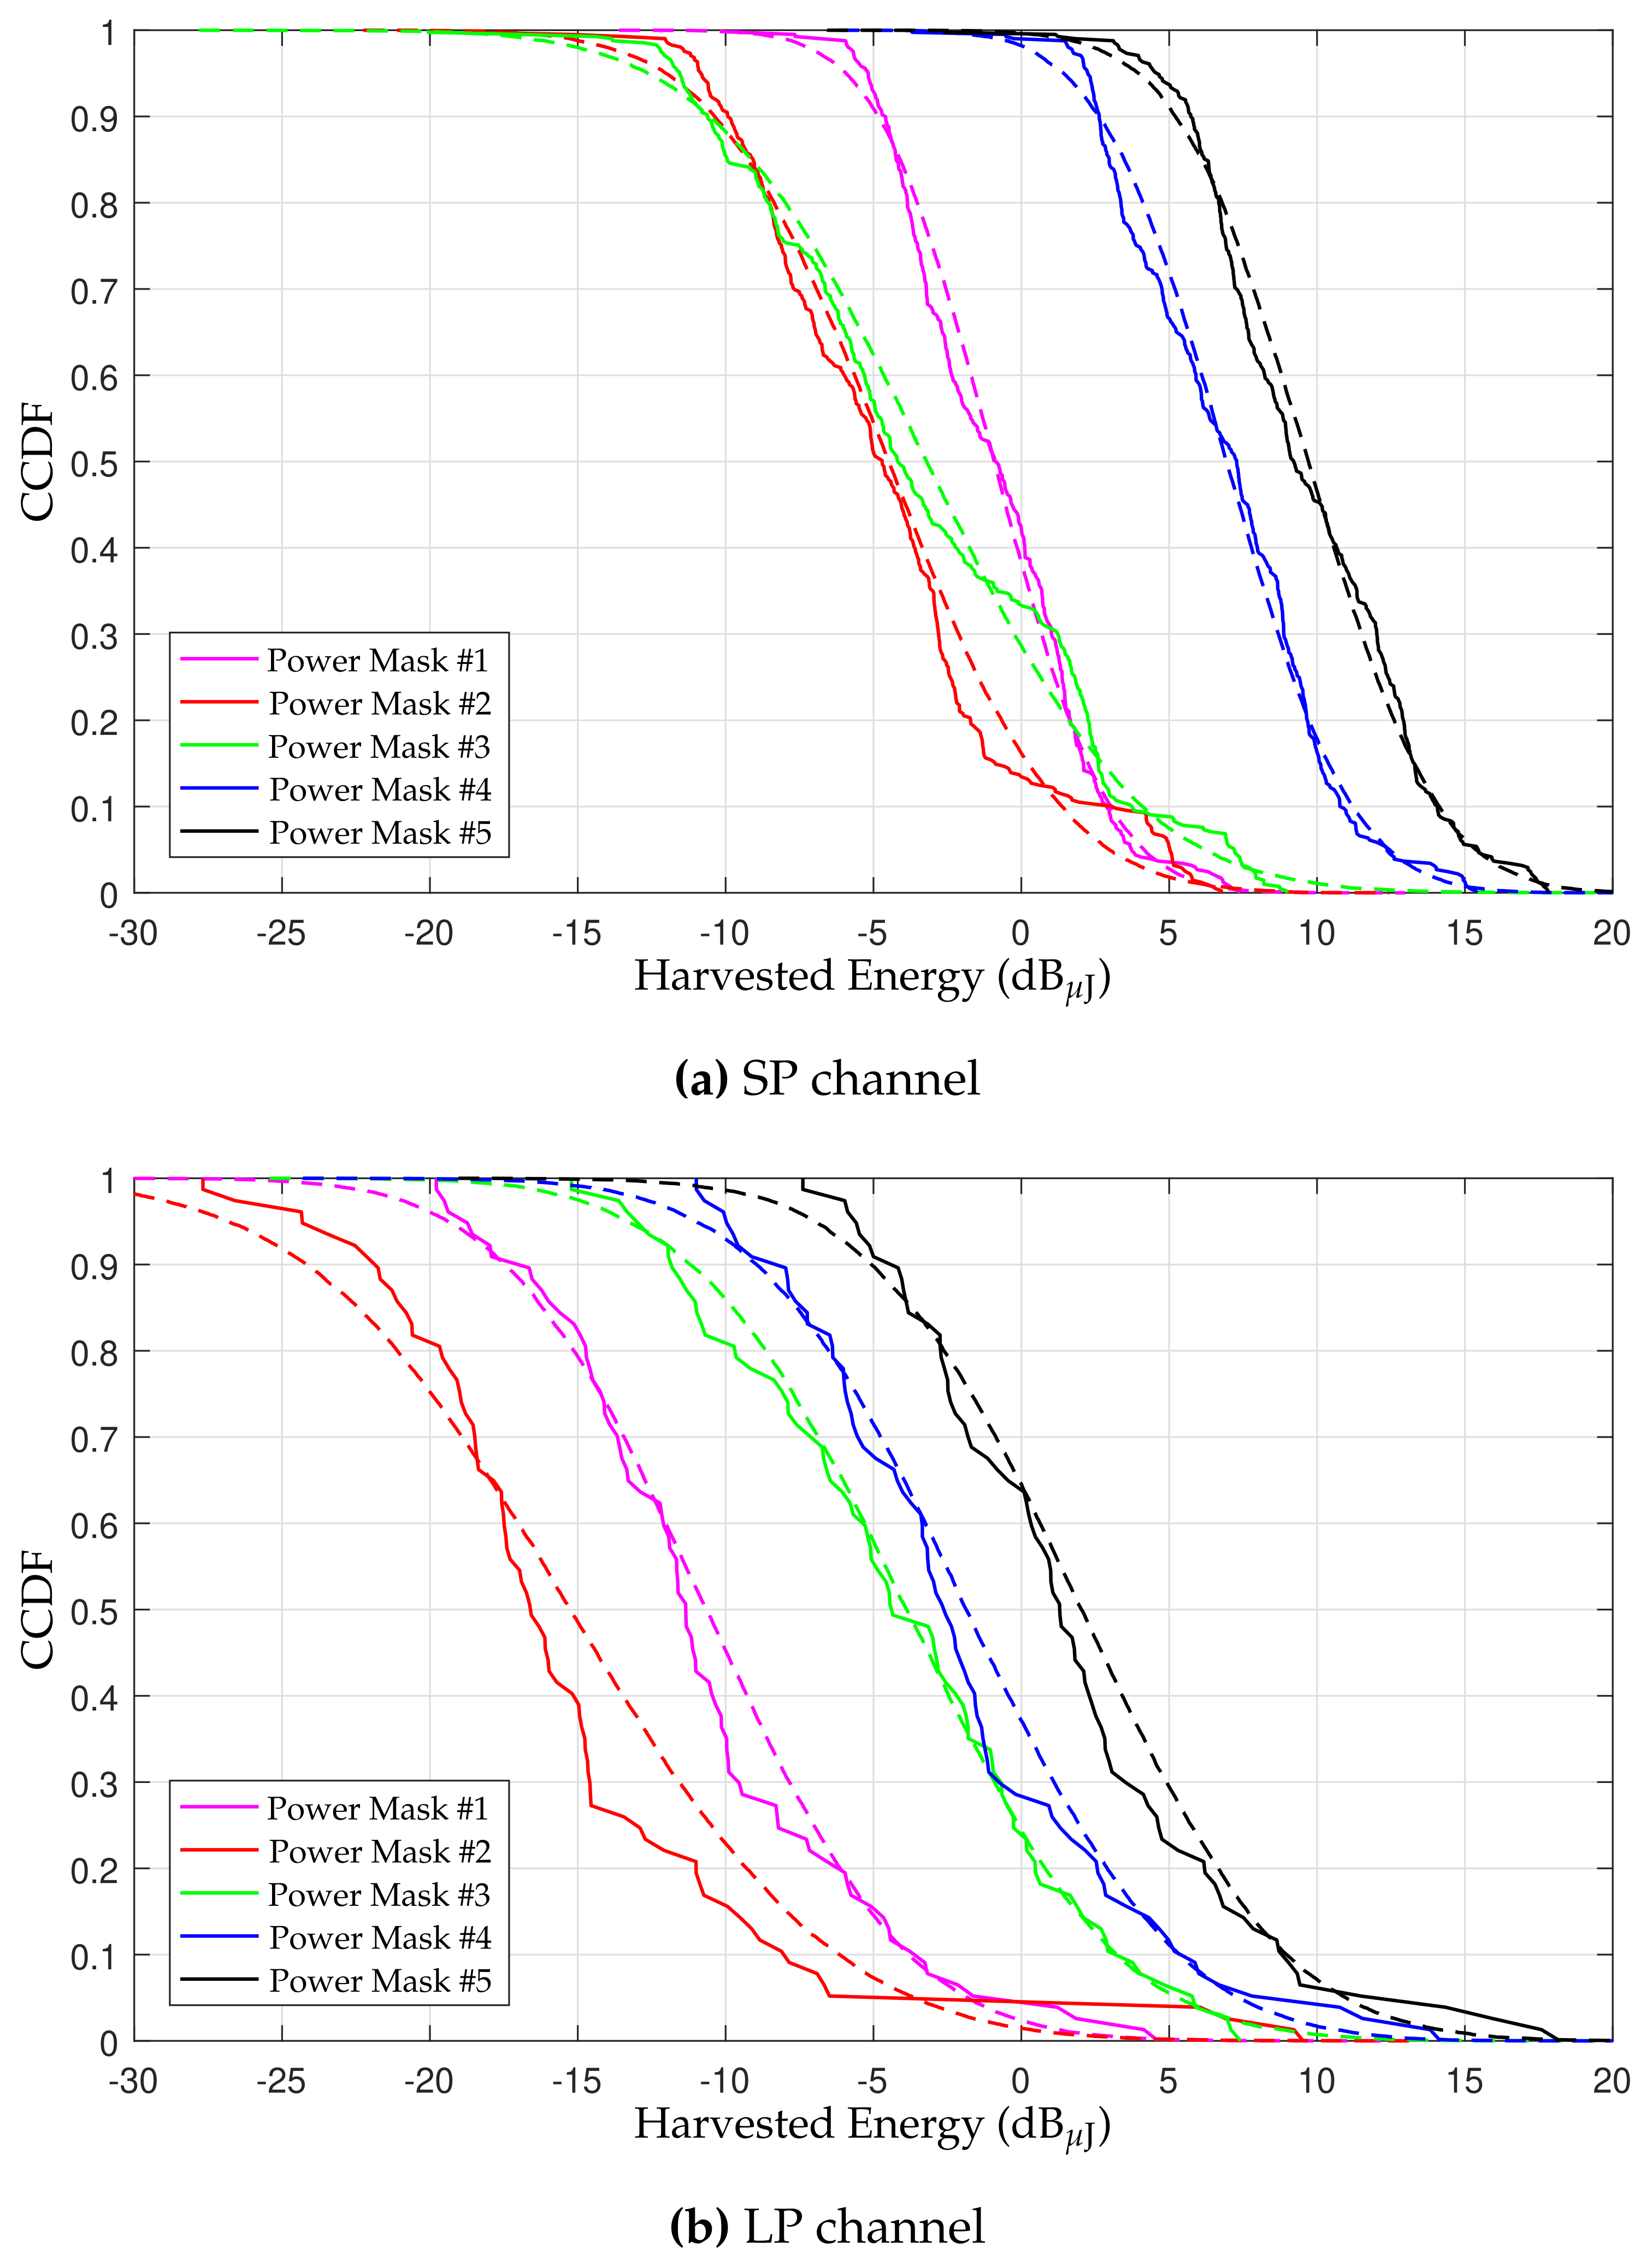
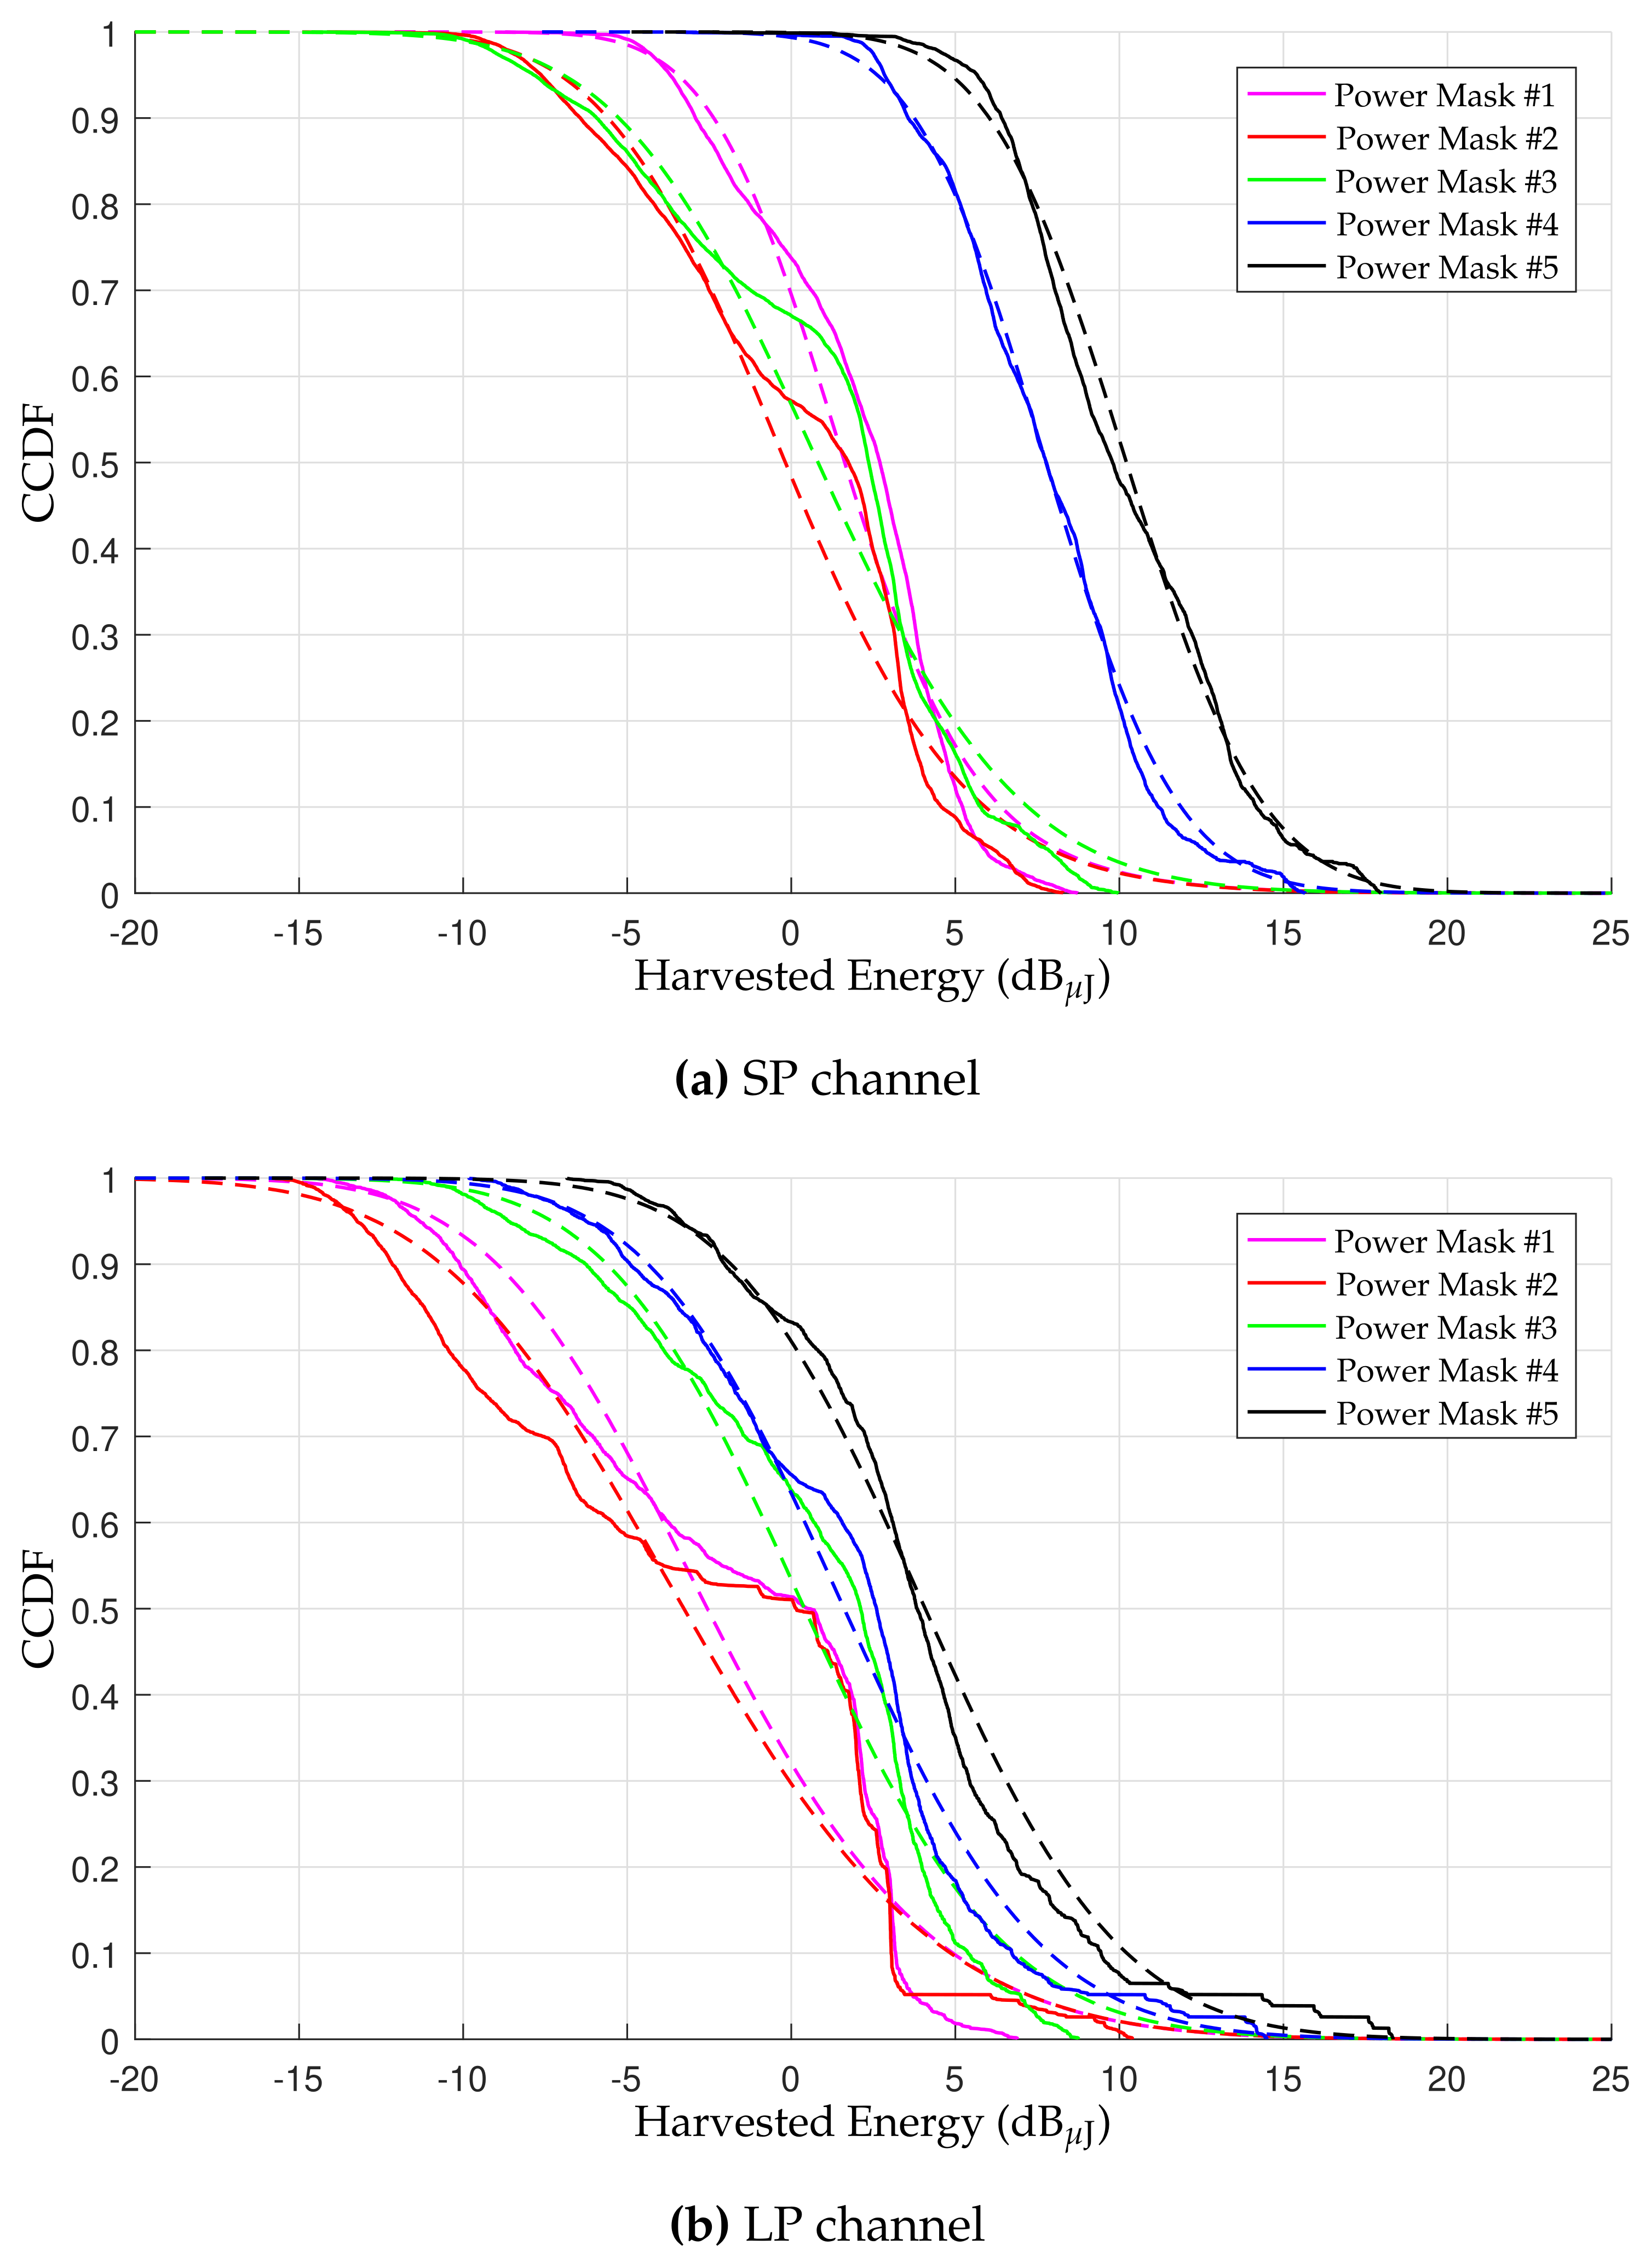
Aiming to validate the statistical modelings, this subsection deals with the comparison between the CCDFs of harvested energies generated by statistical models and the CCDFs of harvested energies obtained from the measured data set. In this regard, Figure 2a shows comparisons among CCDFs of harvested energies from the FoN received signal of a hybrid SP PLC-WLC channel (represented by continuous lines), which was calculated with the measured CFRs and CCDFs of the log-normally distributed random variable obtained from the statistical modeling of the FoN received signal (dashed lines). These plots assume the use of the five power masks, P x q = 20 dBm, and η q = 1 , to illustrate an ideal case of the overall efficiency factor of the EH circuitry. Here, the harvested energies from the FoN received signal is modeled as a log-normally distributed random variable E Y ~ q exp N ( μ Y ~ q , σ Y ~ q 2 ) , in which μ Y ~ q = μ 0 + ln ( 100 ) , whereas μ 0 and σ Y ~ q depend on the chosen power mask and the channel distance range and are both obtained from the first column in Table 5. Under the same assumptions and for the hybrid LP PLC-WLC channel, Figure 2b shows similar comparisons, where μ 0 and σ Y ~ q are both obtained from the second column of Table 5. By comparing these two figures, it is possible to see that CCDFs of statistical models are closer to CCDFs from the measured data set in hybrid SP PLC-WLC channels rather than in hybrid LP PLC-WLC channels due to the high variations of the magnitude of CFRs experienced by the latter. For instance, the highest discrepancy is noted in Figure 2b for Power Mask #2, in which 14.5 dB μ J of harvested energy results in a difference of ( 0.46 0.27 ) × 100 = 19 % between the CCDFs of the statistical model and the measured data set.
Similarly, Figure 3 shows a comparison between the CCDF of the harvested energies from WLC and PLC additive noises (continuous lines) and the CCDF of log-normally distributed random variables obtained from the statistical modeling of harvested energies from WLC and PLC additive noises (dashed lines) with η q = 1 . These random variables are modeled as E V q exp N ( μ V q , σ V q 2 ) , in which μ V q = μ 0 and σ V q are provided in the first and second lines of Table 6 for the WLC and PLC additive noises, respectively. In this figure, a discrepancy is observed between CCDFs of harvested energies of statistical models and measured data set, which is in the worst case ( 0.47 0.26 ) × 100 = 21 % (at 0 dB μ J) and ( 0.46 0.26 ) × 100 = 20 % (at 13.5 dB μ J) for the WLC and PLC additive noises, respectively. It is important to emphasize that the impulsive components of the PLC additive noise may be responsible for increasing the inaccuracy between harvested energies from the statistical model and the measured data set due to its high amplitude values in relation to the background component, which makes the statistical modeling of it by a single random variable that is not extremely precise; however, the presented modeling is easily to mathematically handle, and it has a limited inaccuracy between the harvested energy obtained from the statistical model and the measured data set.
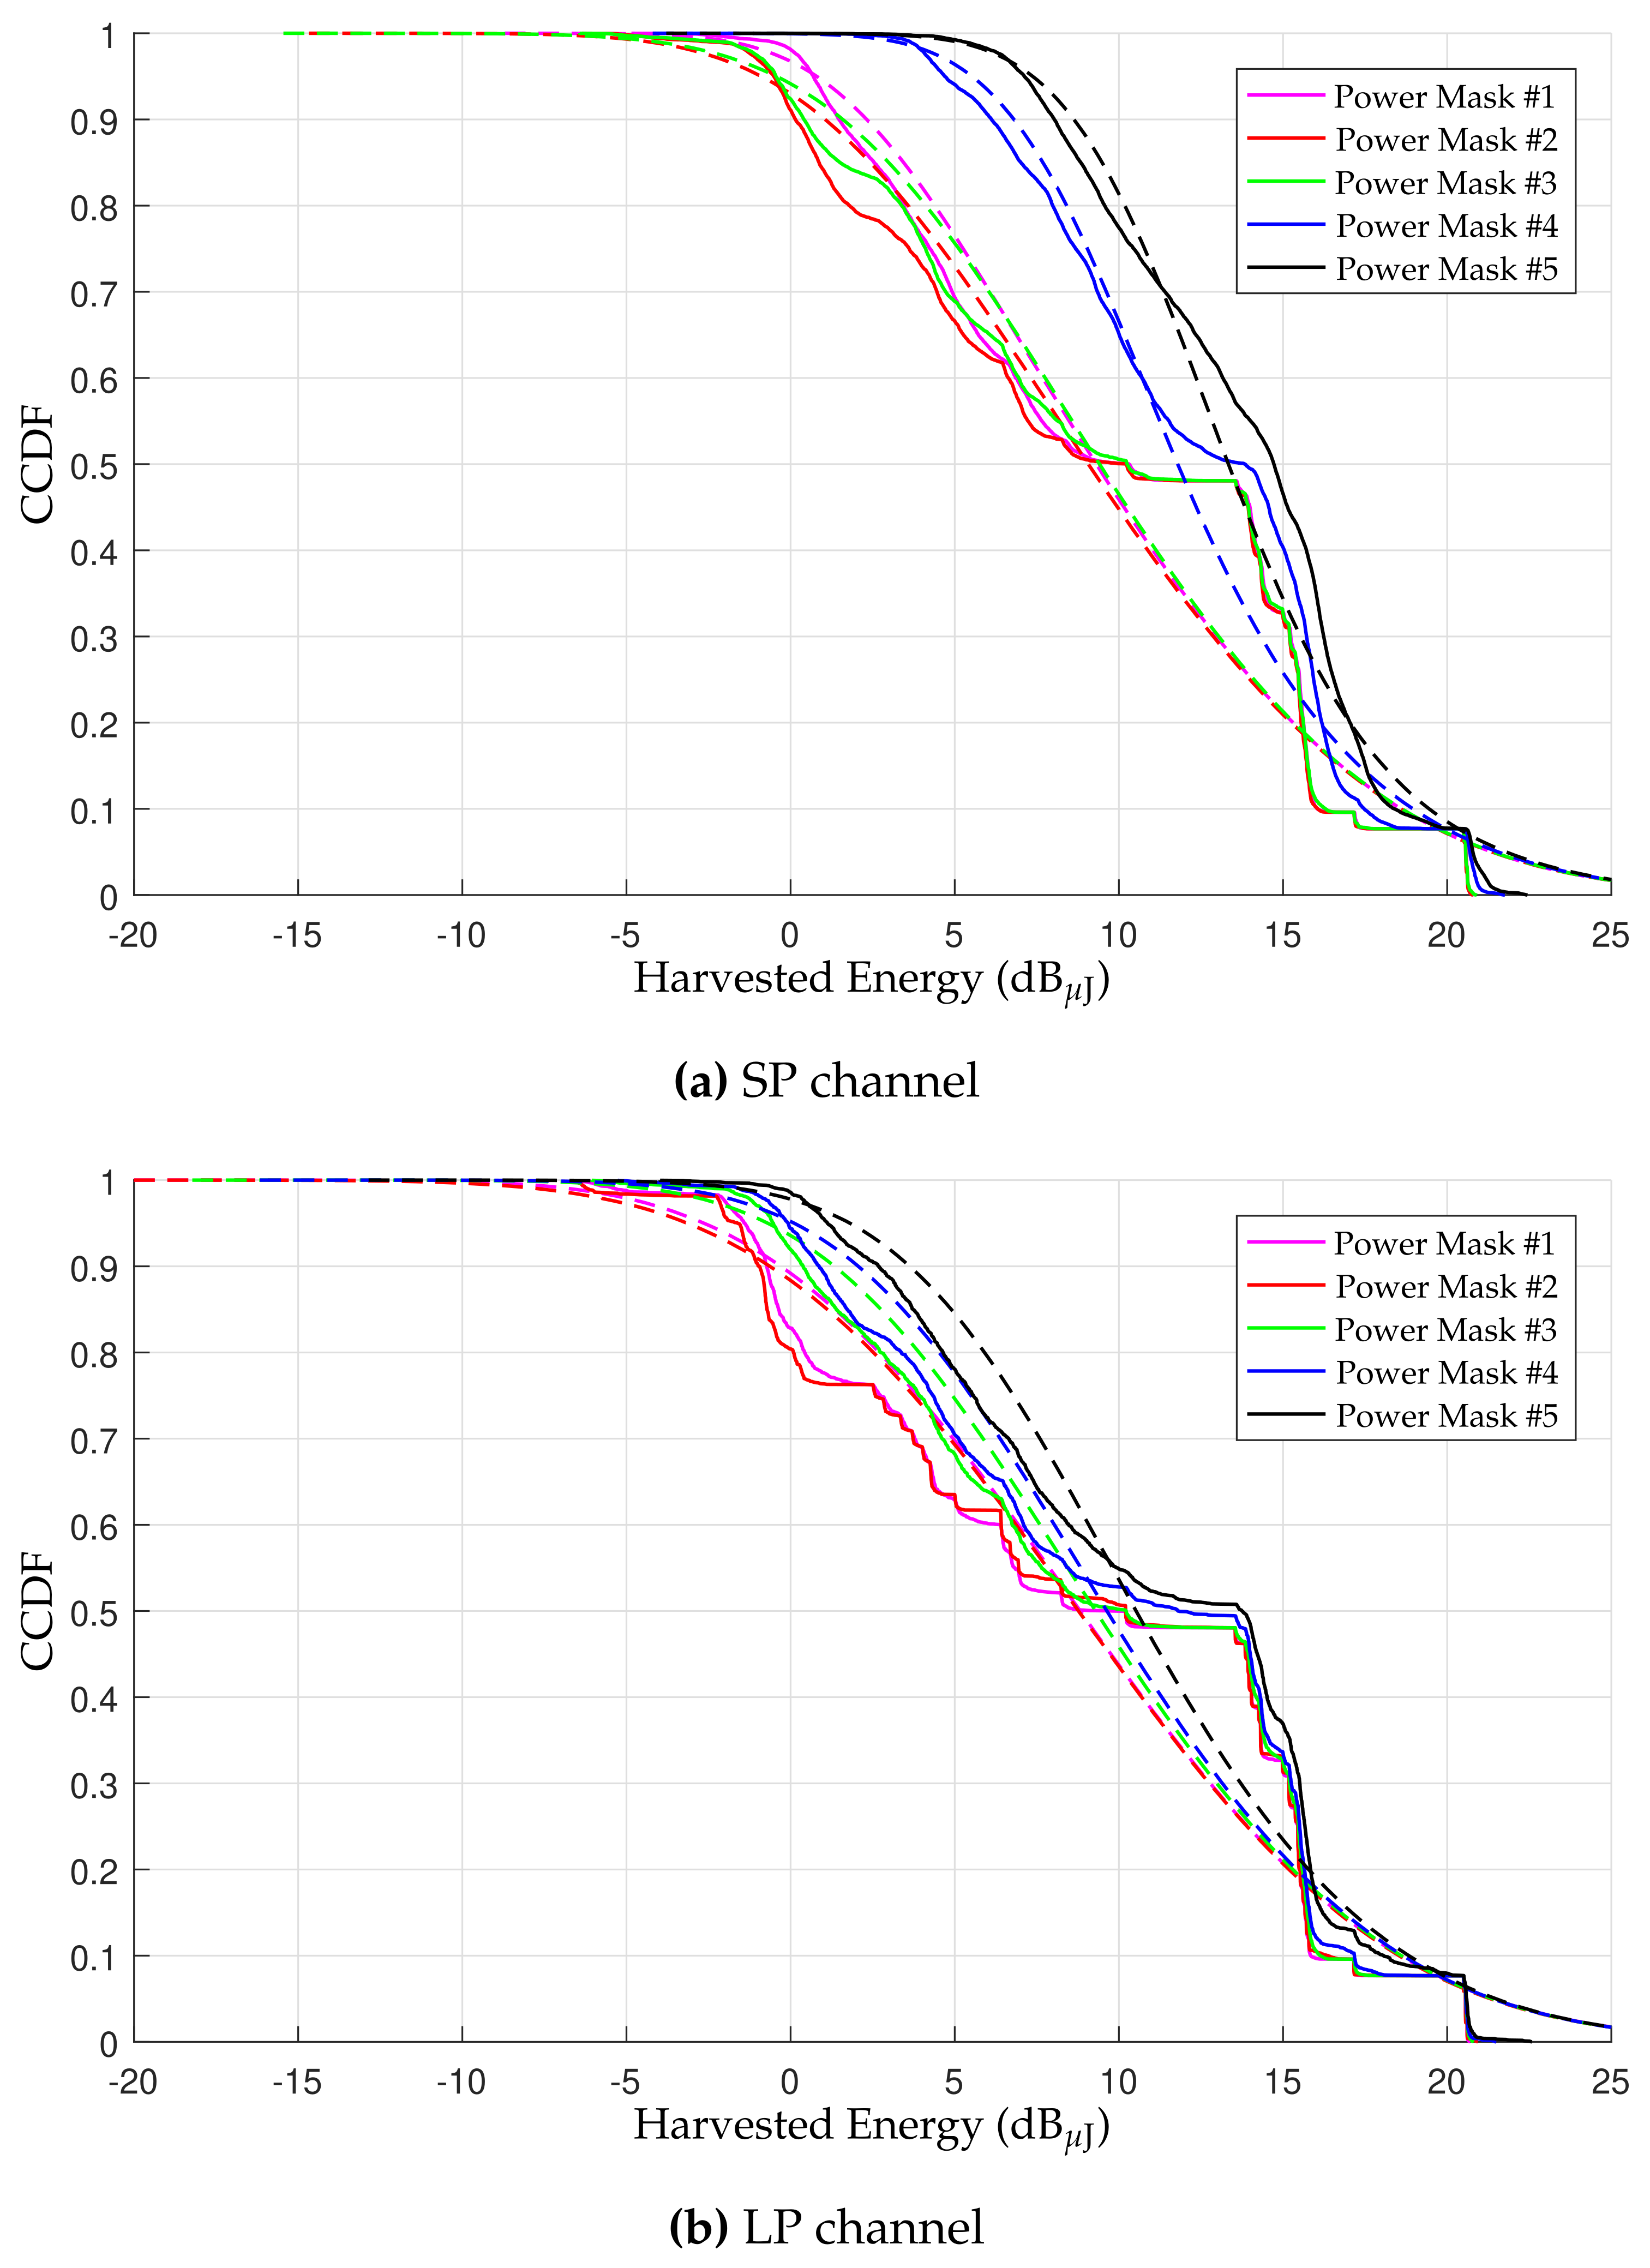
Figure 4a shows comparisons among CCDFs of the total harvested energies, which were calculated from the measured data set by a WLC device through a hybrid SP PLC-WLC channel (continuous lines) and CCDFs of random variables generated with the statistical modeling of these harvested energies (dashed lines). The random variables are the sum of two log-normally distributed random variables: one for the FoN received signal and one to the WLC additive noise. These plots are obtained with the five power masks, P x PLC WLC = 20 dBm, and η PLC WLC = 1 because the chosen values represent a situation in which the PLC device operates with a typical value of transmission power, and the WLC device’s EH circuitry has an ideal overall efficiency factor. Under the same assumptions, Figure 4b shows similar comparisons but assuming hybrid LP PLC-WLC channels. In both cases, the total harvested energy is modeled as a random variable E Y PLC WLC = E Y ~ PLC WLC + E V PLC WLC , where
E Y ~ PLC WLC exp N ( μ Y ~ PLC WLC , σ Y ~ PLC WLC 2 )
and
E V PLC WLC exp N ( μ V PLC WLC , σ V PLC WLC 2 ) ,
in which μ Y ~ PLC WLC = μ 0 + ln ( 100 ) , whereas μ 0 and σ Y ~ PLC WLC depend on the chosen power mask and the channel distance range, and both are obtained from the first and second columns of Table 5 for hybrid SP PLC-WLC and hybrid LP PLC-WLC channels, respectively, while μ V PLC WLC = 14.8483 and σ V PLC WLC = 1.6263 are taken from the first line of Table 6.
From Figure 4a, it is noticed that CCDFs of total harvested energies obtained from the measured data set and the statistical model are, in general, close to each other, except in some specific range of values in which a slight disagreement can occur. Additionally, Figure 4b shows that total harvested energies of the statistical model and the measured data set present higher discrepancies in their CCDFs for Power Masks #1 and #2. For instance, Power Mask #2 has a good agreement at the harvested energies less than 4 dB μ J, and a disagreement is noticed from 4 dB μ J to 3 dB μ J, in which the highest difference between the CCDFs is ( 0.51 0.30 ) × 100 = 21 % and occurs when the total harvested energy is equal to 0 dB μ J. As Power Masks #1 and #2 are the ones with the lowest EH performances among the considered power masks, it indicates that the lower is the contribution of the FoN received signal on the total harvested energy, the higher is the inaccuracy between total harvested energies of the statistical model and the measured data set.
Figure 5a shows comparisons among CCDFs of total harvested energies, obtained from measured data set, from a PLC device through the hybrid SP PLC-WLC channels (continuous lines) and the ones obtained from the statistical modeling (dashed lines). In these plots, the five distinct power masks, P x WLC PLC = 20 dBm, and η WLC PLC = 1 are applied because the given parameters illustrate a situation in which the WLC device operates with a typical transmission power, and the EH circuitry of the PLC device has an ideal overall efficiency factor. Regarding hybrid LP PLC-WLC channels, Figure 5b shows similar comparisons. Here, the total harvested energy is modeled as a random variable equal to E Y WLC PLC = E Y ~ WLC PLC + E V WLC PLC , where
E Y ~ WLC PLC exp N ( μ Y ~ WLC PLC , σ Y ~ WLC PLC 2 )
and
E V WLC PLC exp N ( μ V WLC PLC , σ V WLC PLC 2 ) ,
in which μ Y ~ WLC PLC = μ 0 + ln ( 100 ) , whereas μ 0 and σ Y ~ WLC PLC are both obtained from the first and second columns of Table 5 for hybrid SP PLC-WLC and hybrid LP PLC-WLC channels, respectively, while μ V WLC PLC = 11.8117 and σ V WLC PLC = 1.7687 are taken from the second line of Table 6.
By means of Figure 5a, it is clear that the lower is the contribution of the FoN received signal to the total harvested energy, the higher is the discrepancy between the CCDFs of total harvested energies of the statistical model and the measured data set. This can be observed in Power Masks #1 to #4 and almost not seen in Power Mask #5 because Power Mask #5 yields the highest contributions of the FoN received signal to the total harvested energy. In the worst case, the difference between the total harvested energy from the measured data set and the statistical model occurs in Figure 5b, and it is ( 0.48 0.27 ) × 100 = 21 % , at the point in which the total harvested energy is equal to 13.5 dB μ J for Power Mask #2.
Given this discussion, the characteristic that mostly affects the statistical modeling accuracy is related to the decreasing of the harvested energy from the FoN received signal in relation to the additive noise, which can be caused by: (i) reducing P x q , (ii) the use of a power mask that takes worse advantage of P x q , and (iii) the use of higher distance ranges in hybrid PLC-WLC channels (i.e., LP channels instead of SP ones). Although the CCDFs of the statistical model have discrepancies with the ones from the measured data set when the highlighted characteristic occurs, the difference between them is expected since no statistical model has an excellent match to capture the complete behavior of the measured data set. Additionally, the difference between the CCDFs of the statistical models and the measured data set is not relevant, and it is limited, in the worst case, by 21 % assuming typical values of P x q , yielding a good agreement between them. Furthermore, if P x q 0 W (i.e., ambient EH approach), then the highest discrepancy is one of the additive noises, 21 % for the WLC and 20 % for the PLC, because there is no FoN received signal. On the other hand, if P x q , then the highest discrepancy is the one observed in the FoN received signal, which is 19 % for Power Mask #2 and hybrid LP PLC-WLC channels, because the additive noises yield irrelevant amounts of harvested energy in comparison to the FoN received signal under this condition.
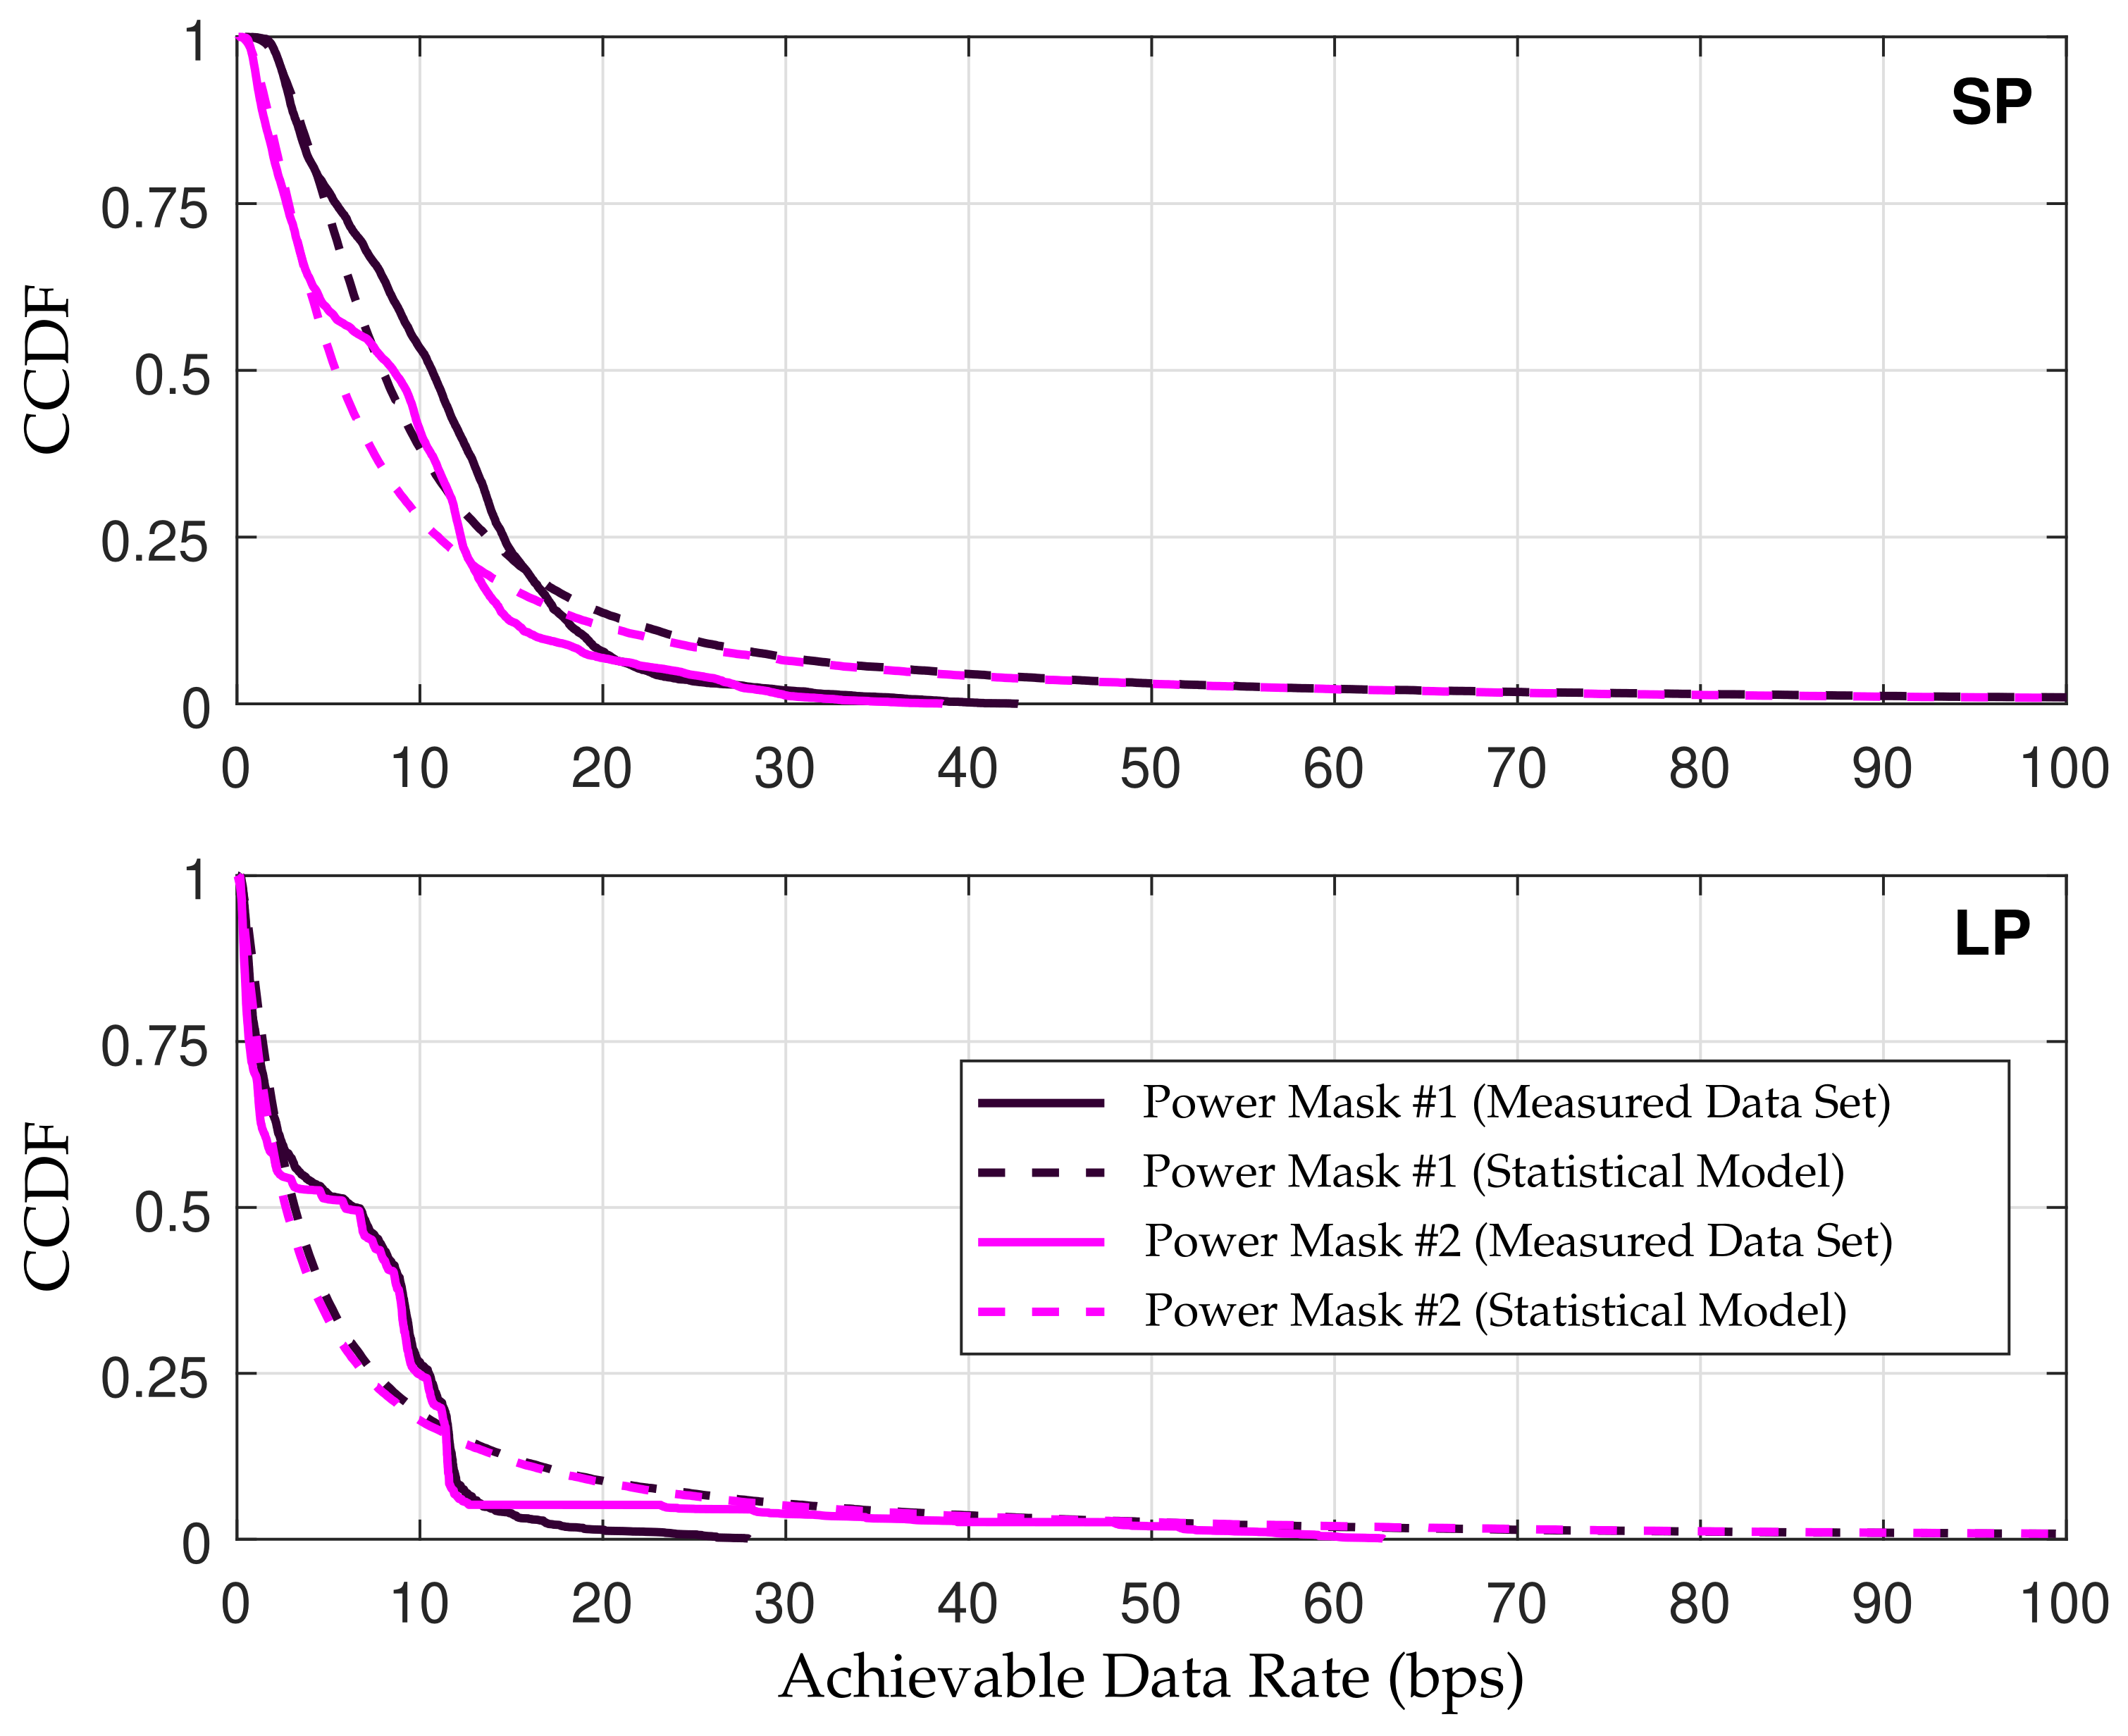
Aiming to validate the statistical model, Figure 6 shows a numerical comparison between the CCDF of achievable data rates obtained in Scenario #1 for Power Masks #1 and #2, with P x q = 20 dBm and η q = 0.5 , when measured data set (continuous line) and the proposed statistical model (dashed line) are used to generate the total harvested energy values. These values are applied in Equation (8) of [24] in order to obtain the achievable data rates. Additionally, the chosen scenario represents an interesting possibility of IoT application due to its high relation to low-power radio-frequency WLC device, which is commonly used in wireless sensors network for making each electronic device communicating to another. According to Subsection F of [24], Scenario #1 is described as follows: a WLC (EH) device harvests its energy from the hybrid PLC-WLC channel and, thus, realizes a data communication with another low-power radio-frequency WLC device at one of the unlicensed industrial, scientific, and medical frequency bands, which is centered at 5.8 GHz, with a frequency bandwidth of 500 kHz. It is assumed that the WLC device is consecutively communicating and harvesting energy, such that it uses half of the time for EH and the other half for data communication.
In Figure 6, it can be seen that the same inaccuracy observed between CCDFs of total harvested energies of the statistical model and the measured data set in Figure 4 and Figure 5 are also noticed between CCDFs of achievable data rates when the total harvested energies, used for data communication, are obtained from the statistical model and the measured data set. In other words, the total harvested energy from the statistical model is in good agreement with the one obtained from the measured data set, and it is also seen in the CCDF of achievable data rates. Therefore, the statistical models have made the harvested energies a generic and an easy-to-simulate feature for any value of η q , P x q , for five distinct power masks, and for two different regions that are associated with distinct distances of the WLC device from the power line (i.e., SP and LP channels), which can be used to perform data communications.

6. Conclusions

In this study, we discussed the modeling of the energy harvested from the hybrid PLC-WLC channel in in-home facilities by adopting the frequency band between 0 and 100 MHz and the dedicated energy-harvesting approach. In this regard, we detailed the statistical distribution and their parameters for the energies harvested from the FoN received signal and additive noises. Based on the maximum likelihood value criterion, we concluded that the best statistical distribution is the log-normal one for each one of them. Subsequently, we proposed a model to the total harvested energy (i.e., the energies of both the FoN received signal and the additive noise) from the output of these hybrid channels as the summation of these two log-normal random variables. In the way it was designed, this work introduced tools to facilitate further investigations driven by the necessity of increasing the energy efficiency of electric power grids, especially due to the energy reuse in the telecommunications sector.
Furthermore, a comparison between the CCDFs of harvested energies obtained from the measured data set and from statistical models showed good agreement in terms of the achievable data rate of a data communication scenario. Additionally, we demonstrated that a maximum difference of 21% can be observed between the values yielded by the measured data set and the statistical models. In fact, the main disadvantage of statistical modeling is the lower precision in the outliers, while the statistical modeling advantage is related to its reproducibility for any other application. Based on these findings, we can conclude that the modeling of the energies harvested from the hybrid PLC-WLC channel have been turned into an easy-to-simulate feature for carrying out studies related to energy-efficient and self-sustainable networks for IoT, SGs, smart cities, and Industry 4.0 .

Author Contributions

Data curation, V.F.; formal analysis, V.F.; investigation, V.F.; methodology, M.V.R.; supervision, M.V.R.; validation, M.V.R.; visualization, H.V.P.; writing—original draft, V.F.; writing—review and editing, T.F.A.N., H.V.P., and M.V.R. All authors have read and agreed to the published version of the manuscript.

Funding

This research was funded in part by the Coordenação de Aperfeiçoamento de Pessoal de Nível Superior—Brasil (CAPES)—Finance Code 001, CNPq, FAPEMIG, and INERGE. The support of the U.S. National Science Foundation under Grant CCF-1908308 is also gratefully acknowledged.

Institutional Review Board Statement

Not applicable.

Informed Consent Statement

Not applicable.

Data Availability Statement

Not applicable.

Conflicts of Interest

The authors declare no conflict of interest. The funders had no role in the design of the study; in the collection, analyses, or interpretation of data; in the writing of the manuscript; or in the decision to publish the results.

Abbreviations

The following abbreviations are used in this manuscript:
qData communication link
X q ( t ) Transmitted signal
Y q ( t ) Total received signal
Y ~ q ( t ) FoN received signal
V q ( t ) Additive noise at the receiver’s input
h q ( t , τ ) CIR of the hybrid PLC-WLC channel
ϱ i q ( f ) Power mask in the ith channel realization within the coherence time
H i q ( f ) CFR of the ith hybrid PLC-WLC channel within the coherence time
P Y , c q Total received signal’s expected power per cycle
P Y ~ , c q FoN received signal’s power per cycle
P V , c q Additive noise’s average power per cycle
E Y q Random variable: Total received signal’s harvested energy per cycle
E Y ~ q Random variable: FoN received signal’s harvested energy per cycle
E V q Random variable: Additive noise’s harvested energy per cycle
η q Overall efficiency factor for harvesting and storing the energy

References

  1. Chochliouros, I.P. Energy efficiency concerns and trends in future 5G network infrastructures. Energies 2021, 14, 5392. [Google Scholar] [CrossRef]
  2. Fernandes, V.; Finamore, W.A.; Poor, H.V.; Ribeiro, M.V. The low-bit-rate hybrid power line/wireless single-relay channel model. IEEE Syst. J. 2019, 13, 98–109. [Google Scholar] [CrossRef]
  3. Camponogara, Â.; Poor, H.V.; Ribeiro, M.V. The complete and incomplete low-bit-rate hybrid PLC/wireless channel models: Physical layer security analyses. IEEE Internet Things J. 2019, 6, 2760–2769. [Google Scholar] [CrossRef]
  4. Fernandes, V.; Poor, H.V.; Ribeiro, M.V. Analyses of the incomplete low-bit-rate hybrid PLC-wireless single-relay channel. IEEE Internet Things J. 2018, 5, 917–929. [Google Scholar] [CrossRef]
  5. de Filomeno, L.M.; de Campos, M.L.R.; Poor, H.V.; Ribeiro, M.V. Hybrid power line/wireless systems: An optimal power allocation perspective. IEEE Trans. Wirel. Commun. 2020, 19, 6289–6300. [Google Scholar] [CrossRef]
  6. Fernandes, V.; Poor, H.V.; Ribeiro, M.V. A hybrid power line/wireless dual-hop system with energy harvesting relay. IEEE Internet Things J. 2018, 5, 4201–4211. [Google Scholar] [CrossRef]
  7. Lai, S.W.; Messier, G.G. Using the wireless and PLC channels for diversity. IEEE Trans. Commun. 2012, 60, 3865–3875. [Google Scholar] [CrossRef]
  8. Kuhn, M.; Berger, S.; Hammerström, I.; Wittneben, A. Power line enhanced cooperative wireless communications. IEEE J. Sel. Areas Commun. 2006, 24, 1401–1410. [Google Scholar] [CrossRef]
  9. Lee, J.; Kim, Y. Diversity relaying for parallel use of power-line and wireless communication networks. IEEE Trans. Power Del. 2014, 29, 1301–1310. [Google Scholar] [CrossRef]
  10. de Dib, L.M.B.A.; Fernandes, V.; de Filomeno, L.M.; Ribeiro, M.V. Hybrid PLC/wireless communication for smart grids and Internet of Things applications. IEEE Internet Things J. 2018, 5, 655–667. [Google Scholar] [CrossRef]
  11. Kashef, M. Energy efficient resource allocation for mixed RF/VLC heterogeneous wireless networks. IEEE J. Sel. Areas Commun. 2016, 34, 883–893. [Google Scholar] [CrossRef]
  12. Song, J. An indoor broadband broadcasting system based on PLC and VLC. IEEE Trans. Broadcast. 2015, 61, 299–308. [Google Scholar] [CrossRef]
  13. Feng, S.; Bai, T.; Hanzo, L. Joint power allocation for the multi-user NOMA downlink in a power-line-fed VLC network. IEEE Trans. Veh. Technol. 2019, 68, 5185–5190. [Google Scholar] [CrossRef]
  14. Ma, H.; Lampe, L.; Hranilovic, S. Hybrid visible light and power line communication for indoor multiuser downlink. IEEE J. Opt. Commun. Netw. 2017, 9, 635–647. [Google Scholar] [CrossRef]
  15. Gebhardt, M.; Weinmann, F.; Dostert, K. Physical and regulatory constraints for communication over the power supply grid. IEEE Commun. Mag. 2003, 41, 84–90. [Google Scholar] [CrossRef]
  16. IEC 610003-8. Electromagnetic Compatibility (EMC)-Part 3: Limits-Section 8: Signaling on Low-Voltage Electrical Installations-Emission Levels, Frequency Bands and Electromagnetic Disturbances Levels; International Electrotechnical Commission: Geneva, Switzeland, 2002. [Google Scholar]
  17. FCC. Code of Federal Regulations-Title 47: Telecommunication- Chapter I: FCC Part 15-Radio Frequency Devices; Federal Communications Commission: Washington, DC, USA, 2002. [Google Scholar]
  18. Oliveira, T.R. Characterization of hybrid communication channel in indoor scenario. J. Commun. Inf. Syst. 2016, 31, 224–235. [Google Scholar] [CrossRef] [Green Version]
  19. Oliveira, T.R. On the statistical characterization of hybrid PLC-wireless channels. Electr. Power Syst. Res. 2018, 163, 329–337. [Google Scholar] [CrossRef]
  20. Hossain, M.F.T. Harvesting solar energy from asphalt pavement. Sustainability 2021, 13, 12807. [Google Scholar] [CrossRef]
  21. Correia, D.; Ferreira, A. Energy harvesting on airport pavements: State-of-the-art. Sustainability 2021, 13, 5893. [Google Scholar] [CrossRef]
  22. Srbinovski, B. An energy aware adaptive sampling algorithm for energy harvesting WSN with energy hungry sensors. Sensors 2016, 16, 448. [Google Scholar] [CrossRef] [Green Version]
  23. Montisci, A.; Caredda, M. A static hybrid renewable energy system for off-grid supply. Sustainability 2021, 13, 9744. [Google Scholar] [CrossRef]
  24. Fernandes, V.; Poor, H.V.; Ribeiro, M.V. Dedicated Energy Harvesting in Concatenated Hybrid PLC-Wireless Systems. IEEE Trans. Wirel. Commun. 2020, 19, 3839–3853. [Google Scholar] [CrossRef]
  25. Mishra, D. Smart RF energy harvesting communications: Challenges and opportunities. IEEE Commun. Mag. 2015, 53, 70–78. [Google Scholar] [CrossRef] [Green Version]
  26. Lu, X.; Wang, P.; Niyato, D.; Kim, D.I.; Han, Z. Wireless networks with RF energy harvesting: A contemporary survey. IEEE Commun. Surv. Tuts. 2015, 17, 757–789. [Google Scholar] [CrossRef] [Green Version]
  27. da Silva Costa, L.G.; de Queiroz, A.C.M.; Adebisi, B.; da Costa, V.L.R.; Ribeiro, M.V. Coupling for power line communications: A survey. J. Commun. Inf. Syst. 2017, 32, 8–22. [Google Scholar]
  28. Shlezinger, N.; Dabora, R. On the capacity of narrowband PLC channels. IEEE Trans. Commun. 2015, 63, 1191–1201. [Google Scholar] [CrossRef] [Green Version]
  29. Nasir, A.A.; Zhou, X.; Durrani, S.; Kennedy, R.A. Relaying protocols for wireless energy harvesting and information processing. IEEE Trans. Wirel. Commun. 2013, 12, 3622–3636. [Google Scholar] [CrossRef] [Green Version]
  30. Oliveira, T.R. Measured Places. Available online: https://sites.google.com/a/ifsudestemg.edu.br/thiagooliveira/plc (accessed on 3 June 2020).
  31. Oliveira, T.R.; Finamore, W.A.; Ribeiro, M.V. A sounding method based on OFDM modulation for PLC channel measurement. In Proceedings of the IEEE 17th International Symposium on Power Line Communications and Its Applications, Johannesburg, South Africa, 24–27 March 2013; pp. 185–190. [Google Scholar]
  32. Colen, G.R.; Marques, C.A.; Oliveira, T.R.; de Campos, F.P.; Ribeiro, M.V. Measurement setup for characterizing low-voltage and outdoor electric distribution grids for PLC systems. In Proceedings of the IEEE PES Conference on Innovative Smart Grid Technologies (ISGT Latin America), São Paulo, Brazil, 15–17 April 2013; pp. 1–5. [Google Scholar]
  33. Cabral, C.R.B.; Lachos, V.H.; Zeller, C.B. Multivariate measurement error models using finite mixtures of skew-Student t distributions. J. Multivar. Anal. 2014, 124, 179–198. [Google Scholar] [CrossRef]
  34. Camponogara, Â. Measurement and Characterization of Aircraft PLC Channels. Master’s Thesis, Federal University of Juiz de Fora, Juiz de Fora, Brazil, 2016. [Google Scholar]
  35. Walck, C. Hand-Book on Statistical Distributions for Experimentalists. University of Stockholm. 2007. Available online: http://www.stat.rice.edu/∼dobelman/textfiles/DistributionsHandbook.pdf (accessed on 12 July 2021).
Figure 1. A typical hybrid PLC-WLC environment.
Sustainability 14 00442 g001
Figure 2. CCDF of harvested energies from the FoN received signal: The five power masks, P x q = 20 dBm, and η q = 1 .
Sustainability 14 00442 g002
Figure 3. CCDF of harvested energies from the additive noise with η q = 1 .
Sustainability 14 00442 g003
Figure 4. CCDF of total harvested energies by the WLC device: The five power masks, P x PLC WLC = 20 dBm, and η PLC WLC = 1 .
Sustainability 14 00442 g004
Figure 5. CCDF of total harvested energies by the PLC device: The five power masks, P x WLC PLC = 20 dBm, and η WLC PLC = 1 .
Sustainability 14 00442 g005
Figure 6. CCDF of achievable data rates for hybrid PLC-WLC channel: SP (top) and LP (bottom) channel for Scenario #1, Power Masks #1 and #2, P x q = 20 dBm and η q = 0.5 .
Sustainability 14 00442 g006
Table 1. Sources of the instruments and distributions of items in the questionnaires.
ParameterDescriptionValue
NNumber of subcarriers2048
L c p Cyclic prefix length512
T s Sampling period5 ns
T sym Symbol period 23.04   μ s
T c SP channel coherence time 156 μ s
LP channel coherence time 39.5 μ s
Δ f Frequency resolution 48.83  kHz
B w Channel’s bandwidth100 MHz
B u Power Mask #3 bandwidth7 MHz
B o Power Mask #4 bandwidth10 MHz
B s Subchannel bandwidth 48.83  kHz
T A C AC mains voltage signal cycle 16.667  ms
p i Probability of the ith occurrence 1 / N P
Table 2. LLVs of the FoN received signal’s harvested energy: SP channels, P x q = 20 dBm, and η q = 1 (in thousands).
Log-NormalBetaExponentialRayleigh
Power Mask #1 5.2969 5.2694 5.2191 5.1745
Power Mask #2 5.4786 5.4134 5.4127 4.9863
Power Mask #3 5.2638 5.2240 5.2086 4.7017
Power Mask #4 4.5257 4.5022 4.4663 4.3884
Power Mask #5 4.2499 4.2277 4.1976 4.1120
Table 3. LLVs of the FoN received signal’s harvested energy: LP channels, P x q = 20 dBm, and η q = 1 (in thousands).
Log-NormalBetaExponentialRayleigh
Power Mask #1 1.1273 1.1078 1.1019 0.9490
Power Mask #2 1.1857 1.1388 1.0614 0.7022
Power Mask #3 1.0050 0.9992 0.9974 0.9106
Power Mask #4 0.9678 0.9466 0.9373 0.7661
Power Mask #5 0.9021 0.8795 0.8703 0.6946
Table 4. LLVs of the additive noises’ harvested energy with η q = 1 (in thousands).
Log-NormalBetaExponentialRayleigh
WLC 0.7771 0.7810 0.7777 0.7300
PLC 0.5113 0.5112 0.5034 0.4287
Table 5. FoN received signal’s harvested energy: Fitted log-normal distribution’s parameters.
SP ( μ 0 , σ Y ~ q ) LP ( μ 0 , σ Y ~ q )
Power Mask #1(−18.5801, 0.7088)(−20.8168, 1.2314)
Power Mask #2(−19.3577, 1.0494)(−21.7950, 1.6284)
Power Mask #3(−19.1162, 1.3136)(−19.2780, 1.2938)
Power Mask #4(−16.7773, 0.7699)(−18.7911, 1.2889)
Power Mask #5(−16.1395, 0.7985)(−17.9191, 1.2645)
Table 6. Additive noises’ harvested energy: Fitted log-normal distribution’s parameters.
( μ 0 , σ V q )
WLC(−14.8483, 1.6263)
PLC(−11.8117, 1.7687)
Publisher’s Note: MDPI stays neutral with regard to jurisdictional claims in published maps and institutional affiliations.

