1. Introduction
Environmental sustainability problems frequently require the need for practical, “real world” decision-making to compute solutions to situations possessing numerous uncertain factors and unquantified dimensions [
1]. This study applies a novel analytical technique to quantitatively examine the carbon emission impacts resulting from a transformation of the aviation industry toward a state of greater airline electrification.
The link between carbon emissions from the aviation industry to climate change was firmly established in the 1992 report of the United Nations Framework Convention on Climate Change (UNFCC) [
2]. Today, it is estimated that aviation emissions annually contribute between 2–5% of all global emissions [
3,
4,
5] with some estimates forecasting that with the current growth trajectory, 25% of all emissions could be attributed to flying by 2050 [
5,
6]. In fact, while many industry sectors have actively been reducing their carbon footprints, the emissions from the aviation industry have increased by more than 75% from their 1990 levels [
5,
7]. The biggest culprits in aviation emissions are the long-distance, commercial flights, and this long-haul aviation segment is the hardest to decarbonize, by far [
4].
At the recent UNFCC Conference of the Parties meeting (COP26) in Glasgow—in which, ironically, the vast majority of the 26,000 delegates arrived via air—there were strong calls for immediate action to be taken to reduce airline emissions [
8]. Consequently, decreasing the overall carbon contributions from the aviation industry has become one of the primary initiatives within the current global climate policy formulation and represents a significant component of the overall strategy for achieving climate neutrality by 2050 [
2,
6,
9]. Clearly, technological progress can serve as the most significant, enabling factor for accelerating the pace of air traffic decarbonization. While biofuels have generally been viewed as the primary remedy for emissions from long-haul aviation [
10], electrification is now considered the more viable option for regional, short-haul flights [
8,
11].
In comparison to combustion engines, electric aircraft are less expensive to operate as there is no need to acquire expensive kerosene, and the maintenance of an electric powertrain is far less complicated and cheaper. According to some estimates, the cost per hour from operating an electric aircraft is less than one-third that of an otherwise similarlysized, fueled aircraft. Economically, lower costs translate into lower overall prices, thereby enabling higher traffic volumes. Some experts envision the possibility of completely disruptive innovation in regional traffic flows, where all-electric turboprops provide a substitute for train-, bus-, and car-travel [
12]. For example, one interesting development is Airbus’ concept of urban air mobility that employs its all-electric, vertical-takeoff, remotely piloted, four-seater CityAirbus. Some airlines that only engage in short distance flights have experimented with switching to an all-electric fleet (e.g., see [
13]).
Short-haul flights form a separate business community. So-called business aviation is comprised of charter flights, corporate aviation, and air taxis, though the explicit definition and composition differs depending on the source organization [
14]. Short-haul business aviation creates many benefits for businesses, the environment, and economies, in general. These benefits can be expected to intensify in conjunction with an increased electrification of aircraft fleets in combination with consequent price decreases. Improved business aviation can connect many currently isolated communities in rural and remote locations, contributing a significant boost to their economic growth and investments. On-demand scheduling substantially increases efficiencies for business by saving time spent engaging in large airport procedures and avoiding unnecessary waiting time at stopovers [
15].
In aviation electrification research, prior R&D investment studies have generally analyzed only selected scenarios that tend to be focused primarily on battery technology. For example, Brdnik et al. [
16] focused on the existing specific energy levels of batteries and their impacts on the resulting flying ranges of three different aircraft sizes. Schäfer et al. [
17] estimated the economic and environmental consequences of high-level, specific energy batteries. Unfortunately, due to the weight of the batteries, electrification is practicable only for the 20% of commercial flights under a distance of 1500 km [
5]. Hence, for commercial aviation implementation purposes, an appropriately realistic balance must be struck between electrification for short-haul flights and combustion engine aircraft for longer distances. Achieving this satisfactory balance between short- and long-haul flight strategies in aviation is analogous to computing a solution to the environmental equilibrium requirements specified in the range limited routing problem of electrical- versus combustion-engine transportation methods in urban logistics planning [
18,
19,
20,
21,
22,
23].
Consequently, this paper aims to portray a more holistically sustainable aviation electrification picture by concurrently integrating environmental impacts from the ongoing technological developments of electric motors for short-haul flights into the R&D investment analysis. This is achieved by employing a Monte Carlo study in combination with a novel computational ancillary analysis technique to model the flying range of an all-electric aircraft based upon improvements to its batteries together with its electric motor. Monte Carlo simulation has been applied to a wide spectrum of environmental planning problems to incorporate disparate uncertain inputs with their corresponding outputs frequently portrayed visually as probability distributions.
In order to progress beyond a selected scenario approach, the Monte Carlo study undertaken will be extended using the recently introduced, innovative approach called simulation decomposition (SimDec) [
24]. The SimDec method has been created to expand the analytical capacity of simulation by significantly broadening its cause-and-effect explanatory powers [
24,
25,
26,
27]. SimDec provides a very powerful, straightforward approach for visually analyzing the impacts of combinations of variables on output measures [
24,
26]. It is a generally usable method that is not context-dependent [
25]. In SimDec, selected uncertain input variable combinations are used to “decompose” output distributions into a number of state-influenced sub-distributions [
24]. These sub-distributions are superimposed onto an output distribution, thereby permitting an explicit visualization of the cause-and-effect impacts of the decomposed multi-variable groups of input combinations and/or their various interactions [
24]. The practical contributions from the decomposed visualization facilitates subsequent decision-maker insights with respect to the underlying simulation model. SimDec supplies both sensitivity and scenario contributions that are frequently employed by decision-makers in conjunction with “real world” quantitative analyses [
24,
25,
26,
27]. At the strategic level, SimDec enables a visual analytic display in continuous numerical space of the simultaneous interaction between multiple different factors that affect the flying range of electrical aircraft, thereby more fully portraying the financial and environmental benefits of aviation electrification to the decision-makers.
The remainder of the paper is structured in the following way:
Section 2 provides a general description of the SimDec method;
Section 3 summarizes the key aspects associated with aviation electrification;
Section 4 describes the computational and Monte Carlo model used for capturing the environmental impacts from electrification;
Section 5 provides the results from the Monte Carlo and discusses the environmental impacts discovered in the decomposition of the output; and
Section 6 concludes the outcome of the SimDec analysis for evaluating the environmental contributions of aircraft electrification to aviation decarbonization.
2. The Simulation-Decomposition Approach
SimDec is an analytical approach that was recently introduced to expand the explanatory capabilities of Monte Carlo by exploring inherent cause–effect links between combinations of input variable groupings and their resulting impacts on output variables [
24]. While this section reviews the key steps for the decomposition of a simulation, more extensive descriptions can be found in [
24,
25,
26,
27].
The SimDec procedure constructs sub-distributions of the entire simulation output distribution by partitioning certain input variables into pre-determined states, constructing various multi-variable combinations of these states, and then clustering the simulated outputs using these partition combinations [
25,
27]. This process enables the construction of both an “overall” output distribution and the simultaneous projection of the decomposed multi-variable input combinations onto this figure [
26]. In decomposing an overall output distribution, SimDec simultaneously highlights multi-variable combination impacts using only a single simulation run, which, thereby, circumvents the need to perform individual simulation runs to test each input combination separately. Therefore, SimDec explicitly can be considered an explicit variance reduction approach for evaluating simulated outputs [
25]. The visualization from SimDec is subsequently obtained by color-coding each portion of the overall distribution represented by each of the multi-variable partitions [
24,
26]. Because the projected effect of each subdivided partition can be clearly visualized on the output distribution, SimDec can visually expose previously unrecognized relationships between the multi-variable input partitions and their resulting fundamental consequences on the outputs [
26].
The specific algorithmic steps in SimDec are as follows [
25,
27]:
Step (1) From the complete set of input variables that are to be simulated in the Monte Carlo model, choose a subset of variables that are of interest for more explicit scrutiny.
Step (2) Create relevant states that correspond to different outcomes for each of the variables identified in Step 1 (e.g., good-bad, optimistic-expected-pessimistic, etc.).
Step (3) For each state of each of the variables, construct suitable numerical boundaries that correspond to that variable’s possible value ranges. These boundary ranges must be mutually exclusive and collectively exhaustive for the set of states of each variable.
Step (4) Construct a listing of every possible combination of the different variable state partitions. Each combination represents a multi-variable partition of the inputs in the future decomposition.
Step (5) Perform a Monte Carlo simulation. On each simulated iteration, map the randomly generated values of each selected input variable into its corresponding partition state, then map the specific combination of all individual states for the iteration onto the corresponding multi-variable partition combination. Allocate the result of each simulated iteration to the output distribution corresponding to the “complete” simulation, while simultaneously keeping track of the decomposed state combination that produced it.
Step (6) Construct output graphs and/or tables of the simulation outputs. These graphs/tables will portray both the overall summaries of the outputs together with the state decompositions superimposed on top of the global figures.
In summary, the SimDec procedure can be used to break down the regions of the simulation’s overall output distribution into a set of distinct partitions [
24]. The corresponding stratification enables an effective visualization and assessment of any inherent cause–effect relationships within the simulation results [
26]. The determination of which input combinations to use in any given decomposition is at the discretion of the decision-maker. SimDec can be added to any Monte Carlo study with essentially negligible additional computational overhead and can be incorporated independently of the simulation context [
25]. In the subsequent sections, SimDec will be employed to analyze the impacts from a simulation model of aviation electrification.
3. Electrification of Aviation
In essence, there are two main types of aircraft—turbo-propeller aircraft (or turboprops) and jets. The turboprops were the first aircraft type to be electrified due to the technical simplicity of such a modification: directly substituting an electric motor for the engine and batteries for the fuel tank [
28]. Regional aviation, where electrification provides a feasible option, operates mostly in the realm of “business aviation”, as opposed to the major airlines’ scheduled business models. In Europe, turboprops constitute 34% of the business aviation fleet and are responsible for 26% of the flights [
29], see
Table 1.
The European turboprop fleet of over 1000 aircraft is represented by ten main brands of airplane from seven manufacturers in the US and Europe,
Table 2.
The specific energy of batteries, defined as how much energy a battery contains per its mass, is currently considered to be the main constraining factor for electrical aviation [
30]. In a nutshell, batteries are simply too heavy. The existing specific energy levels for batteries range between 0.1 to 0.25 kWh/kg, which is ten times lower than the energy density of kerosene in combination with the specific power of combustion engine [
16]. Nevertheless, by extrapolating along major historic technology improvement trends, the airline industry forecasts storage solutions to easily increase to 0.8 kWh/kg within the coming decades [
17].
A second major factor frequently under-explored in current aviation research is the actual specific power of an electric motor [
31].
Table 3 highlights the specific power progression of Siemens motors over since 2015 [
32], which clearly demonstrates the recent rapid technological progression of electric motors.
Since the power of the motor is a function of its torque and rotational speed, high-speed solutions can substantially increase specific power as illustrated in the last motor in
Table 3. Unfortunately, such high-speed motors subsequently require the addition of a gearbox that is connected to the propeller (all the other motors from
Table 3 operate via direct drive) [
32]. Consequently, any additional gearbox mass must be accounted for when comparing the specific power of different electric motors. For example, when accounting for (say) a standard 50 kg aircraft gearbox, the overall specific power of the powertrain of the Siemens SP2000D would be reduced to 6.4 kWh/kg.
4. Model
4.1. Computational Logic
The computational model aims to estimate the flying range of an all-electric aircraft based upon improvements to its powertrain arising from the specific energy of batteries (kWh/kg) and the specific power of the electric motors (kW/kg). For simplicity, the overall mass of the aircraft is fixed, so that any improvement in the powertrain directly translates into additional “space” for more batteries that are subsequently used to replenish the aircraft’s total mass back up to its fixed amount. In reality, of course, any improvement in the powertrain could invoke numerous alternative aircraft design possibilities. However, for the purposes of systematically tracing the effect of technological improvements on the aircraft flying range, we assume the design and the mass of the aircraft to be fixed. To compute the flying range, we employ the aircraft electrification flight equations derived in [
16].
The mass, m, of an all-electric aircraft consists of (i) the mass of the empty aircraft,
, (ii) the mass of the passengers and the crew, together with their luggage,
, and (iii) the mass of the batteries,
.
In aviation modelling, the mass of passengers is normally approximated as the number of seats multiplied by 100 kg. The ratio is observed to be independent of the aircraft model and is equal to 0.62 for turboprops.
The energy consumption of an aircraft is defined as:
where
is gravitational acceleration equal to 9.81 m/s
2;
is flying range;
is the maximal lift-to-drag ratio, currently 20 is achievable;
and
are efficiencies of the propeller and the powertrain, respectively, typically both equal to 0.8. With given numerical assumptions,
where
is energy consumption and
stands for tonnes.
The mass of batteries can be defined as:
where
is the specific energy of batteries.
The flying range can be defined from (4) and (1) as:
The required power,
P, is calculated based upon cruise speed
and rate of climb
requirements as:
Combining this computational logic and the assumptions derived from existing turboprops (
Table 2), we arrive at the following numerical estimations for the model aircraft,
Table 4.
The computational logic is validated by the calculation of the flying range for the specified assumptions for current levels of specific energy of batteries 0.25 kWh/kg. Batteries at current technological development (LiFePo4, specific power of 2 kW/kg, specific energy of 0.12 kWh/kg) would constitute 7.5–15% of the total mass of a hybrid electric aircraft [
16]. In our calculations batteries in this base case constitute 12% of the mass of the aircraft and the flying range is 135 km, the number of the same magnitude comparing to estimated ranges for different aircraft sizes in [
16].
In the constructed model, the two input variables, (i) specific energy of batteries and (ii) specific power of electric motor, will be varied in order to determine their effects on the output variable, flying range. If only the specific energy of batteries is changed, the aircraft is assumed to be able to fly longer from the same mass of batteries on the board. If the specific power of the motor is changed, the same required power for a given aircraft can be achieved with a lighter motor. Any freed mass is assumed to be refilled by more batteries of the same specific energy to maintain a constant total mass of the airplane. More batteries onboard enable longer flight ranges. Thus, with such a model design, we are able to directly ascertain the effect of powertrain technological improvements on the flying range of an aircraft in a continuous numeric space.
4.2. Simulation
In this section, a Monte Carlo simulation model is set up and the SimDec method is employed on it to analyze the sensitivity of the output to the selected input factors, as well as for assessing the impact from any underlying interactions [
24]. The SimDec approach falls under the general auspices of variance-based sensitivity analyses techniques [
33] commonly used in engineering evaluation [
34]. However, instead of relying solely on calculated numerical indices, SimDec provides powerful visualization analytics that can uncover previously hidden interactions in a much more intuitive format for most decision-makers [
24].
Firstly, the key input factors, specific energy of batteries and specific power of electric motor, are modeled as random values generated from a uniform distribution. The model is recalculated 10,000 times and the resulting values of the output, flying range, as well as the corresponding input factor values are recorded. Secondly, the key input factors are broken down into meaningful ranges based on their ongoing technological progress. The specific energy of the batteries is segmented into three states, the existing level [0.1, 0.25] kWh/kg, the near-term possible level (0.25, 0.5] kWh/kg, and the “on the horizon” level (0.5, 0.8] kWh/kg. The existing level simply reflects the real specific energy of existing batteries [
16]. Some prototypes of lithium-sulfur batteries already achieved 0.4 kWh/kg specific energy, and more are expected in the near future [
35]. Therefore, we chose 0.5 kWh/kg as the upper threshold for the near-term possible level. Finally, 0.8 kWh/kg specific energy is deemed achievable by the mid-century by some experts [
17], and, thus, chosen as an upper limit for the on the horizon level.
The ranges of the specific power of the electric motor are comprised of the existing level [1.5, 4.0] kW/kg, an under-development level (4.0, 8.0] kW/kg, and a futuristic level (8.0, 20.0] kW/kg. The upper boundaries of the existing and under-development levels reflect the development of Siemens electric motors and correspond to the data presented in
Table 3. The upper limit for the futuristic level reflects existing targets in state-of-the-art R&D projects [
36].
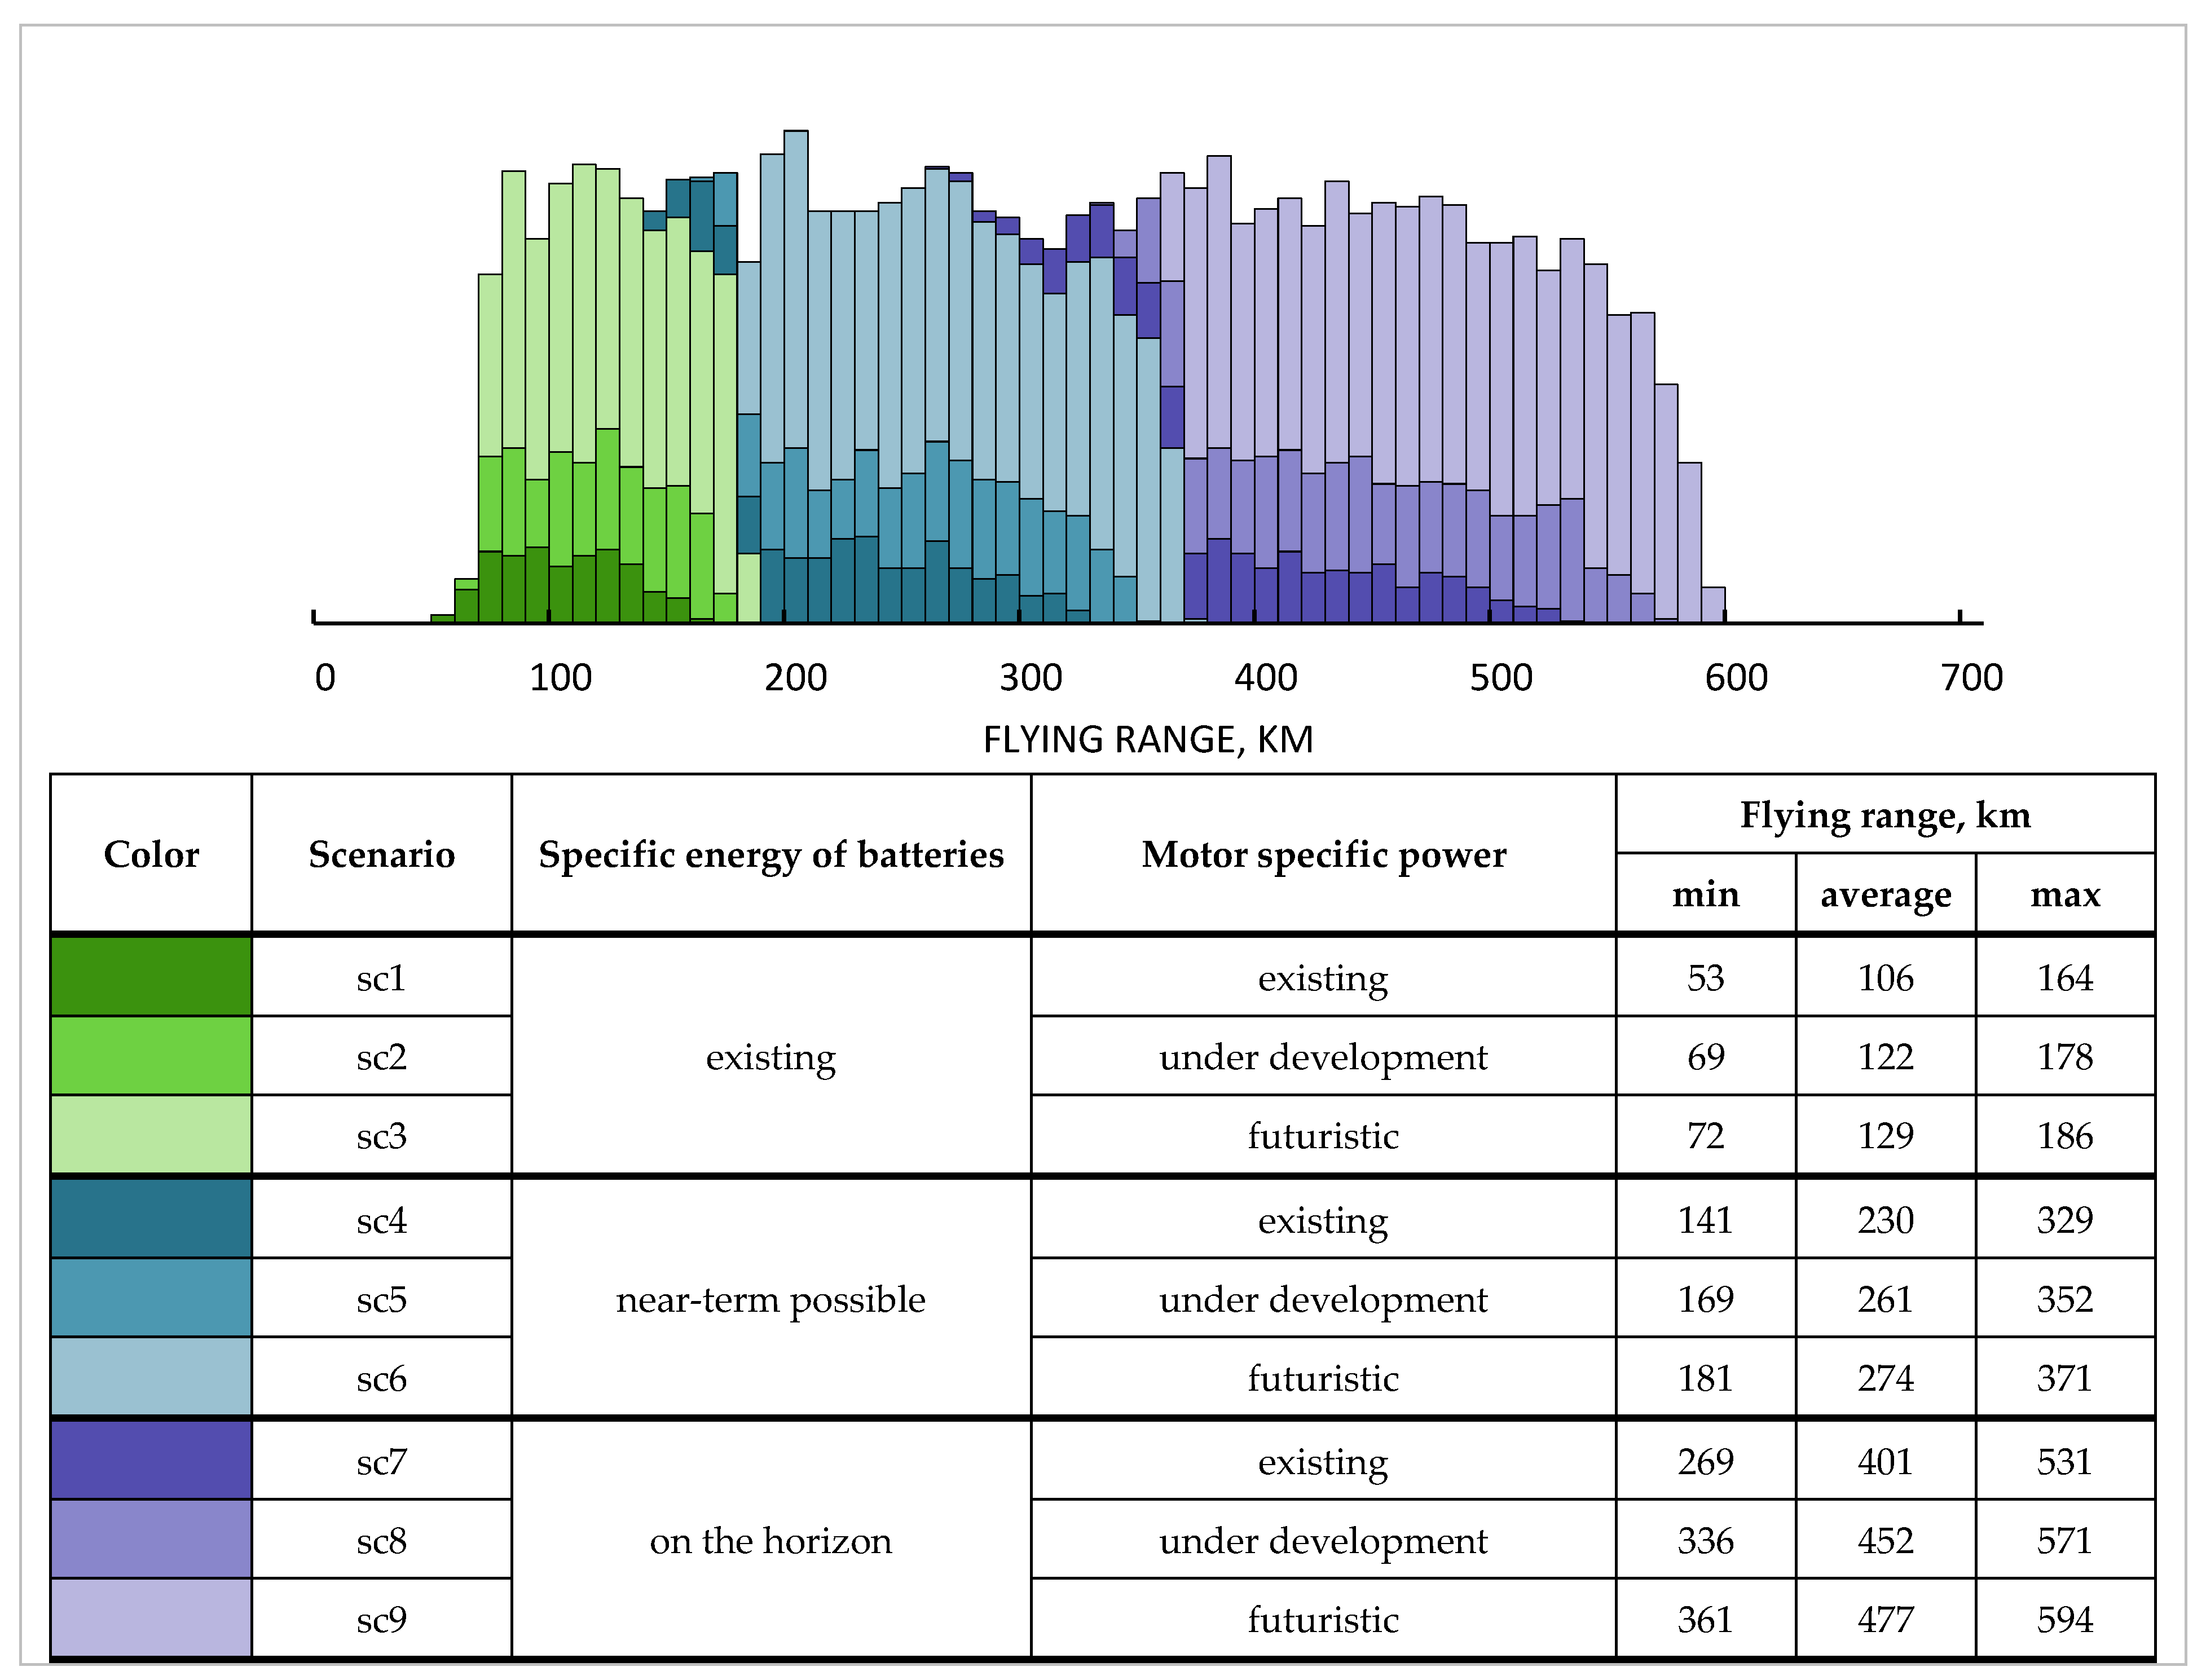
Taken together, all the states generate nine scenarios, found in
Table 5. It is important to note that the correctness of the numerical thresholds between states is not critical, since we are not interested in the precise boundaries of the resulting scenarios (which will be different for different aircrafts, anyway), but in the behavior of causalities between input and output factors, for which the precise position of the thresholds is not relevant.
Having recorded the simulation output data and the attributions of the input variables to their identified scenario partitions, each individual output value can be mapped onto its scenario index. Furthermore, a color-coding of this mapping is then applied onto the overall frequency histogram of the simulation (namely, the probability distribution of the flying range). Consequently, the resulting distribution of flying ranges, combined with the descriptive statistics of each scenario, enable a direct visualization of the individual effects of the input factors together with their interactions on the flying range output.
The computation logic described in
Section 4.1 is transformed into a model. The actual Monte Carlo simulation and SimDec analysis are performed using already existing macros previously implemented as an Excel tool introduced in [
24] (where it can be downloaded for free).
5. Results and Discussion
From the Monte Carlo simulation, the decomposed distribution of the possible flying range based upon the specific energy of batteries and the specific power of an electric motor is illustrated in
Figure 1. In addition, the figure also provides numeric details from each scenario.
The three different color groupings denote the three levels of specific energy of batteries. The gradations of the colors within each group are indicative of the distinct levels of motor specific power. The numerical descriptives in the legend can be directly derived from the probability distribution figure. For example, the minimum value for sc1, 53, is the leftmost edge of the whole distribution.
The first takeaway that one can be derived from the decomposition is that the specific energy of batteries is, indeed, a critical factor. Namely, any improvement in the specific energy produces a substantial gain in the number of extra kilometers flown. With only minor overlap, the three groups (of colors) appear distinctively partitioned on the graph, thereby suggesting a strong influence from the underlying factor.
Secondly, the effect of the increasing motor specific power is also substantial, but nonlinear. With the existing levels of battery specific energy, improving the motor provides only incremental benefits. However, with a higher specific energy of batteries, the effect of improving the motor becomes more and more pronounced. For example, one can readily observe the difference between the right edge of sc1 and sc2 (178 − 164 = 13) and sc7 and sc8 (571 − 531 = 40)—a veritable two-fold increased improvement in flight range. This occurs because the weight saved from using a motor with higher specific power provides more of a benefit if batteries also have higher specific energy. The consequences of this observation lead to an important implication. Although with the existing levels of battery specific energy, investing in electric-motor R&D might not look particularly beneficial, it will lead to significant, tangible, positive differences when conducted in simultaneous conjunction with the development of battery technology.
However, the impact from improving the electric motor, alone, is also nonlinear. Specifically, within the same level of battery specific energy (e.g., the on the horizon), the difference between the right edges of existing and under development motor specific power, sc7 and sc8 (571 − 531 = 40) is higher than the difference between under development and futuristic, sc8 and sc9 (594 − 571 = 24). Indeed, increasing the electric motor specific power from 5 to 10 kW/kg generates a 100% yield in specific power, and thus, the output flight range, while from 15 to 20 kW/kg, there is only a 33% increase. Although this linear function of relative specific power yield might be obvious for engineers, financial decision-makers involved in investment planning may consider absolute values (km, €, etc.)—thus, the relation becomes nonlinear. Irrespective of the starting point, a five kW/kg increase in specific power may well imply similar levels of R&D investment costs. However, the benefit—and thus the pay-off of such an investment—will differ dramatically, depending on the specific power of the motor that has already been achieved. Consequently, the value of every “next step” in electric motor development should be weighed against its cost.
The three main conclusions from the SimDec decomposition can be summarized as:
Increasing the specific energy of batteries extends the flight range.
Increasing motor specific power has an incremental effect for the current level of battery specific energy, but this impact will increase significantly with better batteries.
The marginal benefit from electric-motor improvement, alone, decreases.
Although our analysis focuses on the flying range, the derived distances directly translate into economic and environmental benefits. Any extended flying ranges directly correspond to an increased number of possible routes or pairs of towns that can be connected. In Europe, fewer than a hundred airports connect towns within a distance of 50 km between each other. However, if the inter-town distance is expanded to 500 km, nearly a thousand airports could be connected. Apart from the increased flying distance, the improved powertrain technology enables electrifying larger planes that can transport more passengers or larger loads per flight. Furthermore, fully electrified aircraft fleets would entirely eliminate the emissions from fuel combustion. The corresponding environmental impact would, therefore, be dependent upon which electricity is used to charge the batteries or, more specifically, from the specific combination of each respective country’s actual power mix. Even so, there are still other life cycle emissions aspects that are associated with specific aircraft design and operations. More detailed life-cycle estimates of the environmental impacts of such air-traffic electrification are presented in [
17].
6. Conclusions
Decision-making in multifaceted environmental arenas requires complex computational modelling and, thus, clever analytics and visualization solutions that are able to capture multiple dimensions, simultaneously. Monte Carlo simulation modelling has frequently been employed to integrate the uncertain inputs and to construct probability distributions of the resulting outputs. Visual analytics and data visualization can be used to support the processing, analyzing, and communicating of the influence of multi-variable uncertainties on the decision-making process. SimDec enables one to observe the output distribution of the variables of interest and simultaneously trace which components of the output distribution are attributable to specific combinations of the input variables.
In this study, SimDec was used to decompose a Monte Carlo model of the flying range of all-electric aircraft based upon improvements to batteries and electric motors. While the analysis focused upon the flying range for electrified aircraft, the distance findings extend directly into corresponding environmental and economic benefits. The decomposed results show that: (i) increased battery specific energy leads to increased flight distance; (ii) increased motor specific power has a significant effect when the batteries’ specific energy is high; and, (iii) there is a decrease in the marginal benefits from motor improvement, alone. While the first observation cannot be considered surprising because there is a linear relationship between flight range and battery specific energy (Equation (5)), the latter two findings would not be inherently obvious to decision-makers without specialized aeronautical engineering backgrounds, and the SimDec analysis provides a perfect means to effectively demonstrate and communicate them.
The aviation electrification problem has illustrated how SimDec enables the simultaneous projection from combinations of multi-variable input uncertainties directly onto an output distribution. It demonstrated how SimDec stratified two sources of electrification uncertainty into distinct, coloured partitions that enabled a visualization of previously unidentified cause-and-effect influences of input variable combinations onto the flight distance output in the R&D investment analysis of aviation electrification. Since SimDec computations can be run concurrently with any Monte Carlo model with only negligible additional overhead, SimDec could easily be extended into the analysis of any environmental application that uses simulation—not just aircraft electrification. This generalizability, in conjunction with its straightforward visualizations of complex stochastic uncertainties, makes the practical contributions of SimDec very powerful in environmental decision-making. The efficacy for extending SimDec into more diverse environmental and sustainability applications beyond aviation electrification will be considered in future research.


