Article

Combining Re-Analyzed Climate Data and Landcover Products to Assess the Temporal Complementarity of Wind and Solar Resources in Iraq

by
Mourtadha Sarhan Sachit
1,2,
Helmi Zulhaidi Mohd Shafri
1,*,
Ahmad Fikri Abdullah
3 and
Azmin Shakrine Mohd Rafie
4
1
Department of Civil Engineering and Geospatial Information Science Research Center (GISRC), Faculty of Engineering, Universiti Putra Malaysia (UPM), Serdang 43400, Malaysia
2
Department of Civil Engineering, College of Engineering, University of Thi-Qar, Nasiriyah 64001, Iraq
3
Department of Biological and Agricultural Engineering, Faculty of Engineering, Universiti Putra Malaysia (UPM), Serdang 43400, Malaysia
4
Department of Aerospace Engineering, Faculty of Engineering, Universiti Putra Malaysia (UPM), Serdang 43400, Malaysia
*
Author to whom correspondence should be addressed.
Sustainability 2022, 14(1), 388; https://doi.org/10.3390/su14010388
Submission received: 24 November 2021 / Revised: 25 December 2021 / Accepted: 27 December 2021 / Published: 30 December 2021

Abstract

:
Considering the spatial–temporal variation of renewable energy (RE) resources, assessment of their complementarity is of great significance for decision-makers to increase the stability of power output and reduce the need for storage systems. In this regard, the current paper presents a roadmap to assess the temporal complementarity patterns between wind and solar resources for the first time in Iraq. A new approach based on re-analyzed climate data, Landcover products, and geographical information system (GIS) is proposed. As such, renewable resource datasets are collected for 759 locations with a daily timescale over five years. Landcover classes are translated into wind shear coefficients (WSCs) to model wind velocity at turbine hub height. Then, the Pearson correlation coefficient (PCC) is applied to calculate the complementarity indices for each month of the year. Results of this investigation reveal that there are significant synergy patterns spanning more than six months in the southwestern regions and some eastern parts of Iraq. The highest complementarity is observed in March and December with a value of −0.70 and −0.63, respectively. Despite this promising potential, no typical temporal complementarity has been discovered that would completely eliminate the fluctuations of clean power generation. However, the synergistic properties yielded by this work could mitigate the reliance on storage systems, particularly as they cover important regions of the country. The proposed approach and tools can help improve the planning of renewable energy systems.

1. Introduction

The expansion of renewable energies (RE), such as solar and wind, is a top priority in global policy strategies to meet the growing demand for electricity and to mitigate climate change [1]. However, the fluctuation of wind and solar energy leads to problems, such as lower reliability of the power system and higher demand for energy storage [2]. As a result, reducing the variability of renewable power supply is critical for large-scale renewable energy (RE) integration [3]. One of the most prominent solutions that has been applied recently is the hybridization of renewable systems, that is, wind–solar hybrid farms. Given that they are generated by different renewable resources, wind and solar energy outputs are complementary to some extent [2]. Reducing individual fluctuations can also be achieved by installing solar and wind power plants across regions with a contrasting resource pattern. This approach will make the aggregated power output smoother, which helps improve the management of electrical grids [1,2]. To this end, the complementarity assessment between wind and solar energy has received increasing attention in the last few years.
Energy complementarity can be defined as the ability of two or more power sources to work together in complementing their generation and improving their energy performance [4,5]. Complementarity studies determine the feasibility of using wind and solar energy resources together in a specific region and time and help identify potential sites for the installation of hybrid generation systems [5]. These types of studies are increasingly conducted nowadays in which the complementarity is divided into temporal, spatial, and spatiotemporal. On the one hand, temporal complementarity can be observed between two or more RE sources in the same region over a specified timescale, for example, over a year or a season [6]. Spatial complementarity, on the other hand, can be observed between one or more types of RE sources at the same time across multiple regions [6]. Complementarity can also be spatiotemporal, such that the conditions defined above are met simultaneously in space and time [5]. The complementarity of wind and solar plants in the same region is the most superior in most cases because complementarity is hardly improved by dispersing solar plants. Scattering wind farms across different regions is also costly due to the necessary long-distance transmission lines [2].
In recent years, the complementarity between wind and solar energy has been investigated in China [2,7,8], United States [9,10], Colombia [3,11], Australia [12], Mexico [5], Lesotho [13], Germany [1], Algeria [14], Poland [15], and France [16]. Numerous related publications have also been comprehensively discussed in the review studies by [6,17]. In China, [2] conducted a study in which they comprehensively assessed the spatiotemporal complementarity of wind and solar resources on the basis of the Modern-Era Retrospective Analysis for Research and Applications, version 2 (MERRA-2) dataset. [9] used one-year hourly energy output data for wind and solar power plants distributed throughout California together with electricity demand data to examine potential complementarities. In both studies, the authors reported that wind–solar complementarity in hybrid systems is superior to that between wind or solar energy plants in different regions. [11] applied a novel approach based on image processing to conduct a monthly energetic complementarity study of wind and solar energy resources in Colombia. The results, which have translated into energetic complementarity maps, indicate that projects involving the combined use of wind and solar systems could be developed in the northern and northeastern regions of the country. In Australia, [12] explored the spatiotemporal synergy patterns of wind and solar resources using a hourly-level time-series dataset from MERRA-2 to mitigate generation fluctuations. [1] investigated the spatiotemporal variability of renewable resources and their potential complementary behavior in Germany. Their results revealed that the considered timescale greatly influences the formulation of complementarity indices. [14] evaluated the temporal and spatial complementarity between wind and solar energy in Algeria for hourly, daily, and monthly timescales. They demonstrated that evaluating complementarity on the basis of resource potential or energy generation yielded nearly identical results. In a recent similar study, [15] analyzed the temporal and spatial behavior of wind and solar resources across Poland solely on the basis of the availability of potential energy resources. The results showed that temporal complementarity often exists on a seasonal scale and is almost negligible in hourly and daily observations. Another study provided a helpful global map for the initial assessment of the complementarity between wind and solar energy by [18]. The study recommended considering its approach for a more detailed analysis of specific countries or regions.
In the aforementioned studies, wind speed and solar irradiation that are collected from ground observations or re-analyzed weather data were the parameters referred to in modeling the potential of wind and solar energy resources. Furthermore, the most widely used and accepted approach was to apply correlation coefficients, Pearson’s coefficient in particular, to reveal complementarity patterns in the time-series data for renewable resources. Nevertheless, some shortcomings have not been addressed in the relevant literature:
First, the attention given to calculations of wind speed extrapolation at turbine hub height is insufficient, despite it being an essential and critical step in assessing wind energy potential. Many studies dealt with the different parts of the study areas equally by generalizing the use of the power law with a shear exponent of 1/7, especially when the reference data are scarce. In fact, the wind shear coefficient (WSC) varies from place to place, depending on the roughness of the earth’s surface. The 1/7 exponent is only suitable for use over smooth, grassy landscapes under semi-neutral weather conditions [19]. Thus, the extrapolation of wind speeds over vast areas according to a constant wind shear exponent often leads to uncertainty in the assessment of wind resources, causing significant errors in the complementarity estimation. Therefore, considering the multiple values of the power law exponent deserves more research to develop a reliable complementarity assessment between wind and solar resources.
Second, wind and solar resource thresholds, which are critical values to be exceeded to generate feasible energy, are always neglected in complementary map modeling. Failure to consider renewable resource thresholds would give misleading results when investigating the optimal sites for hybrid system installation. Even low values of wind speed and solar radiation could be strongly inversely correlated, indicating a good complementary pattern. However, the power output from both sources will be unpromising despite their complementarity. Therefore, filtering the complementarity results according to renewable resource thresholds would highlight regions where wind energy effectively complements solar energy.
Third, although articles dedicated to this topic have looked at different regions around the world, complementarity assessment in Middle Eastern countries is lacking. Thus, examining the synergistic behavior between wind and solar resources over the Iraqi territory would contribute to bridging this research gap.
To the best of the authors’ knowledge, this study contributes for the first time to the assessment of temporal complementarity between wind and solar resources in Iraq over monthly cycles. The study uses reanalyzed daily climate data from the database of MERRA-2 for the period from 1 January 2016 to 31 December 2021. A new approach based on remote sensing data analysis is applied to estimate the wind resource potential at turbine hub height. In this method, the latest and highest resolution land cover provided by the Environmental Systems Research Institute (ESRI) is utilized to extract WSCs across the Iraqi territory. Additionally, this paper improves the obtained complementarity results by imposing new exclusion criteria that have never used before in related works, which are mainly based on minimum thresholds of wind speed and solar irradiation. Finally, GIS is employed to present the findings of this study in the form of maps that can be used to identify potential areas for future installations of hybrid wind–solar farms. The next section discusses the material and methods applied in this study to meet the stated objectives.

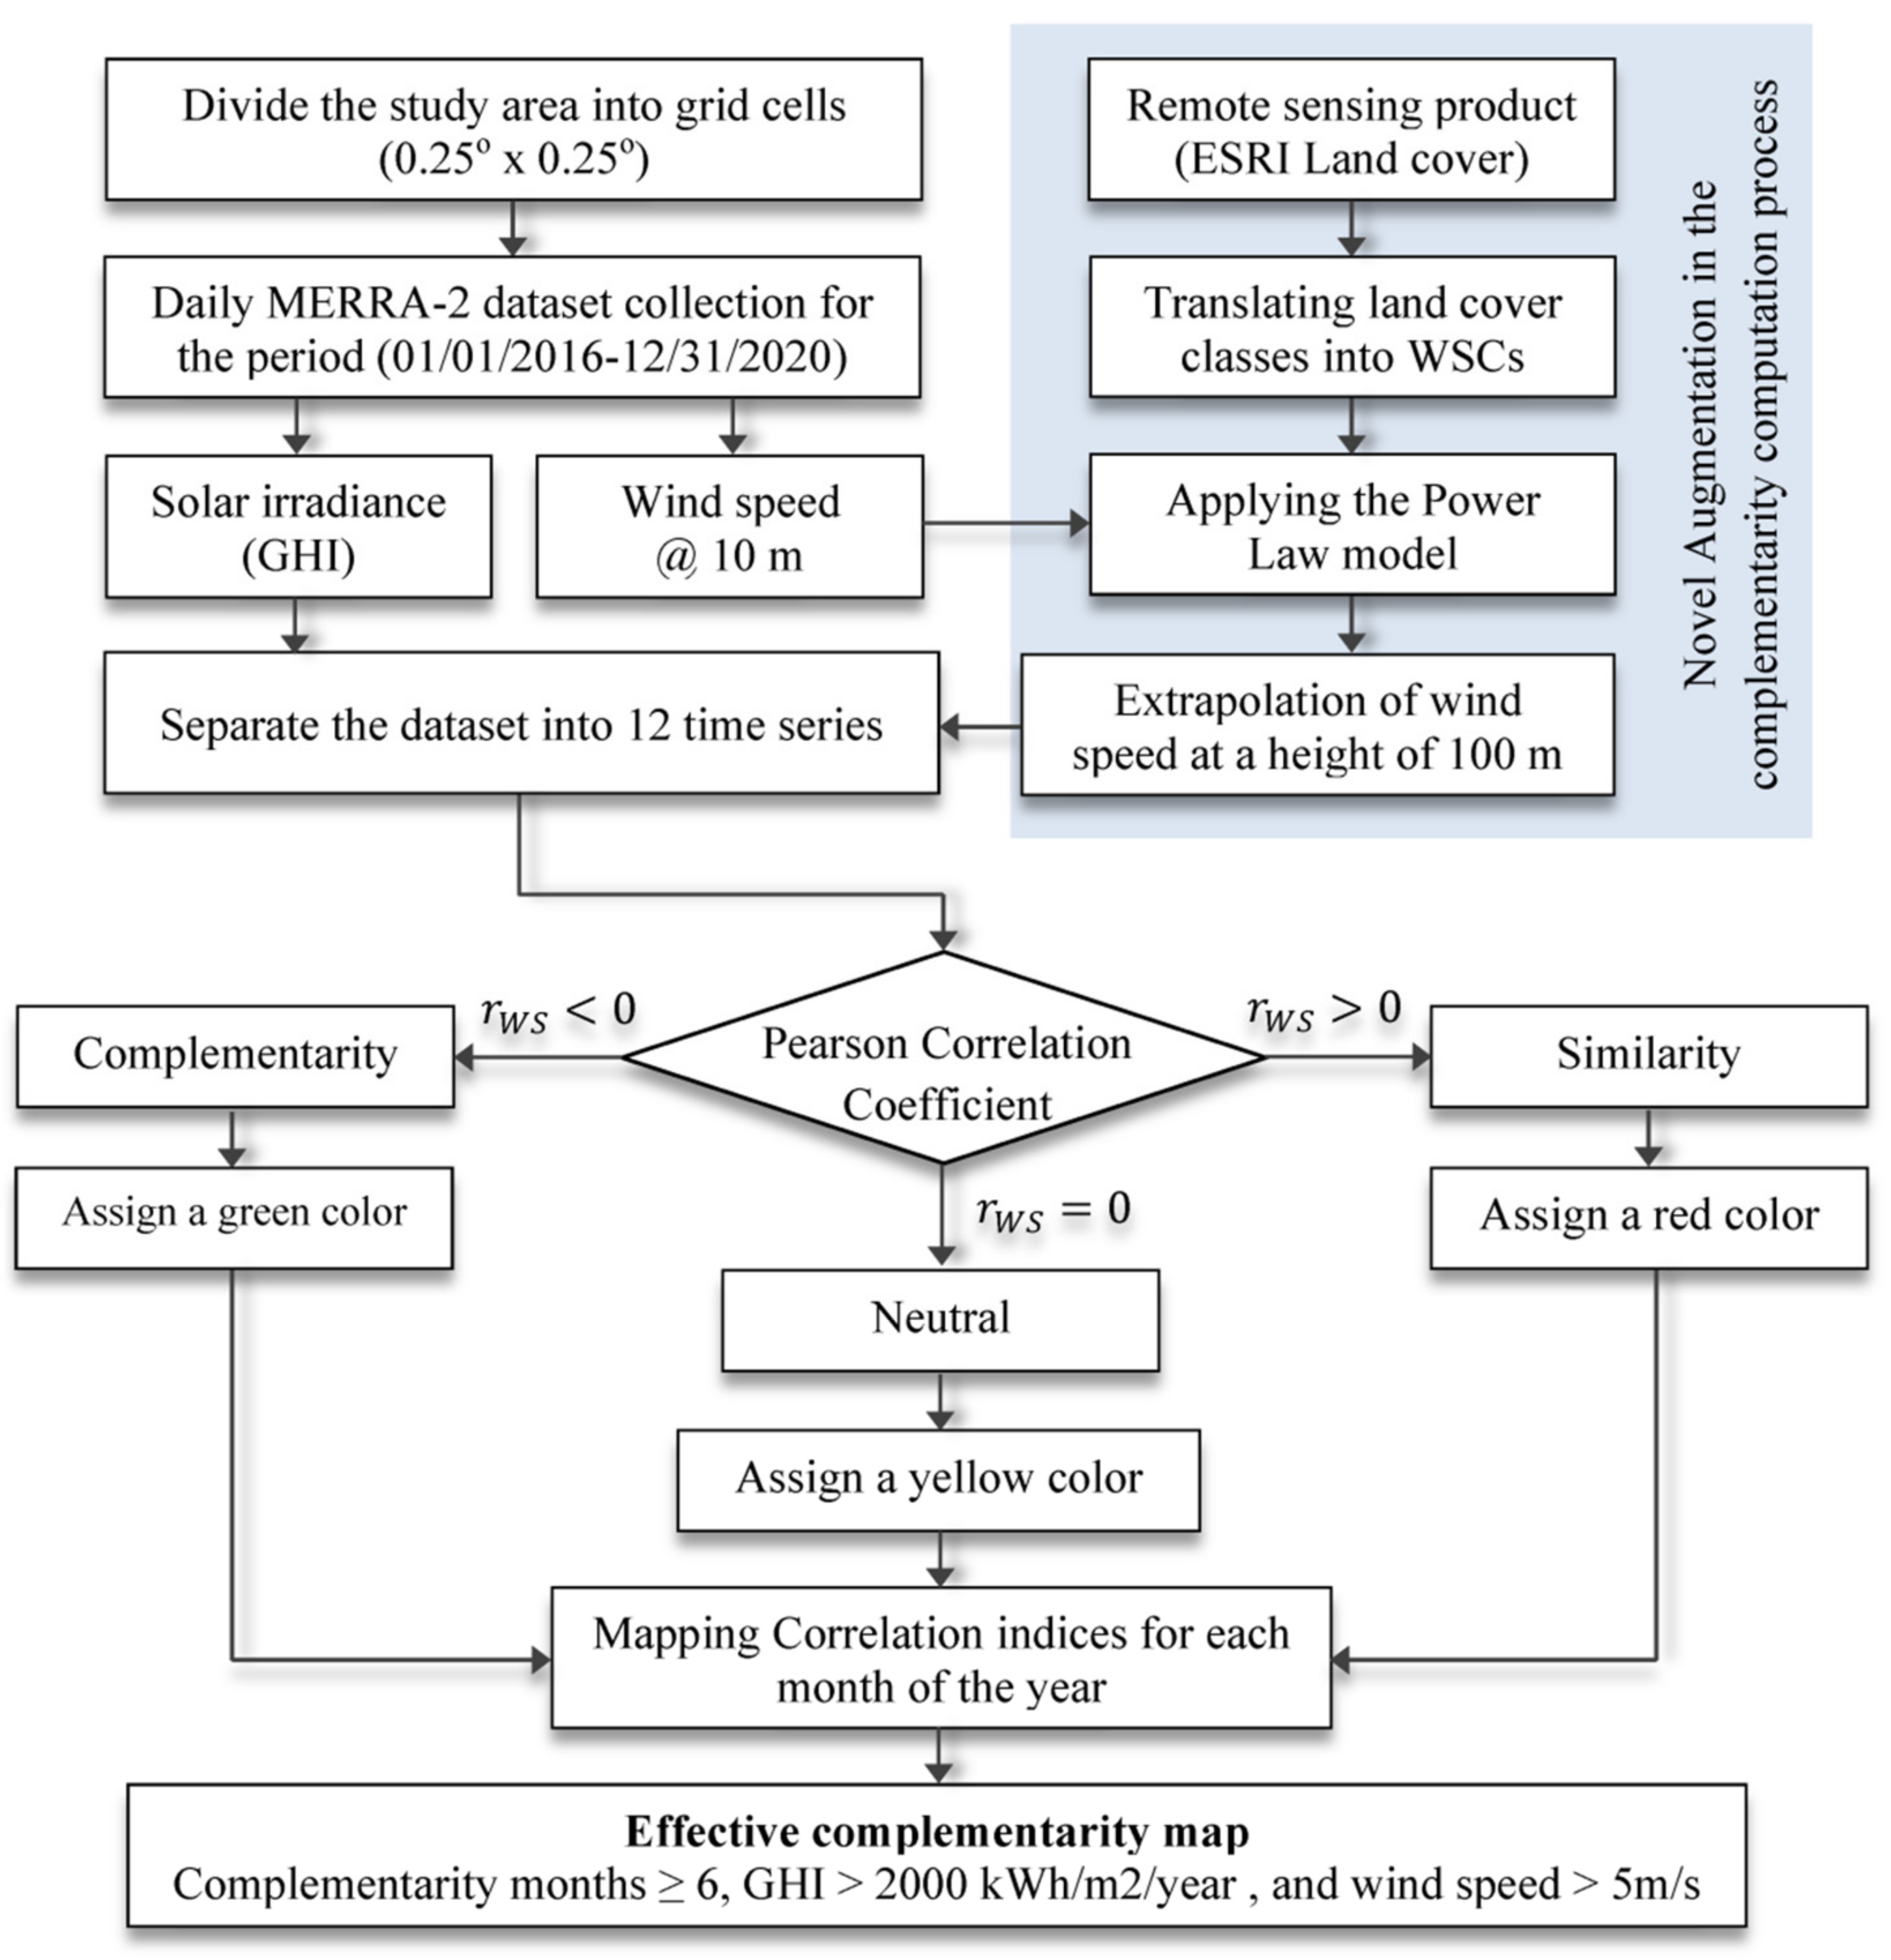
2. Materials and Methods

Iraq, a Middle East country, is located in Southwest Asia within the longitudes (38°45′ to 48°40′) East and latitudes (29° 05′ to 37° 20′) North. Iraq extends over a vast area of 438,317 km2 and features diverse terrain and weather. The country can be divided into three main geographical zones: the alluvial plain in the center and South Iraq through which the Euphrates and Tigris rivers flow, the plateau in the west and the southwest, and the rolling upland and mountains in the north and the northeast [20]. Iraqi territories are exposed to significant periods of solar irradiation exceeding 3000 h/year, with an average hourly solar intensity of 625 W/m2 [21]. Winds are described as moderate, with an average velocity of 5–7 m at the turbine blades’ height, and are highly active in the southeast of the country [22]. Despite the promising potential of renewable resources, Iraq still depends heavily on fossil fuels for energy production, hardly meeting the growing demand. Fortunately, the country’s energy policy has recently begun to shift toward relying on clean energy sources, launching major investments in this sector [23]. Moreover, the government has taken advantage of renewable energy for various purposes, including irrigation through the installation of hybrid systems [24]. Therefore, investigating the complementarity behavior between wind and solar energies would support this commendable trend by identifying optimal sites for future installations.
The methodology of this study is based on employing the variables of surface solar radiation and wind speed at the hub height to assess the complementarity of wind–solar energy resources. The methodology includes the following main steps (Figure 1): (1) obtaining a renewable resource dataset, (2) extrapolating the wind speed at the hub height with an emphasis on deriving and evaluating WSC using remote sensing data, (3) mapping the potential solar and wind resources, and (4) assessing the temporal complementarity of wind–solar resources. All steps involved in preparing, representing, and analyzing data are performed in ArcGIS 10.5.

2.1. Wind–Solar Resources Dataset

The data used for investigating RE sources primarily come from ground-based metrological stations, reanalyzed weather data platforms, or satellite remote sensing data. Reanalyzed data are commonly considered in the literature due to the lack of recorded meteorological observations covering entire areas of interest; in addition, satellite data require further processing and analysis [2,3,12,14].
In this study, the global horizontal irradiance (GHI), also known as surface incident shortwave flux, and the near-surface wind velocity dataset are obtained from the MERRA-2 database [25]. MERRA-2, a component of NASA’s atmospheric reanalysis database, provides open-source worldwide gridded meteorological data for various variables [3]. MERRA ‘s product generates on a global scale a physically consistent image of the atmospheric state that is based on the integration of observations from a global grid of weather stations, satellites, aircraft, and radio sounders [12]. Compared with other reanalysis products, such as NCEP and ERA-Interim, MERRA can offer higher resolution output frequencies and multiple timescales ranging from 1 min to months. Significant effort has been made to validate the MERRA data, verifying their suitability for the complementarity assessment of wind and solar energy resources [12,26,27,28].
To collect a time series dataset of MERRA-2, the study area is divided into 0.25° × 0.25° grid cells, which is a higher spatial resolution than those adopted in several references [3,8,14]. Thus, the wind–solar complementarity is assessed based on 759 sites, as illustrated in Figure 2. The geographical coordinates of all the cell centers have been extracted to facilitate the exploration of the MERRA-2 database. The GHI and wind velocity data are found under the names of “short-wave irradiation (Wh/m2)” and “wind speed (m/s) at 10 m above ground,” respectively. Following [2], five-year reanalysis data are collected from 1 January 2016 to 31 December 2020, yielding more reliable results than the conclusions based on the one-year dataset in several references [9,13,14,29]. Finally, 1 day is considered for the temporal resolution of the current dataset. More information on the timescale is provided in Section 2.4.1.

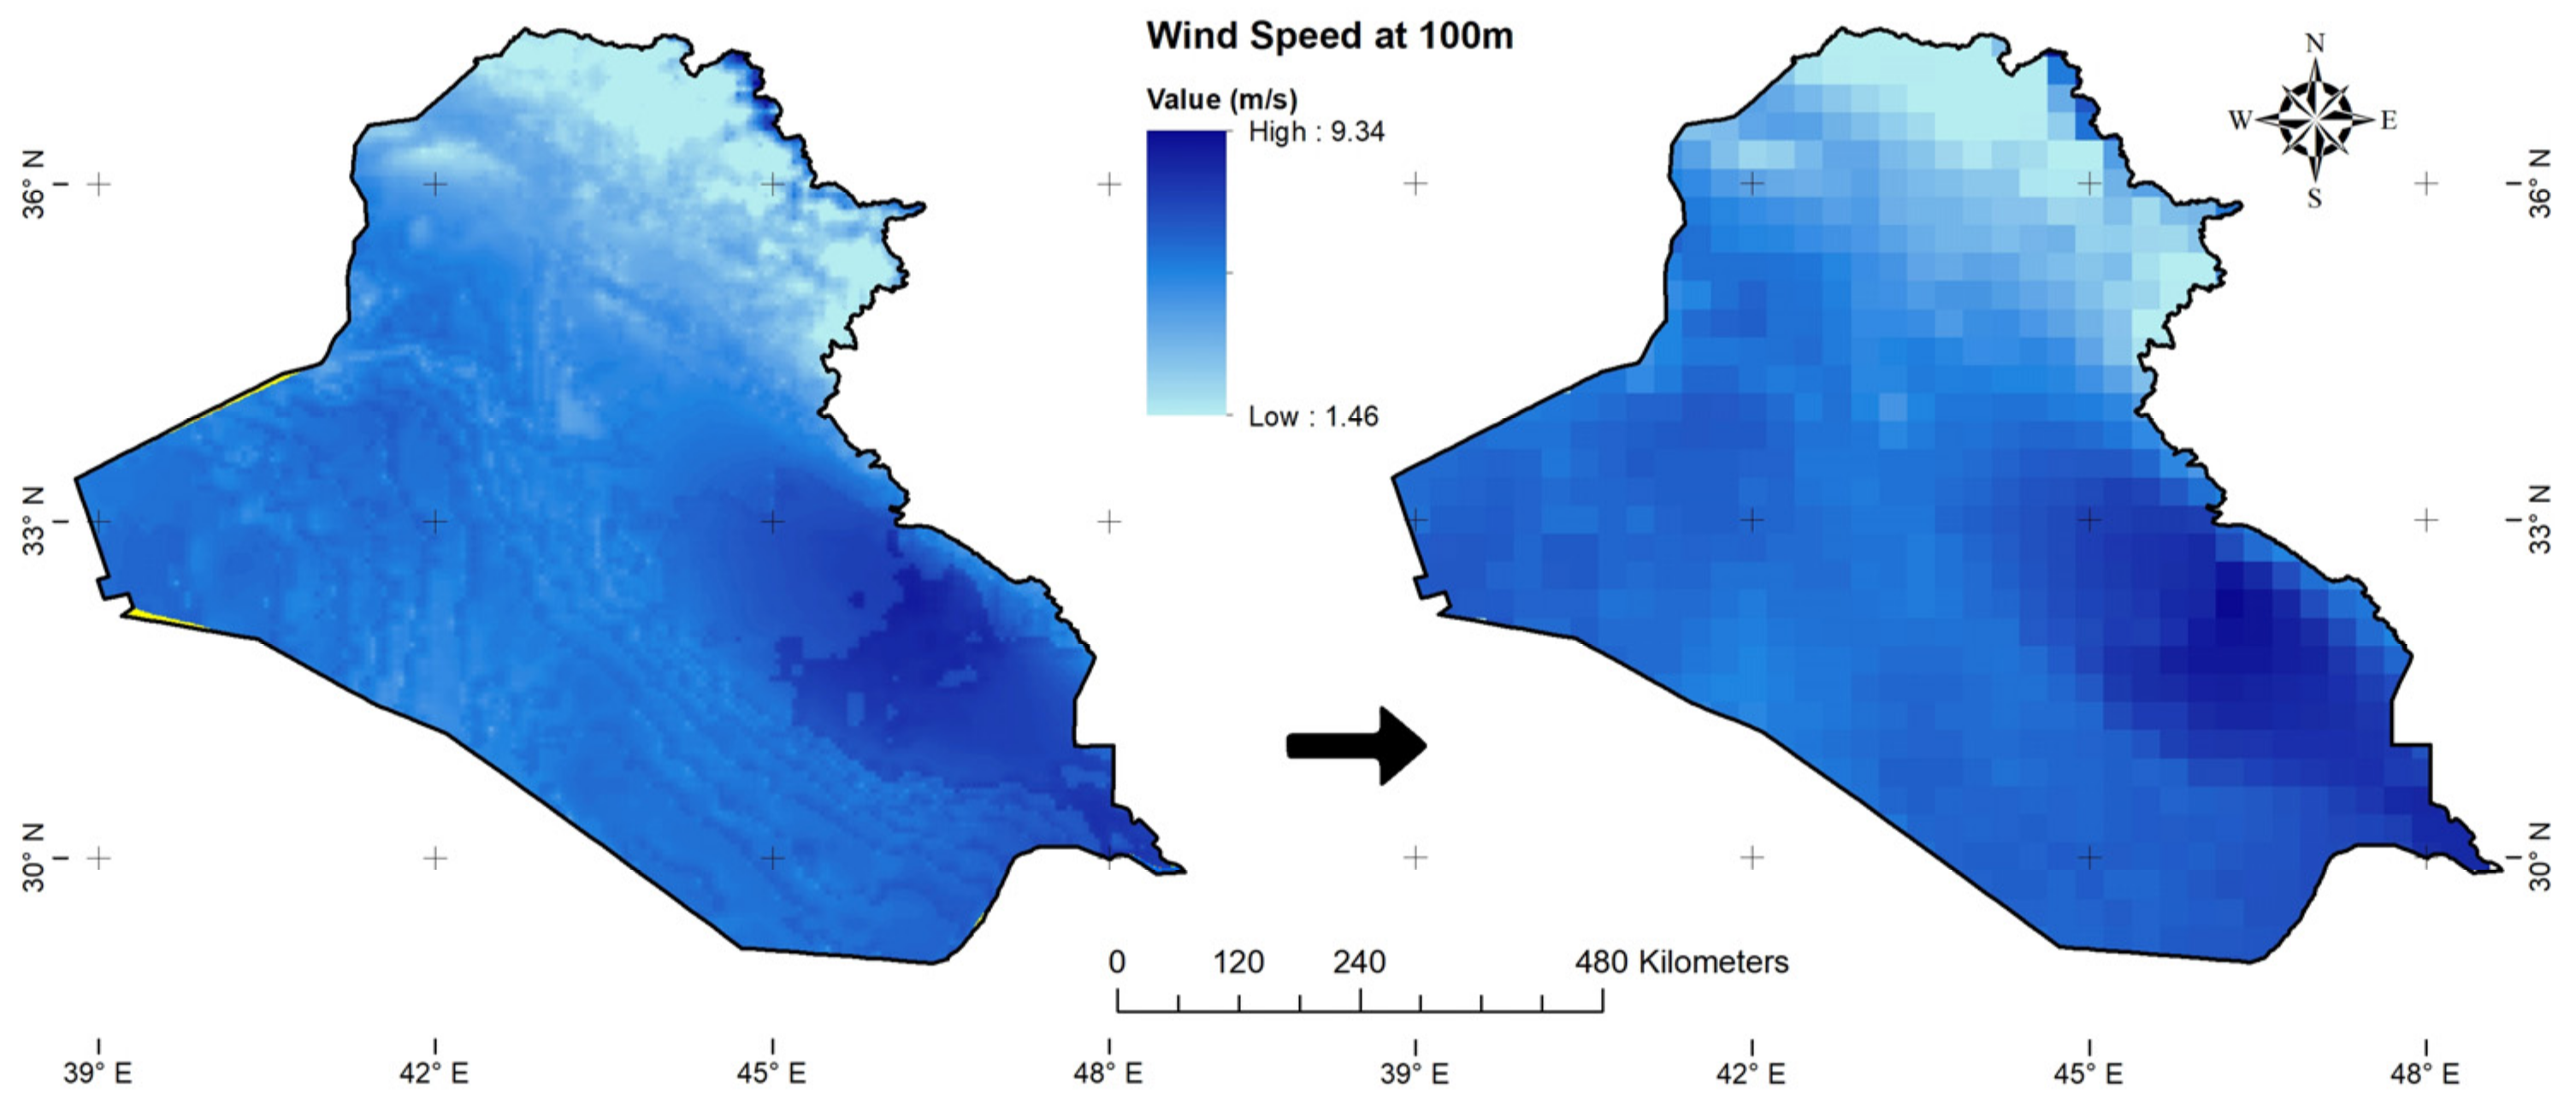
2.2. Wind Speed Extrapolation

With modern wind turbine technology, the optimum hub height could reach as high as 100 m or above to capture higher wind speeds [19]. However, most measured or reanalyzed wind data are available at 10 m above ground level. Thus, the wind speed must be vertically extrapolated to the turbine hub height for the reliable assessment of wind energy. To do so, the power law is applied in this work as commonly used and recommended [30].

2.2.1. Power LAW

The power law, which was first developed by [31], is also known as the Hellman exponential law. This law uses the power law model to correlate wind speeds at two different heights as follows [19]:
v 2 v 1 = h 2 h 1 α ,
where v 1 refers to the available wind speed at reference height h 1 , and v 2 is the extrapolated wind speed at hub height h 2 . Hellman’s exponent ( α ) represents the WSC. A value of 1/7 is often used for α in many related studies [2,8,14]. However, the Hellman exponent varies from site to site between 0.1 and 0.4, depending on the landscape type [32], and can be estimated according to Table 1. Therefore, considering the multiplicity of α values is essential when assessing wind resources over vast study areas with diverse landscapes, such as Iraq. For this purpose, the present paper proposes the use of thematic maps of remote sensing imagery, also known as land cover maps, to estimate the values of α .

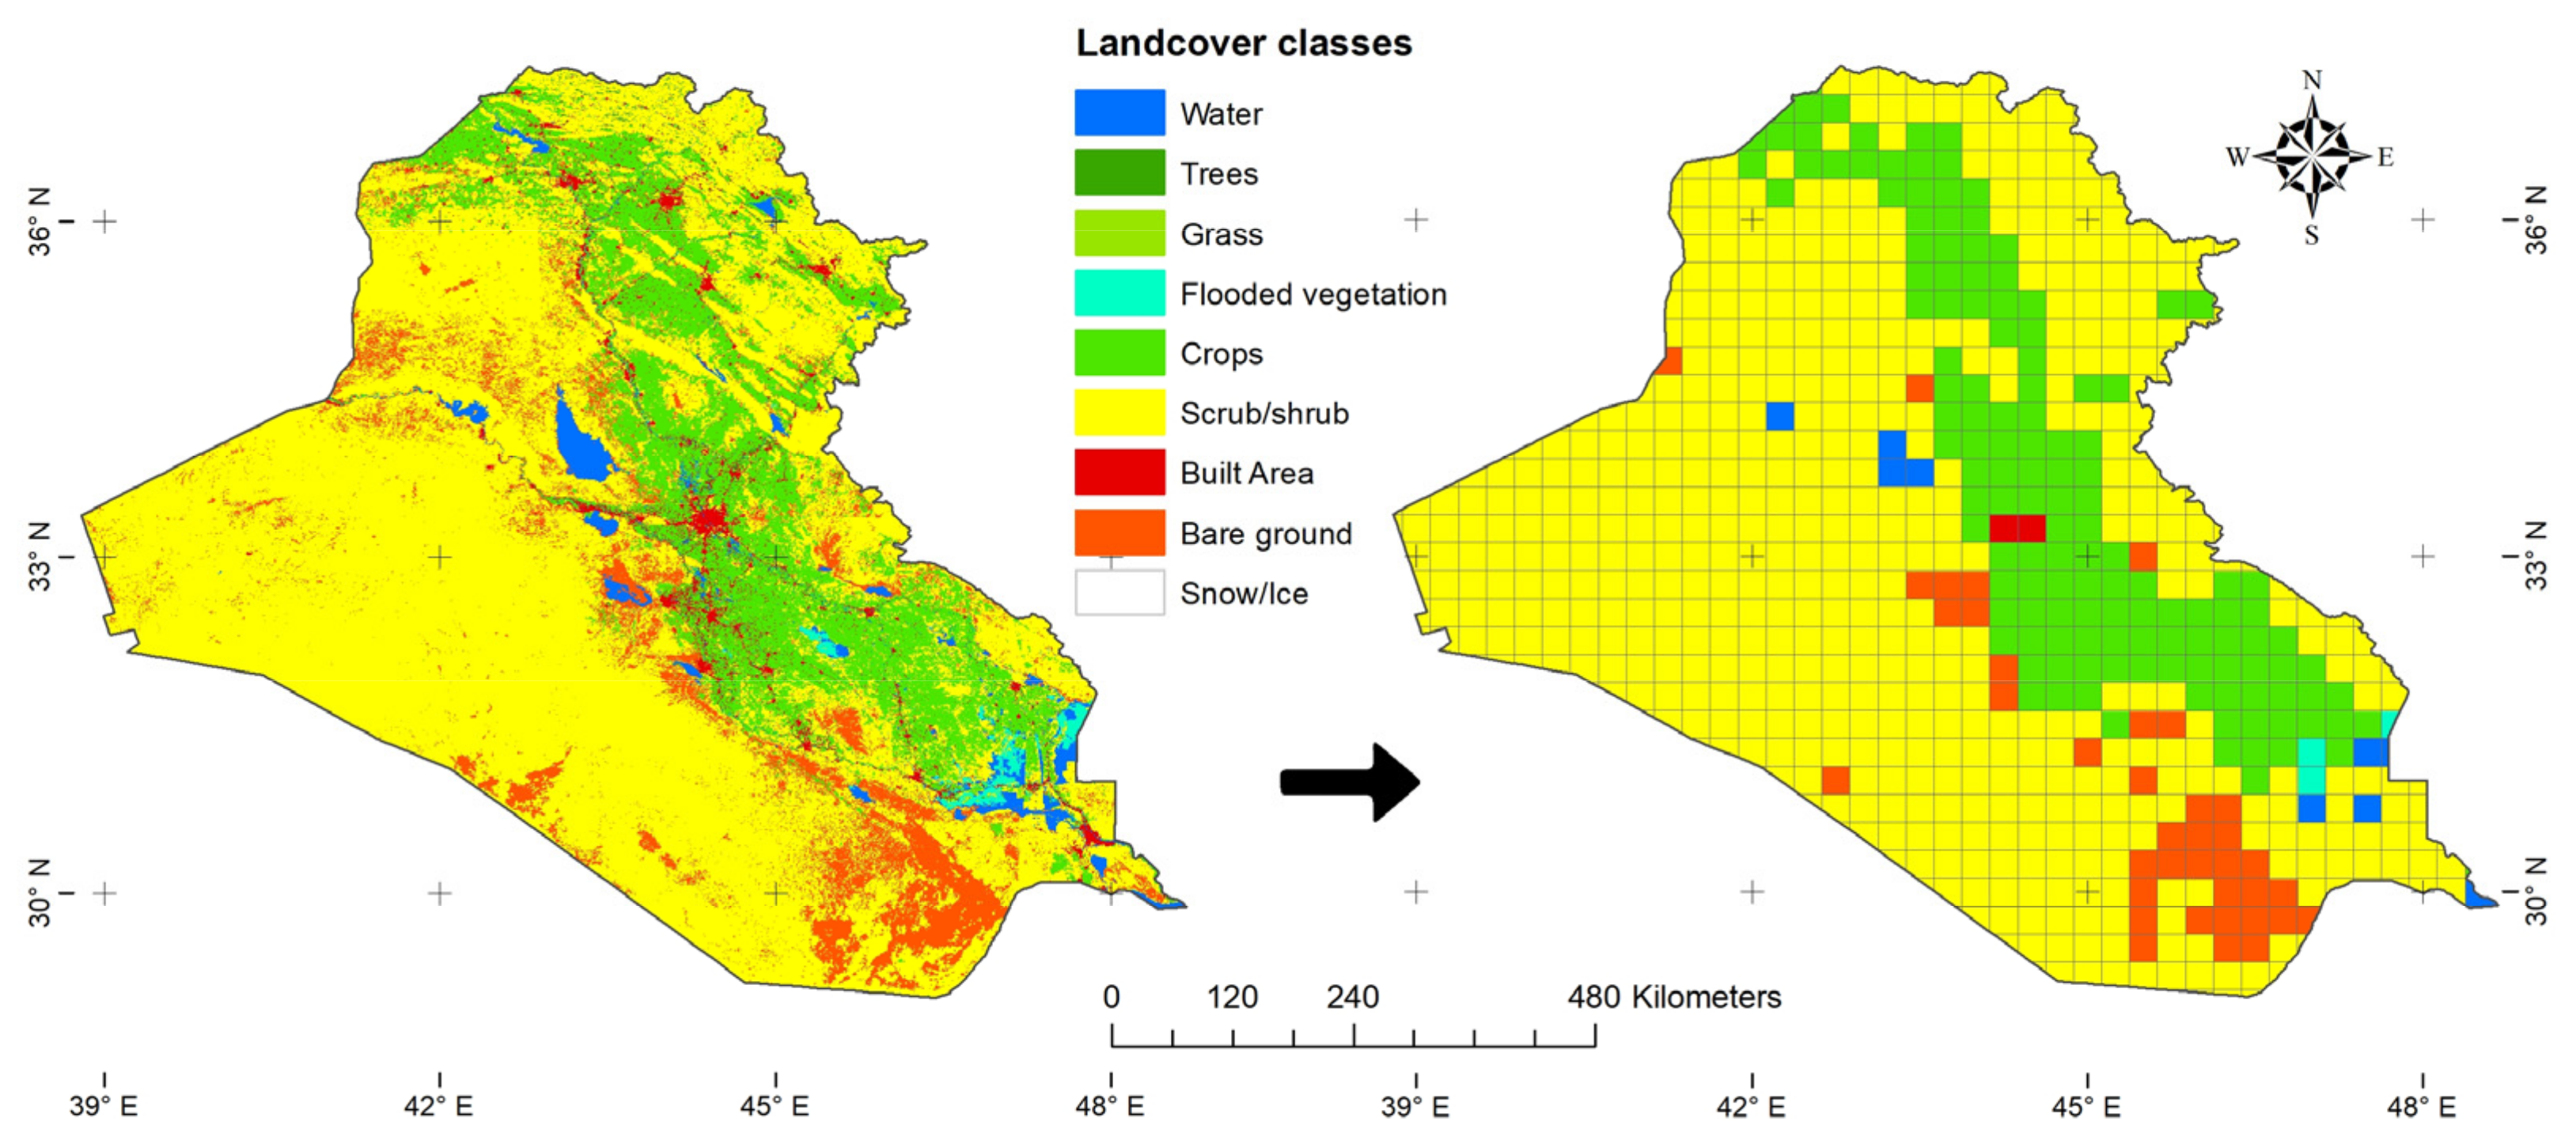
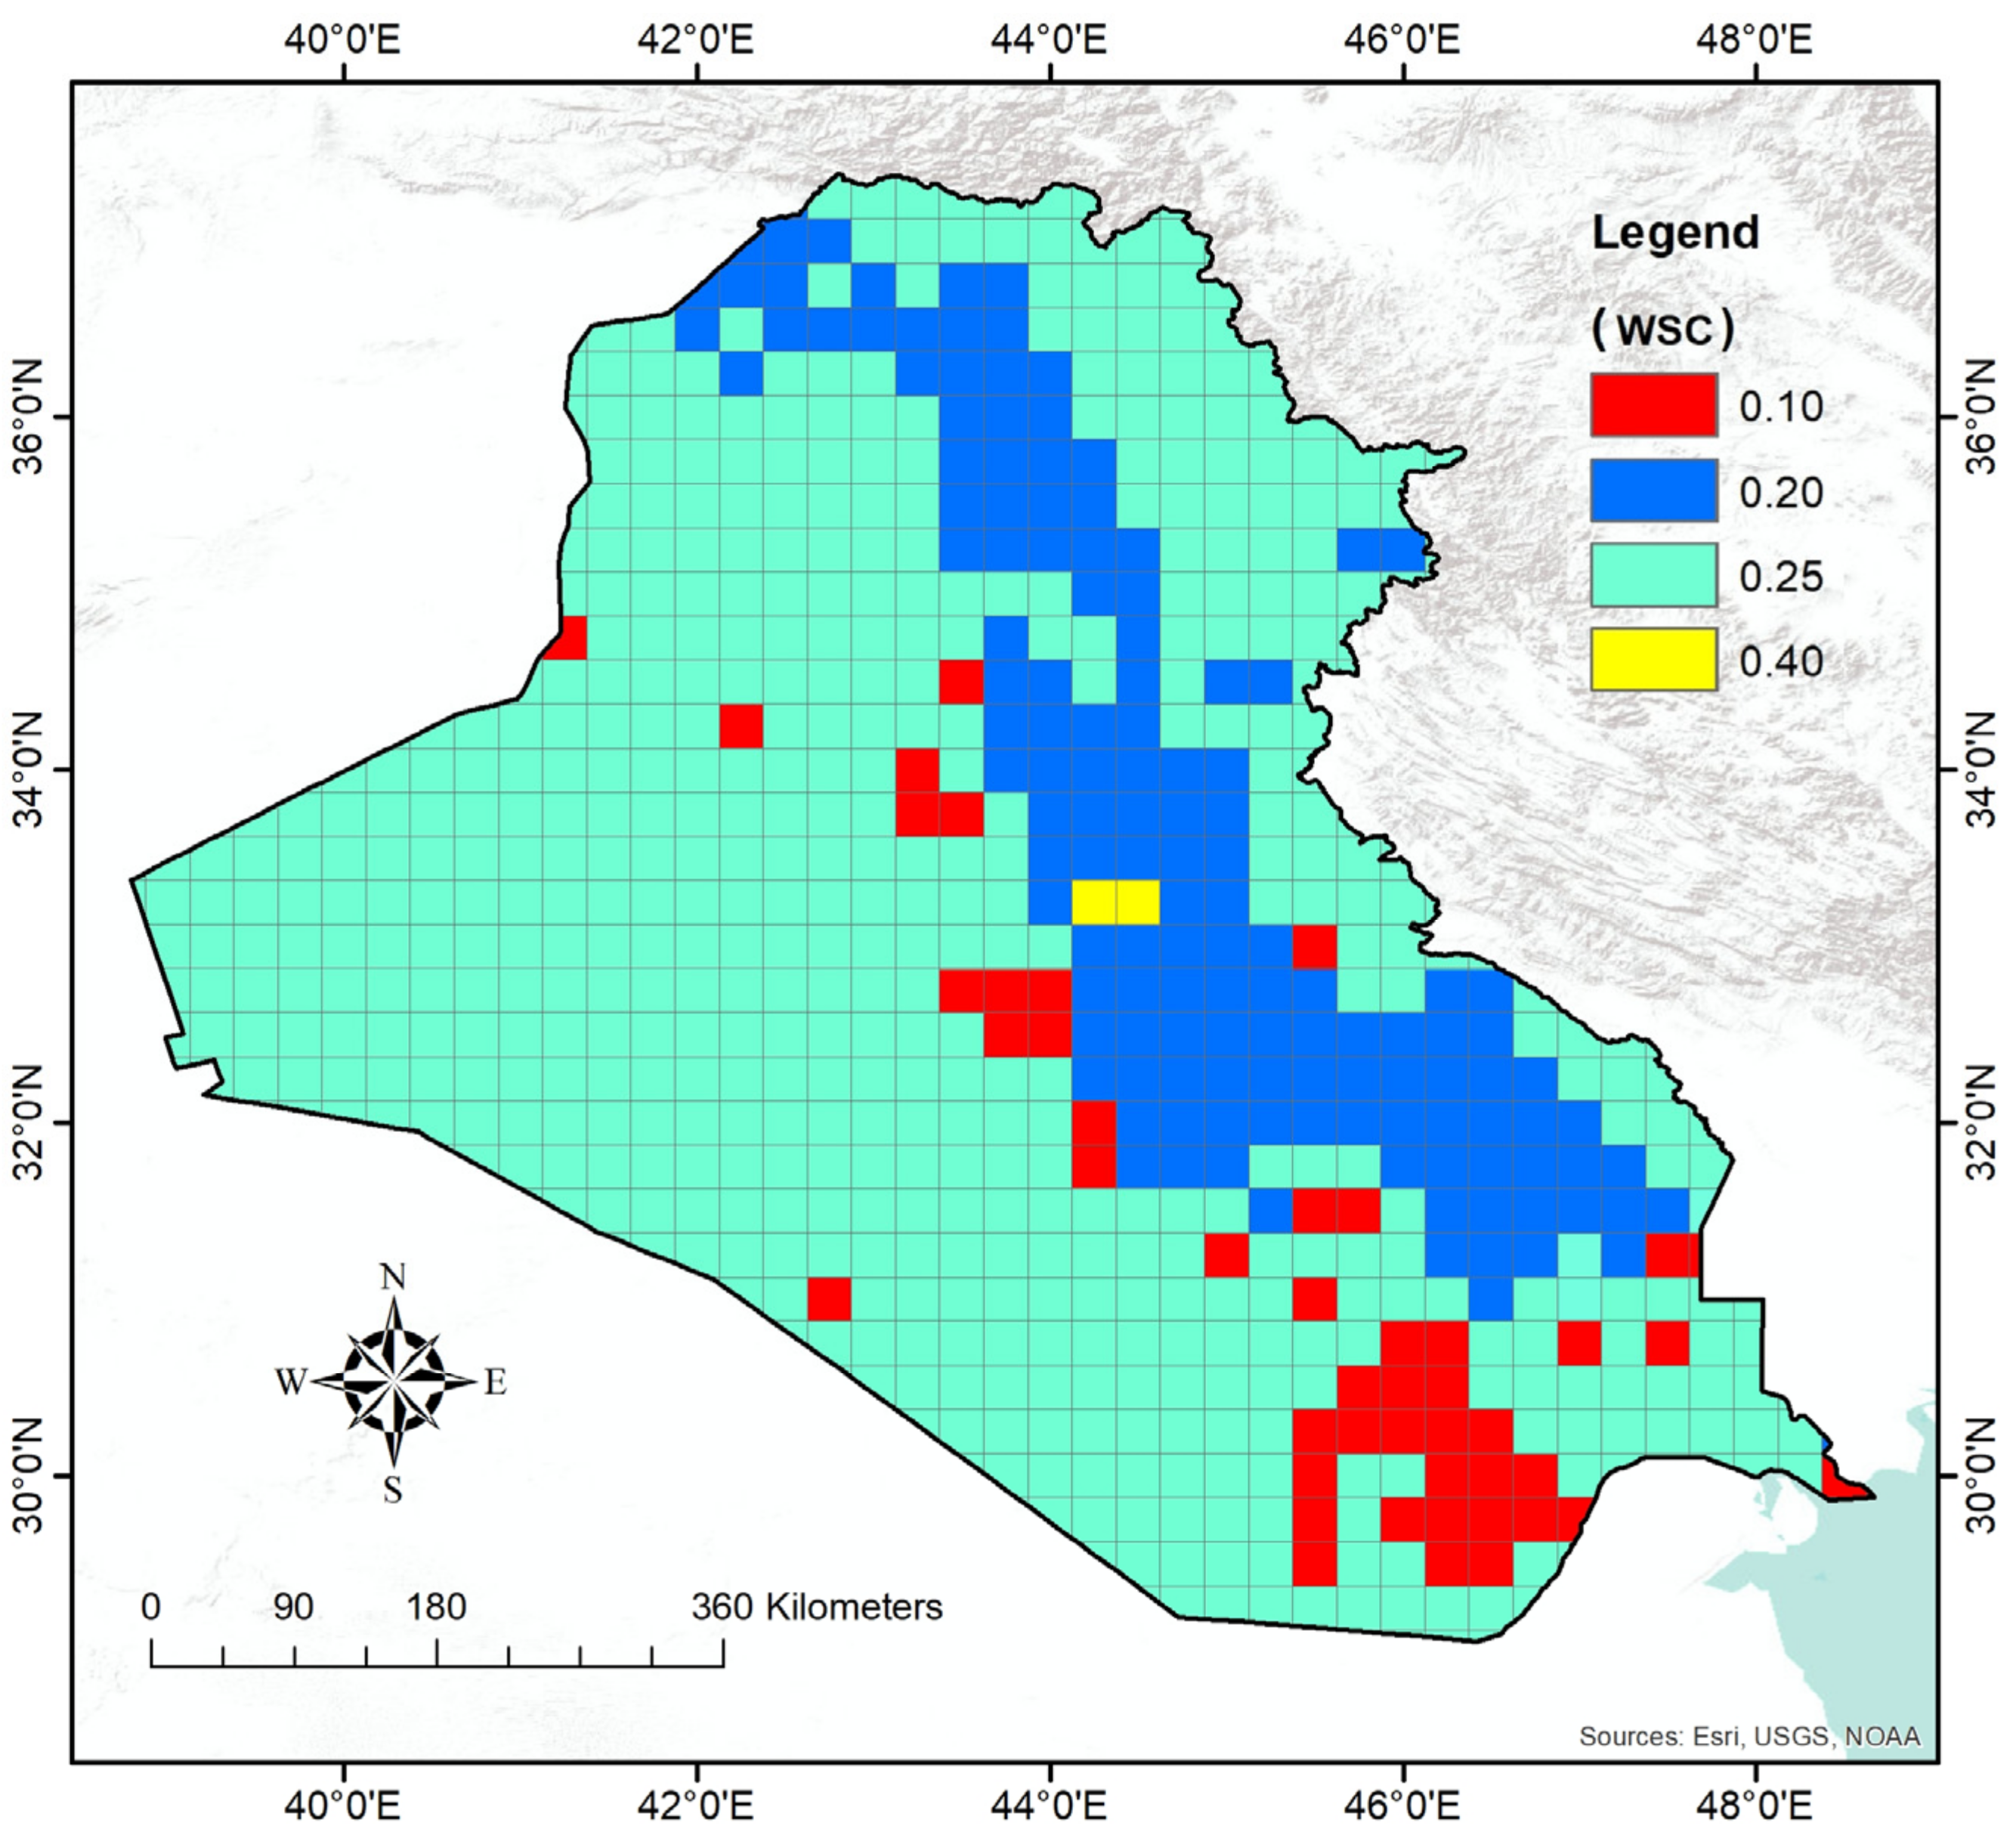
2.2.2. Land Cover Analyses for WSC

The approach of obtaining α values for wind speed modeling converts landscape types to WSC through the aforementioned look-up table. Traditionally, landscape types are identified through field survey, which is considered a laborious, costly, and time-consuming task [36]. In this work, land cover data are used in the identification of landscape categories. The recent global land cover map released by ESRI in 2020 is adopted [37]. The map is derived from Sentinel-2 images with a high spatial resolution of 10 m. ESRI’s land cover presents 10 surface classes, as illustrated in Figure 3, which are easy to match with landscape types, including vegetation, crops, water, and built areas. Further details on ESRI land cover classes definition can be obtained from the reference [38].
The steps implemented in ArcGIS 10.5 software to develop a WSC map from the land cover data are detailed in the Supplementary Materials.

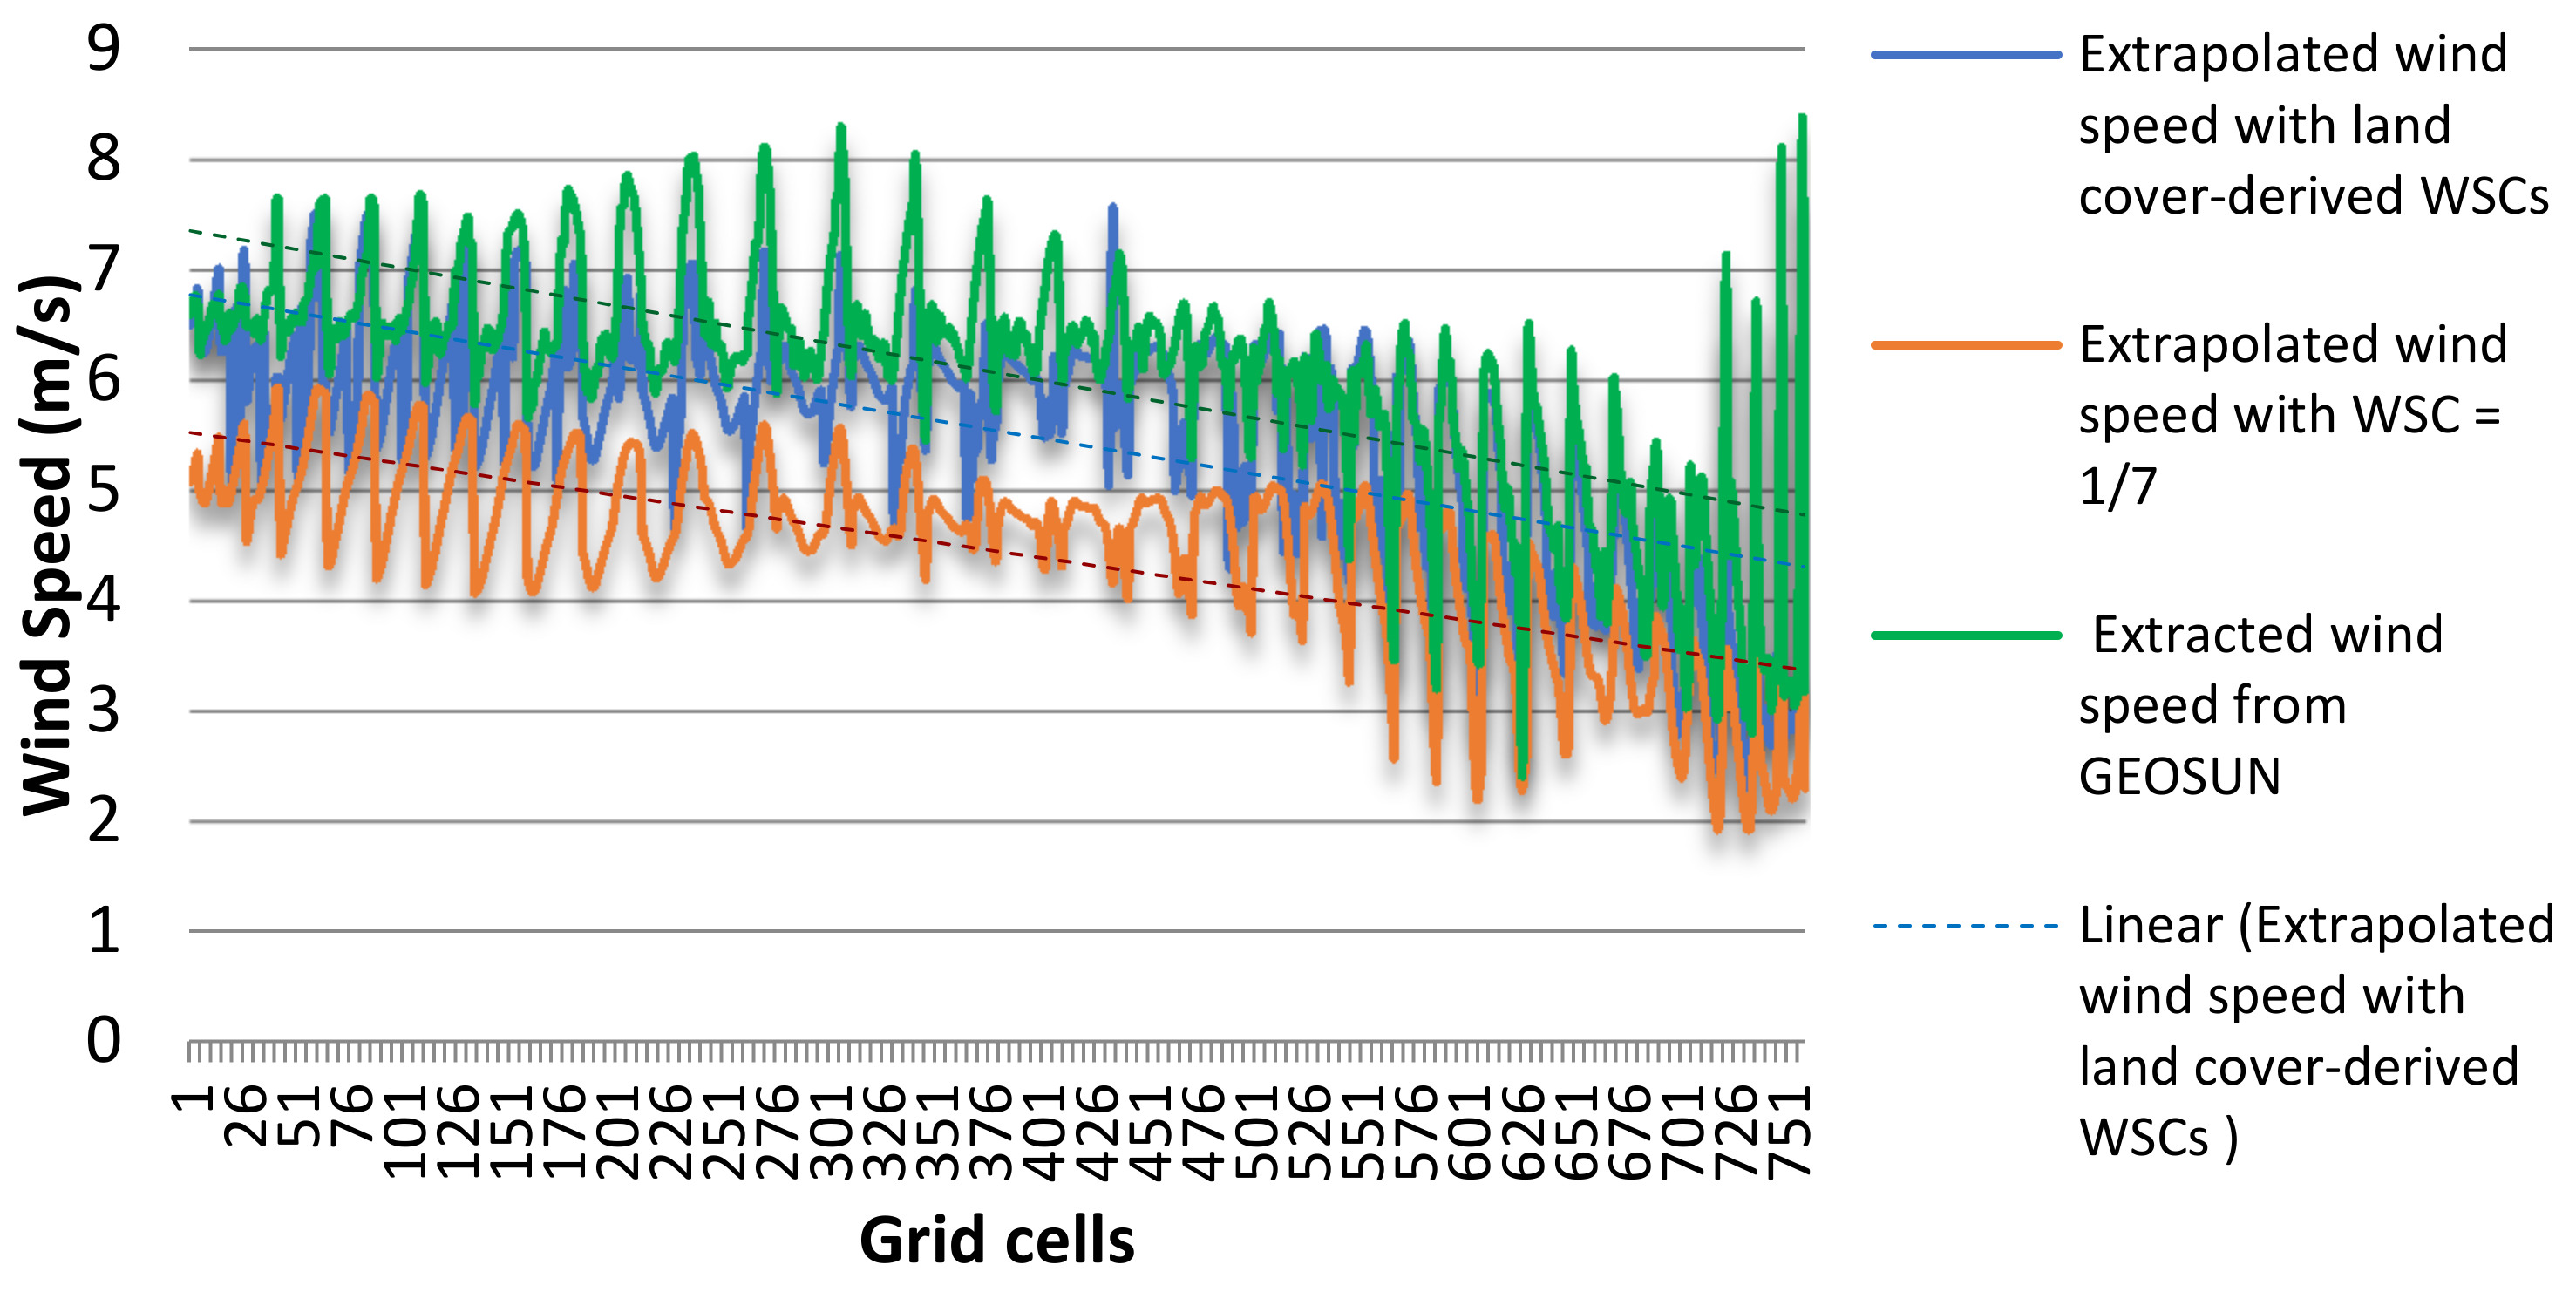
2.2.3. WSC Validation

To validate the WSC values obtained from the land cover analysis, the extrapolated wind speed based on the WSC is compared with the GEOSUN data. GEOSUN is a digital map of wind resources in Iraq, presenting the average wind velocity at three different altitudes: 30, 50, and 100 m. The map is generated using the atmospheric mesoscale model SKIRON and ground observed data [39]. The comparison in this validation can be summarized by the following sequential steps:
  • Calculation of the average wind speed for each grid cell on the basis of the collected MERRA-2 data.
  • Extrapolation of the average wind speed for each cell at a height of 100 m using Equation (1) and the WSC values derived from the land cover.
  • Re-computation of the previous step using the experimental WSC value of 1/7.
  • Extraction of the wind speed for each cell on the basis of the GEOSUN map of 100 m altitude, as shown in Figure 4. This requires calculating the mean value of the GEOSUN pixels within each cell using the Zonal Statistics tool with the Mean function.
  • Calculation of the mean bias and the RMSE for both extrapolation attempts is as follows [40]:
    Mean   Bias = 1 n i = 1 n E G ,
    RMSE = 1 n i = 1 n E G 2 ,
    where E and G indicate the extrapolated and GEOSUN wind data, respectively.

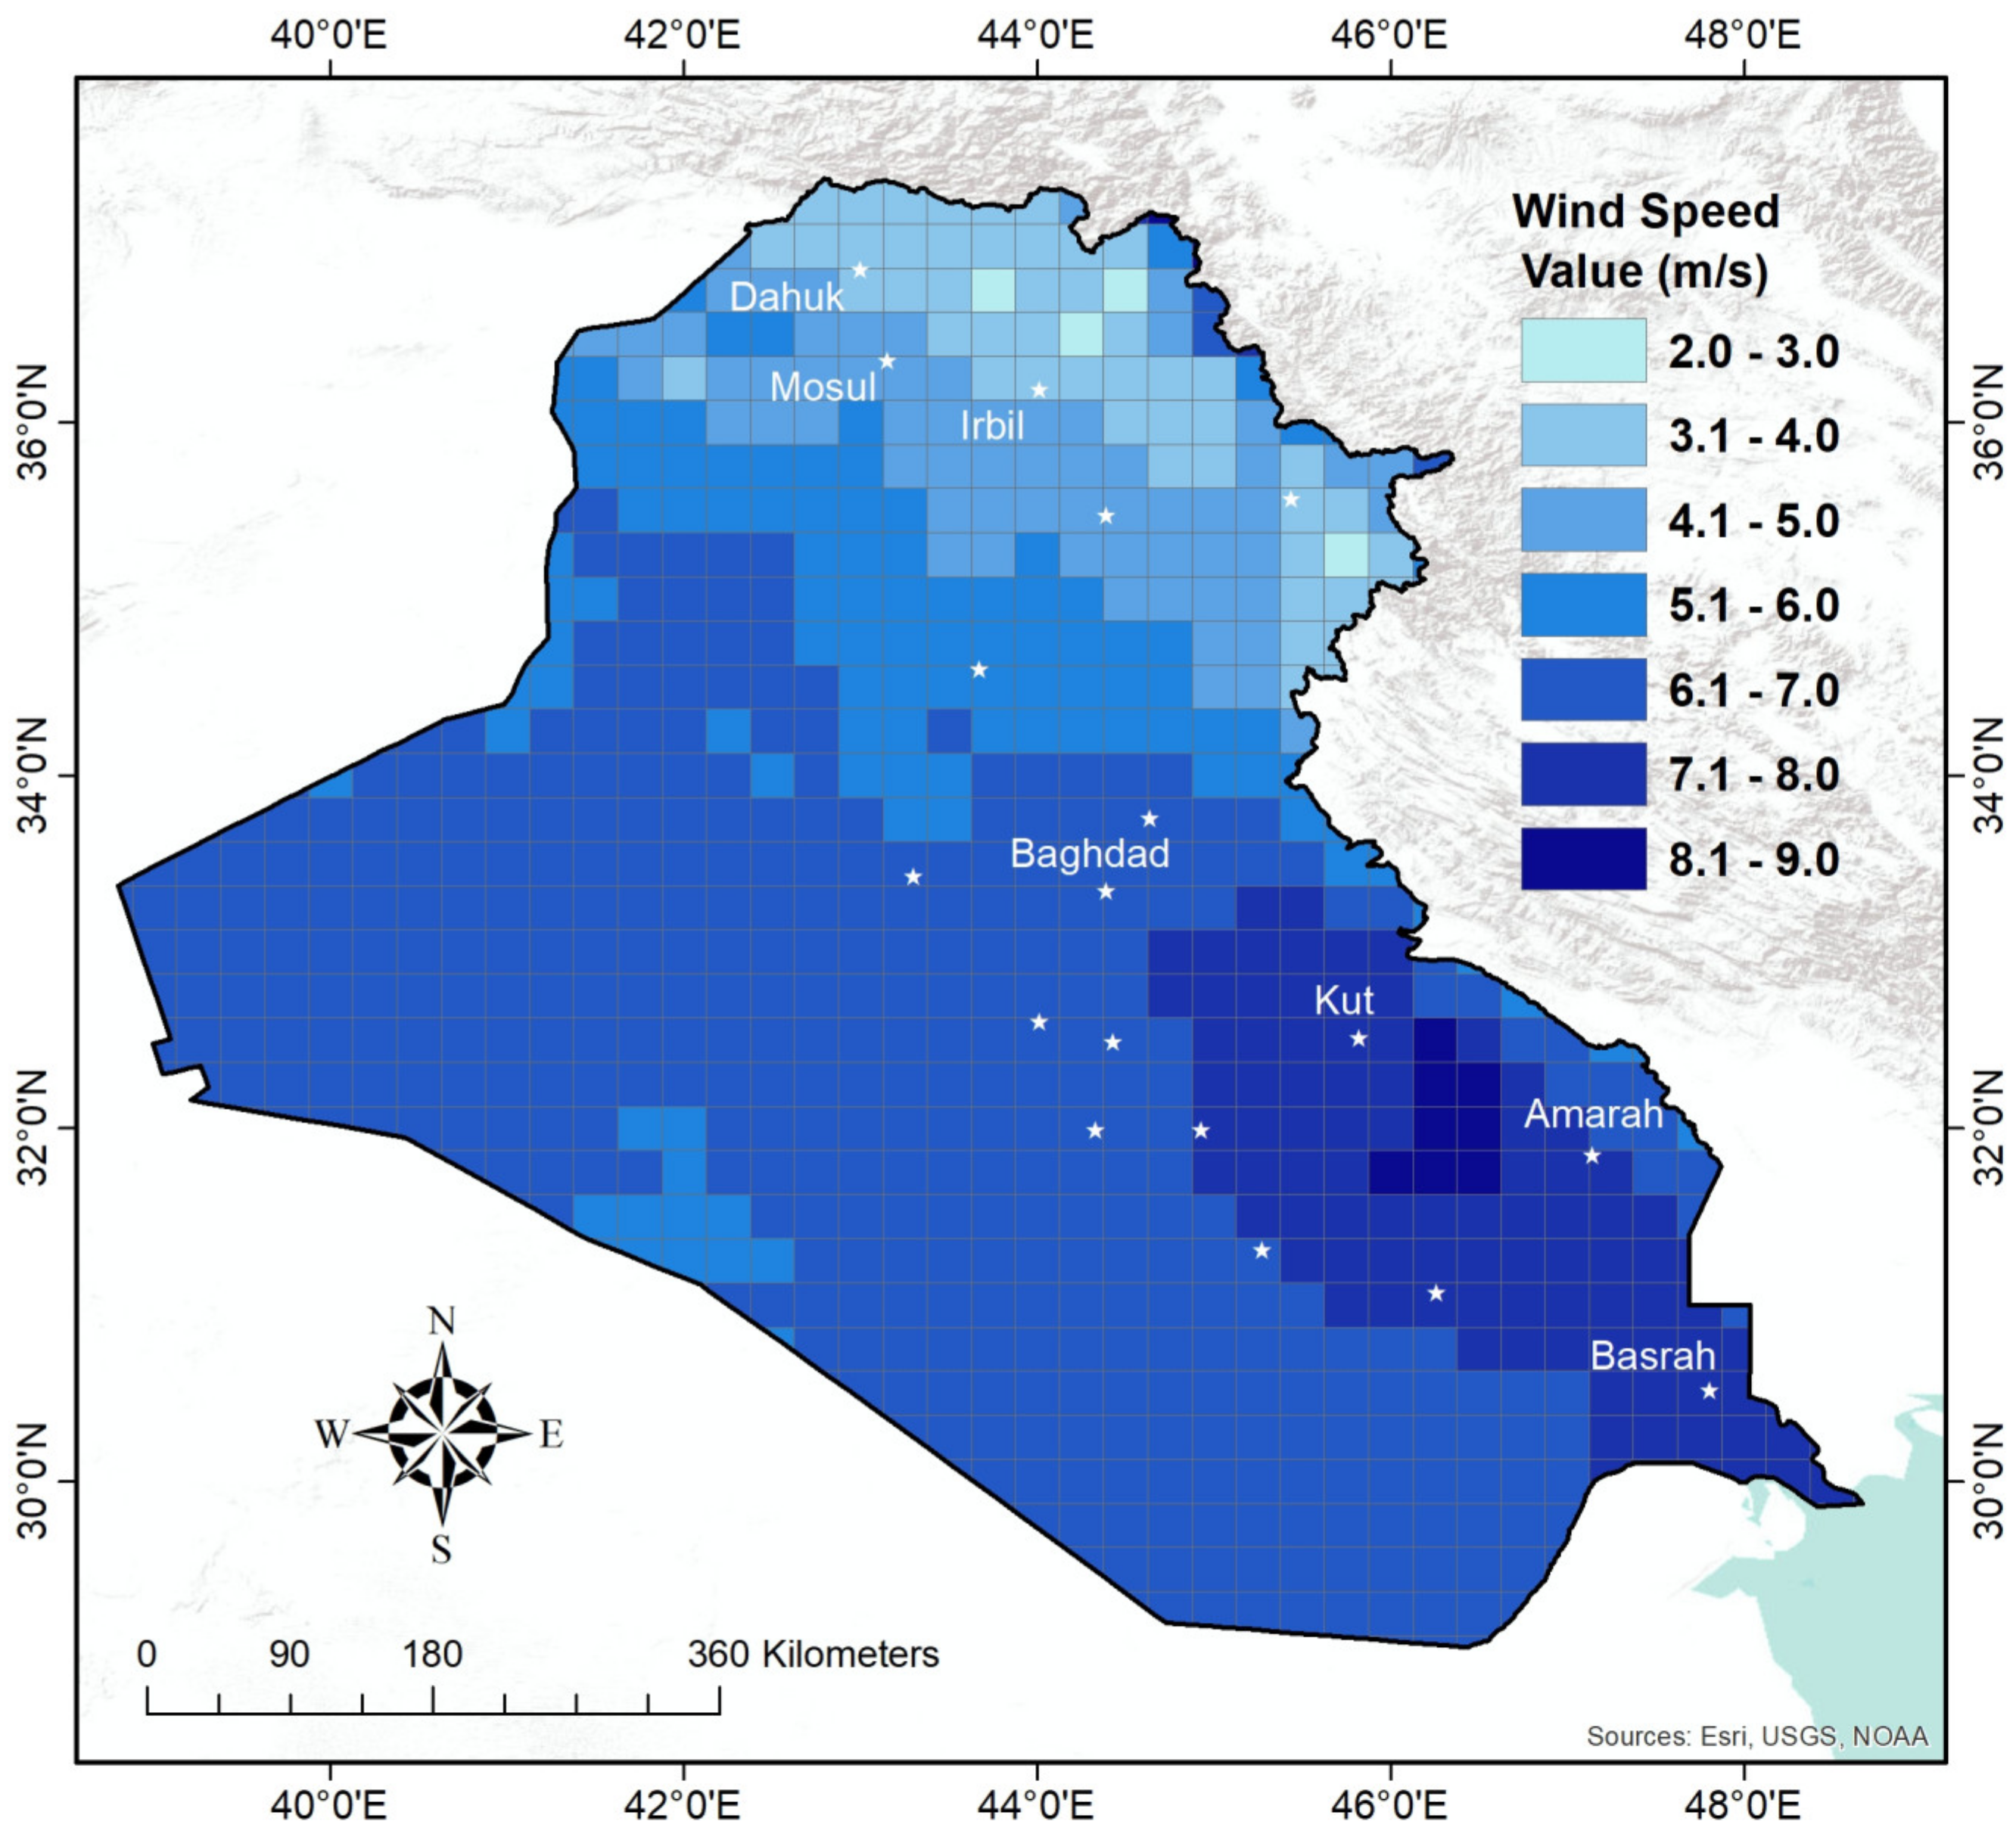
2.3. Wind–Solar Resource Mapping

Wind and solar resource mapping is an effective tool for developing large-scale RE projects [41]. Such maps highlight sites with abundant wind and solar resource potential, encouraging the exploration of their resource complementarity. In this work, wind and solar resource maps are developed at each grid cell on the basis of five years’ reanalysis data from MERRA-2. The average extrapolated wind speed dataset at a hub height of 100 m is utilized to model the wind resource map. The annual average GHI in kWh/m2/year is calculated to produce the solar resource map. GIS is used as a valuable tool for visualizing and mapping the potential of RE resources.

2.4. Wind–Solar Resources Complementarity Assessment

The timescale and type of complementarity index play a vital role in evaluating the temporal complementarity of RE resources. The following subsections discuss the timescale and the complementarity index in detail.

2.4.1. Timescale

Different timescales are usually applied in complementarity computations. Hourly and daily scales are the most commonly used for short-term planning, while monthly and annual timescales are applied for long-term planning [3]. However, considering the hourly dataset to explore the correlation between wind and solar resources leads to biased results. The correlation coefficients used for this purpose, such as Pearson’s coefficient, require the availability of the same amount of data for both variables [5]. Clearly, solar irradiation data can be captured during daylight hours only, unlike wind speeds that can be recorded around the clock. In this case, the correlation is explored when both resources are available (daytime hours), and the rest of the hours (night hours) are ignored.
Therefore, the daily timescale is considered in this work as the smallest fair scale for examining the correlation between wind and solar resources. On the daily timescale, the data of solar and wind resources are shown as the sum of the incoming solar radiation during daylight hours and the average wind speed in 24 h, respectively. Moreover, the daily dataset is used to assess the correlation for each month of the year instead of the correlation over the entire time domain. This approach highlights the months with the best complementarity opportunities and thus improves energy planning in countries experiencing variations in resources and demand during the year, such as Iraq.

2.4.2. Complementarity Index

In most cases, wind and solar energies are in temporal complementarity when the time-series profiles of their resources are opposite. Otherwise, wind energy coincides with solar energy [2]. Their complementarity can therefore be assessed by evaluating the similarity between wind and solar time-series datasets. Time series among several renewable resources are evaluated through the use of correlation coefficients, such as Pearson’s correlation coefficient (PCC), Spearman’s correlation coefficient, and Kendall’s correlation coefficient [5]. In this work, PCC is applied to assess the degree of complementarity between wind and solar energies as it is a widely acceptable complementarity index [3,11,12,42,43,44,45,46,47,48,49].
PCC r WS is calculated as follows [5]:
r WS = i = 1 n W i   W ¯ × S i   S ¯ i = 1 n W i   W ¯ 2 × i = 1 n S i   S ¯ 2 ,
where n is the dataset size; W i and S i are the individual values of the wind and solar resources variables, respectively; and   W ¯ and   S ¯ are their averages, respectively. The PCC complementarity index ranges from −1 to 1. Negative values indicate the complementarity of wind and solar energy fluxes, while positive values signify synchronization in the studied resources. A value of 0 denotes the absence of correlation between the variables [6]. The complementarity index values are explained in Table 2.

3. Results and Discussion

This section first presents a map of the WSC based on land cover data and their validation results. Subsequently, the wind–solar energy potentials are mapped, highlighting regions with high and low resources. Then, the temporal complementarity of the renewable resources is investigated on a daily timescale for each month of the year, and its spatial distribution is presented. Finally, areas of effective complementarity based on wind and solar resource thresholds are explored.

3.1. WSC Map

A country-level WSC map is developed utilizing remote sensing data, which does not require any field observations or prior knowledge of the study area. The resulting WSC map of Iraq is presented in Figure 5. Although the map involves four different values of WSC, 74% of the study area has the value 0.25, followed by the value of 0.20 at 19%, which is harvested by the areas of Central Iraq. Values 0.1 and 0.4 are concentrated in the southern and central regions at respective percentages of 6% and 1%. The presented map clearly indicates the variation of WSC over Iraq, confirming the uncertainty in wind extrapolation calculations caused by generalizing a 1/7 WSC across the wide study areas.
To validate the aforementioned WSC map values, comparative analysis is performed as discussed in Section 2.2.3. The comparison results are illustrated in Figure 6. The results show that consideration of the spatial variations of wind shear parameters has improved the performance of wind velocity extrapolation using the power law. The wind speed extrapolations using WSC values based on land cover yield a mean bias of −0.580 and an RMSE of 0.856. This finding is encouraging compared with the extrapolation based on the constant 1/7 WSC value, which has a mean bias and a RMSE of −1.620 and 1.684, respectively. The developed map is consistent with the results of the WSCs obtained by some researchers for specific points in Iraq [24].

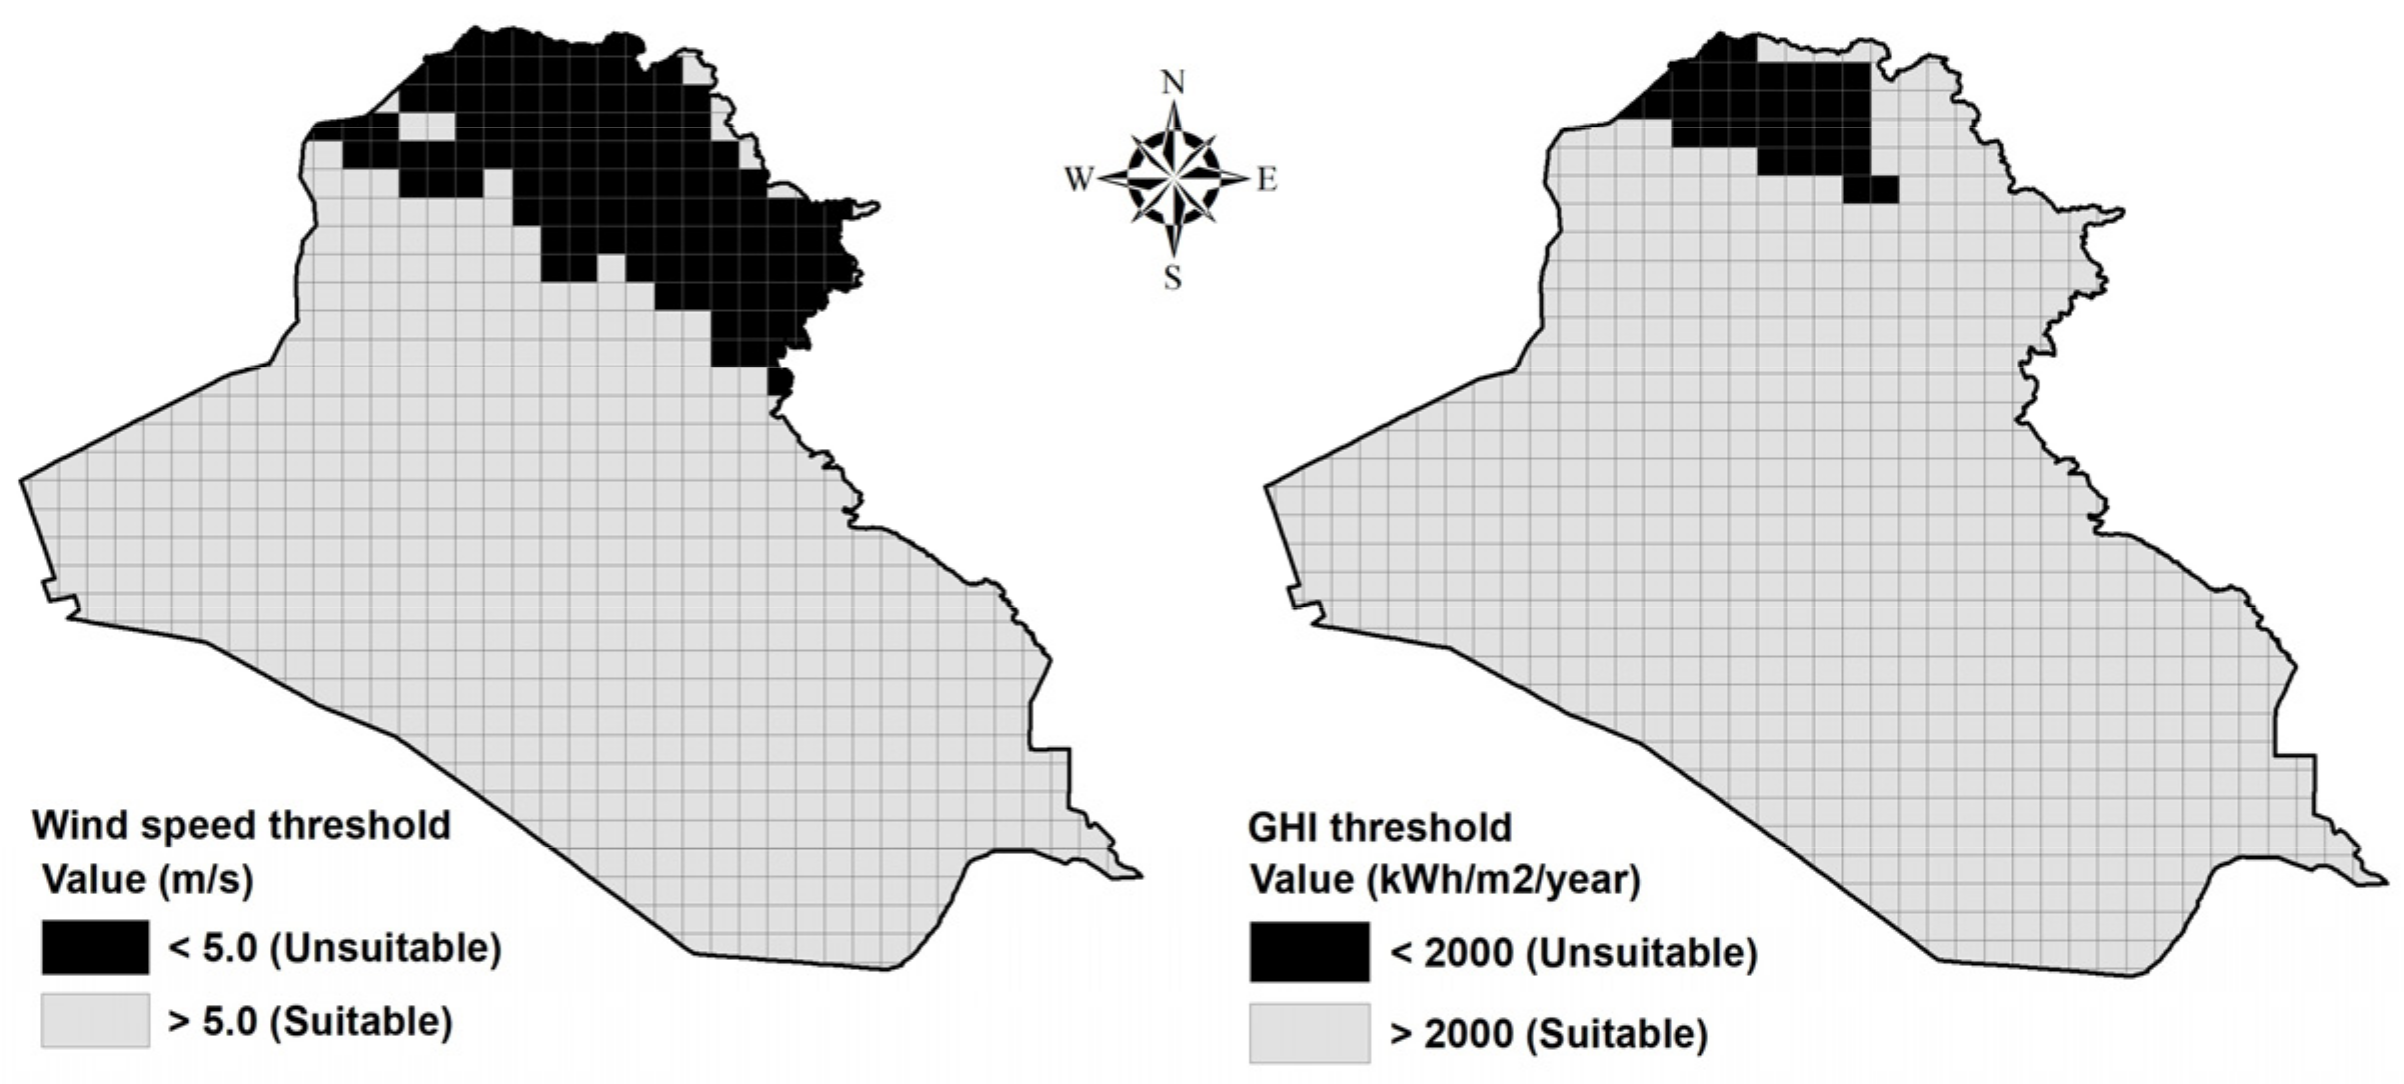
3.2. Potentials of WSR in Iraq

The spatial distribution of wind resource availability over Iraq is computed and presented in Figure 7. The results show that the alluvial plain area in southern Iraq is the best place for wind energy production, with average wind speed values exceeding 7 m/s. The region between the cities of Kut and Amarah has the highest annual average wind potential at 9 m/s. An attractive wind corridor also exists along the western plateau of the country, from west of Basrah to south of Mosul, with average wind speeds of 6.5 m/s. Furthermore, other significant wind speeds are observed in the border highlands northeast of the study area. Wind sources are scarce in northern Iraq, especially in the governorates of Dohuk and Erbil (Iraqi Kurdistan Region), where the wind speed ranges from 2 m/s to 4 m/s. In general, the average wind speed in Iraq at 100 m is estimated at 6 m/s.
Iraq has a tremendous amount of solar energy potential, especially in the southern and western regions, as shown in Figure 8, which depicts the spatial distribution of the annual incoming GHI. The northern zone of Iraq is characterized by the lowest solar energy resources, particularly in Dohuk and Mosul, with an annual GHI of less than 2000 kWh/m2/year. On the contrary, the southwestern strip shows the highest solar energy potential in the country, which exceeds 2200 kWh/m2/year. Promising solar radiation resources are recorded in the sedimentary plain areas of southern Iraq. Overall, the majority of the country is suitable for solar power generation. The presented maps of wind and solar potential are largely consistent with the findings reported by several studies [21,50,51].
The comparison of Figure 7 and Figure 8 shows that the regions with the highest wind and solar energy resources are located in the southern and western regions of Iraq, where the population density is high. Interestingly, the southern parts with a high solar potential show low wind resources and vice versa. This finding indicates the promising complementary nature of the solar and wind energy resources in Southern Iraq.

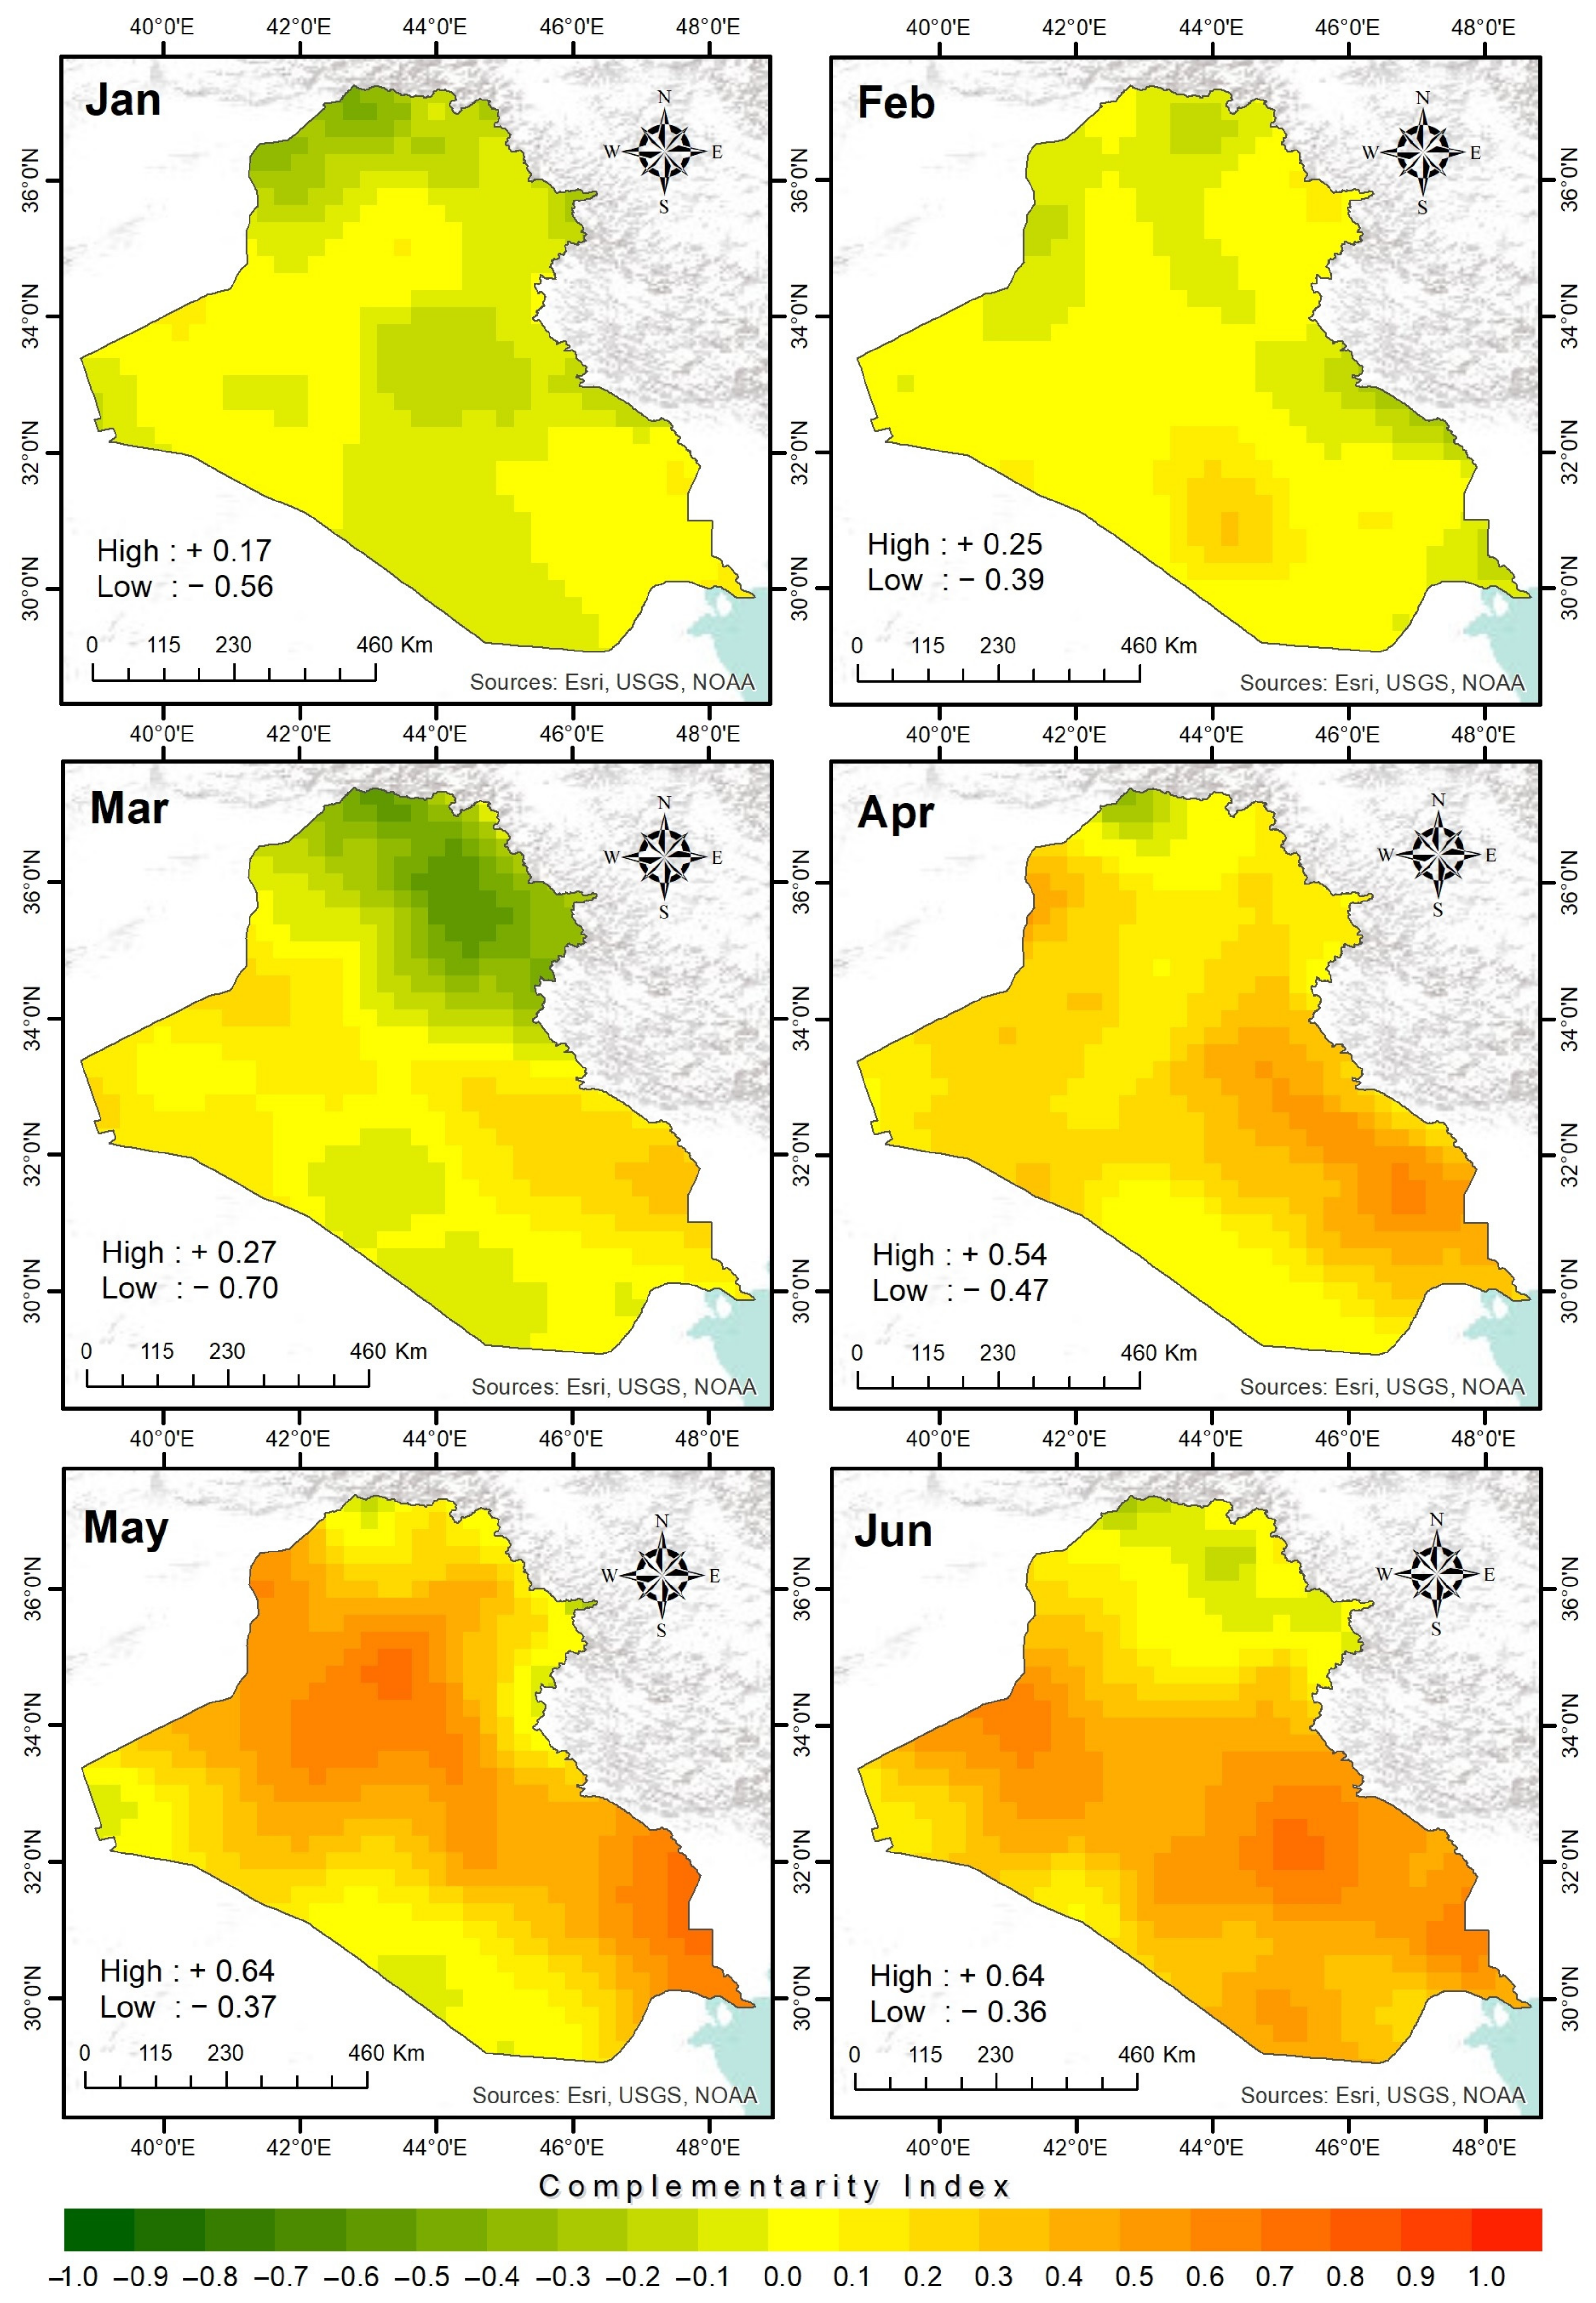
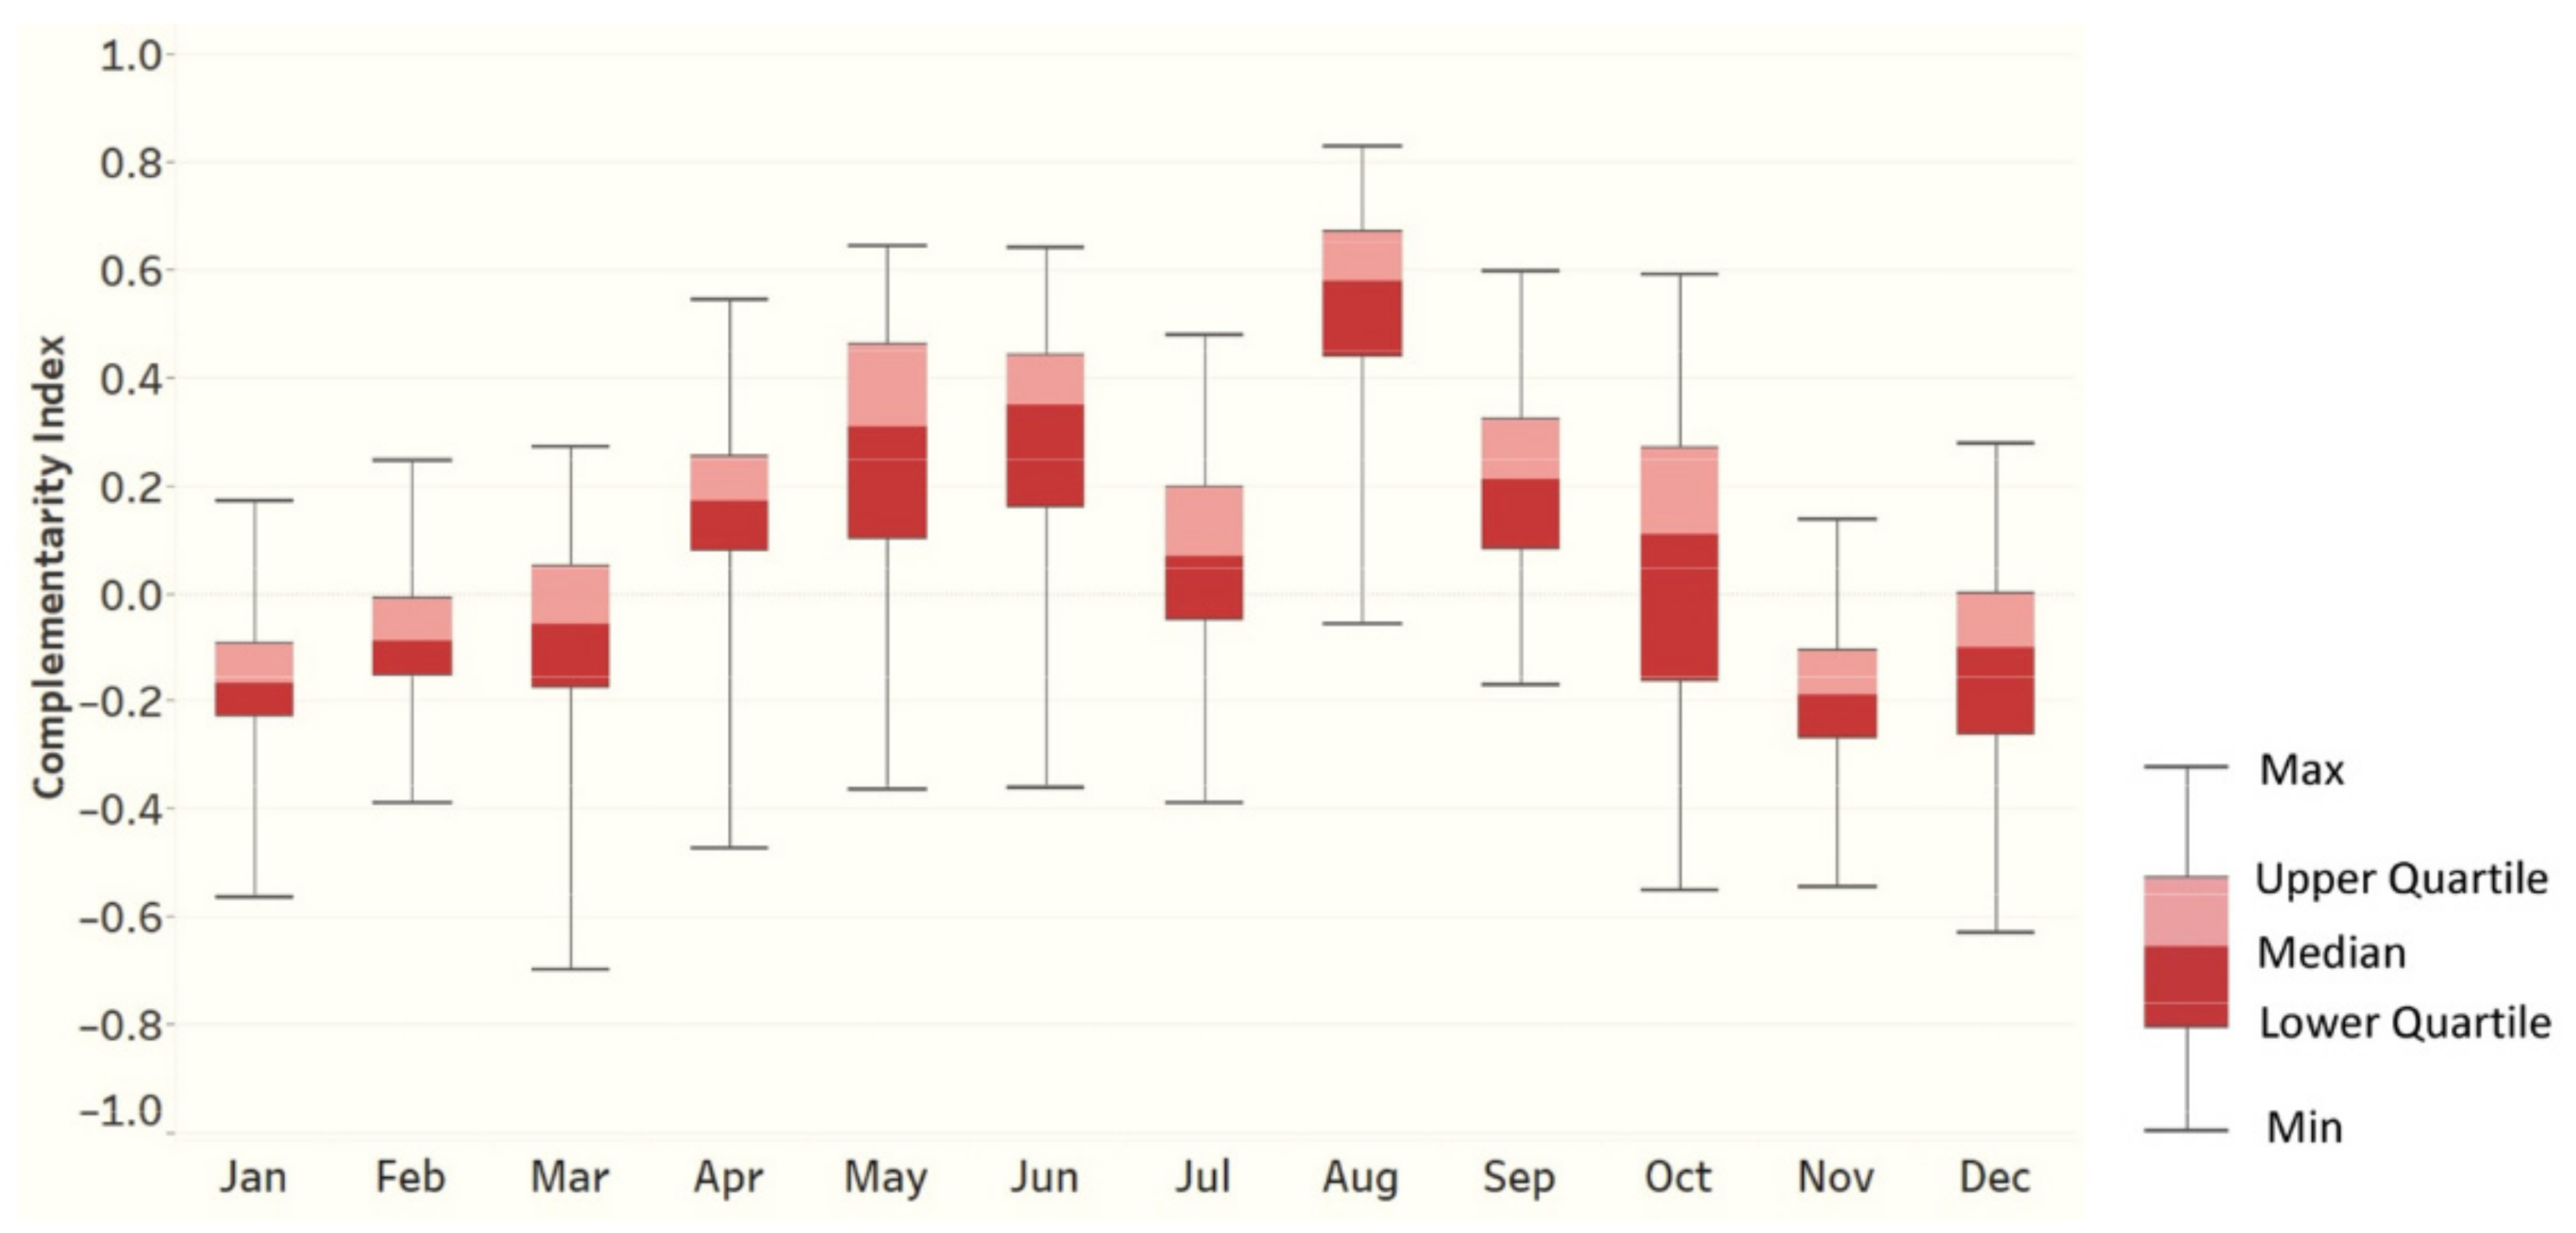
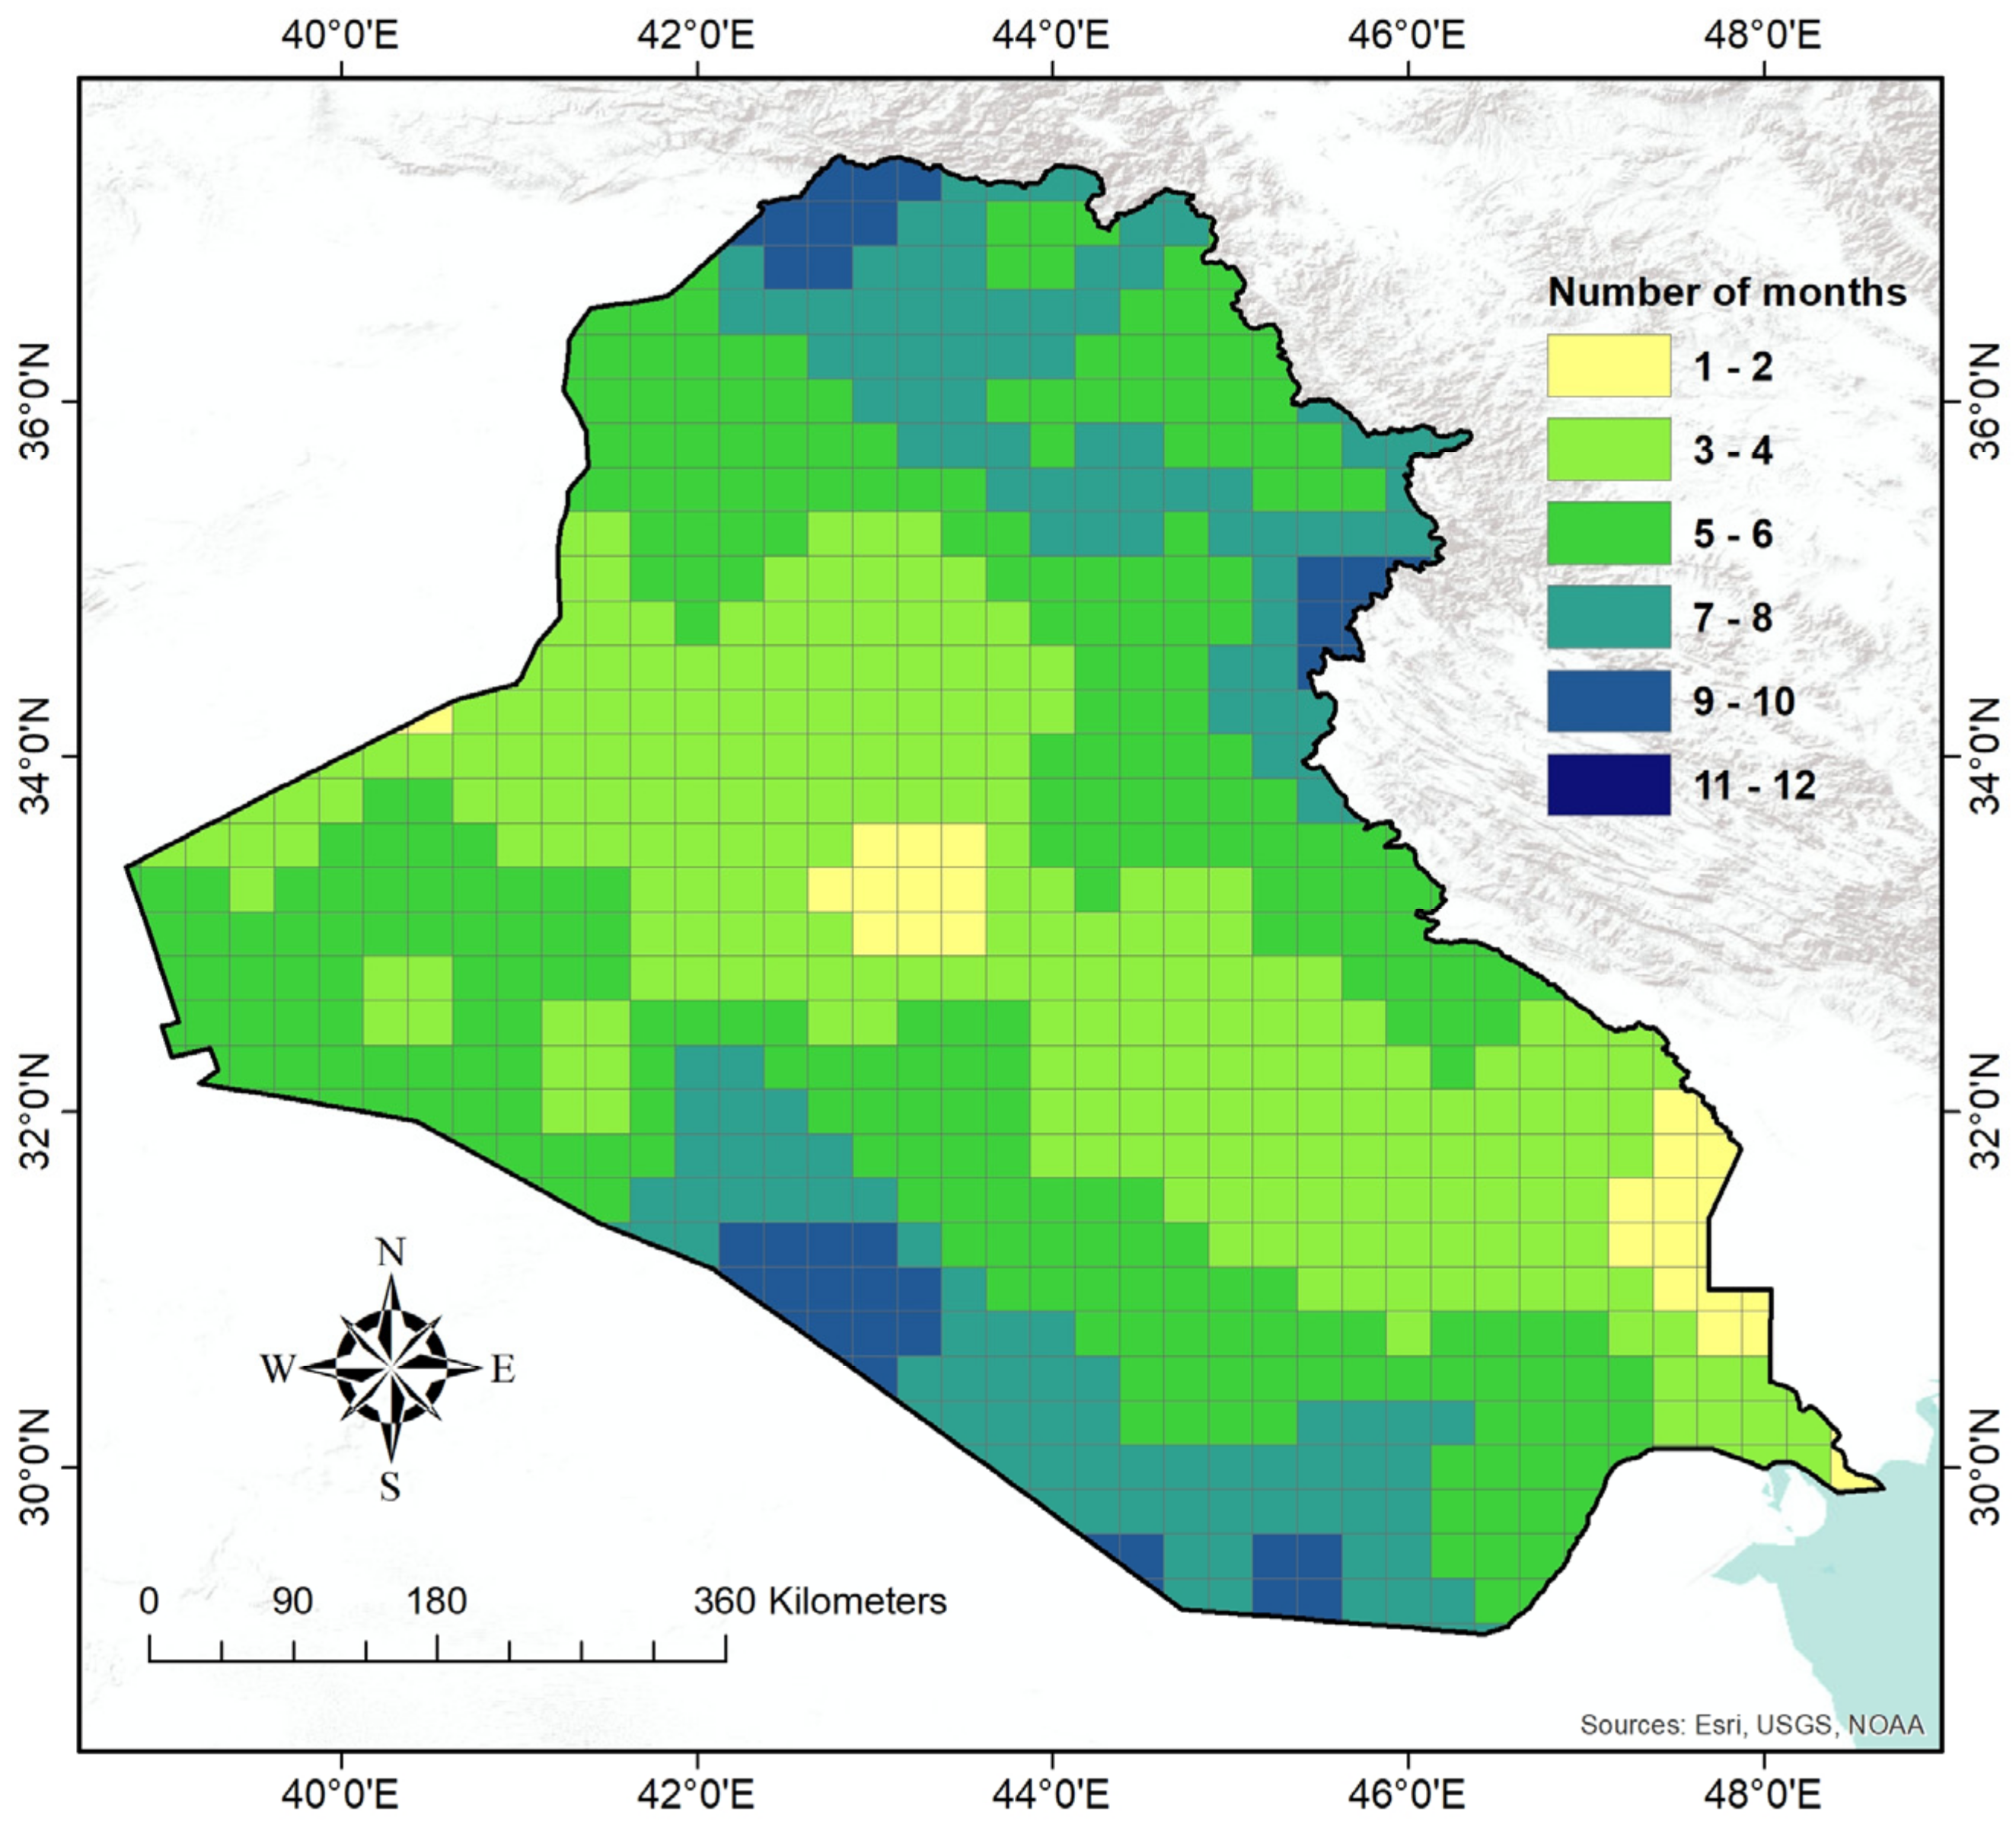
3.3. Monthly Cycle Complementarity on a Daily Timescale

To assess the temporal complementarity of wind and solar resource potentials on monthly cycles, 12 time series of RE data are first generated on a daily timescale for the corresponding months in the five studied years. Then, the PCC is calculated for each time series in 759 grid cells. The results are presented in the form of maps, as shown in Figure 9 and Figure 10, to analyze the spatial distribution of complementarity. These maps show color gradients of green and red; green indicates complementarity and red similarity.
Figure 9 shows the complementarity maps between the wind and solar resources obtained for January, February, March, April, May, and June. The first three months of the year display complementary levels between weak and strong. The complementary potential of renewable resources is concentrated in the northern regions of the country. Moreover, some areas of the center and the western plateau have negative correlation coefficients. In the same period, a weak similarity behavior is recorded in the alluvial plain and the western parts. Significantly, the similarity indices begin to rise in these areas during the months of April, May, and June because of the similar patterns of solar and wind energy resources in these months. Meanwhile, a few parts of the northern and southwestern regions maintain levels of complementarity between weak and moderate. Therefore, these areas are suitable for the installation of hybrid power systems.
Figure 10 presents the complementary maps of RE resources from July to December. The red color is prevalent in the maps of July, August, and September because of the dominance of the positive PCCs over Iraq, especially in the alluvial and western lands. This result reflects the synchronous pattern between wind speed and solar radiation during this period. The last three months (October, November, and December) exhibit the same behavior as the first three months of the year. That is, the complementary levels between the wind and solar resources can be clearly observed in the northern, northeastern, southern, and southwestern regions of the country. This phenomenon can be attributed to the opposite pattern of resources during these months in which the frequency of wind-filled rainstorms increases while the sunshine hours decrease.
Statistically, to test the significance of the correlation coefficient indices based on the monthly complementarity maps, a p-value test is performed at the 5% significance level [52]. The test results for the low values of the negative correlation (complementarity behavior) are shown in Table 3. The correlation coefficients were significant (<0.05) in all months of the year except January, August, and September which had an extreme similarity pattern between wind and solar resources.
For further visualization, the complementarity values obtained for each month are presented in Figure 11. The lowest correlation is achieved in March, with a value of −0.7, and August has the highest correlation of 0.83. Negative Pearson coefficients indicate a low correlation between wind and solar resources (complementary behavior), while positive coefficients indicate a high correlation (synchronous behavior). Overall, the trend of Pearson coefficients between January and December moves from negative values to positive and then back below zero. Unfortunately, this pattern is consistent with the monthly energy demand in Iraq [53]. However, most months display complementarity values between 0 and −0.4. Although the levels of complementarity range between weak and moderate throughout the year, significant areas of the country are covered. The percentages of the total area of the country for different levels of complementarity during the 12 months are summarized in Table 4. January, February, and November yield the highest total areas of complementarity with 94, 81 and 94%, respectively. Meanwhile, noticeable areas with moderate and strong levels of complementarity are observed in March (15% moderate, 4% strong) and December (19% moderate, 2% strong). August is the worst month, with only 2% of the country’s area exhibiting a weak level of complementarity. This month could be crucial when designing hybrid wind and solar farms.
The presented results indicate no ideal complementary behavior between renewable resources across the Iraqi territory so that wind energy can compensate for the entire decline of solar energy or the inverse. This consequence is harmonious and confirms in more detail with the findings of the global complementary map developed by [18]. Thus, storage systems must be utilized in wind–solar plants in Iraq to compensate for generation fluctuations and ensure a continuous power supply. However, the weak and moderate levels of complementarity observed in this case study can reduce but not eliminate the reliance on storage systems. To this end, hybrid energy plants should be installed at sites that present the longest period of resource complementarity during the year. To explore these sites, Figure 12 displays a map showing the number of months that exhibit synergistic behavior among the wind and solar resources. The northeastern and southwestern regions of Iraq have a complementary pattern that extends between 7–10 months and are thus more qualified for hybrid power system installation than the other areas.

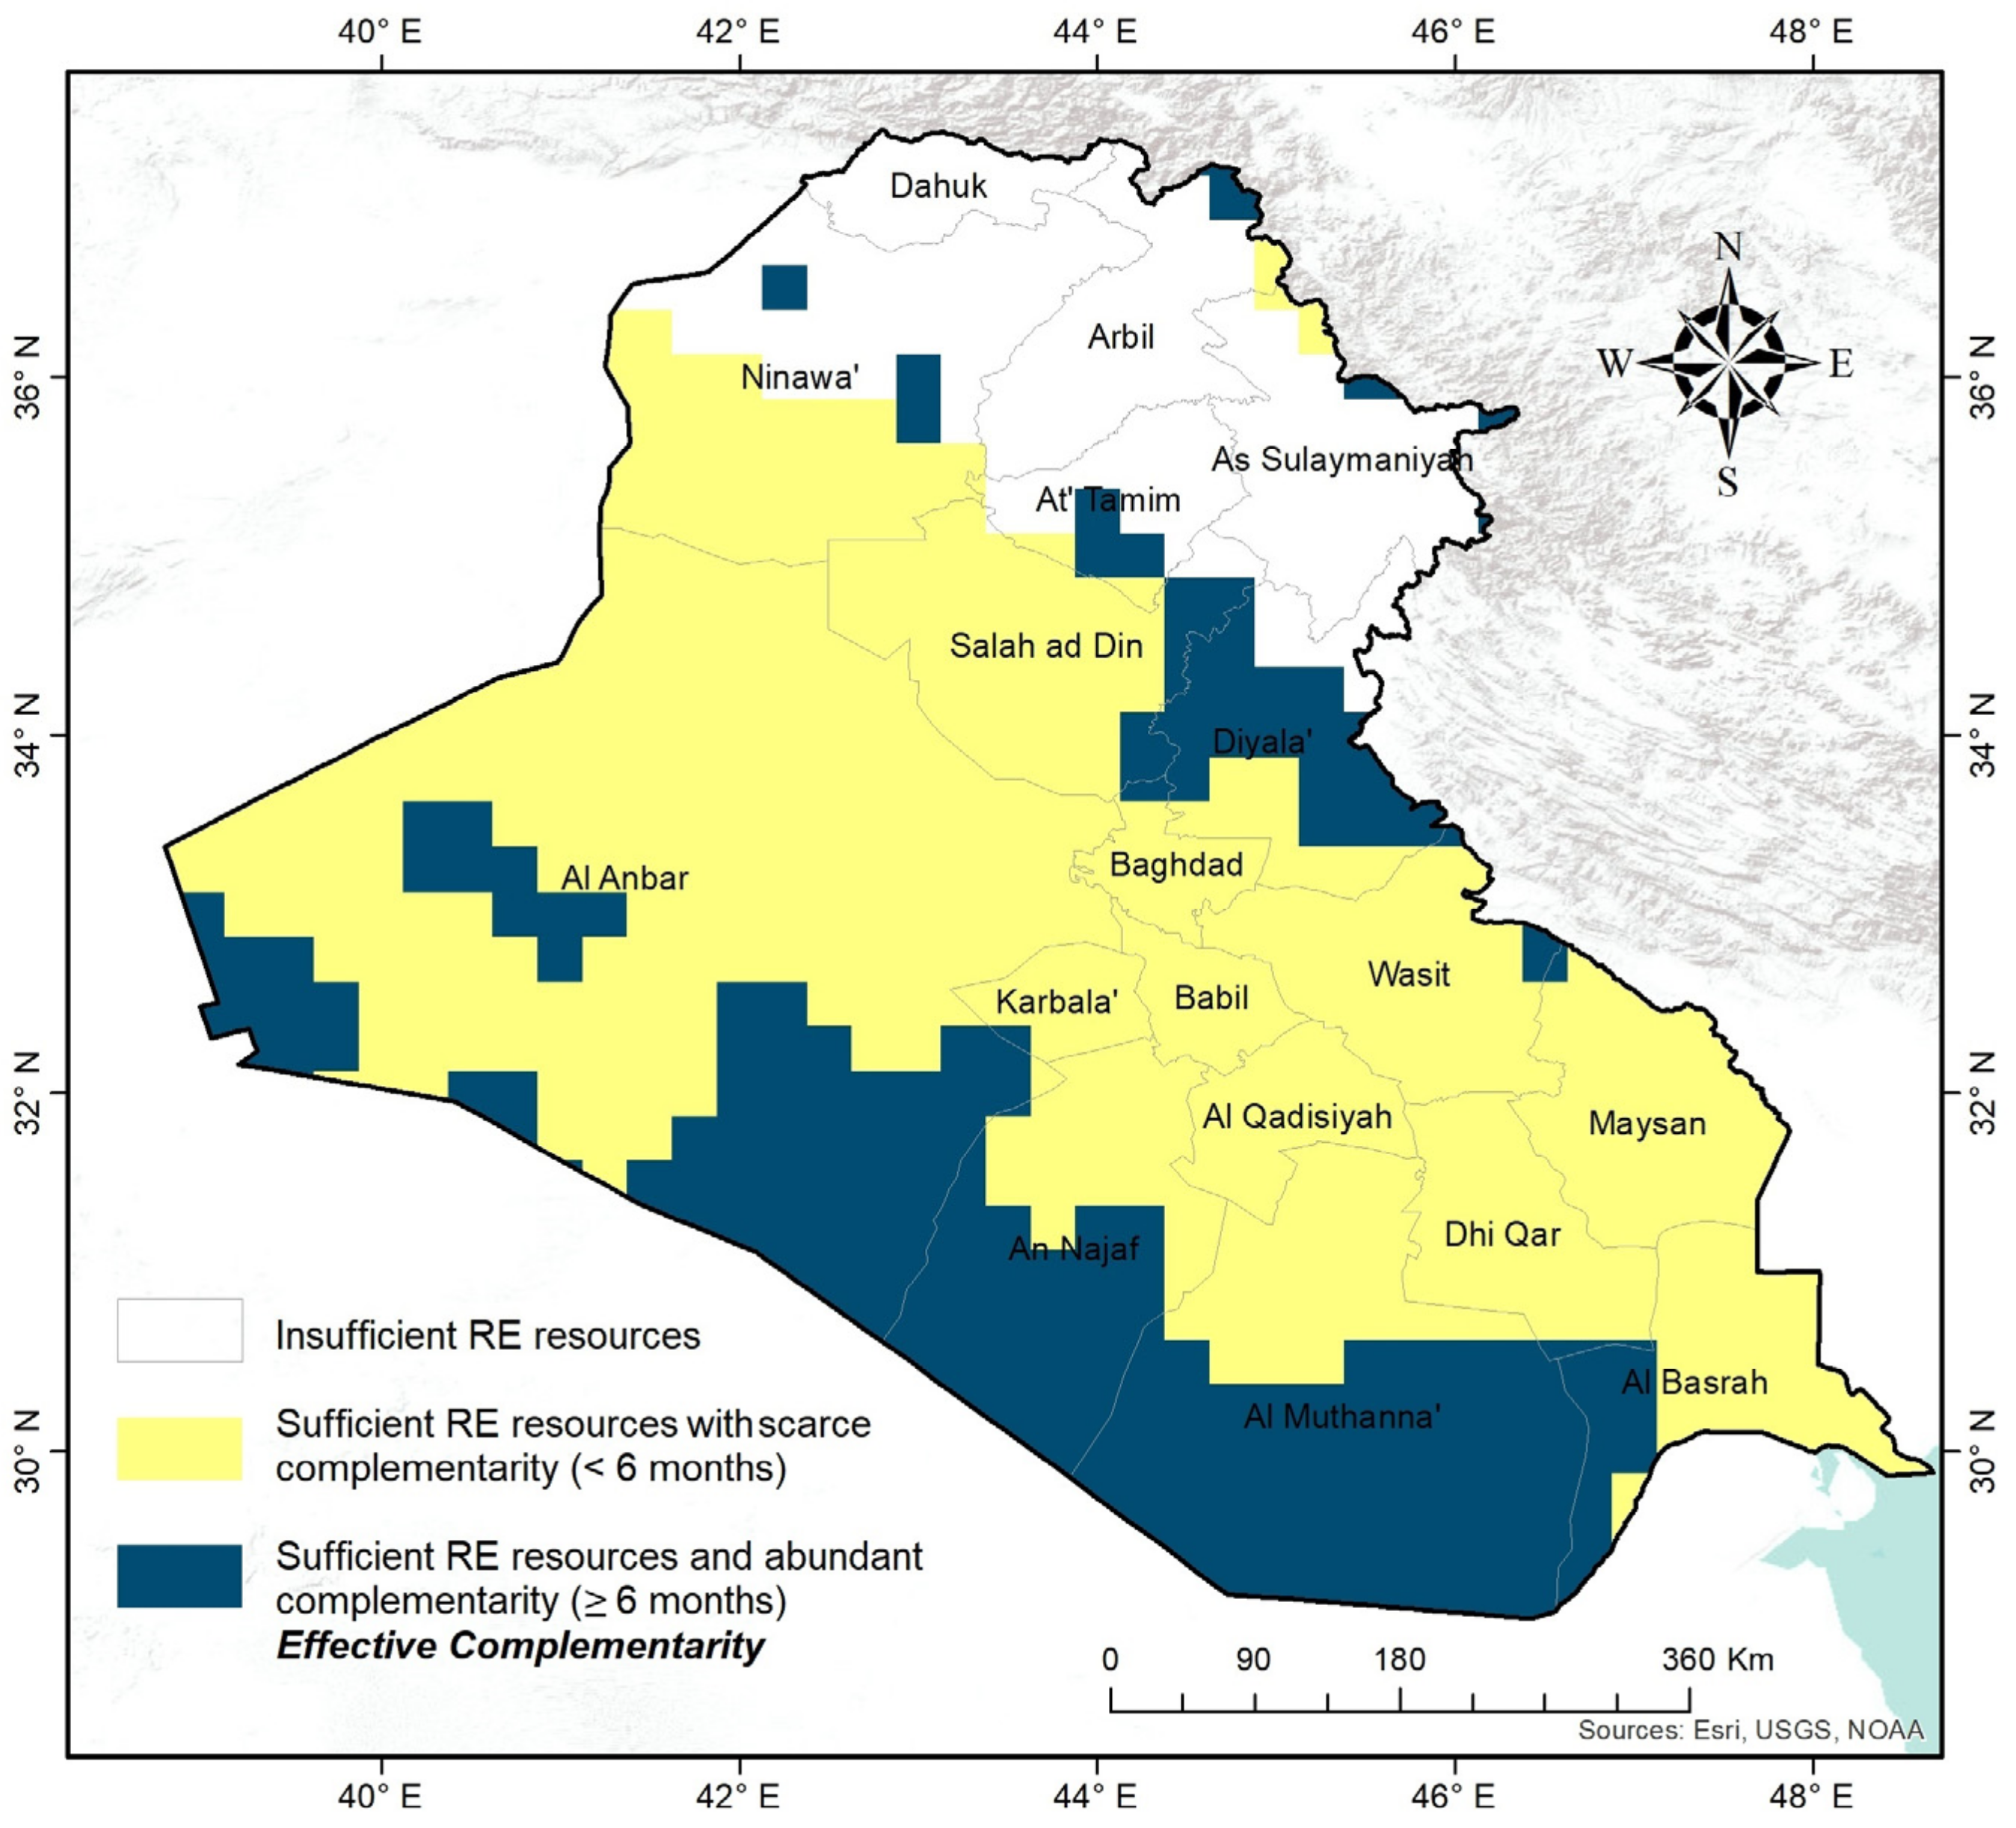
3.4. Effective Complementarity

Obviously, the synergistic behavior between wind and solar energy resources contributes to the stability of electricity supply around the clock. However, for effective complementarity, the wind speed and the solar irradiation should be sufficiently abundant, exceeding the recommended thresholds. Therefore, in this case study, the spatial distribution of effective complementarity in which the renewable resources are promising is investigated, and the synergistic behavior extends over the longest period of the year. A wind speed of less than 5 m/s at the hub height is adopted as the recommended threshold for restricting wind turbine installation [54,55], while solar radiation values greater than 2000 kWh/m2/year are accepted for solar panel deployment [56]. Figure 13 shows the spatial impact of the considered renewable resource thresholds. Many regions of Northern Iraq suffer from scarcity of wind and solar resources.
Using Boolean logic, regions with unsuitable resources are excluded from the complementarity results previously obtained. The areas with effective complementarity exceeding the considered thresholds are presented in Figure 14. The grid cells where the resource complementarity spans more than six months of the year are highlighted in dark blue. The places with the best potential for the combined use of solar and wind energy systems are in southwestern Iraq at Al-Muthanna, An-Najaf, and Al-Anbar and some parts of eastern Iraq at the Diyala, Salah al-Din, and At-Tamim governorates. Meanwhile, the alluvial plain and northwest of the country exhibit few periods of complementarity during the year despite the abundance of renewable resources and thus are considered less favorable for the installation of hybrid farms.

4. Conclusions

This work aims to assess the temporal complementarity between the solar and wind energy resources in Iraq to highlight promising areas for future installations of hybrid power systems. On one hand, the results reveal and confirm that the adoption of land-cover-derived WSCs reduces the bias in wind speed extrapolation by 64%, increasing the accuracy and reliability of complementarity calculations. On the other hand, the created maps of solar and wind potentials reveal a huge potential of photovoltaic energy over Iraq, especially in the southern and western regions, which exceeds 2200 kWh/m2/year. Furthermore, the alluvial plain in the south of the country exhibits the best potential for wind energy production with average wind speed values of 7 m/s. Despite these promising potentials, no perfect temporal complementarity has been found between the two renewable resources that would completely eliminate generation fluctuations. The complementarity indices recorded over the months range from −0.06 to −0.56 (weak to moderate), except in March and December when the correlation index is strong, exceeding −0.6. However, the weak and moderate synergistic properties resulting from this study could mitigate the reliance on storage systems, especially as they cover important regions of the country. In general, the effective temporal complementarity between solar and wind resources is higher in southwestern Iraq at Al-Muthanna, An-Najaf, and Al-Anbar and some parts of eastern Iraq at the Diyala, Salah al-Din, and At-Tamim governorates. Thus, these places are considered candidate sites for the installation of wind–solar hybrid farms.
This paper demonstrates that prospecting for complementarity information among the sustainable power sources under consideration is crucial in energy systems planning. The announced synergy maps assist energy planners and stakeholders in capturing suitable investment sites for wind-solar hybrid systems. Sites with dual renewable potential contribute significantly to increasing energy supply and reducing construction costs. However, the complementarity patterns revealed in this work could not overcome the fluctuations of the wind–solar system alone. Thus, the use of storage systems is inevitable in Iraq’s future wind–solar plants for a highly stable energy supply.
Although this study focuses on Iraq, the current approach could be adapted to assess the complementarity characteristics between solar and wind energy resources in other countries around the world. Additionally, the reported complementarity results could be utilized as a critical technical criterion in solving multi-criteria decision-making problems for siting wind–solar stations, which is what the authors intend to accomplish in future work.

Supplementary Materials

The following are available online at https://www.mdpi.com/article/10.3390/su14010388/s1, Figure S1: WSC map generation model in ArcGIS Model Builder.

Author Contributions

Conceptualization, M.S.S., H.Z.M.S., A.F.A. and A.S.M.R.; Formal analysis, M.S.S., A.F.A. and A.S.M.R.; Methodology, M.S.S. and H.Z.M.S.; Software, M.S.S.; Writing—original draft, M.S.S.; Writing—review & editing, H.Z.M.S., A.F.A. and A.S.M.R. All authors have read and agreed to the published version of the manuscript.

Funding

This research received no external funding.

Institutional Review Board Statement

Not applicable.

Informed Consent Statement

Not applicable.

Data Availability Statement

Publicly available datasets were analyzed in this study. This data can be found at ref. [25].

Acknowledgments

The authors acknowledge the facilities and support provided by Universiti Putra Malaysia (UPM). We wish to thank the Renewable Energy Directorate, Ministry of Science and Technology, Iraq for providing the GEOSUN map. The anonymous reviewers’ comments in refining this manuscript are also greatly appreciated.

Conflicts of Interest

The authors declare no conflict of interest.

References

  1. Schindler, D.; Behr, H.D.; Jung, C. On the spatiotemporal variability and potential of complementarity of wind and solar resources. Energy Convers. Manag. 2020, 218, 113016. [Google Scholar] [CrossRef]
  2. Ren, G.; Wan, J.; Liu, J.; Yu, D. Spatial and temporal assessments of complementarity for renewable energy resources in China. Energy 2019, 177, 262–275. [Google Scholar] [CrossRef]
  3. Henao, F.; Viteri, J.P.; Rodríguez, Y.; Gómez, J.; Dyner, I. Annual and interannual complementarities of renewable energy sources in Colombia. Renew. Sustain. Energy Rev. 2020, 134, 110318. [Google Scholar] [CrossRef]
  4. Yan, J.; Qu, T.; Han, S.; Liu, Y.; Lei, X.; Wang, H. Reviews on characteristic of renewables: Evaluating the variability and complementarity. Int. Trans. Electr. Energy Syst. 2020, 30, e12281. [Google Scholar] [CrossRef]
  5. Gallardo, R.P.; Ríos, A.M.; Ramírez, J.S. Analysis of the solar and wind energetic complementarity in Mexico. J. Clean. Prod. 2020, 268, 122323. [Google Scholar] [CrossRef]
  6. Jurasz, J.; Canales, F.A.; Kies, A.; Guezgouz, M.; Beluco, A. A review on the complementarity of renewable energy sources: Concept, metrics, application and future research directions. Sol. Energy 2020, 195, 703–724. [Google Scholar] [CrossRef]
  7. Xu, L.; Wang, Z.; Liu, Y. The spatial and temporal variation features of wind-sun complementarity in China. Energy Convers. Manag. 2017, 154, 138–148. [Google Scholar] [CrossRef]
  8. Zhang, H.; Cao, Y.; Zhang, Y.; Terzija, V. Quantitative synergy assessment of regional wind-solar energy resources based on MERRA reanalysis data. Appl. Energy 2018, 216, 172–182. [Google Scholar] [CrossRef]
  9. Solomon, A.A.; Kammen, D.M.; Callaway, D. Investigating the impact of wind-solar complementarities on energy storage requirement and the corresponding supply reliability criteria. Appl. Energy 2016, 168, 130–145. [Google Scholar] [CrossRef] [Green Version]
  10. Mohammadi, K.; Goudarzi, N. Study of inter-correlations of solar radiation, wind speed and precipitation under the influence of El Niño Southern Oscillation (ENSO) in California. Renew. Energy 2018, 120, 190–200. [Google Scholar] [CrossRef]
  11. Gallardo, R.P.; Castro, A.O.; Ríos, A.M. An image processing-based method to assess the monthly energetic complementarity of solar and wind energy in Colombia. Energies 2020, 13, 1033. [Google Scholar] [CrossRef] [Green Version]
  12. Prasad, A.A.; Taylor, R.A.; Kay, M. Assessment of solar and wind resource synergy in Australia. Appl. Energy 2017, 190, 354–367. [Google Scholar] [CrossRef]
  13. D’Isidoro, M.; Briganti, G.; Vitali, L.; Righini, G.; Adani, M.; Guarnieri, G.; Moretti, L.; Raliselo, M.; Mahahabisa, M.; Ciancarella, L.; et al. Estimation of solar and wind energy resources over Lesotho and their complementarity by means of WRF yearly simulation at high resolution. Renew. Energy 2020, 158, 114–129. [Google Scholar] [CrossRef]
  14. Guezgouz, M.; Jurasz, J.; Chouai, M.; Bloomfield, H.; Bekkouche, B. Assessment of solar and wind energy complementarity in Algeria. Energy Convers. Manag. 2021, 238, 114170. [Google Scholar] [CrossRef]
  15. Jurasz, J.; Mikulik, J.; Dąbek, P.B.; Guezgouz, M.; Kaźmierczak, B. Complementarity and ‘resource droughts’ of solar and wind energy in poland: An era5-based analysis. Energies 2021, 14, 1118. [Google Scholar] [CrossRef]
  16. Berger, M.; Radu, D.; Fonteneau, R.; Henry, R.; Glavic, M.; Fettweis, X.; Le Du, M.; Panciatici, P.; Balea, L.; Ernst, D. Critical time windows for renewable resource complementarity assessment. Energy 2020, 198, 117308. [Google Scholar] [CrossRef] [Green Version]
  17. Weschenfelder, F.; de Novaes Pires Leite, G.; Araújo da Costa, A.C.; de Castro Vilela, O.; Ribeiro, C.M.; Villa Ochoa, A.A.; Araújo, A.M. A review on the complementarity between grid-connected solar and wind power systems. J. Clean. Prod. 2020, 257, 120617. [Google Scholar] [CrossRef]
  18. Kapica, J.; Canales, F.A.; Jurasz, J. Global atlas of solar and wind resources temporal complementarity. Energy Convers. Manag. 2021, 246, 114692. [Google Scholar] [CrossRef]
  19. Li, J.; Wang, X.; Yu, X.B. Use of spatio-temporal calibrated wind shear model to improve accuracy of wind resource assessment. Appl. Energy 2018, 213, 469–485. [Google Scholar] [CrossRef]
  20. Chaichan, M.T.; Kazem, H.A. Generating Electricity Using Photovoltaic Solar Plants in Iraq; Springer International Publishing AG: Cham, Switzerland, 2018; ISBN 9783319750316. [Google Scholar]
  21. Al-Kayiem, H.H.; Mohammad, S.T. Potential of renewable energy resources with an emphasis on solar power in Iraq: An outlook. Resources 2019, 8, 42. [Google Scholar] [CrossRef] [Green Version]
  22. Saeed, I.M.; Ramli, A.T.; Saleh, M.A. Assessment of sustainability in energy of Iraq, and achievable opportunities in the long run. Renew. Sustain. Energy Rev. 2016, 58, 1207–1215. [Google Scholar] [CrossRef]
  23. Istepanian, H. Solar Energy in Iraq: From Outset to Offset; Iraq Energy Institute: Baghdad, Iraq, 2018. [Google Scholar]
  24. Resen, A.K.; Khamees, A.B.; Yaseen, S.F. Determination of Wind Shear Coefficients and Conditions of Atmospheric Stability for Three Iraqi Sites. In Proceedings of the IOP Conference Series: Materials Science and Engineering, Baghdad, Iraq, 15 April 2020. [Google Scholar]
  25. NASA Goddard Earth Sciences Data and Information Services Center (GES DISC). Available online: https://disc.gsfc.nasa.gov/ (accessed on 28 June 2021).
  26. Gueymard, C.A.; Yang, D. Worldwide validation of CAMS and MERRA-2 reanalysis aerosol optical depth products using 15 years of AERONET observations. Atmos. Environ. 2020, 225, 117216. [Google Scholar] [CrossRef]
  27. Rabbani, R.; Zeeshan, M. Exploring the suitability of MERRA-2 reanalysis data for wind energy estimation, analysis of wind characteristics and energy potential assessment for selected sites in Pakistan. Renew. Energy 2020, 154, 1240–1251. [Google Scholar] [CrossRef]
  28. Richardson, D.B.; Andrews, R.W. Validation of the MERRA dataset for solar PV applications. In Proceedings of the 2014 IEEE 40th Photovoltaic Specialist Conference, PVSC 2014, Denver, CO, USA, 8–13 June 2014. [Google Scholar]
  29. Monforti, F.; Huld, T.; Bódis, K.; Vitali, L.; D’Isidoro, M.; Lacal-Arántegui, R. Assessing complementarity of wind and solar resources for energy production in Italy. A Monte Carlo approach. Renew. Energy 2014, 63, 576–586. [Google Scholar] [CrossRef]
  30. International Electrotechnical Commission. Part 12-1: Power performance measurements of electricity producing wind turbines. In IEC TC/SC 88. Technical Report IEC; International Electrotechnical Commission: Geneva, Switzerland, 2005. [Google Scholar]
  31. Hellmann, G. Über die Bewegung der Luft in den Untersten Schichten der Atmosphäre; Kgl. Akademie der Wissenschaften [G.] Reimer: Berlin, Germany, 1914. [Google Scholar]
  32. Chaudhry, Q.Z. An investigation on wind power potential of Gharo-Sindh, Pakistan. Pakistan J. Meteorol. 2009, 6, 1–11. [Google Scholar]
  33. Masters, G.M. Renewable and Efficient Electric Power Systems; John Wiley & Sons: Hoboken, NJ, USA, 2013; ISBN 1118633490. [Google Scholar]
  34. Aghbalou, N.; Charki, A.; Elazzouzi, S.R.; Reklaoui, K. A probabilistic assessment approach for wind turbine-site matching. Int. J. Electr. Power Energy Syst. 2018, 103, 497–510. [Google Scholar] [CrossRef]
  35. Hadi, F.A. Diagnosis of the Best Method for Wind Speed Extrapolation. Int. J. Adv. Res. Electr. 2015, 4, 8177–8183. [Google Scholar]
  36. Nayyar, Z.A.; Ali, A. Roughness classification utilizing remote sensing techniques for wind resource assessment. Renew. Energy 2020, 149, 66–79. [Google Scholar] [CrossRef]
  37. Esri 10-Meter Land Cover. Available online: https://livingatlas.arcgis.com/landcover/ (accessed on 6 August 2021).
  38. Esri 2020 Land Cover–Overview. Available online: https://www.arcgis.com/home/item.html?id=d6642f8a4f6d4685a24ae2dc0c73d4ac (accessed on 6 August 2021).
  39. Abdul wahab, R.A.; Nassir, S.T.; Hadi, F.A. Number of Electricity Hours Generation Map for Different Wind Turbines in the Province of Wasit—Iraq. Iraqi J. Sci. 2019, 60, 1259–1265. [Google Scholar] [CrossRef]
  40. Miao, H.; Dong, D.; Huang, G.; Hu, K.; Tian, Q.; Gong, Y. Evaluation of Northern Hemisphere surface wind speed and wind power density in multiple reanalysis datasets. Energy 2020, 200, 117382. [Google Scholar] [CrossRef]
  41. Chancham, C.; Waewsak, J.; Gagnon, Y. Offshore wind resource assessment and wind power plant optimization in the Gulf of Thailand. Energy 2017, 139, 706–731. [Google Scholar] [CrossRef]
  42. Canales, F.A.; Jurasz, J.; Beluco, A.; Kies, A. Assessing temporal complementarity between three variable energy sources through correlation and compromise programming. Energy 2020, 192, 116637. [Google Scholar] [CrossRef] [Green Version]
  43. Slusarewicz, J.H.; Cohan, D.S. Assessing solar and wind complementarity in Texas. Renew. Wind. Water Sol. 2018, 5, 7. [Google Scholar] [CrossRef] [Green Version]
  44. Vega-Sanchez, M.A.; Castaneda-Jimenez, P.D.; Pena-Gallardo, R.; Ruiz-Alonso, A.; Morales-Saldana, J.A.; Palacios-Hernandez, E.R. Evaluation of complementarity of wind and solar energy resources over Mexico using an image processing approach. In Proceedings of the 2017 IEEE International Autumn Meeting on Power, Electronics and Computing, ROPEC 2017, Ixtapa, Mexico, 8–10 November 2017. [Google Scholar]
  45. Naeem, A.; Hassan, N.U.; Yuen, C.; Muyeen, S.M. Maximizing the economic benefits of a grid-tied microgrid using solar-wind complementarity. Energies 2019, 12, 395. [Google Scholar] [CrossRef] [Green Version]
  46. Aza-Gnandji, M.; Fifatin, F.X.; Hounnou, A.H.J.; Dubas, F.; Chamagne, D.; Espanet, C.; Vianou, A. Complementarity between Solar and Wind Energy Potentials in Benin Republic. Adv. Eng. Forum 2018, 28, 128–138. [Google Scholar] [CrossRef] [Green Version]
  47. Zhu, Y.; Chen, S.; Huang, W.; Wang, L.; Ma, G. Complementary operational research for a hydro-wind-solar hybrid power system on the upper Jinsha River. J. Renew. Sustain. Energy 2018, 10, 043309. [Google Scholar] [CrossRef]
  48. Jurasz, J.; Beluco, A.; Canales, F.A. The impact of complementarity on power supply reliability of small scale hybrid energy systems. Energy 2018, 161, 737–743. [Google Scholar] [CrossRef]
  49. Shaner, M.R.; Davis, S.J.; Lewis, N.S.; Caldeira, K. Geophysical constraints on the reliability of solar and wind power in the United States. Energy Environ. Sci. 2018, 11, 914–925. [Google Scholar] [CrossRef] [Green Version]
  50. Bashaer, M.; Abdullah, O.I.; Al-Tmimi, A.I. Investigation and analysis of wind turbines optimal locations and performance in Iraq. FME Trans. 2020, 48, 155–163. [Google Scholar] [CrossRef]
  51. Abd Ali, L.M.; Al-Rufaee, F.M.; Kuvshinov, V.V.; Krit, B.L.; Al-Antaki, A.M.; Morozova, N.V. Study of Hybrid Wind–Solar Systems for the Iraq Energy Complex. Appl. Sol. Energy (Engl. Transl. Geliotekhnika) 2020, 56, 284–290. [Google Scholar] [CrossRef]
  52. Krzywinski, M.; Altman, N. Points of significance: Significance, P values and t-tests. Nat. Methods 2013, 10, 1041–1042. [Google Scholar] [CrossRef] [Green Version]
  53. Aziz, A.S.; Tajuddin, M.F.N.; Adzman, M.R.; Mohammed, M.F.; Ramli, M.A.M. Feasibility analysis of grid-connected and islanded operation of a solar PV microgrid system: A case study of Iraq. Energy 2020, 191, 116591. [Google Scholar] [CrossRef]
  54. Obane, H.; Nagai, Y.; Asano, K. Assessing land use and potential conflict in solar and onshore wind energy in Japan. Renew. Energy 2020, 160, 842–851. [Google Scholar] [CrossRef]
  55. Koc, A.; Turk, S.; Şahin, G. Multi-criteria of wind-solar site selection problem using a GIS-AHP-based approach with an application in Igdir Province/Turkey. Environ. Sci. Pollut. Res. 2019, 26, 32298–32310. [Google Scholar] [CrossRef] [PubMed]
  56. Chu, C.T.; Hawkes, A.D. A geographic information system-based global variable renewable potential assessment using spatially resolved simulation. Energy 2020, 193, 116630. [Google Scholar] [CrossRef]
Figure 1. Methodology flowchart.
Sustainability 14 00388 g001
Figure 2. Created grid cells over Iraq.
Sustainability 14 00388 g002
Figure 3. Original land cover map by ESRI (left), and the majority layer of land cover classes over the grid cells (right).
Sustainability 14 00388 g003
Figure 4. GEOSUN map of 100 m altitude (left), and the corresponding GEOSUN map above the grid cells (right).
Sustainability 14 00388 g004
Figure 5. WSC map derived from land cover data.
Sustainability 14 00388 g005
Figure 6. Comparison of the extrapolated wind speeds at 100 m altitude with GEOSUN-derived wind speed data.
Sustainability 14 00388 g006
Figure 7. Map of wind resource potential in Iraq at an altitude of 100 m.
Sustainability 14 00388 g007
Figure 8. Map of solar resource potential in Iraq (GHI).
Sustainability 14 00388 g008
Figure 9. Monthly complementarity maps between wind and solar resources from January to June.
Sustainability 14 00388 g009
Figure 10. Monthly complementarity maps between wind and solar resources from July to December.
Sustainability 14 00388 g010
Figure 11. Box plot showing the median, interquartile range, and maximum and minimum complementarity values observed for each month of the year.
Sustainability 14 00388 g011
Figure 12. Spatial distribution of the number of months that showed complementary behavior between wind and solar resources.
Sustainability 14 00388 g012
Figure 13. Areas with renewable resources below the recommended thresholds.
Sustainability 14 00388 g013
Figure 14. Spatial distribution map of the effective complementarity.
Sustainability 14 00388 g014
Table 1. Look-up table of WSC in different landscape types [33,34,35].
Landscape TypeWSC
Smooth hard ground, calm water0.1
Tall grass on level ground0.15
High crops, hedges and shrubs0.2
Wooded countryside, many trees0.25
Small town with trees and shrubs0.3
Large city with tall buildings0.4
Table 2. Explanations of complementarity index values, [14].
Complementarity Index (CI) ValueInterpretation
0.9 ≤ CI ≤ 1.0Very strong similarity
0.6 ≤ CI ≤ 0.9Strong similarity
0.3 ≤ CI ≤ 0.6Moderate similarity
0.0 ≤ CI ≤ 0.3Weak similarity
−0.3 ≤ CI ≤ 0.0Weak complementarity
−0.6 ≤ CI ≤ −0.3Moderate complementarity
−0.9 ≤ CI ≤ −0.6Strong complementarity
−1.0 ≤ CI ≤ −0.9Very strong complementarity
Table 3. p-value test results for negative correlation coefficients.
MonthNegative Correlation Valuep-ValueDecision
Jan−0.560.0016Significant
Feb−0.390.0489Significant
Mar−0.70.0000Significant
Apr−0.470.0116Significant
May−0.370.0482Significant
June −0.360.0599Not significant
July−0.390.0365Significant
Aug−0.060.7572Not significant
Sep−0.170.3871Not significant
Oct−0.550.0020Significant
Nov−0.540.0030Significant
Dec−0.630.0003Significant
Table 4. Iraq’s area percentage for each complementarity index recorded during the 12 months.
Complementarity Level/MonthWeakModerateStrongTotal Area Percentages
Jan85%9%0%94%
Feb77%4%0%81%
Mar45%15%4%64%
Apr11%2%0%13%
May15%1%0%16%
Jun14%1%0%15%
Jul35%2%0%37%
Aug2%0%0%2%
Sep10%0%0%10%
Oct26%12%0%38%
Nov78%16%0%94%
Dec54%19%2%75%
Publisher’s Note: MDPI stays neutral with regard to jurisdictional claims in published maps and institutional affiliations.

