Article

The Differential Impact of Various Injection Pressures on the Exergy of a Diesel Engine Using Biodiesel-Diesel Fuel Blends

by
Mostafa Kiani Deh Kiani
1,*,
Sajad Rostami
2,
Gholamhassan Najafi
3 and
Mohamed Mazlan
4
1
Biosystem Engineering Department, Shahid Chamran University of Ahvaz, Ahvaz 61357, Iran
2
Biosystem Engineering Department, Shahrekord University, Shahrekord 34141, Iran
3
Mechanics of Biosystem Engineering, Tarbiat Modares University, Tehran 14115, Iran
4
Faculty of Bio Engineering and Technology, Universiti Malaysia Kelantan, Jeli 17600, Malaysia
*
Author to whom correspondence should be addressed.
Sustainability 2022, 14(1), 345; https://doi.org/10.3390/su14010345
Submission received: 27 November 2021 / Revised: 15 December 2021 / Accepted: 20 December 2021 / Published: 29 December 2021

Abstract

:
Contrary to energy, exergy may be destroyed due to irreversibility. Exergy analysis can be used to reveal the location, and amount of energy losses of engines. Despite the importance of the exergy analysis, there is a lack of information in this area, especially when the engine is fueled with biodiesel–diesel fuel blends under various injection operating parameters. Thus, in this research, the exergy analysis of a direct-injection diesel engine using biodiesel–diesel fuel blends was performed. The fuel blends (B0, B20, B40, and B100) were injected into cylinders at pressures of 200 and 215 bars. Moreover, the simulation of exergy and energy analyses was done by homemade code. The simulation model was verified by compression of experimental and simulation in-cylinder pressure data. The results showed there was good agreement between simulation data and experimental ones. Results indicated that the highest level of in-cylinder pressure at injection pressure of 215 bars is more than that of 200 bars. Moreover, by increasing the percentage of biodiesel, the heat transfer exergy, irreversibility, burnt fuel, and exergy indicator decreased, but the ratio of these exergy parameters (except for heat transfer exergy) to fuel exergy increased. These ratios increased from 46 to 50.54% for work transfer exergy, 16.57 to 17.97% for irreversibility, and decreased from 16 to 15.49% for heat transfer exergy. In addition, these ratios at 215 bars are higher than at 200 bars for all fuels. However, with increasing the injection pressure and biodiesel concentration in fuel blends, the exergy and energy efficiencies increased.

1. Introduction

Diesel engines play a substantial role in the transport and agricultural sector. The development of technology increases the use of petrol and diesel. Increasing price, environmental pollution, and depletion of non-renewable fossil fuels have encouraged researchers to find renewable fuels. One alternative fuel that has been widely used in compression ignition (CI) engines is biodiesel [1,2,3,4]. Some researchers have analyzed the first law of thermodynamics (thermal balance) at different operating conditions, especially by using biodiesel fuel [5,6,7,8,9]. They have showed that the first low is inadequate to investigate the thermodynamic details of engines. The exergy or availability is a central concept of the second law. Exergy is expressed as the maximum useful work performed by a system that comes into equilibrium with its reference environment. Contrary to energy, exergy may be destroyed due to irreversibility. Exergy analysis can be applied to reveal the type, location, and amount of energy losses of engines [10]. Thus, exergy analysis is necessary for reducing the losses of engines. Several researchers performed the exergy and energy analyses in CI engines. Karagoz and his co-worker investigated the energy, exergy, and economics of a diesel engine using tire pyrolytic oildiesel blend. Results showed that the highest efficiency of energy and exergy was obtained in 10% pyrolysis oil [11]. The impact of nanoparticles concentrations on the energy and exergy efficiency of diesel engine was evaluated by Karami and Gharehghan. Findings showed that the thermal efficiency of diesel engine fueled with B0W5N60 (diesel containing 5% water and 60 ppm NPs) was higher than that for pure diesel [12]. Karagoz et al. conducted exergetic and exergoeconomic analyses of a diesel engine using diesel–biodiesel blends containing different metal-oxide nanoparticles. They revealed that the nano-fuels had better performances compared to neat diesel fuel and diesel–biodiesel blend fuel [13]. Nabia and Rasul investigated the energy and exergy of non-edible biodiesel blends in a DI diesel engine [14]. Their study showed that exergy parameters in the biodiesel blends had minor variations in comparison with those of a reference diesel. Nemati et al. performed the exergy analysis of a DI diesel engine fueled with biodiesel and its blends. They found the optimum exergy efficiency for the B20 blend [15]. Sarikoc et al. analyzed the energy and exergy in a diesel engine by employing different blends of diesel, biodiesel, and butanol fuels [16]. The findings indicated that butanol blends had higher energy and exergy efficiencies than diesel. Sanli and Uludamar investigated the exergy and energy efficiencies of a diesel engine using diesel–biodiesel fuels at different speeds. They indicated that fuel energy and exergy efficiencies were reduced using biodiesel [17]. The effect of different injection pressures (IPs) on the energy efficiency and exergy efficiency of a diesel engine was explored at a constant speed. The findings showed that the highest energy efficiency was 24.509%, and the maximum exergy efficiency was 21.275% at pressure of 190 bars [18].
According to a literature review, the exergy and energy of diesel engines depend on different factors such as types of fuels, nanoparticles, and operating parameters (e.g., speed, load). One of the key parameters that affect the performance of diesel engines is injection pressure, especially using diesel–biodiesel blends [19,20,21,22]. Although the effect of injection pressure on the engine performance has been investigated, its effect on exergy analyses of a diesel engine fueled with biodiesel–diesel blends has not been performed. Therefore, this study aims to investigate the impact of two IPs (200 and 215 bars) on exergy analyses of a DI diesel engine fueled with biodiesel–diesel blends (B0, B20, B40, and B100) at a speed of 1600 rpm.

2. Materials and Methods

In this section, test instruments as well as exergy and energy models are separately described.

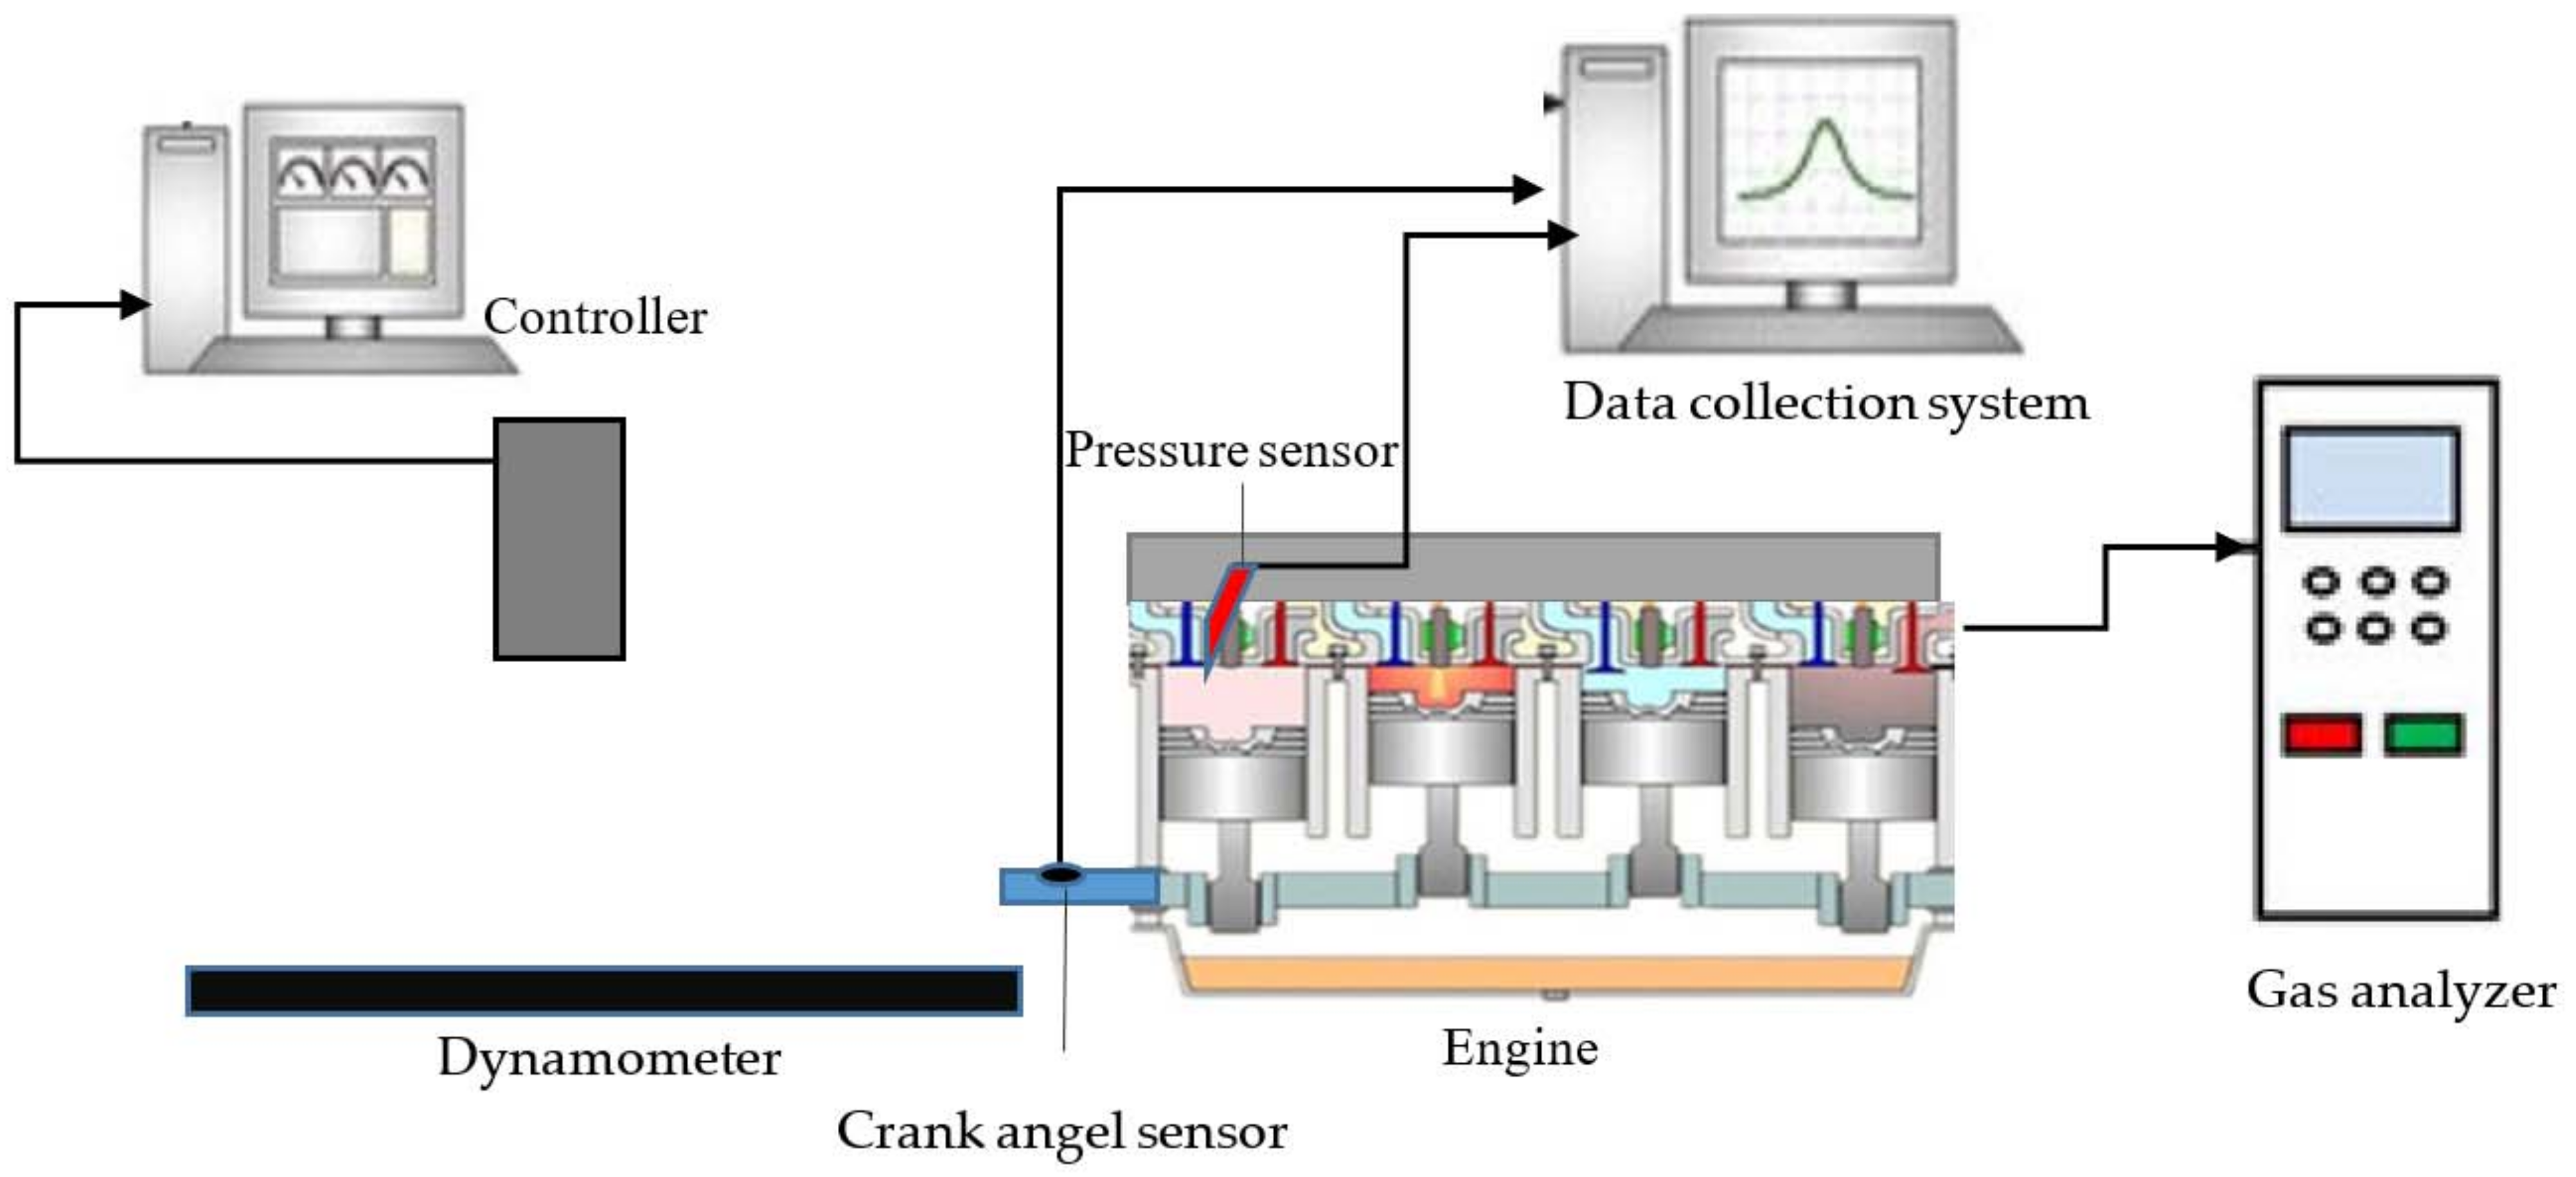
2.1. Experimental Setup

A four-stroke, four-cylinder, and turbocharged DI diesel engine (OM314) was utilized in this study. A schematic diagram of the test setup is shown in Figure 1. The main characteristics of the engine are presented in Table 1. A Schenck W400 electric eddy current dynamometer was used to measure torque and speed of engine. For the measurement of in-cylinder pressure, a Kistler pressure transducer of the type 6053BB120 was employed. The tests were performed at two fuel IPs (200 and 215 bar) and different biodiesel–diesel blends (B0, B20, B40, and B100) at a speed of 1600 rpm. The biodiesel fuel employed in the engine was obtained from waste cooking oil (the oil extracted from soybean) by esterification reaction. Table 2 illustrates the main characteristics of diesel and biodiesel fuels.

2.2. Theoretical Model

The current study aims to analyze the exergy of a diesel engine by combining the first as well as the second law of thermodynamics. A Fortran-based code was written for simulation of the thermodynamic lows. Verifying the simulation model was performed by compression of experimental and simulation in-cylinder pressure data. The results showed there was good agreement between simulation data and experimental ones.

2.2.1. Energy Analysis

The first law of thermodynamics was utilized for the closed cycle of the engine, which can be written as follows [23]:
d Q n d θ = d U d θ + d W d θ
where d Q n d θ   is the rate of net heat release, that is the difference between d Q c d θ and d Q h d θ .
d Q c d θ : Heat release rate related to combustion
d Q h d θ : Heat transfer rate through the wall
d U d θ : Rate of internal energy changes
d W d θ : work rate
Equation (1) can be rewritten as
d Q c d θ d Q h d θ = M C v d T d θ + P d V d θ
M, Cv, T, P, and V denote the mass, specific heat at constant volume, the temperature, pressure, and volume of the in-cylinder content, respectively. The formulae of specific heat are given in Ref. [24]. Cylinder volume is given by
V ( θ ) = V C [ 1 + r c 1 2 ( 1 cos θ + 1 ε ( 1 ( 1 ε 2 sin θ 2 ) 1 2 ) ) ]
where VC and rc are the clearance volume and compression ratio, respectively, and ε = S 2 L is the half of the stroke (S) to connecting rod length (L).
The first derivative of Equation (3) presents the rate of cylinder volume change:
d V d θ = V C ( r c 1 2 ) sin θ [ 1 + ε cos θ ( 1 ε 2 sin θ 2 ) 1 2 ) ]
In the current research, a two-zone approach is used to simulate the combustion process. The combustion process has been modeled using a double Wiebe function to explain the premixed and diffusive burning phases [25].
x = 1 exp 6.908 ( θ θ p ) m p + 1 + 1 exp 6.908 ( θ θ d ) m d + 1
d x d θ = 6.908 1 θ p ( m p + 1 ) ( θ θ p ) m p exp 6.908 ( θ θ p ) m p + 1 + 6.908 1 θ d ( m d + 1 ) ( θ θ d ) m d exp 6.908 ( θ θ d ) m d + 1
θ = θ r θ s
where x is the mass fraction burned, θ r and θ s are reference crank angle and combustion start angle, respectively; mp, θ p , md, θ d are Wiebe factors in the premixed and diffusive combustion phases, respectively.
The rate of heat release is computed as follows:
d Q c d θ = 6.908 Q p θ p ( m p + 1 ) ( θ θ p ) m p exp 6.908 ( θ θ p ) m p + 6.908 Q d θ d ( m d + 1 ) ( θ θ d ) m d exp 6.908 ( θ θ d ) m d
where Qp and Qd denote the energy release for premixed and diffusion combustion phases, respectively. The heat transfer through the surrounding wall of the cylinder is computed using
d Q h d θ = h A ( T T w )
where Tw and A are the cylinder wall temperature and the heat transfer area, respectively. In Equation (9), h, the coefficient heat transfer is defined by Woschni’s correlation as follow [25]:
h = 3.26 b 0.2 P 0.8 T 0.55 w 0.8
In Equation (10), w is the average velocity of the gas, which is determined by
w = [ c 1 U ¯ p + c 2 V d T I V C P I V C V I V C ( P P m ) ]
where c 1 , c 2 are constants. During compression, c 1 = 2.28 and c 2 = 0 , and during combustion and expansion, c 1 = 2.28 and c 2 = 3.24 × 1 0 3 were used. T I V C , P I V C and V I V C are temperature, pressure, and volume at intake valve closing, respectively; P m is the motored pressure; U ¯ p and V d are the average speed of piston and displacement volume which are calculated as follows [25,26]:
U ¯ p = 2 S N 60
V d = π B 2 4 S
where N and B are the engine speed and piston bore, respectively.
The ignition angle equals to the injection angle plus the delay angle. In this analysis, the delay angle q d e l a y was estimated using
θ d e l a y = ( 0.36 + 0.22 U ¯ p ) exp [ E A ( 1 R T 1 17190 ) + ( 21.2 P 12.4 ) 0.63 ]
where R is the universal constant, and E A is the apparent activation energy which was determined by the following formula [27,28,29]:
E A = 618840 C N + 25
where C N is the cetane number of the fuels.

2.2.2. Exergy Analysis

Exergy (availability) involves the potential of a system once it comes into thermal, mechanical, and chemical equilibrium with its sounding environment. Following previous studies [30,31,32], the equation of exergy balance is:
d A d θ = d A W d θ d A Q d θ d I d θ + d A F d θ
A W is the exergy transfer via work that could be expressed as follows [33,34,35]:
d A W d θ = ( P P 0 ) d V d θ
where P and are the in-cylinder and environmental pressures, respectively, and A Q is the exergy transfer via the heat transfer [34,35]:
d A Q d θ = ( 1 T / T 0 ) d Q h d θ
where T and T0 denote the instantaneous cylinder and environmental temperatures, respectively. A F is the exergy associated with fuel combustion [34]:
d A F d θ = d m f d θ a f c h
and a f c h denote the fuel burning rate and the specific chemical exergy of the liquid fuels in the form of C z H y O p S q [35,36]:
α f c h = L H V 1.0401 + 0.01728 y z + 0.0432 p z + 0.2196 q z ( 1 2.0628 y z )
where L H V is the low heat value of the fuel, and y, z, p, and q are the mass fractions of hydrogen, carbon, oxygen, and sulfur, respectively.
In Equation (16), d I d θ is the exergy loss rate via irreversibilities, which can be expressed as follows [15,35,37]:
d I d θ = T 0 T i μ i d m i d θ
Index i involves all reactants and products. For fuel, u f = a f c h for gases, u i = g i that gi is Gibbs free energy. The exergy efficiency is computed as follows:
η e x e r g y = A W m f α f c h

3. Results and Discussion

Figure 2 demonstrates the simulation and experimental in-cylinder pressure data for the B20 fuel at 200 and 215 bars and 1600 rpm. The results show that there is a good correlation between the simulation and experimental data. Regarding the strong correlation between the experimental and simulation data, the exergy terms are computed for different biodiesel–diesel blends at two IPs at 1600 rpm.
The in-cylinder pressure levels at 200 and 215 bar IPs for various fuels are illustrated in Figure 3. With increasing the IP, in-cylinder pressure increases for all fuels. Rising IP leads to better spray atomization and penetration, resulting in better mixture formation and combustion process. The appropriate mixture leads to more energy release throughout the combustion process, and, hence, in-cylinder pressure increases [36,37].
The exergy of different parameters at 200 and 215 bar IPs for B0 fuel is shown in Figure 4. The indicator exergy at IP = 215 bars is more than that for 200 bars because the in-cylinder pressure at 215 bars exceeds that for 200 bars. In addition, burned fuel exergy at 215 bars is slightly higher than that of 200 bars because of the improvement in the atomization of the fuel injection into the cylinder and an increase in the flame speed at higher IPs [38]. The exergy transfer by heat at 215 bars is higher than that of 200 bars because the in-cylinder temperature at 215 bars is more than the temperature at 200 bars. The irreversibility at 200 bars pressure is slightly more than that of 215 bars due to a decrease in in-cylinder temperature at this IP [39].
The impact of different fuels on various exergy parameters is shown in Figure 5. It can be observed that the exergy indicator (heat transfer exergy) of B0 and B20 fuels is more than that of B40, and the exergy of B40 is more than that of B100. This can be attributed to a decrease in in-cylinder pressure as a result of raising the content of biodiesel in fuel blends because of the lesser heat value of the biodiesel fuel. Burned fuel exergy of B20 fuel exceeds that of B0 fuel. Although B20 yields less heat value than B0, the B20 fuel includes oxygen in its chemical structure, and it causes better combustion and consequently higher chemical exergy and burned fuel exergy [40]. Moreover, because of its low heat value, the burned fuel exergy of B100 fuel is considerably less than that of other fuels. Because of high exergy loss due to heat transfer and chemical exergy, the irreversibility rates of B0 and B20 fuel are higher than that of other fuels.
The effect of different biodiesel–diesel blends and IPs on the ratio of different parameters of exergy to fuel exergy and energy and exergy efficiencies is presented in Table 3. As shown, once the biodiesel content increased in the fuel blends, the ratio of heat transfer exergy losses to fuel exergy decreases, but the ratio for irreversibility increases. This suggests that an addition of more biodiesel in fuel blends entails a reduction in the in-cylinder temperature, and as a result, heat transfer exergy decreases [41,42]. Moreover, the incorporation of more biodiesel in blends, the exergy transfer by work raises from 46 to 50.54%. Moreover, by increasing the IP energy and the biodiesel percentage, the exergy and energy efficiencies increase. The obtained results indicated the suitable injection pressure for the engine when fueled with biodiesel–diesel blends.

4. Conclusions

In this study, the simulation model of the energy and exergy of a diesel engine using biodiesel–diesel blends was carried out by homemade code. The homemade code was verified with comparison of experimental and simulation in-cylinder pressure data and the findings are as follows:
  • Comparing data shows the model can predict the energy and exergy parameters with reasonable accuracy at two IPs.
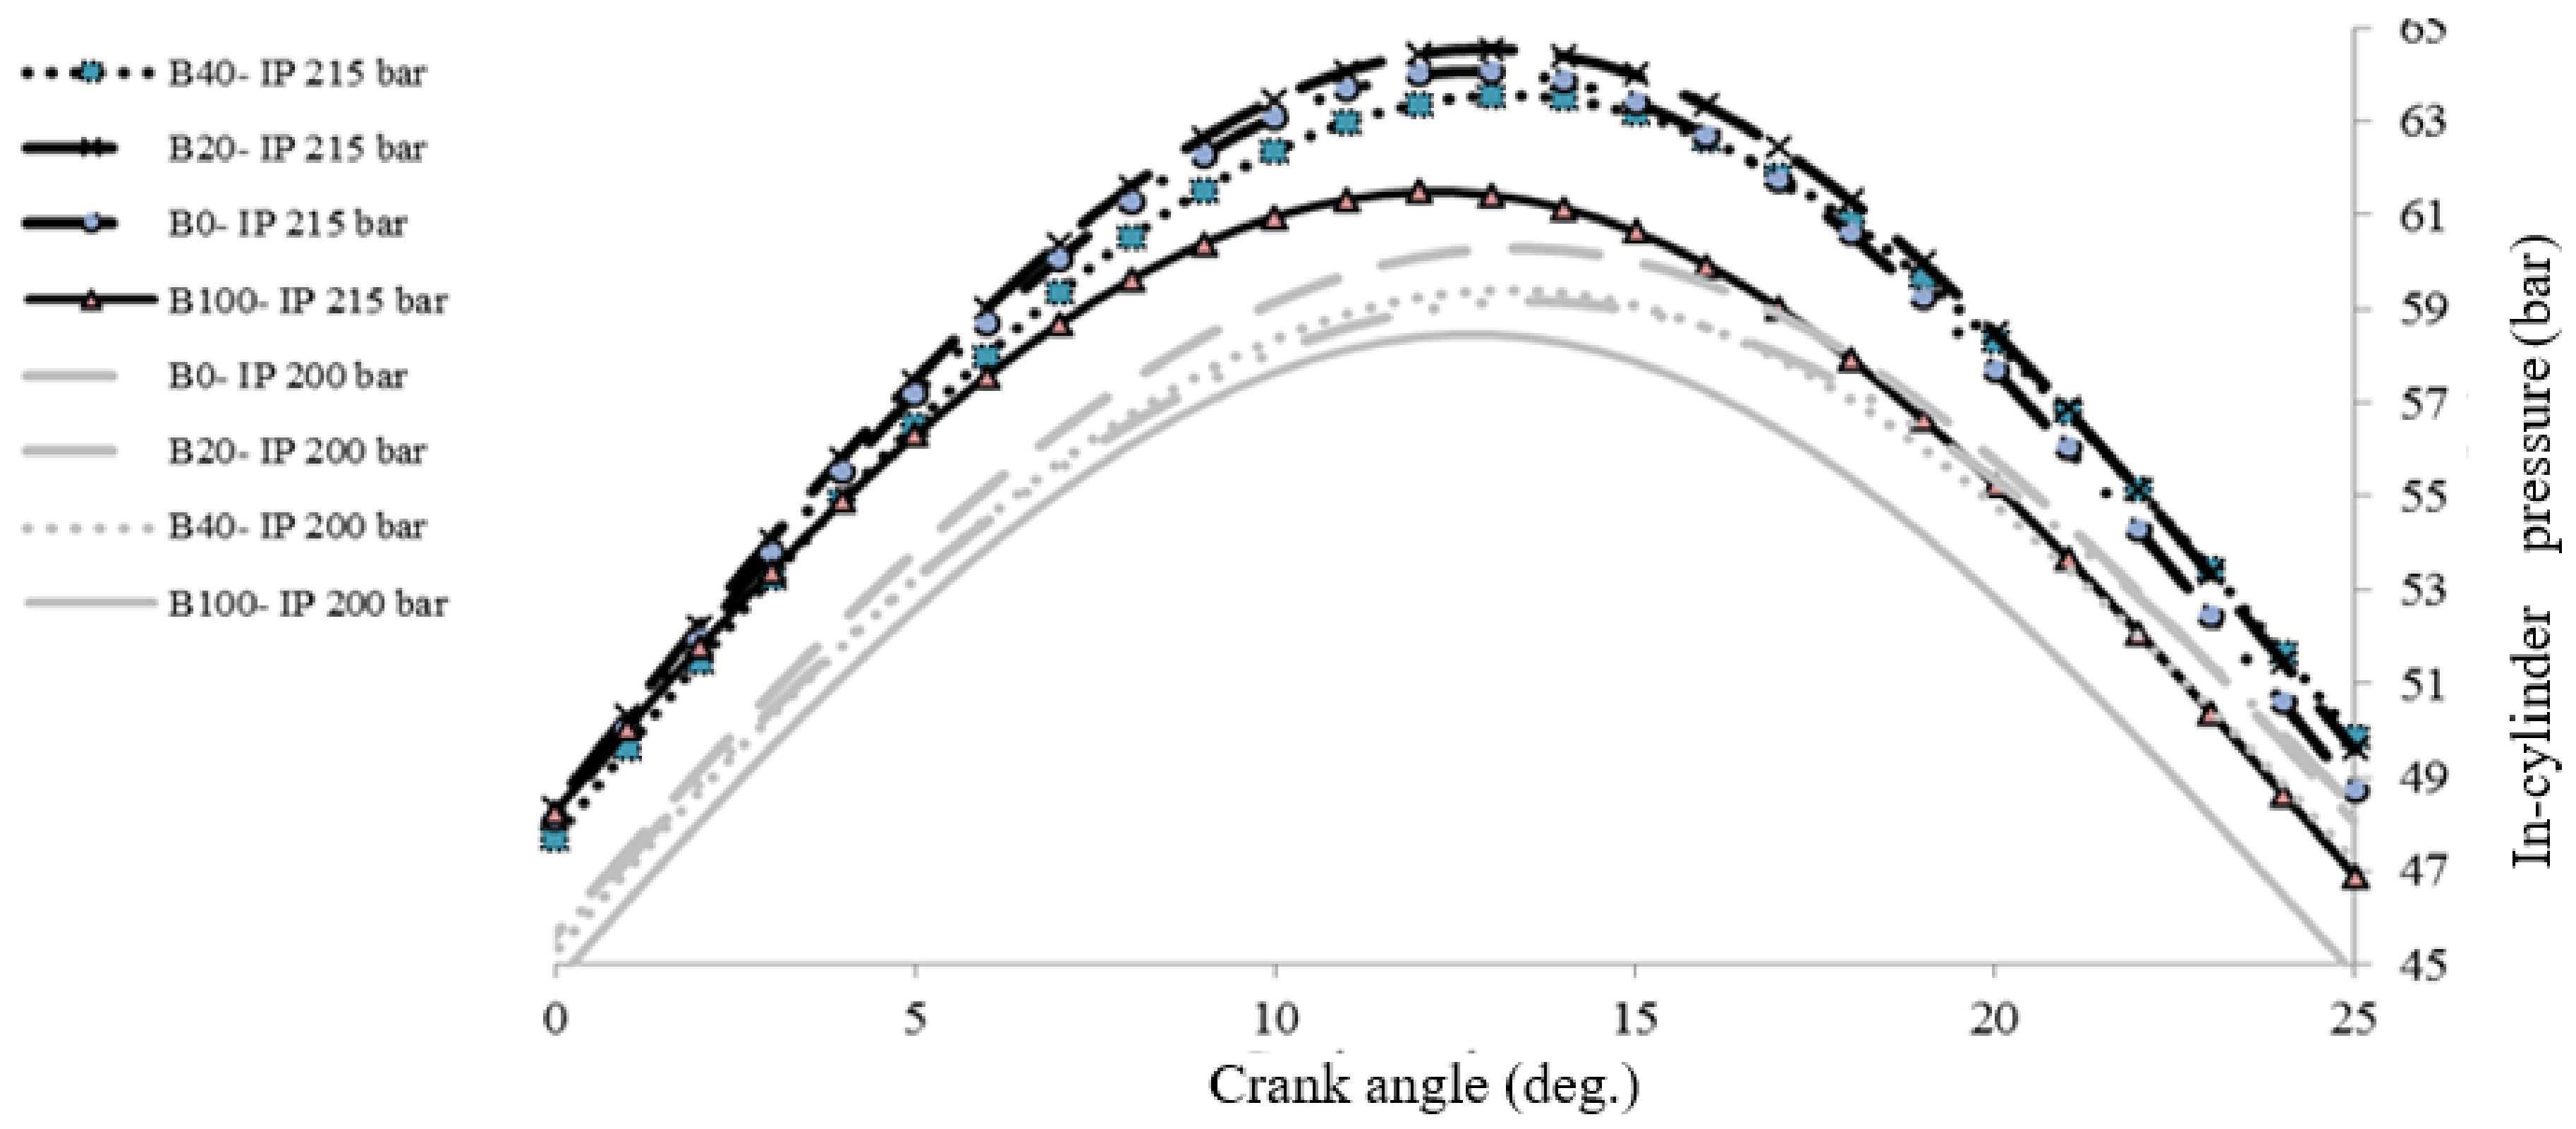
  • The in-cylinder pressure increases with increasing the IP while it decreases by increasing the biodiesel blend ratio in fuels.
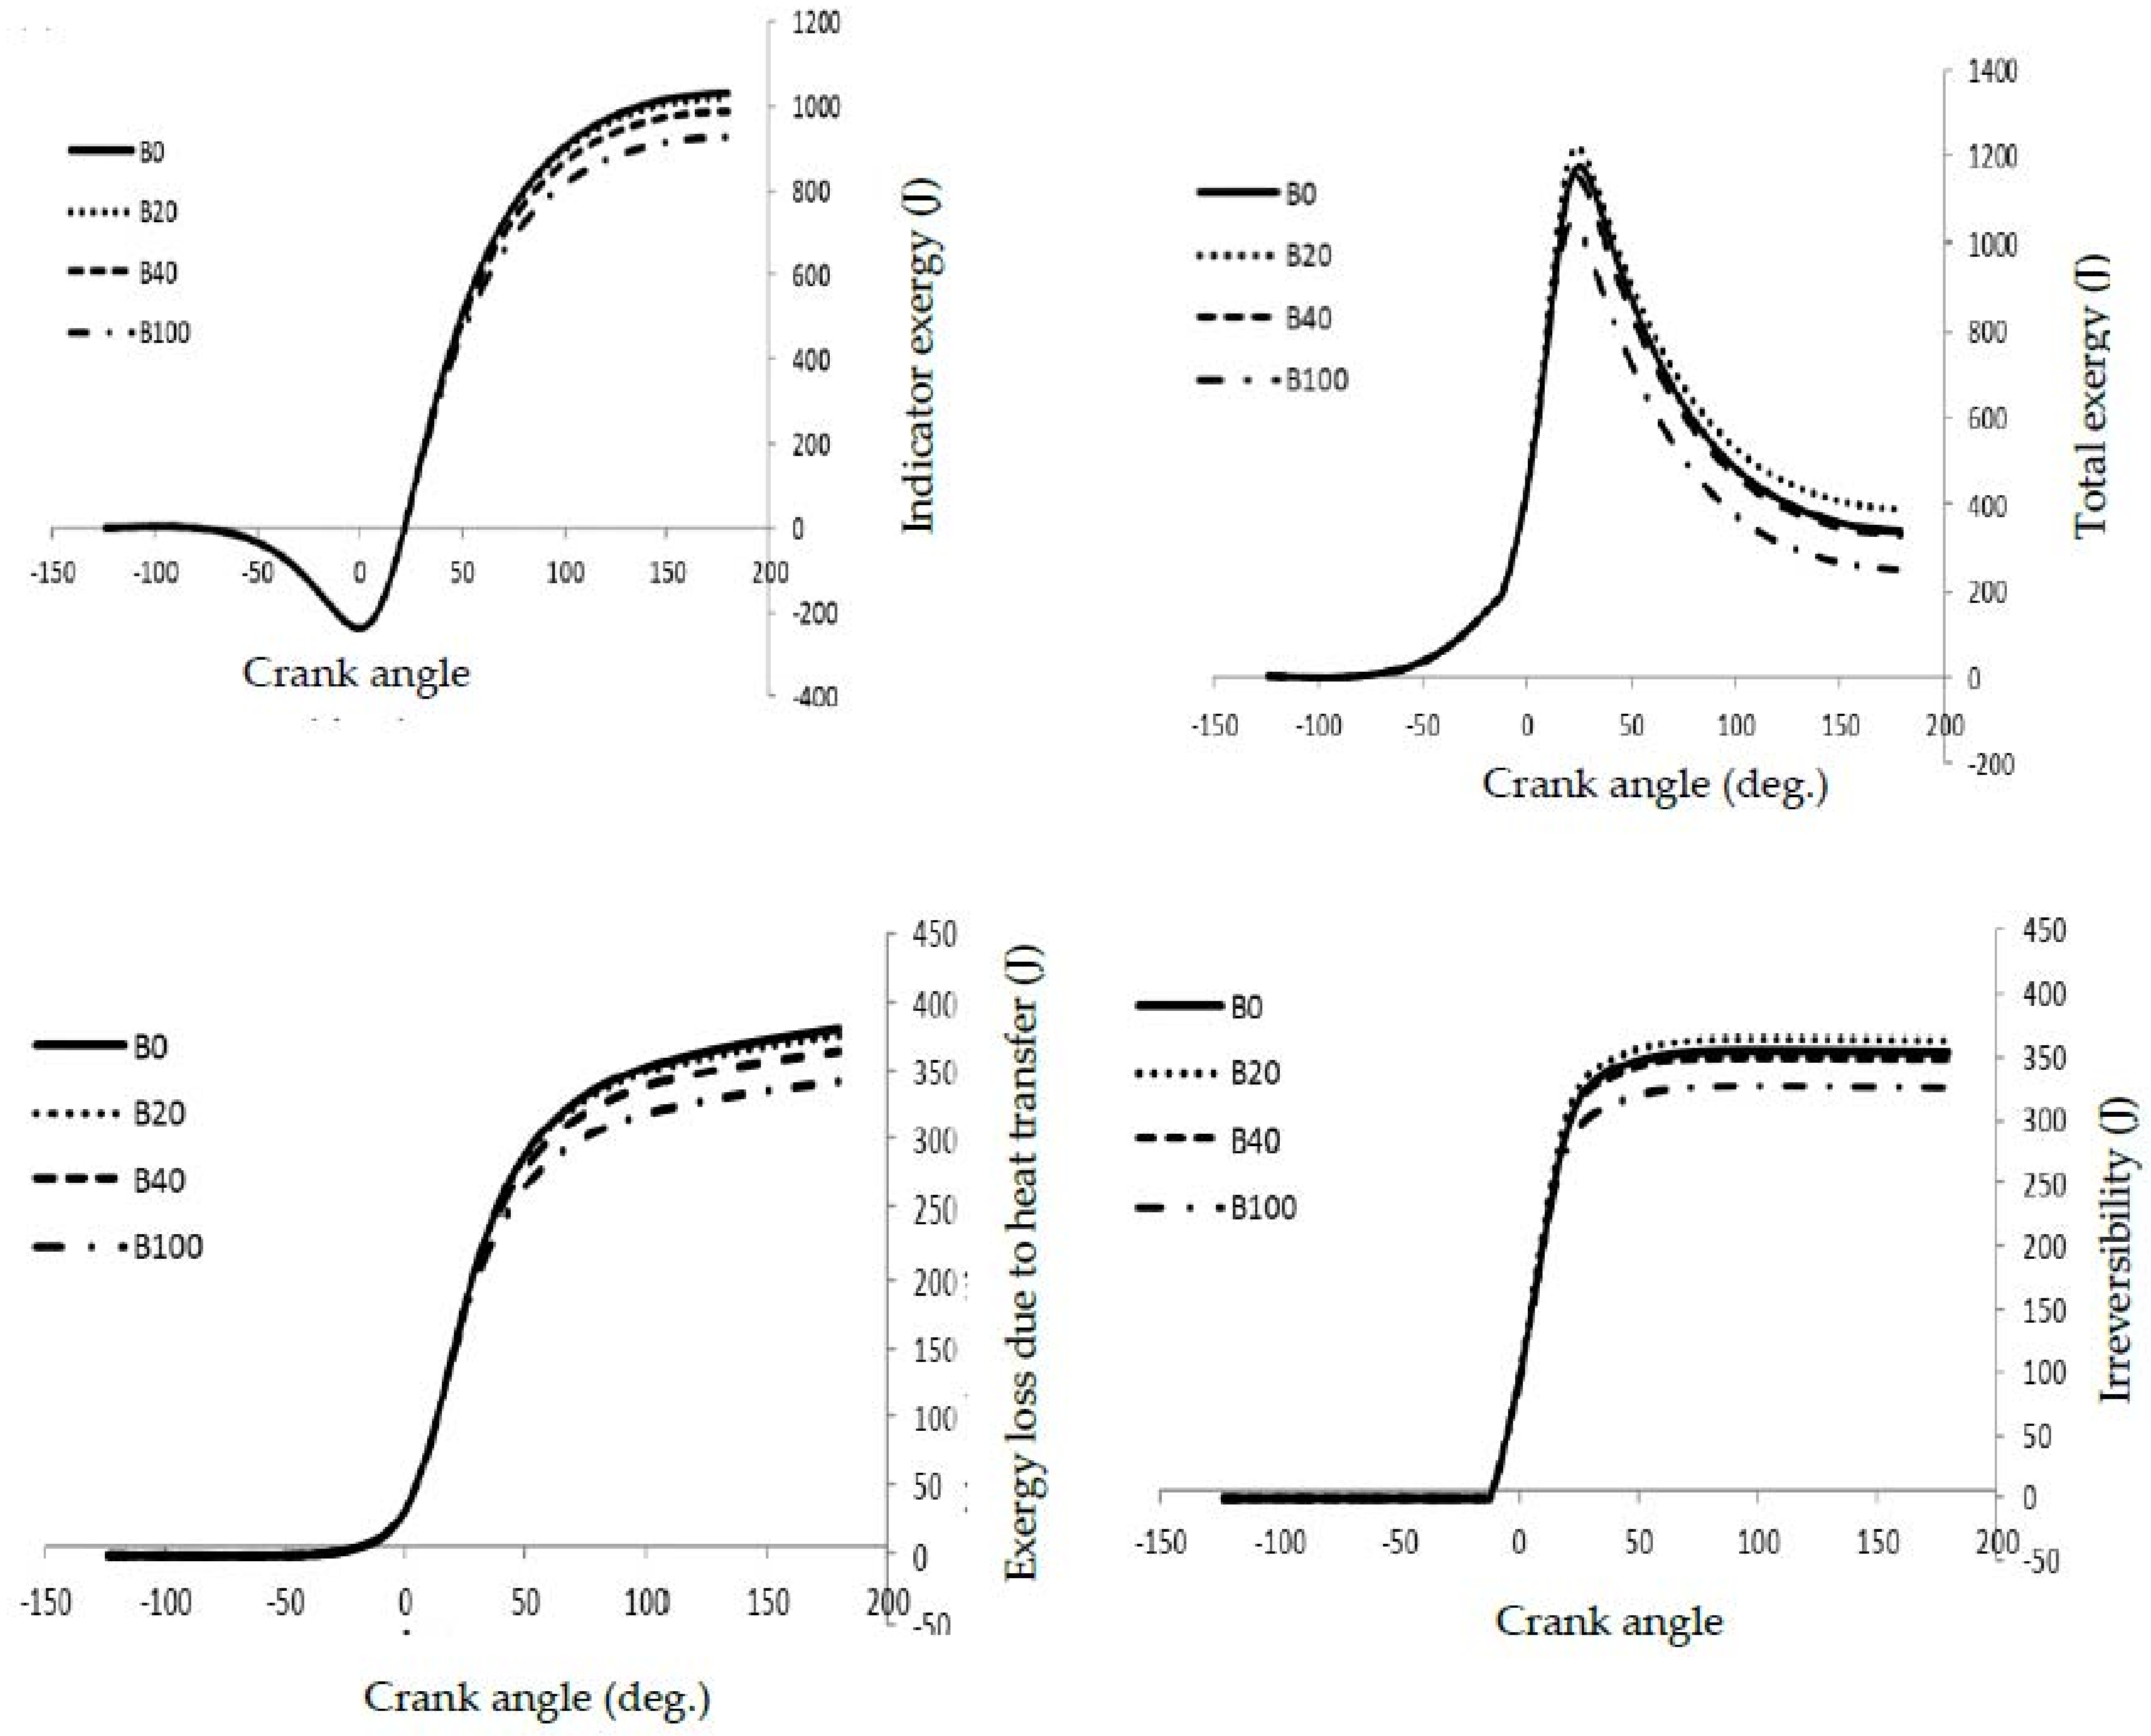
  • The heat and work exergy transfer, and burned fuel exergy for 215 bars is higher than that for 200 bars while the irreversibility for 215 bars is lower than that for 200 bars.
  • With increasing biodiesel in blends, the ratio of work exergy transfer to fuel exergy increases from 46 to 50.54%, while this ratio decreases from 16 to 15.49% for heat transfer exergy.
  • By increasing the IP and biodiesel concentration in fuel blends, the exergy and energy efficiencies increase.

Author Contributions

Conceptualization, M.K.D.K. and S.R.; methodology, M.K.D.K. and S.R.; software M.K.D.K.; validation, M.K.D.K. and S.R.; formal analysis, M.K.D.K. and S.R.; investigation, M.K.D.K.; resources, M.K.D.K.; data curation, G.N.; writing—original draft preparation, M.K.D.K., G.N. and M.M.; writing—review and editing, G.N. and M.M.; project administration, M.K.D.K. and S.R. All authors have read and agreed to the published version of the manuscript.

Funding

This research received no external funding.

Institutional Review Board Statement

Not applicable.

Informed Consent Statement

Not applicable.

Data Availability Statement

Not applicable.

Conflicts of Interest

The authors declare that they have no known competing financial interest or personal relationships that could appear to influence the work reported in this article.

References

  1. Ibrahim, A. Performance and combustion characteristics of a diesel engine fuelled by butanol–biodiesel–diesel blends. Appl. Therm. Eng. 2016, 103, 651–659. [Google Scholar] [CrossRef]
  2. Emiroğlu, A.O.; Şen, M. Combustion, performance and exhaust emission characterizations of a diesel engine operating with a ternary blend (alcohol-biodiesel-diesel fuel). Appl. Therm. Eng. 2018, 133, 371–380. [Google Scholar] [CrossRef]
  3. Mirhashemi, F.S.; Sadrnia, H. NOX emissions of compression ignition engines fueled with various biodiesel blends: A review. J. Energy Inst. 2020, 93, 129–151. [Google Scholar] [CrossRef]
  4. Nayak, B.; Singh, T.J.; Hoang, A.T. Experimental analysis of performance and emission of a turbocharged diesel engine operated in dual-fuel mode fueled with bamboo leaf-generated gaseous and waste palm oil bio-diesel/diesel fuel blends. Energy Sources Part A Recovery Util. Environ. Eff. 2021, 101, 1–19. [Google Scholar] [CrossRef]
  5. Wallace, S.J.; Kremer, G.G. Diesel Engine Energy Balance Study Operating on Diesel and Biodiesel Fuels. In Proceedings of the ASME 2008 International Mechanical Engineering Congress and Exposition, Boston, MA, USA, 31 October–6 November 2008; pp. 337–343. [Google Scholar]
  6. Gharehghani, A.; Mirsalim, M.; Hosseini, R. Effects of waste fish oil biodiesel on diesel engine combustion characteristics and emission. Renew. Energy 2017, 101, 930–936. [Google Scholar] [CrossRef]
  7. Abedin, M.J.; Masjuki, H.H.; Kalam, M.A.; Sanjid, A.; Rahman, S.M.A.; Fattah, I.M.R. Performance, emissions, and heat losses of palm and jatropha biodiesel blends in a diesel engine. Ind. Crop. Prod. 2014, 59, 96–104. [Google Scholar] [CrossRef]
  8. Azarikhah, P.; Haghparast, S.J.; Qasemian, A. Investigation on total and instantaneous energy balance of bio-alternative fuels on an SI internal combustion engine. J. Therm. Anal. Calorim. 2019, 137, 1681–1692. [Google Scholar] [CrossRef]
  9. Kiani Deh Kiani, M.; Ghobadian, B.; Ommi, F.; Najafi, G.; Yusaf, T. Artificial Neural Networks Approach for the Prediction of Thermal Balance of SI Engine Using Ethanol-Gasoline Blends. In Multidisciplinary Research and Practice for Information Systems; Quirchmayr, G., Basl, J., You, I., Xu, L., Weippl, E., Eds.; Springer: Berlin/Heidelberg, Germany, 2012; pp. 31–43. [Google Scholar]
  10. Liu, C.; Liu, Z.; Tian, J.; Han, Y.; Xu, Y.; Yang, Z. Comprehensive investigation of injection parameters effect on a turbocharged diesel engine based on detailed exergy analysis. Appl. Therm. Eng. 2019, 154, 343–357. [Google Scholar] [CrossRef]
  11. Karagoz, M.; Uysal, C.; Agbulut, U.; Saridemir, S. Energy, exergy, economic and sustainability assessments of a compression ignition diesel engine fueled with tire pyrolytic oil−diesel blends. J. Clean. Prod. 2020, 264, 121724. [Google Scholar] [CrossRef]
  12. Karami, S.; Gharehghani, A. Effect of nano-particles concentrations on the energy and exergy efficiency improvement of indirect-injection diesel engine. Energy Rep. 2021, 7, 3273–3285. [Google Scholar] [CrossRef]
  13. Karagoz, M.; Uysal, C.; Agbulut, U.; Saridemir, S. Exergetic and exergoeconomic analyses of a CI engine fueled with diesel-biodiesel blends containing various metal-oxide nanoparticles. Energy 2021, 214, 118830. [Google Scholar] [CrossRef]
  14. Nabi, M.; Rasul, M. Influence of second generation biodiesel on engine performance, emissions, energy and exergy parameters. Energy Convers. Manag. 2018, 169, 326–333. [Google Scholar] [CrossRef]
  15. Nemati, P.; Jafarmadar, S.; Taghavifar, H. Exergy analysis of biodiesel combustion in a direct injection com-pression ignition (CI) engine using quasi-dimensional multi-zone model. Energy 2016, 115, 528–538. [Google Scholar] [CrossRef]
  16. Sarıkoç, S.; Örs, I.; Ünalan, S. An experimental study on energy-exergy analysis and sustainability index in a diesel engine with direct injection diesel-biodiesel-butanol fuel blends. Fuel 2020, 268, 117321. [Google Scholar] [CrossRef]
  17. Şanli, B.G.; Uludamar, E. Energy and exergy analysis of a diesel engine fuelled with diesel and biodiesel fuels at various engine speeds. Energy Sources Part A Recovery Util. Environ. Eff. 2019, 42, 1299–1313. [Google Scholar] [CrossRef]
  18. Yesilyurt, M.K.; Arslan, M. Analysis of the fuel injection pressure effects on energy and exergy efficiencies of a diesel engine operating with biodiesel. Biofuels 2019, 10, 643–655. [Google Scholar] [CrossRef]
  19. Agarwal, A.K.; Dhar, A.; Gupta, J.G.; Kim, W.I.; Choi, K.; Lee, C.S.; Park, S. Effect of fuel injection pressure and injection timing of Karanja biodiesel blends on fuel spray, engine performance, emissions and combustion characteristics. Energy Convers. Manag. 2015, 91, 302–314. [Google Scholar] [CrossRef]
  20. Kanth, S.; Ananad, T.; Debbarma, S.; Das, B. Effect of fuel opening injection pressure and injection timing of hydrogen enriched rice bran biodiesel fuelled in CI engine. Int. J. Hydrogen Energy 2021, 46, 28789–28800. [Google Scholar] [CrossRef]
  21. Jayaraman, J.; Reddy, S. Effects of injection pressure on performance & emission characteristics of CI engine using graphene oxide additive in bio-diesel blend. Mater. Today Proc. 2021, 44, 3716–3722. [Google Scholar]
  22. Jiaqiang, E.; Pham, M.; Deng, Y.; Nguyen, T.; Duy, V.; Le, D.; Zuo, W.; Peng, Q.; Zhang, Z. Effects of injection timing and injection pressure on performance and exhaust emissions of a common rail diesel engine fueled by various concentrations of fish-oil biodiesel blends. Energy 2018, 149, 979–989. [Google Scholar]
  23. Heywood, J. Internal Combustion Engine Fundamentals; McGraw-Hill: New York, NY, USA, 1988. [Google Scholar]
  24. Shi, Y.; Ge, H.-W.; Reitz, R.D. Computational Optimization of Internal Combustion Engines; Springer Science & Business Media: London, UK, 2011. [Google Scholar]
  25. Ferguson, C.R.; Kirkpatrick, A.T. Internal Combustion Engines: Applied Thermosciences; John Wiley & Sons: Hoboken, NJ, USA, 2015. [Google Scholar]
  26. Lounici, M.S.; Loubar, K.; Balistrou, M.; Tazerout, M. Investigation on heat transfer evaluation for a more efficient two-zone combustion model in the case of natural gas SI engines. Appl. Therm. Eng. 2011, 31, 319–328. [Google Scholar] [CrossRef] [Green Version]
  27. Hardenberg, H.; Hase, F. An empirical formula for computing the pressure rise delay of a fuel from its cetane number and from the relevant parameters of direct-injection diesel engines. SAE Trans. 1979, 88, 1823–1834. [Google Scholar]
  28. Colaço, M.J.; Teixeira, C.V.; Dutra, L.M. Thermodynamic simulation and optimization of diesel engines operating with diesel and biodiesel blends using experimental data. Inverse Probl. Sci. Eng. 2010, 18, 787–812. [Google Scholar] [CrossRef]
  29. Abbe, C.V.N.; Nzengwa, R.; Danwe, R. Comparing in cylinder pressure modelling of a DI diesel engine fuelled on alternative fuel using two tabulated chemistry approaches. Int. Sch. Res. Not. 2014, 2014, 534953. [Google Scholar] [CrossRef] [Green Version]
  30. Rakopoulos, C.D.; Giakoumis, E.G. Second-law analyses applied to internal combustion engines operation. Prog. Energy Combust. Sci. 2006, 32, 2–47. [Google Scholar] [CrossRef]
  31. Jafarmadar, S. Exergy analysis of hydrogen/diesel combustion in a dual fuel engine using three-dimensional model. Int. J. Hydrogen Energy 2014, 39, 9505–9514. [Google Scholar] [CrossRef]
  32. Rakopoulos, C.; Michos, C.; Giakoumis, E. Availability analysis of a syngas fueled spark ignition engine using a multi-zone combustion model. Energy 2008, 33, 1378–1398. [Google Scholar] [CrossRef]
  33. Nemati, A.; Barzegar, R.; Khalilarya, S. The effects of injected fuel temperature on exergy balance under the various operating loads in a DI diesel engine. Int. J. Exergy 2015, 17, 35. [Google Scholar] [CrossRef]
  34. Taghavifar, H.; Nemati, A.; Walther, J.H. Combustion and exergy analysis of multi-component diesel-DME-methanol blends in HCCI engine. Energy 2019, 187, 115951. [Google Scholar] [CrossRef]
  35. Kiani, M.K.D.; Rostami, S.; Eslami, M.; Yusaf, T.; Sendilvelan, S. The effect of inlet temperature and spark timing on thermo-mechanical, chemical and the total exergy of an SI engine using bioethanol-gasoline blends. Energy Convers. Manag. 2018, 165, 344–353. [Google Scholar] [CrossRef]
  36. Haywood, R.W. Equilibrium Thermodynamics for Engineers and Scientists; Wiley: New York, NY, USA, 1980. [Google Scholar]
  37. Rostami, S.; Kiani, M.K.D.; Eslami, M.; Ghobadian, B. The effect of throttle valve positions on thermodynamic second law efficiency and availability of SI engine using bioethanol-gasoline blends. Renew. Energy 2017, 103, 208–216. [Google Scholar] [CrossRef]
  38. Purushothaman, K.; Nagarajan, G. Effect of injection pressure on heat release rate and emissions in CI engine using orange skin powder diesel solution. Energy Convers. Manag. 2009, 50, 962–969. [Google Scholar] [CrossRef]
  39. Hulwan, D.B.; Joshi, S.V. Performance, emission and combustion characteristic of a multicylinder DI diesel engine running on diesel–ethanol–biodiesel blends of high ethanol content. Appl. Energy 2011, 88, 5042–5055. [Google Scholar] [CrossRef]
  40. Fang, T.; Coverdill, R.E.; Lee, C.-F.F.; White, R.A. Effects of injection angles on combustion processes using multiple injection strategies in an HSDI diesel engine. Fuel 2008, 87, 3232–3239. [Google Scholar] [CrossRef]
  41. Özkan, M. A Comparative Study on Energy and Exergy Analyses of a CI Engine Performed with Different Multiple Injection Strategies at Part Load: Effect of Injection Pressure. Entropy 2015, 17, 244–263. [Google Scholar] [CrossRef]
  42. Sekmen, P.; Yilbasi, Z. Application of Energy and Exergy Analyses to a CI Engine Using Biodiesel Fuel. Math. Comput. Appl. 2011, 16, 797–808. [Google Scholar] [CrossRef] [Green Version]
Figure 1. Schematic diagram of the experimental engine setup.
Sustainability 14 00345 g001
Figure 2. Comparison of simulation and experimental data of in-cylinder pressure for B20 fuel at 1600 rpm.
Sustainability 14 00345 g002
Figure 3. The impact of IP on in-cylinder pressure for different fuels.
Sustainability 14 00345 g003
Figure 4. Different exergy parameters at IP = 200 and 215 bars for B0 fuel.
Sustainability 14 00345 g004
Figure 5. The effect of biodiesel-diesel blends on different exergy parameters.
Sustainability 14 00345 g005
Table 1. The characteristics of the OM314 engine.
Type of the EngineFour-Stroke Diesel Engine
Number of cylindersFour
Combustion chamberDirect injection
Aspiration systemTurbocharged with intercooler
Bore×Stroke (mm)97 × 128
Displacement volume (liter)3.780
Compression ratio17:1
Maximum power (hp)85
Maximum torque (N.m)235
Maximum speed (rpm)2800
Injection pressure (bar)200
Fuel injection timing15 BTDC
Nozzle positionDiagonal
Cooling systemWater-cooled
Table 2. The important properties of diesel and biodiesel fuels.
PropertiesDieselBiodiesel
Flash point (°C)64182
Kinematical viscosity at 40 °C (mm2/s)4.035.35
Density at 15 °C (kg/m3)837885
Low heating value (MJ/kg)39.5243.21
Cetane number5457
Total Sulphur (%wt)0.05000.0018
Table 3. The impact of different IPs and fuel blends on the ratio of exergy terms to fuel exergy.
FuelIP (Bar) d A F   ( J ) η e x e r g y ( % ) η e n e r g y ( % ) d A c y c l d A F   ( % )   d I d A F   ( % )   d I d A F   ( % ) d I d A F   ( % )
B0200214242.964621.4816.571646
215217543.649.41716.8516.7549.4
B20200207443.8147.9319.2416.9815.8547.93
215211244.1549.9416.7117.0216.149.94
B402002033.744.7848.6918.7917.2515.2748.69
215209945.4150.0516.6117.415.9450.05
B100200187146.3849.2617.8617.7815.149.26
21518944750.541617.9715.4950.54
IP: In-cylinder pressure, AF: Fuel exergy, I: Irreversibility, AQ: Heat transfer exergy, Aw: Work transfer exergy, η: Efficiency.
Publisher’s Note: MDPI stays neutral with regard to jurisdictional claims in published maps and institutional affiliations.

