Article

A Sustainability-Based Risk Assessment for P3 Projects Using a Simulation Approach

1
Department of Building and Real Estate, The Hong Kong Polytechnic University, Hung Hom, Hong Kong
2
Geelong Waterfront Campus, School of Architecture and Built Environment, Deakin University, Locked Bag 20001, Geelong, VIC 3220, Australia
3
Department of Construction Engineering and Management, King Fahd University of Petroleum and Minerals, Dhahran 31261, Saudi Arabia
4
Department of Civil Engineering, Abasyn University, Islamabad 44000, Pakistan
*
Author to whom correspondence should be addressed.
Sustainability 2022, 14(1), 344; https://doi.org/10.3390/su14010344
Submission received: 21 October 2021 / Revised: 13 December 2021 / Accepted: 25 December 2021 / Published: 29 December 2021
(This article belongs to the Special Issue Risk Management as a Tool for Sustainability)

Abstract

:
Integrating sustainability in the risk management process is an emergent problem, especially for efficient infrastructure delivery. For the case of complex projects like public–private partnerships (P3), traditional management practices offer a limited capacity to address long-ranging risk impacts on the social, economic, and environmental fabric within and around the project boundaries. Although P3 projects are objective-based contracts, present risk models rarely delineate risk impacts on focused project objectives. The relevant studies are very scarce creating a limited understanding of available approaches to conducting sustainability-based risk management for P3 projects. As risk and sustainability are two inherently subjective concepts with multiple interpretations, their combined assessment within a single framework demands a pragmatic approach. Therefore, the current study presents a model for conducting a sustainability-based risk assessment of P3 infrastructure projects through global data. Monte Carlo simulation is employed to further define the probabilistic risk ranges and risk ranks over relevant triple-bottom-line-based sustainability indicators for highway sector P3 projects. Findings are further demonstrated through two highway case studies and relevant mitigation strategies are also suggested. In the end, an implementation framework and future recommendations for the application of study findings on actual projects are also suggested. The study has useful implications for practitioners and researchers alike aiming for the delivery of sustainable complex projects.

1. Introduction

The public–private partnership (P3) provides an alternative procurement approach to deliver infrastructure projects of national importance. P3s have been embraced by both developed and developing economies owing to their flexible payment mechanism, access to private capital, and innovative financial models [1]. In a typical P3, both public and private sectors bring their complementary skills to reach a common goal i.e., project success. However, this is based on proactive project risk management (PRM) to achieve long-term project success [2]. The role of risk assessment in the long-term success of infrastructure P3s has become more important after the announcement of UN Sustainable Development Goals (2015) which encouraged the implementation of “effective public, public–private, and civil society partnerships” to “share knowledge, expertise, technology, and financial resources”. Even though the UN acknowledged the significance of P3s in sustainable development, practitioners and researchers struggle to integrate sustainability concepts in the P3 risk assessment process [3].
This is important because the inherent complex P3 structure and augmented project boundaries expose them to a multi-layer risk system demanding comprehensive assessment over the lengthy P3 project life [4]. Moreover, P3 is a multi-stakeholder complex prone to adversarial relationships due to the conflicting goals of each party [5]. In this scenario, the risk impacts within these projects are long-ranging, unpredictable, and interrelated rendering traditional risk management practices following a short- or medium-term approach largely futile and incompatible with the P3 structure. Studies addressing P3 risk management majorly focus on the effect of threats to project success envisioned in terms of iron-triangle project controls (time, cost, and quality) [6]. Moreover, in these studies, the project objectives and success criteria against which risks are measured are mostly ill-defined, offering only an ambiguous description and referring to iron-triangle controls only implicitly [7]. This ambiguity creates a major limitation in present project risk management (PRM) frameworks to clearly interpret the nature and expression of risk in P3 projects translating into failure in sustainable project delivery. Specifically, deficiencies such as poor risk identification, ambiguous risk assessment, misplaced risk allocation, and insufficient mitigation plans make these projects highly sensitive and prone to failure [8]. Owing to the strong demand for the delivery of sustainable P3s, a more robust and comprehensive risk assessment system is required [9].
The existing studies on risks in sustainable P3s are scarce and focused only on the assessment of ‘sustainability risks’ i.e., the environmental and social risks [10,11]. But that is not enough to cater to the complex nature of P3 projects which demand a deeper insight into the synergies between risk, sustainability, and P3 [12,13]. Risk and sustainability are two of the most widely interpreted concepts whose inherent epistemological and execution incompatibilities make it difficult to develop a convergent construct for integrated assessment. Thus, to make the case for developing a sustainability-oriented risk assessment, a certain level of pragmatism must be adopted drawing on practical interpretations of both risk and sustainability for project success. A major constraint for sustainability-oriented risk assessment is that presently the project and sustainability performances are assessed separately. To address this issue, sustainability must be brought under the project management umbrella. In a notable work, Silvius and Schipper [14] conceptualized this integration as sustainable project management and defined it as “planning, monitoring and controlling of project delivery and support processes, with consideration of the environmental, economic and social aspects of the life-cycle of the project’s resources, processes, deliverables, and effects, aimed at realizing benefits for stakeholders, and performed in a transparent, fair and ethical way that includes proactive stakeholder participation”. Thus, it is apparent that the practical application of sustainability involves interrelated project and process levels. Furthermore, risk identification and management are suggested as a major area of potential sustainability impact in project management. In this regard, relevant studies make the following recommendations: (1) Extension of risk identification to include environmental and social risks, (2) Reorientation of risk management towards sustainability, and (3) Inclusion of sustainability stakeholders in decision-making [9,15,16,17,18,19].
Some studies attempt to conduct a sustainability-oriented risk assessment for infrastructure projects. For example, Diaz-Sarachaga et al. [20] proposed a sustainable risk assessment plan for the sustainable delivery of road infrastructure projects. Shahriar et al. [21] and Wang et al. [13] adopted graphical risk assessment techniques to profile consequences on the triple bottom line of sustainability. Qazi et al. [22] used the Monte Carlo approach for probabilistic risk assessment for environmental risks. These studies adopted useful approaches but either only studied risk relationships or focused on the assessment of sustainability risks. They did not focus on integrating sustainability in the risk management process. Based on this gap, the current study develops a detailed methodology for sustainability-based risk assessment of P3 projects. The methodology involves: (1) linking P3 risks and sustainability indicators through impact matrix, (2) evaluating probabilistic risk indices using a Monte Carlo approach, (3) testing the practical implementation of the methodology on two real case studies from the highway sector, and (4) suggesting mitigation strategies for real case risks and implementation framework for study findings.

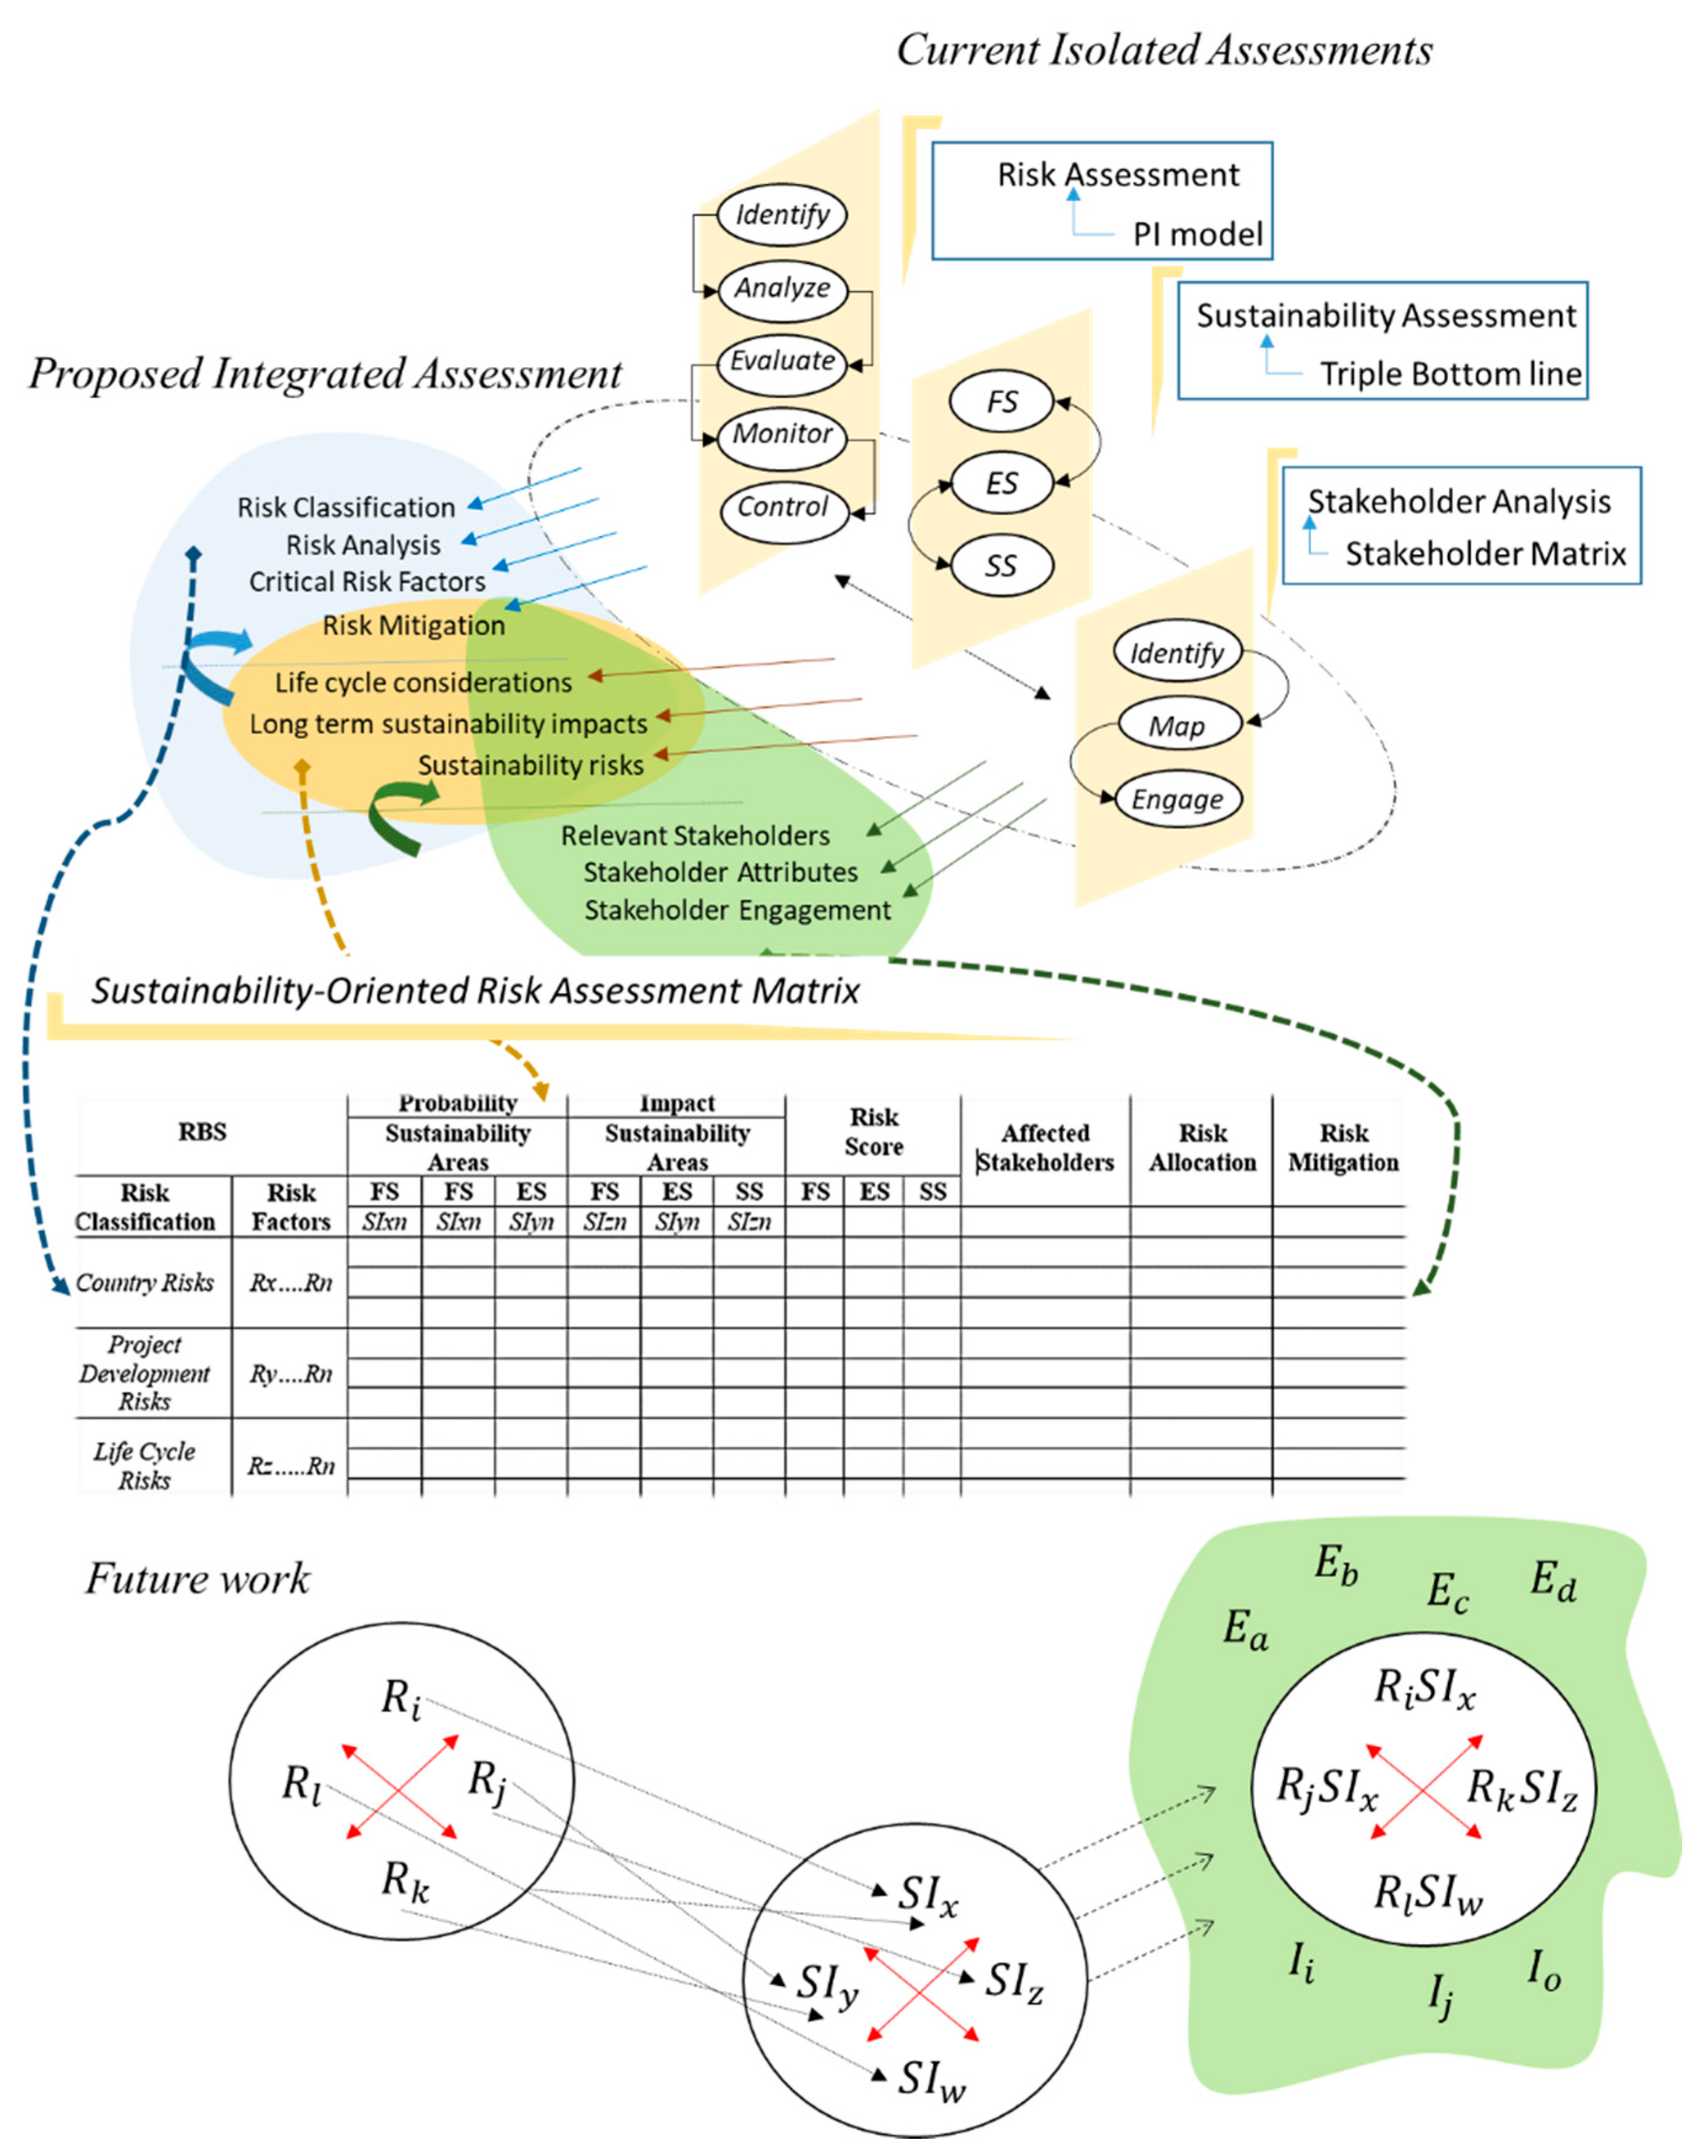
2. Integrating Risk and Sustainability for P3 Delivery

Various authors have acknowledged the P3 model for its potential to foster sustainable development [3]. Content analysis of sustainability-related research in P3 projects, in the perspective of construction management, reveals three potential areas for integration of sustainability-related criteria in decision-making: policy, process, and product. At the policy level, sustainability-related outcomes act as an ideological cover for the P3 strategy. In this regard, legislative, regulatory, and procedural instruments are deployed by governments to create a favorable environment for sustainable P3 delivery [23]. This ultimately paves way for product-level sustainability integration. Some studies have addressed a product-level sustainability integration: the use of the P3 model for delivery of social infrastructure [24] and environment-friendly projects [25]. However, the P3 implementation framework rarely endorses a sustainability agenda creating a gap for process-level integration. To make the P3 development processes sustainable, a whole life-cycle perspective is required. The decision-making in P3 projects mainly includes consideration of project viability, feasibility, risk, contracts, stakeholder, and project management. Multiple studies have focused on the development of sustainable practices for P3 project delivery [26,27,28] suggesting the incorporation of sustainability considerations in various P3 life-cycle phases to improve sustainability performance. However, the focus has been limited to incentivizing sustainability through the inclusion of sustainability-related bidding criteria, adopting flexible contract approaches, effective negotiation, and stakeholder satisfaction [29]. Little attention has been given to explicitly addressing sustainability-related objectives during project planning. In this regard, consideration of life-cycle critical success factors, the inclusion of life-cycle cost during financial evaluation, use of advanced technologies for P3 life-cycle performance evaluation, life-cycle risk management, and stakeholder engagement are some of the areas of incorporation currently explored [7,30]. Despite a plethora of sustainability-related frameworks, one major missing link is the unexplored relation between risk and sustainability. Several studies propose a focused risk assessment as a solution to sustainability challenges [9,16,17,19,21]. As P3 projects are structured in a long-term contract, orienting risk assessment towards sustainability is beneficial for effective assessment. Adopting a life-cycle perspective facilitates considerations of changing project dynamics in the risk management process essential to reach optimal risk allocation solutions [7]. Otherwise, long-ranging environmental and social risks remain unaddressed impairing sustainability [31].
Sustainability and risk are two multi-dimensional concepts open to subjectivity as per the context of the application. Although there are many definitions of risk, The ISO 31,000 defines risk in any PRM as the effect of uncertainty on project objectives. The project management institute (PMI) further explains risk as a probable uncertain event or a condition which upon occurrence can affect one or more project objectives, negatively or positively [32]. Though there are other definitions of risk in the literature, we take a project view of risk where it is a measurable uncertainty potentially affecting the outcomes of a project. In construction and infrastructure projects, risk and sustainability are usually seen as two contrasting or complementing concepts which may or may not affect each other [33,34]. However, in a generic perspective, their relationship has long been established [35]. Traditional risk assessment approaches consider short- to medium-term disturbances affecting time, cost, and quality. The focus on only these objectives can compromise the sustainability objectives of the project. From the sustainability perspective, risks have a higher level of uncertainty, and point-based risk assessment using traditional risk matrices may not offer sufficient decision-making support to P3 practitioners. On the other hand, sustainability assessment mostly follows a triple-bottom-line framework using the concepts of longevity and security aiming at assessing long-term impacts over the project life. Moreover, sustainability is focused on project objectives while risk assessment is focused on minimizing the probability of threats to project objectives or probability of failure [36]. These complementary features help develop a pragmatic framework for a joint assessment. A major constraint for sustainability-oriented risk assessment, however, is that presently the project and sustainability performances are assessed separately in construction and infrastructure projects. This division of labor deprives the assessment of the necessary sophistication to understand and act upon the complex outcomes. To address this issue, sustainability must be brought under the project management umbrella. In a notable work, Silvius and Schipper [14] conceptualized this integration as sustainable project management, defined as “planning, monitoring, and controlling of project delivery and support processes, with consideration of the environmental, economic and social aspects of the life-cycle of the project’s resources, processes, deliverables and effects, aimed at realizing benefits for stakeholders, and performed in a transparent, fair and ethical way that includes proactive stakeholder participation”. For this purpose, sustainability can be defined per the triple-bottom-line (TBL) framework which can be further broken down into indicator groups and sub-groups forming a mix of qualitative and quantitative indicators [37]. Using these synergies, a focused risk assessment can be performed by assessing the vulnerability of sustainability indicators towards the risk nucleus of P3 projects. This is a scarcely explored yet useful approach to uncover the sustainability consequences of project risks. Shahriar et al. [21] analyzed risk using graphical risk assessment techniques to profile consequences on triple-bottom-line sustainability areas. Diaz-Sarachaga, Jato-Espino, and Castro-Fresno [20] developed a rating system for sustainable road infrastructure projects. In the framework, a sustainable risk management (SRM) plan has been identified as one of the important criteria for assessing managerial requirements for the sustainable assessment of road infrastructure projects. Such a framework is developed for aligning project development and implementation with the sustainability goals and criteria [38]. However, these studies only explore risk relationships or managerial suggestions. To prioritize P3 risks for sustainability, analytical or metric based assessment needs to be carried out.
Existing literature on risk assessment in P3 projects is either context-oriented or methodology-oriented. The context-oriented studies focus on exploring the effect of risk through varying contextual dynamics. The country of project execution, type of project being delivered, characteristics, procurement method, and life cycle phases [7] are some of the relevant variables explored in these studies. Additionally, exploring the effect and perception of risk on various other contract design constraints, for example, concession period, NPV [39], and contract timing, is an important area of study in P3 literature. On the other hand, the methodology-oriented studies focus on improving the ranking of risks through the application of modeling and simulation techniques. These include but are not limited to fuzzy-logic [40,41] game theory [42], artificial neural networks [43], neuro-fuzzy techniques [44,45], IRMS [46], and fuzzy-AHP [47]. However, these studies are focused on improving the precision of the risk analysis process, i.e., achieving greater precision in risk measurement. There is limited research related to P3 risk management focused on analyzing risk for developing sustainable P3 projects. Furthermore, the use of advanced modeling and simulation approaches has lower practicality in terms of industry adoption. Hence, a compatible approach with existing industry practices needs to be explored. In this regard, Qazi et al. [22] used a Monte Carlo based risk assessment for sustainability risks in construction projects. This approach helps in developing the stochastic risk ranges for the project incorporating the uncertainty of project associated risks and prioritizing critical risks according to practitioners’ risk appetite. This approach has high compatibility with the existing risk matrix-based assessment which is the main attraction of the process.
The current study uses a similar approach for risk prioritization of P3 projects linking P3 risks with sustainability indicators through process integration. Overall, a process-based approach is adopted for conducting a sustainability-based risk assessment for P3 projects. In this regard, sustainability considerations are included in every phase of the PRM. For the development of methodology, multiple relevant studies surrounding the integration of risk and sustainability were considered [9,12,19,48,49,50]. In the developed approach, expert opinion has also been taken into account through a rigorous survey of experts, which conforms with the multi-criteria decision-making approach (MCDM) used for triple-bottom-line sustainability assessment in projects [51]. The approach can be used in the early decision stages of the project life of complex projects like P3 which are based on long-term contracts. These projects face many risks and have a direct impact on the country’s economy. Therefore, the developed approach can help choose between various project alternatives available, and also aid in identifying proactive management approaches for risks [36,52].

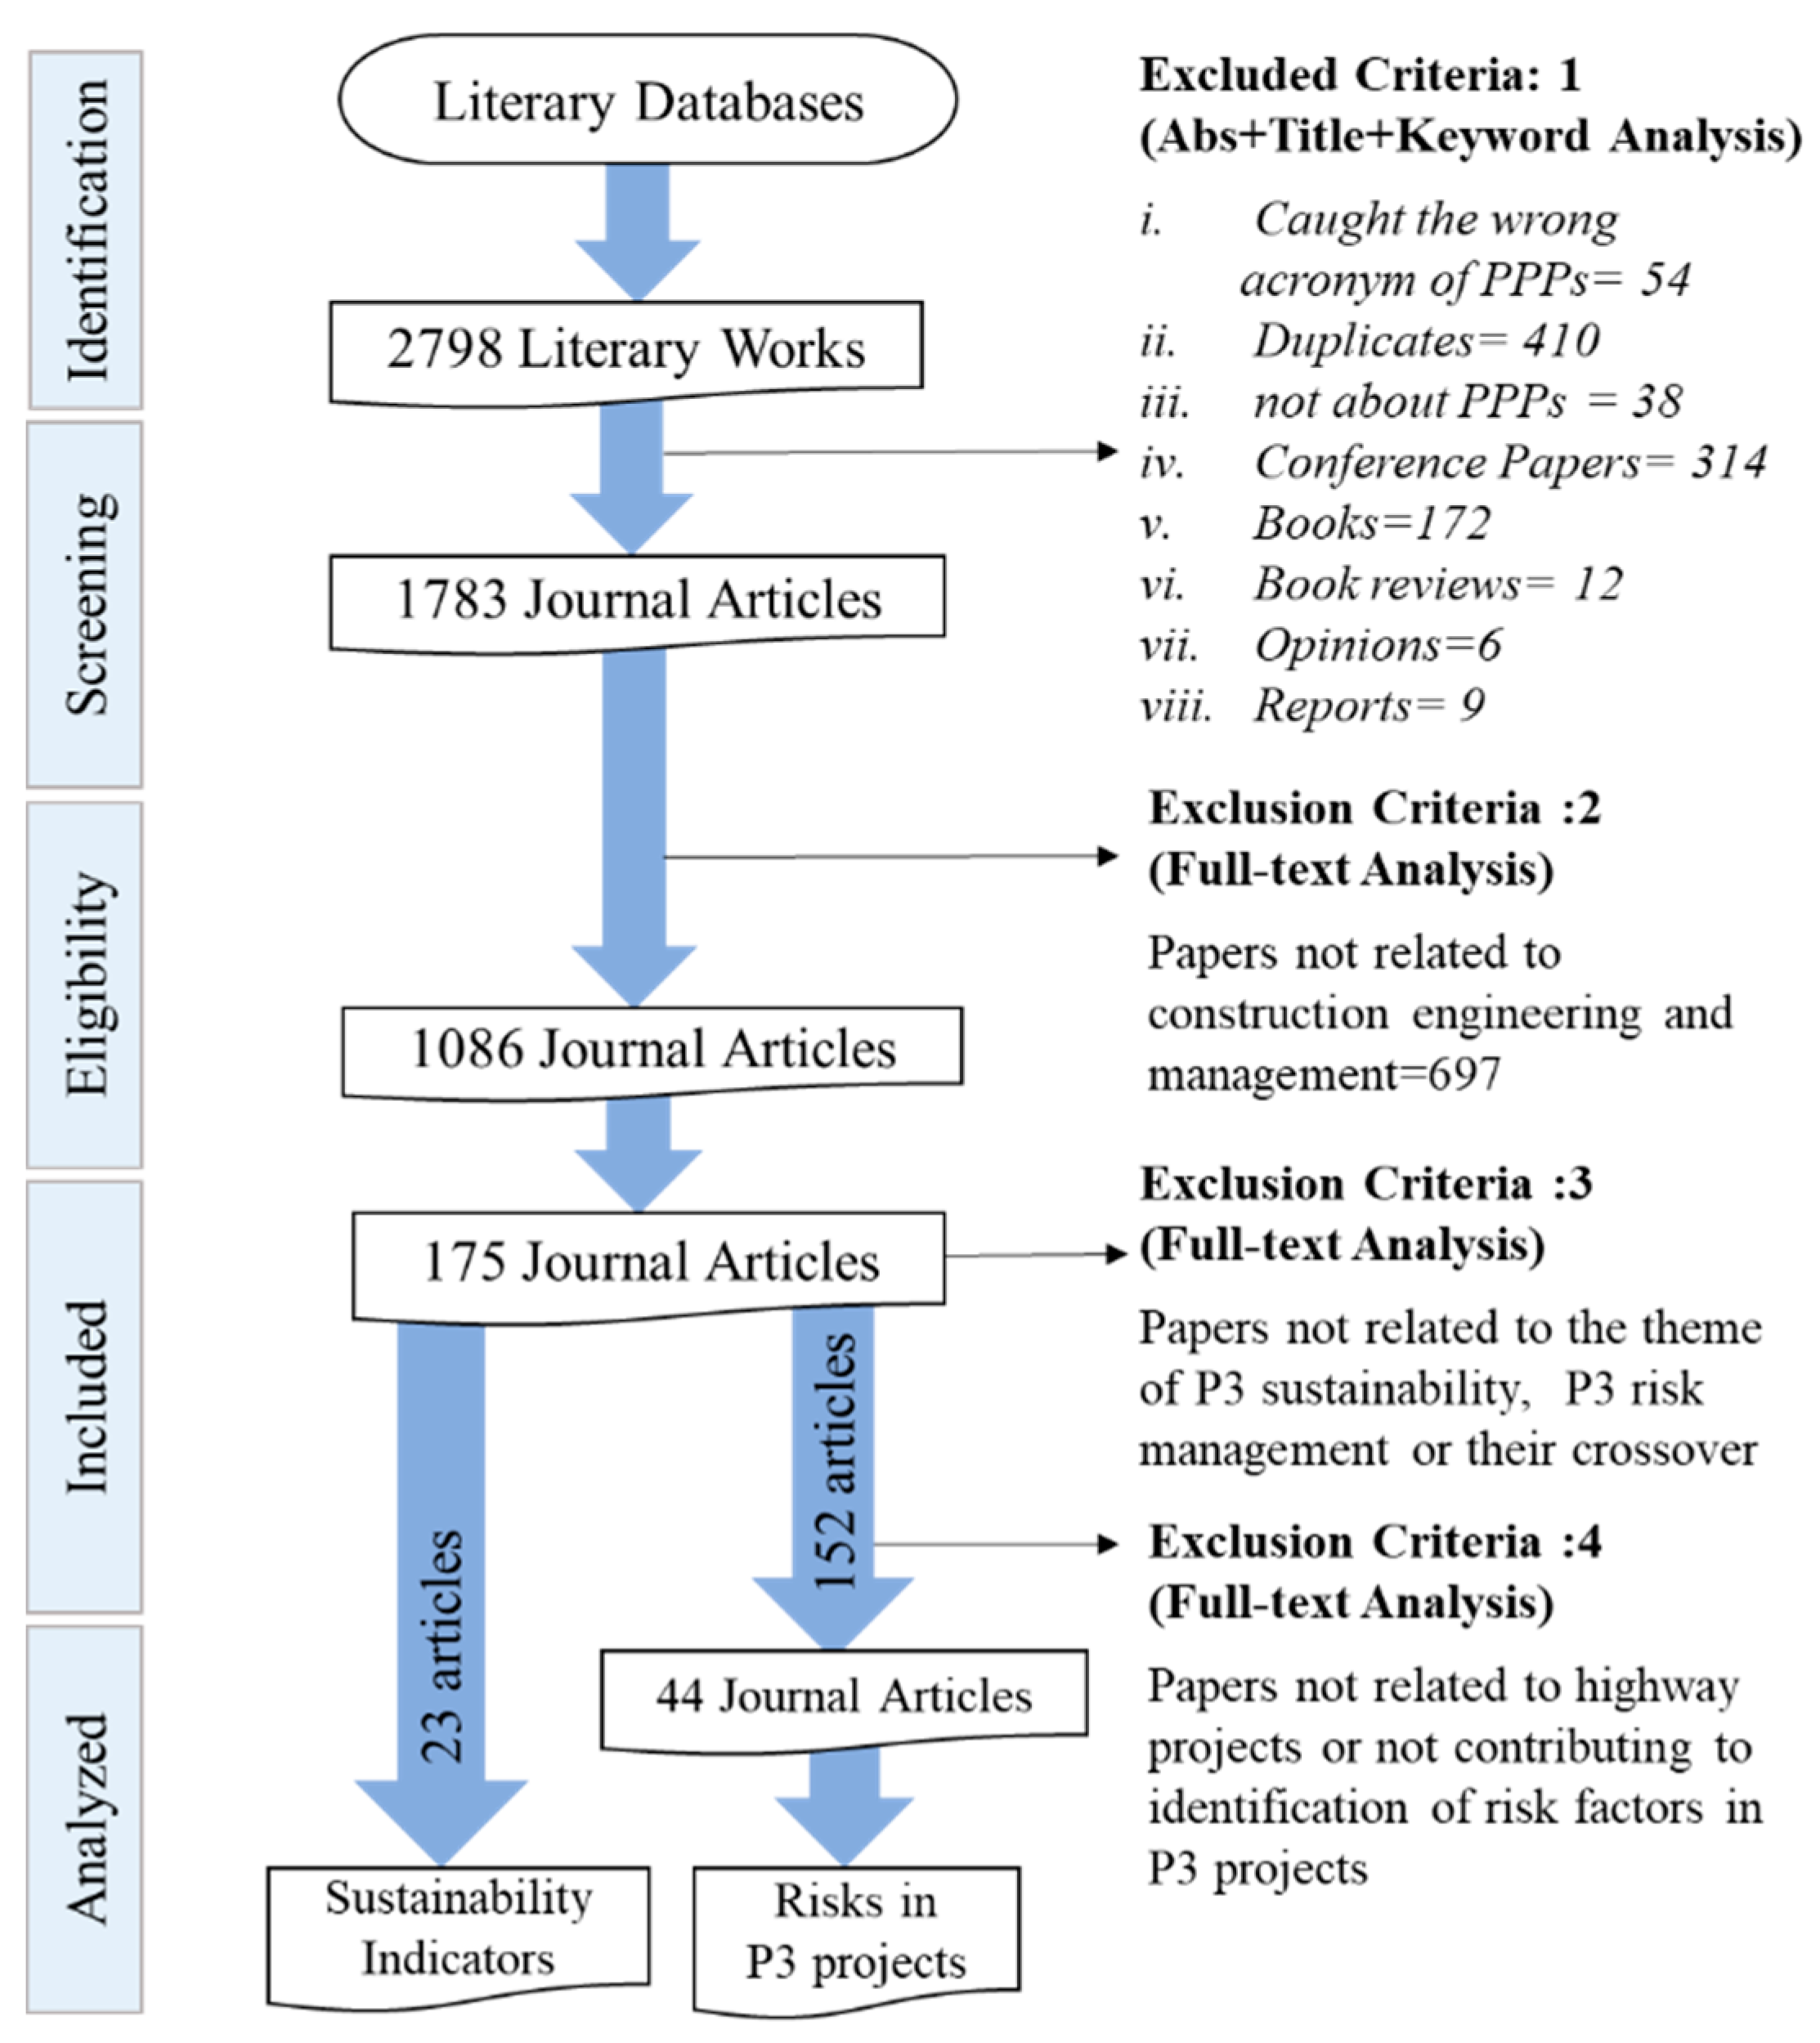
3. Selection of Sustainability Indicators and P3 Risk Factors

A detailed systematic literature review for the identification of P3 risks and sustainability indicator groups was conducted, as explained in this section. A systematic review of P3 literature published during the period 2000–2020 was carried out to develop the literature-based process level framework for risk-sustainability integration. Articles were extracted from different indexing databases such as Web of Science (WoS) and Scopus, and publishers like Taylor and Francis, ASCE and Elsevier, using keywords “public-private partnership”, “P3”, “BOT”, “DBFM”, “TOT”, “BOO”, and “P3”. The systematic screening of relevant articles is shown in Figure 1.
For these articles, a thematic analysis revealed several research themes from which journal articles directly contributing to the domains of ‘sustainability in P3 projects’ and ‘PRM for P3 projects’ were selected. As the crossover research for sustainability and risk management for P3 projects is still evolving, the 23 articles on ‘sustainability in P3 projects’ were used to select the sustainability indicators for assessment, whereas the 152 articles identified for ‘PRM for P3 projects’ were further screened to include articles contributing to the development of P3 risk taxonomy.

3.1. Sustainability Hierarchy

The current study uses the triple-bottom-line (TBL) of sustainability which represents a combination of indicator groups and sub-groups of qualitative and quantitative nature [37,53]. These indicators can be used to perform a focused risk assessment by assessing the vulnerability of sustainability indicators towards the risk nucleus of P3 projects. In relevance to road projects, various studies proposed the traditional TBL breakdown for the sustainability assessment of P3 projects [31,54]. In the existing literature, the sustainability indicators for TBL tend to focus on procurement, planning, or design [28,31]. However, no single study has offered a clear, standardized, and global set of indicators for sustainability assessment at a holistic and overall project performance assessment level. The use of a standard and global set of indicators, covering a comprehensive range of impacts, is more helpful for decision-making. As in the case of P3, the indicators should be enforceable at the policy level as well. Thus, relevant literature was reviewed to select indicators in each sustainability area, as shown in Table 1.
Within these indicator groups, inventory level indicators can be specified varying from project to project. As the aim of the study is to help decision-makers initiate the integration of sustainability into the PRM framework, technical level inventory indicators have not been used but can be assessed in future studies. For environmental sustainability, Goedkoop, et al. [55] have proposed human health damage, ecosystem damage, and resource damage as environmental indicators, which further contain a detailed variety of impacts [56]. For social sustainability, UNEP/SETAC guidelines and methodological sheets have been used for the selection of impact categories [57]. These categories are stakeholder-based. For this study, five impact categories are selected as shown in Figure 2. This is in line with Ahmad and Thaheem [58]. For financial sustainability, literature establishes the initial capital and life-cycle costs as two main indicators [59]. These are directly related to the functions of Net Present Value (NPV) and Internal Rate of Return (IRR), which are used for an economic evaluation of P3 projects [60,61]. Therefore, this study used initial and life-cycle costs as financial sustainability indicators.

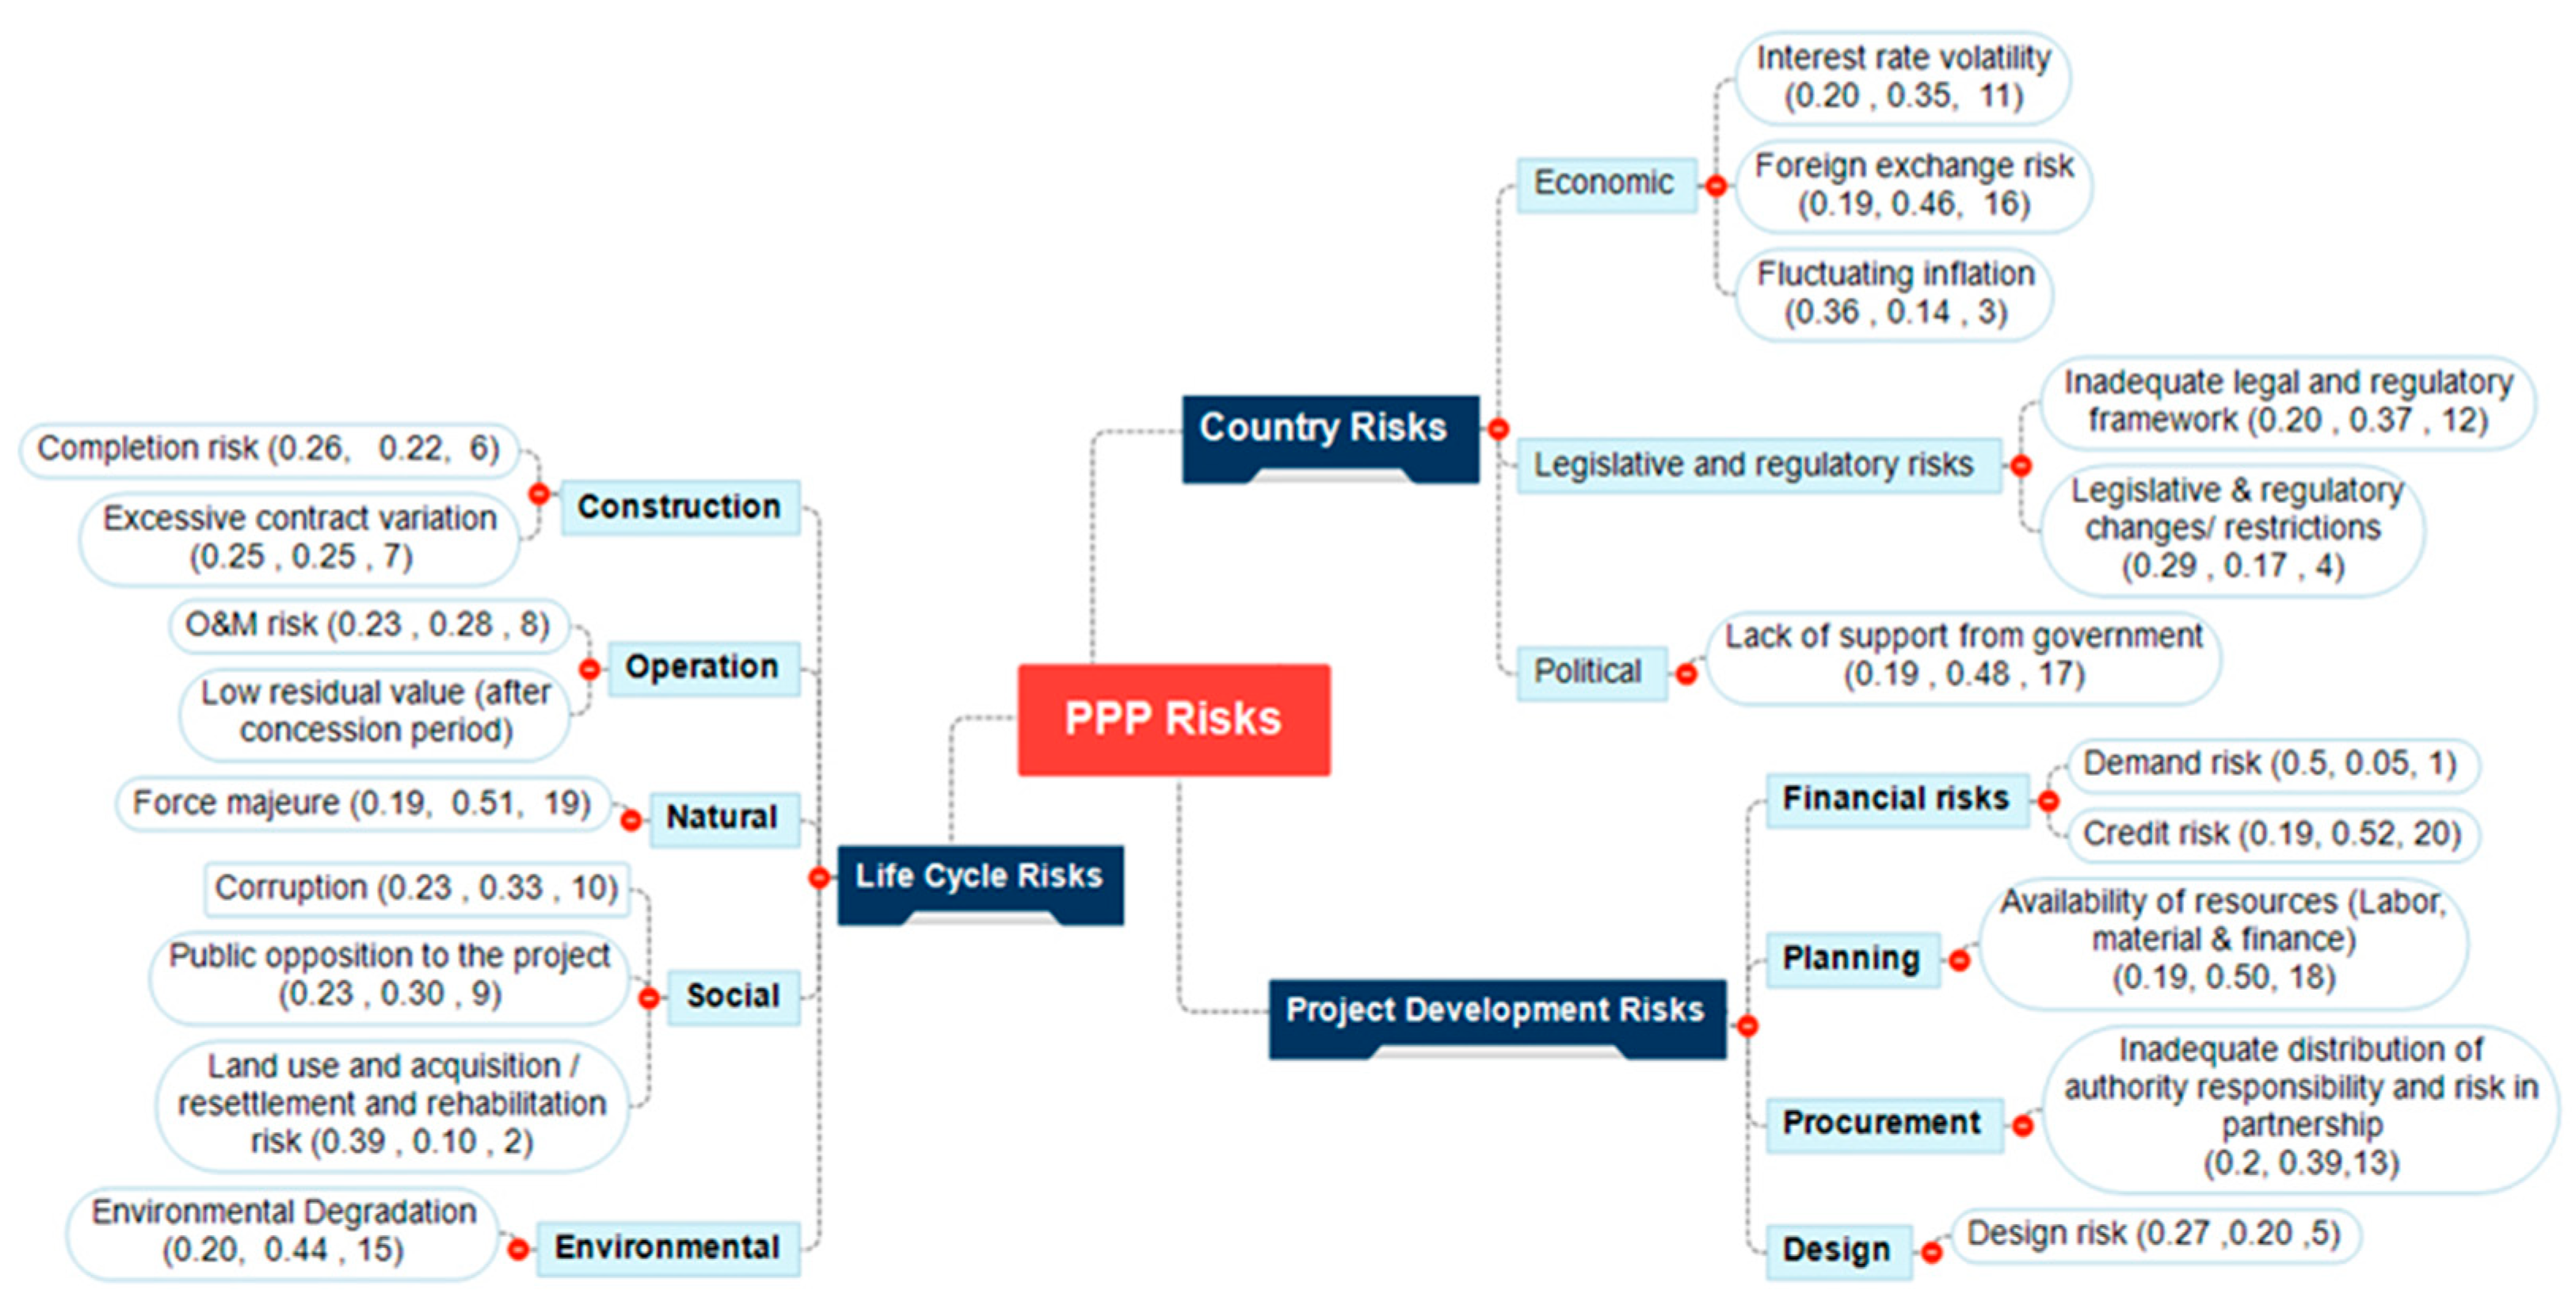
3.2. Critical Risks of P3

Studies published between the years 2000 to 2020 were identified through rigorous content analysis for identifying risks relevant to P3 infrastructure projects. For the literature review synthesis, 134 risk factors were recognized initially from 44 relevant studies. Similar factors were merged into representative categories and sub-categories, consisting of 70 unique global risk factors. A detailed taxonomy of these factors is shown in Table S1. To synthesize the risk factors for assessment, 20 risk factors (R) were shortlisted for further analysis from 70 unique factors based on a higher relative literature score as shown in Figure 2. This literature score was calculated based on both quantitative and qualitative assessments through Equation (1) [62,63]
Literature   Score = Qualitative   Score   ×   Quantitative   Score
For quantitative assessment, the frequency of occurrence (f) of a certain risk factor was noted at first. The factors were then qualitatively analyzed for their impact over a range of low (1), medium (3), or high (5) scales through a full-text content analysis of the journal articles. The articles were thoroughly scrutinized to explore the contextual significance of the risk factors. Finally, the two scores were combined to form a literature score as per Equation (2) [62,64].
  LS = Qualitative   Score   ×   ( Frequency   of   risk   ( f ) Total   frequency   ×   Highest   Score )
Cumulating the literature score, the risk factors contributing to over 50% of the overall literature score were shortlisted.
As shown in Figure 2, 20 risk factors (R) were shortlisted for further analysis based on the values of LS determined through Equation (2). Please note that in the taxonomy, each risk factor is shown with notation Risk Name (QS, CS, and Rank) representing its name along with qualitative score (QS), cumulative score (CS), and assigned rank. The description of all the shortlisted risks is provided in Table S2.

4. Research Methodology

To conduct a sustainability-based risk assessment, the study followed a three-phase process as shown in Figure 3. At first, a ‘study concept’ is developed based on a preliminary literature review. Based on this, three phases of project risk management are highlighted for the incorporation of sustainability considerations. These phases are labeled as A, B, and C and later explained in Section 4.1. The methodology corresponding to each phase is subsequently labeled as ‘research methodology’ in the figure and explained in Section 4.2.

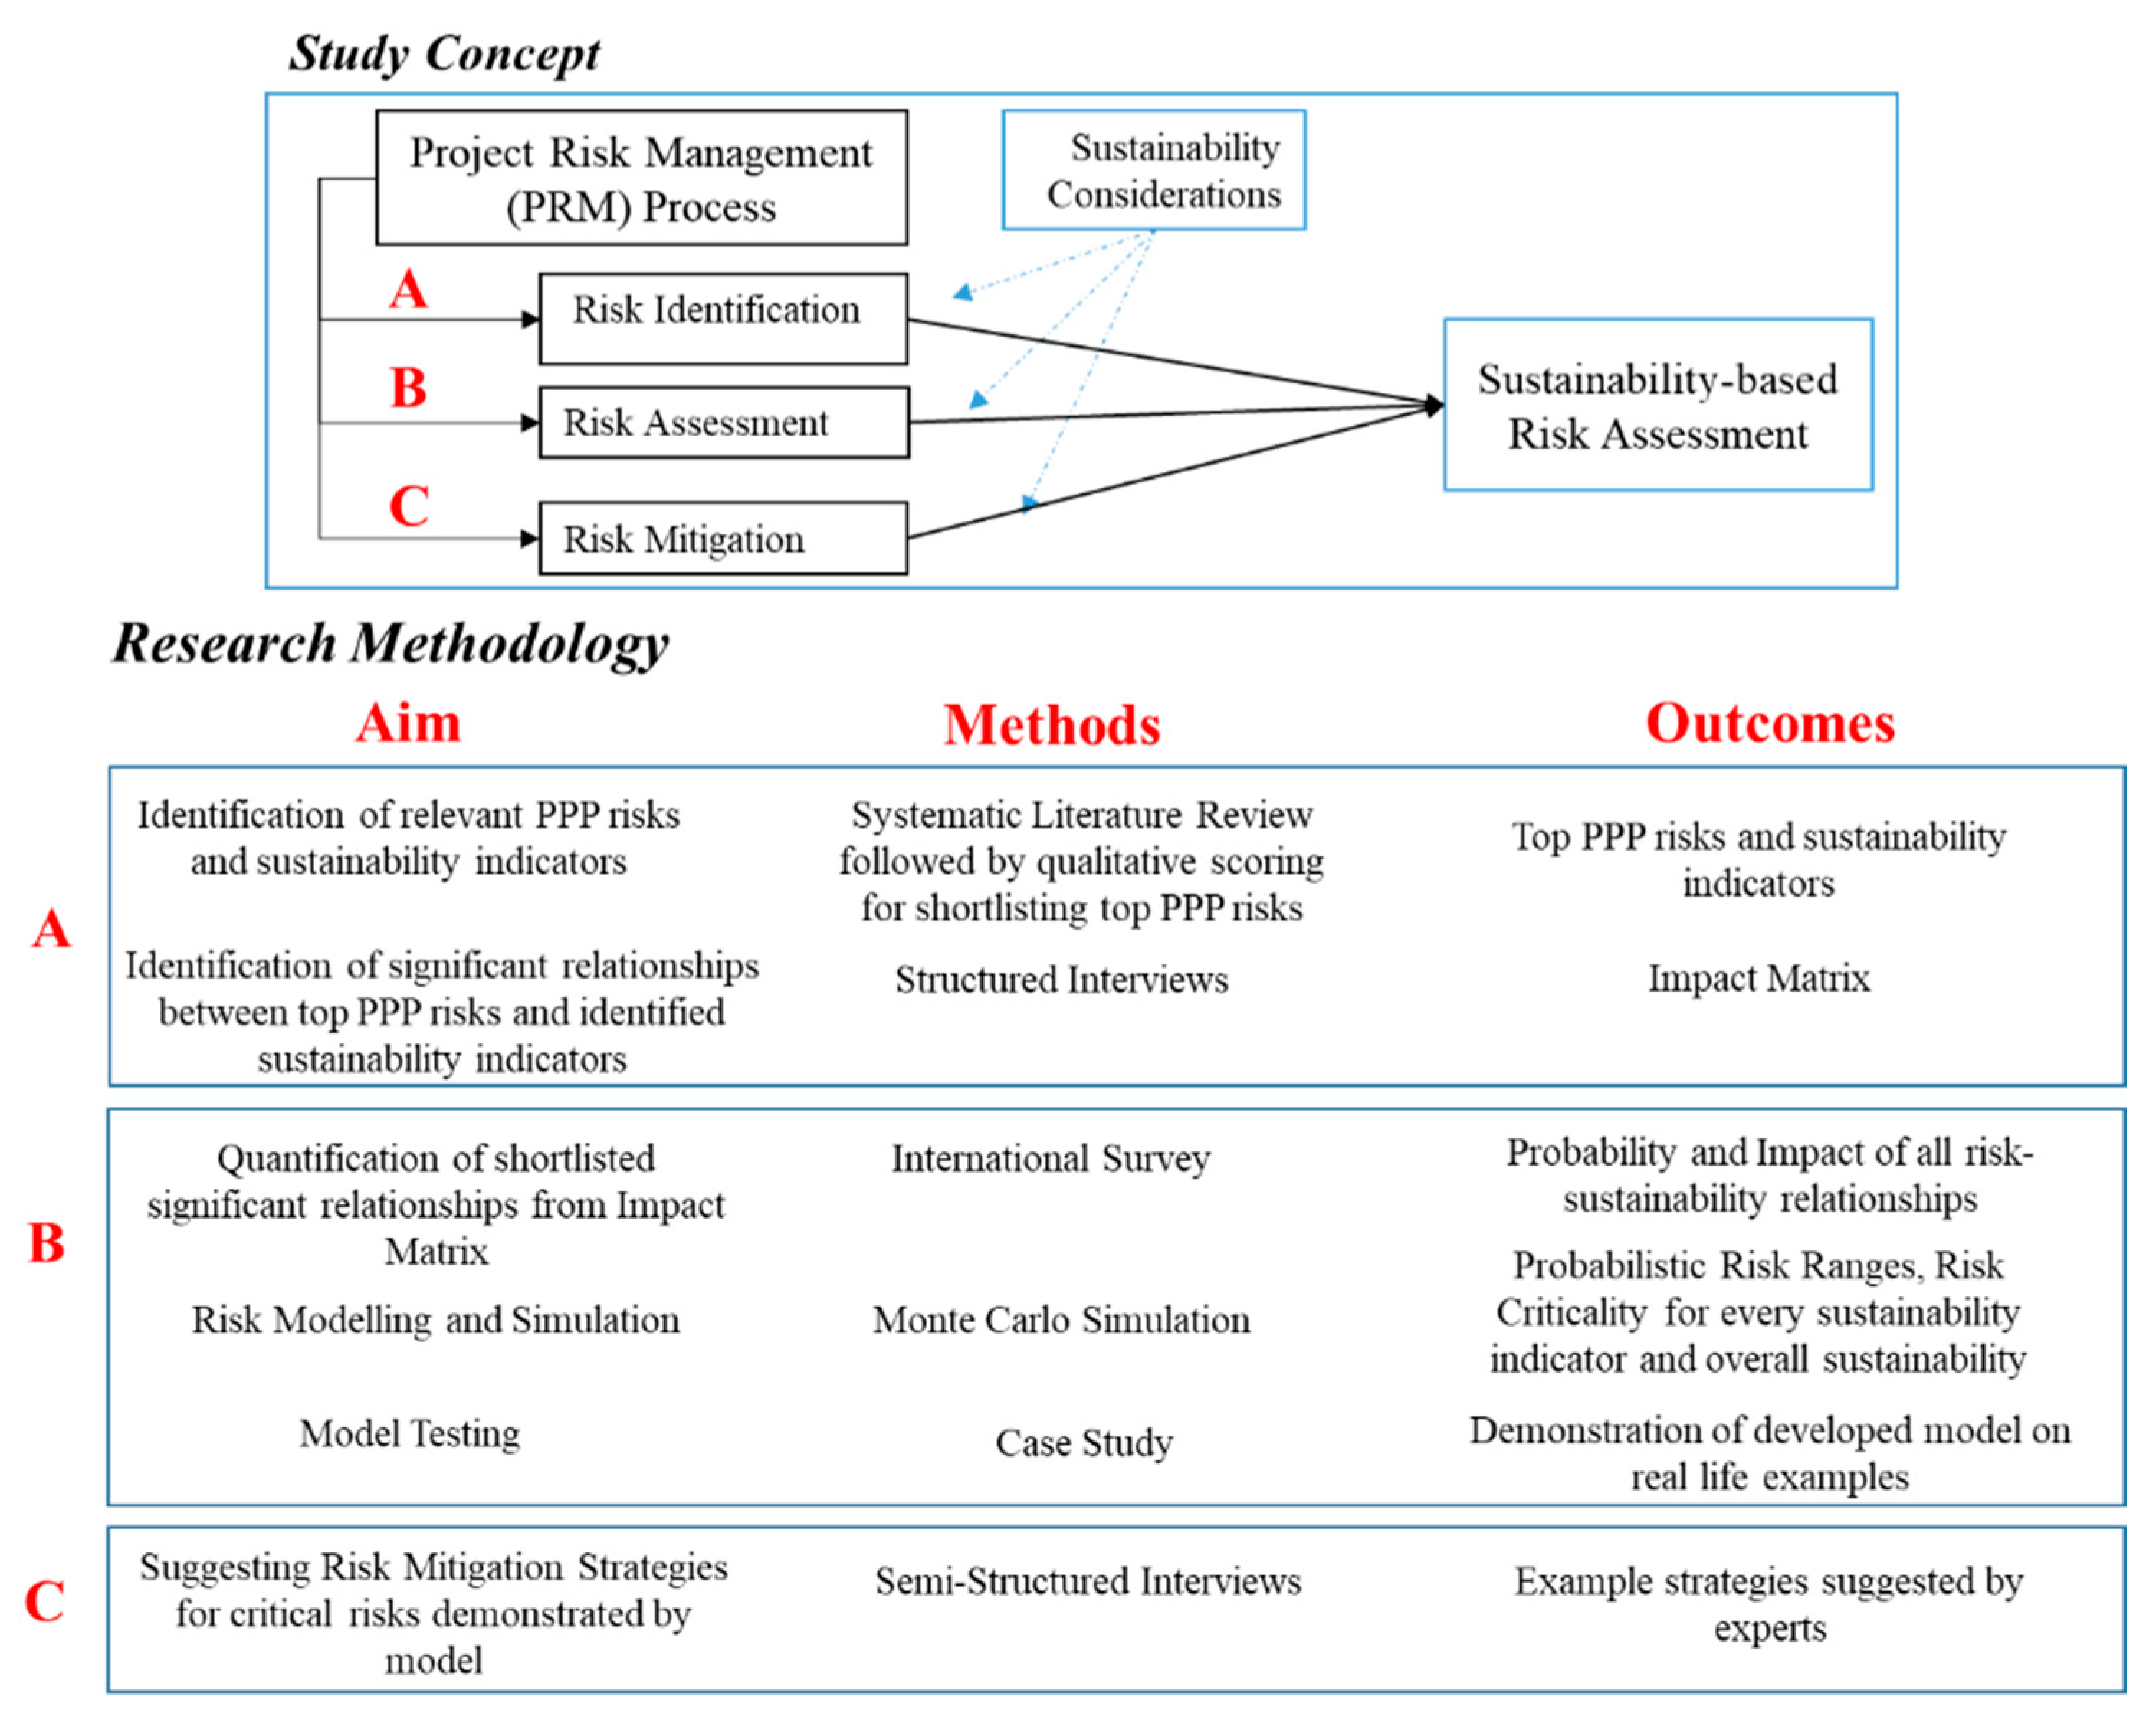
4.1. Sustainability-Based Risk Assessment Methodology

First, a systematic review of published literature was performed to identify P3 risks, called critical risk factors (CRFs) and suitable sustainability indicator groups explained in Section 3.1 and Section 3.2, respectively. Further, an impact matrix is developed to highlight significant risk–sustainability relationships ( R n S x ) through structured interviews. Then, the probability (Pi) and impact (Ij) of the risk factors are estimated through expert opinion through an international questionnaire survey. The survey results are then modeled using the Monte Carlo simulation (MCS) method and identified probabilistic risk ranges. By using multi-step regression analysis, risk weightings of all sustainability indicators are measured. The findings of the study are finally validated through real-life case studies and mitigation strategies are developed for CRFs using semi-structured interviews. Details of the methods adopted for the research outcomes have been fully explained in Section 4.2.

4.2. Data Collection

The data collection has four main parts: (i) structured interviews for shortlisting risk-sustainability relationships, (ii) an international survey for conducting a probability-impact assessment of risks, (iii) semi-structured interviews for devising risk mitigation strategies and rating of risks, and (iv) contextualizing and validating the findings through project case studies.

4.2.1. Structured Interviews

To shortlist the significant relationships between individual impact categories (SI1–SI10) and risk factors (R1–R20), structured interviews were conducted. For this purpose, a qualitative impact matrix of 20 × 20, consisting of 200 possible relationships was formulated. A focus group of five professionals from academia, having a relevant background to the study, was selected. The demographics of the respondents for the focus group study are shown in Table 2 which increases the credibility of these findings since both academic and industry domains are represented by substantially qualified and experienced professionals.

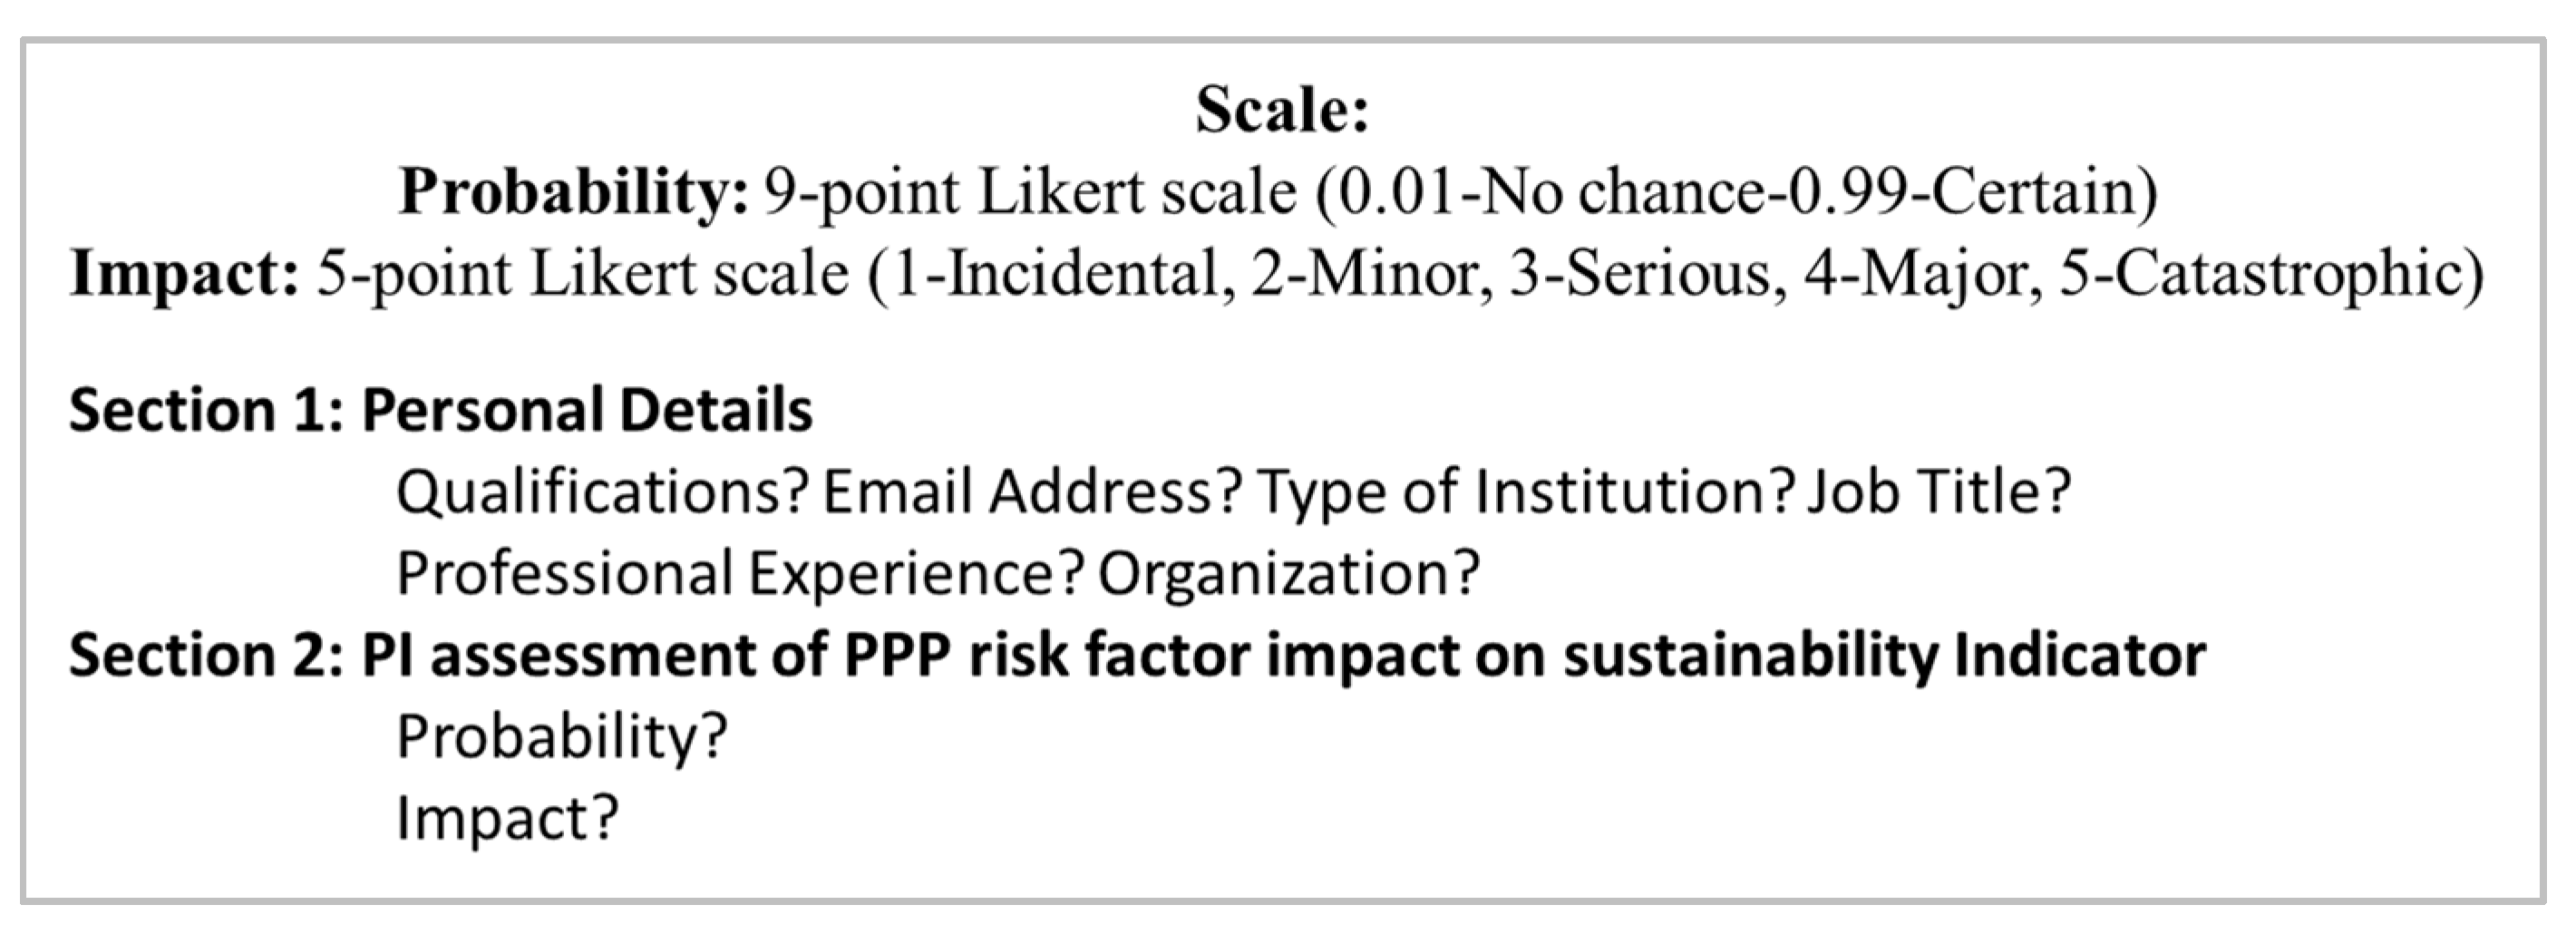
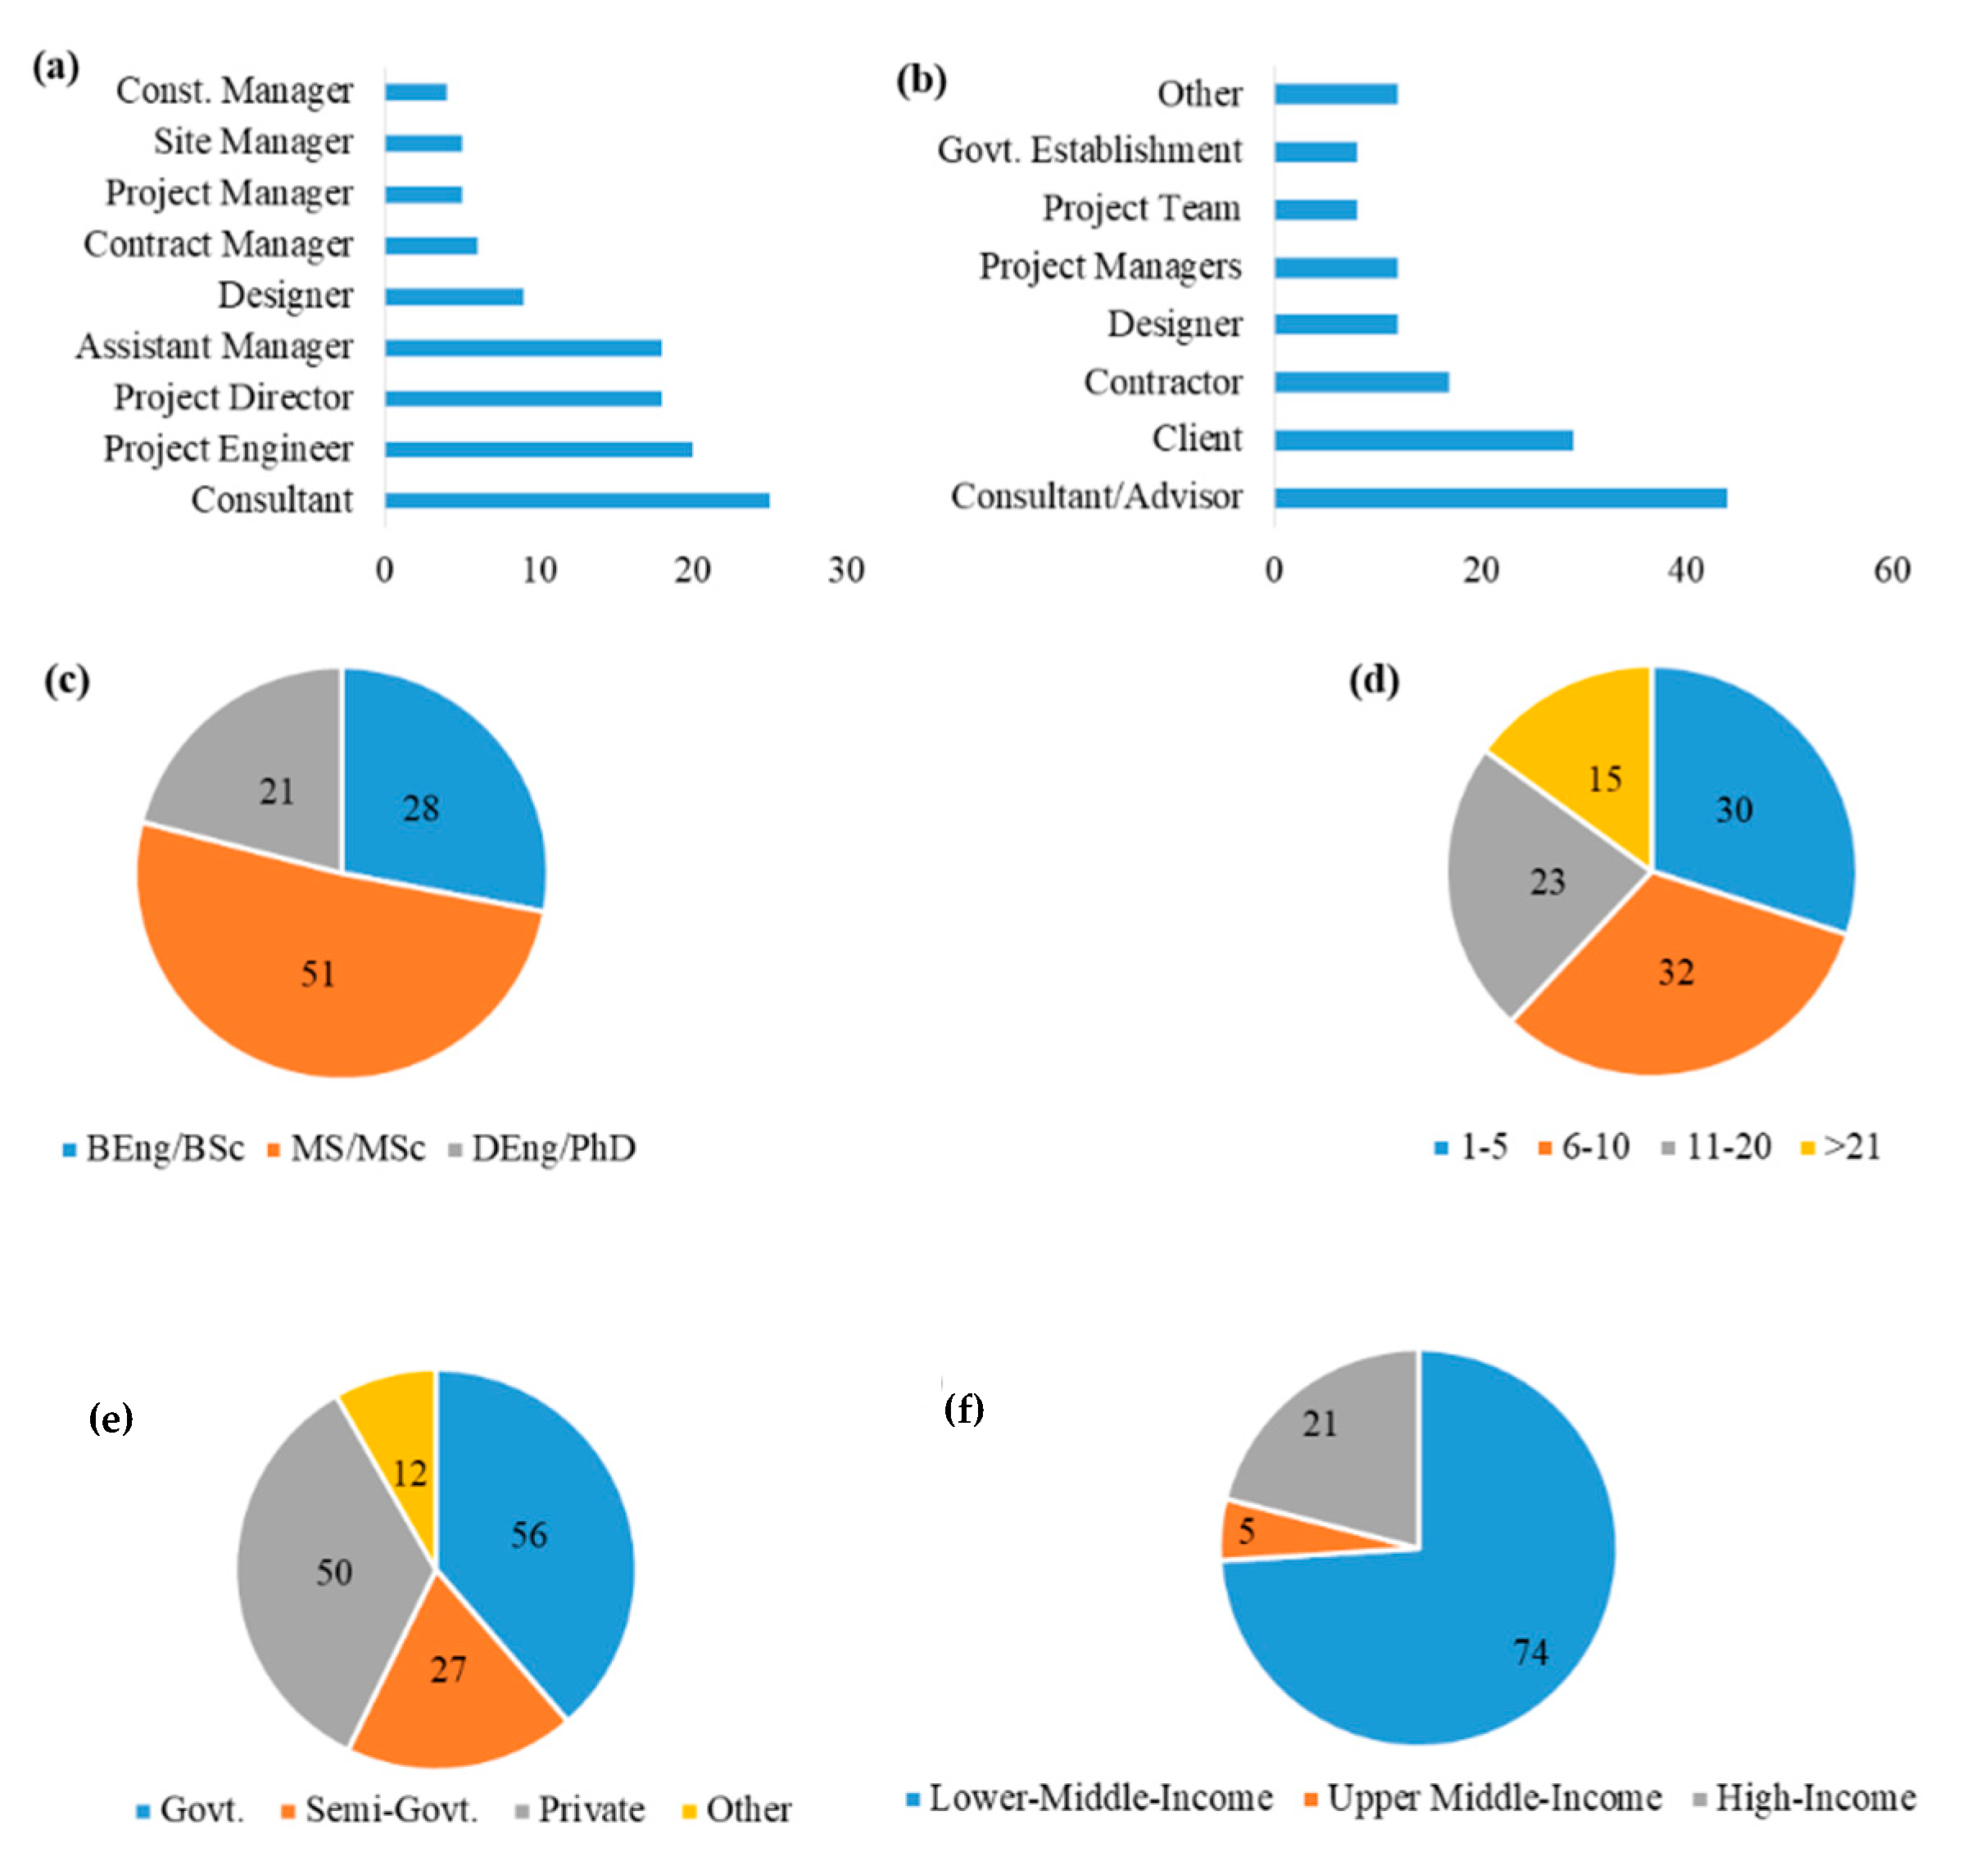
4.2.2. Questionnaire Survey

To conduct a probability-impact assessment on the shortlisted 68 relationships, an international online survey was conducted using Google Forms. Adopting this method helps reduce response bias of social desirability, extreme opinion, and demand characteristics of being involved in a survey [65]. Following the snowballing technique [66], over 1500 experts from industry and academia were approached via emails and online social and professional networks. This helped ensure a random sample to prevent any sampling bias. The respondents were asked to rate the probability of occurrence of each risk-indicator relationship in the format shown in Figure 4. To control the contextual interpretation of the posed questions based on the predisposition and perception of the respondents [67], each question was supplemented with relevant details to maintain coherence and reduce any response bias.

4.2.3. Semi-Structured Interviews

Furthermore, relevant project experts with a minimum of ten years of experience were interviewed regarding issues faced during project implementation and relevant risk mitigation strategies to overcome such issues for future projects. This was a lesson learned exercise giving useful insight into the on-ground reality of project execution. They were also asked if they agreed with the model results, identified critical risks, rankings developed, and any other risk that they would like to suggest. Interviewees’ information is shown in Table 3.

4.2.4. Case Study Development

To demonstrate the model, two comparative case studies of P3 motorway projects were identified. The information of the case studies was collected through project documents such as feasibility reports, evaluation reports, risk registers, newspaper articles, and expert opinions. The projects are briefly described in Table 4.

5. Development and Implementation of the Model

The model’s development and implementation have three parts. First, the possible relationships of risk factors and sustainability indicators are explored in Section 5.1. Afterward, a probability-impact assessment is conducted for the significant relationships in Section 5.2. Finally, the model for sustainability-based risk assessment is presented and simulation results are discussed in Section 5.3.

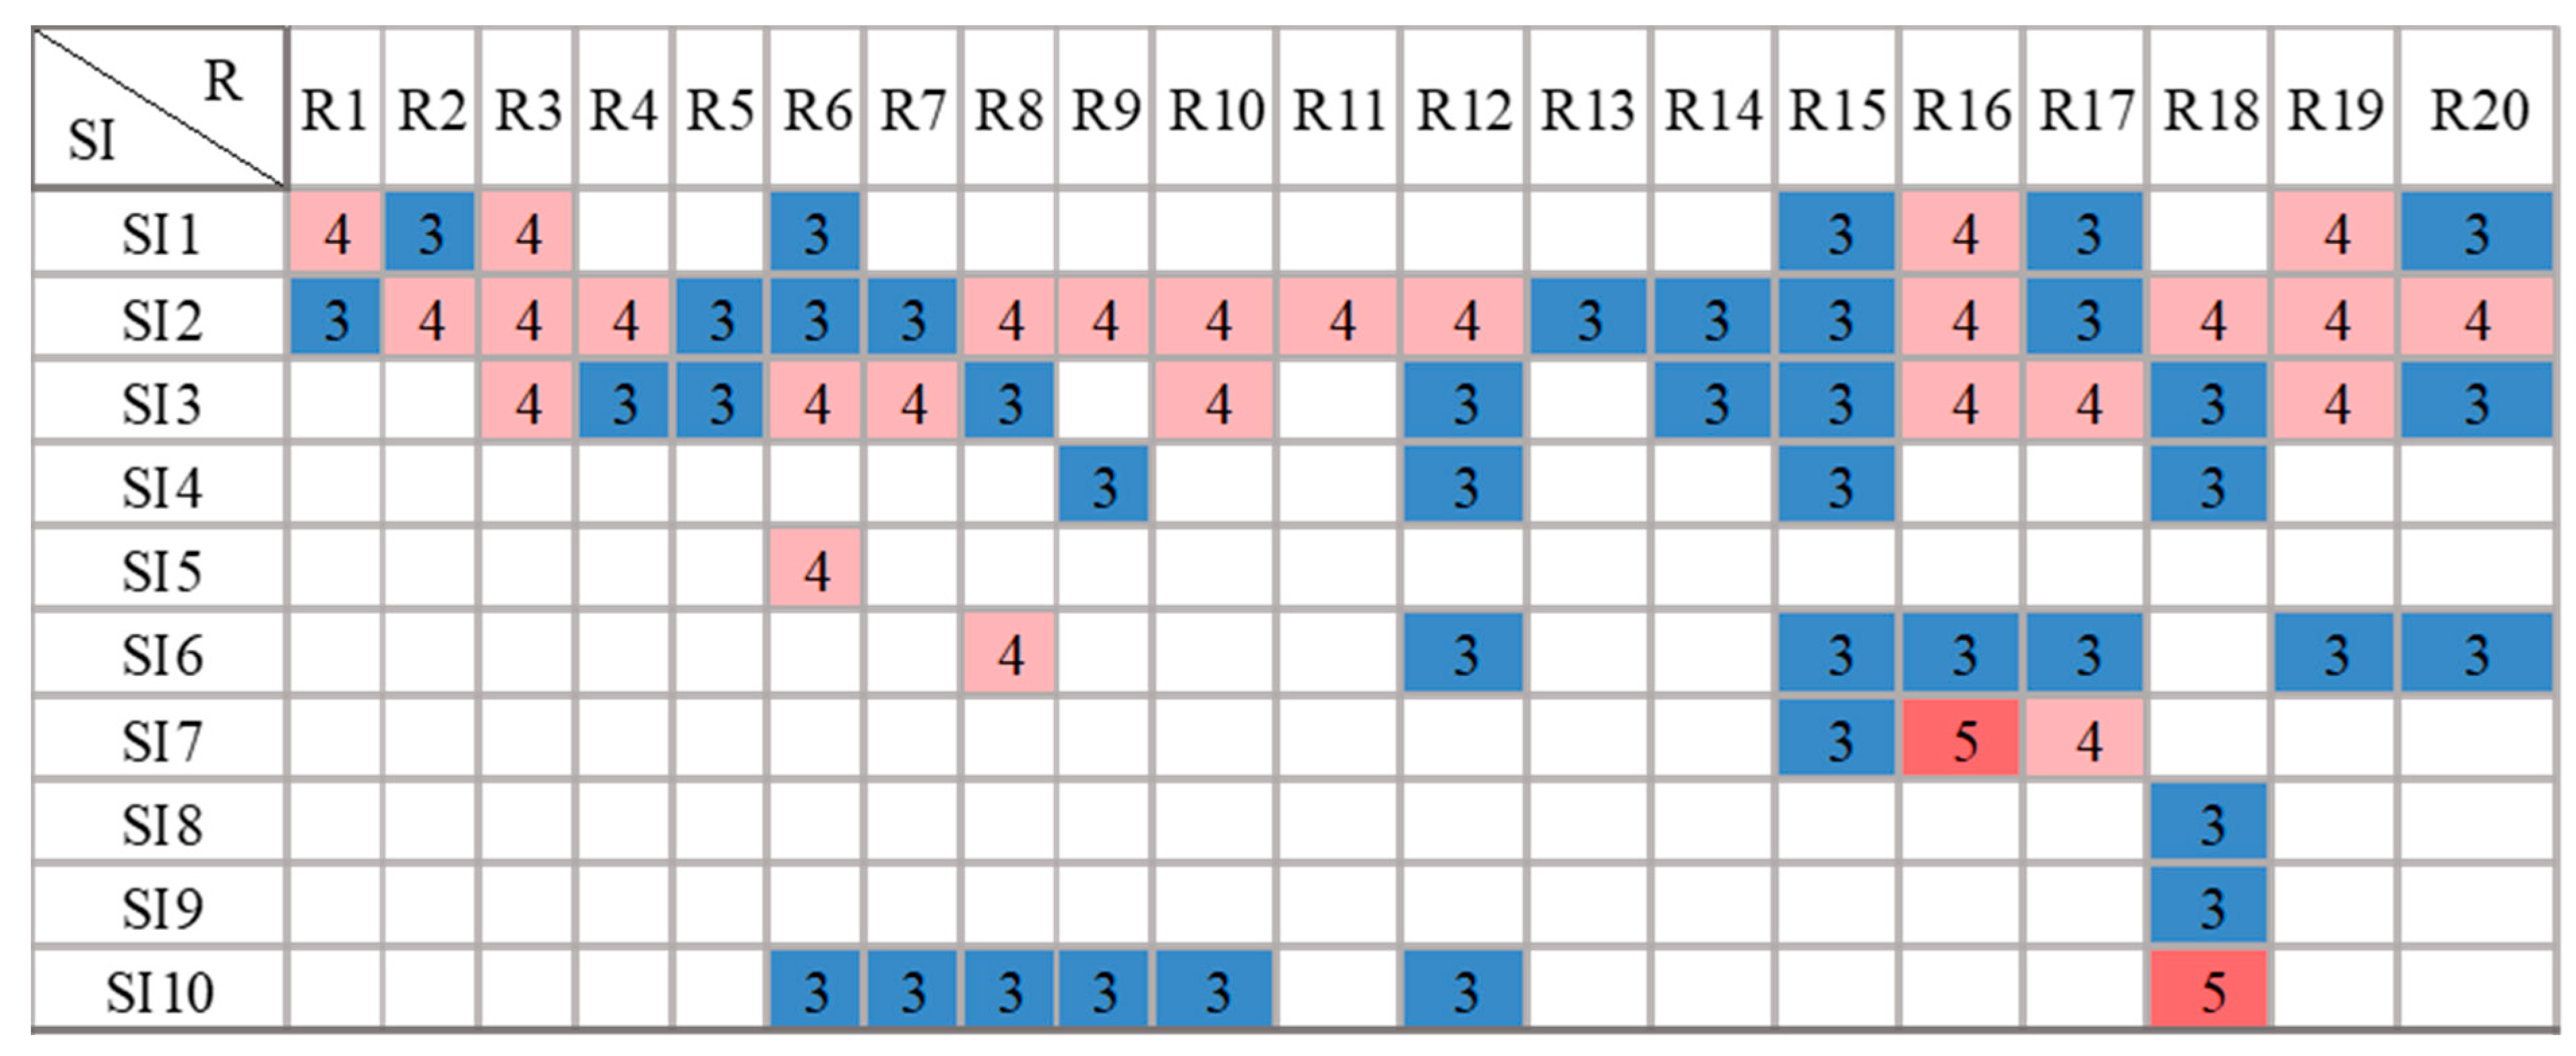
5.1. Impact Matrix for Significant Risk–Sustainability Relationships

Based on the rating through structured interviews, 68 significant relationships were identified as shown in Figure 5. It is difficult in P3 infrastructure projects to trace the impact of a certain risk on relevant sustainability indicators. Therefore, the impact matrix helps decision-makers in reaching a less complicated strategy for further assessment of selected risks. From the figure, it is apparent that life-cycle cost (I2), a financial sustainability indicator, shares a significant relationship with all the shortlisted risks. This implies that all significant risks directly or indirectly affect the life-cycle financial performance of the project. Similarly, socio-economic repercussions (I3), which is a social sustainability indicator, are affected by 15 significant risks. On the contrary, cultural heritage (I5), resource damage (I8), and ecosystem damage (I9) show only one significant risk relationship. Notably, the number of risk–sustainability relationships provides an overall insight into the consideration of relationships in the later stage of the analysis. For example, resettlement and rehabilitation risk (R6) is the only risk significantly impacting cultural heritage (I5) but it has a significant relationship with 5 out of 10 sustainability indicators. Thus, a detailed analysis of these relationships is required to obtain a deeper insight into the complex risk system for sustainability.

5.2. Sustainability-Based Risk Assessment Model Development

The risk model was demonstrated using the interrelationships assessed from the impact matrix. Model inputs and outputs were defined based on dependent and independent variables, and their interrelationships. Each of the 68 probabilistic risk distributions of individual risk-sustainability indicator relationships was used as an independent input to the model. The developed generic statistical model is given in Equations (3) and (4) where R si is the indicator risk index, P ri is the probability of risk impacting sustainability indicator, I ri is the impact of risk, and R ts is the risk index for total sustainability.
Risk   Index   for   any   sustainability   indicator = R si = 1 i n ( P ri × I ri )
Risk   Index   for   total   sustainability = R ts = 1 i n R si
The model is based on the following assumptions and limitations:
(1)
All risks are threats, and all sustainability impacts are positive benefits and opportunities.
(2)
All risks occur independently.
(3)
Data is not assumed to be normally distributed.
First, the risk index value for each relationship ( R n S x ) was obtained following the Vose [68] PI model for risk measurement. The risk index values were then normalized using the divide-by-maximum (DBS) method [69]. To find the best-fit curve for each of the relationships assessed, distribution fitting was applied using the chi-squared statistic [70]. MCS was then run using the mean values R si to assess the sensitivity of the indicators towards the risks. The analysis was run for 1 simulation and 5000 iterations using Latin hypercube sampling, which uses random stratified sampling [71]. MCS uses stepwise multiple regression to rank each indicator based on their level of risk, the generalized regression models for which are represented by Equations (5) and (6).
Risk   on   sustainability   ( R ts ) = i n n rc i   ×   R si + c i
Risk   on   sustainability   indicators   ( R si ) = i n n rc i   ×   ri + c i

5.3. Probability-Impact Assessment

Using the shortlisted risk-sustainability relationships, a PI-based risk assessment was conducted for which the data for the probability (P) and impact (I) of each relationship was collected using the international survey which was further used for simulating risk impacts.

5.3.1. Statistical Characteristics of International Survey Data

A total of 150 valid responses were obtained against the required sample size of 96 responses for a population size of 40,000+ with a sampling error of ±10% at 95% confidence [72]. The demographic information of respondents is shown in Figure 6. Figure 6a shows that consultants and project engineers represent the largest cohort of the respondents, and the three main stakeholders (consultant, client, and contractor) were sufficiently involved in data collection as shown in Figure 6b. Furthermore, almost three-fourths of the respondents (72%) had a postgraduate qualification (Figure 6c) and almost half of them (48%) had a professional experience of over 10 years (Figure 6d). Lastly, all the major organizational types, government, semi-government, and private, were significantly represented by the respondents (Figure 6e), and almost three-fourths of them (74%) belonged to lower-middle-income countries (Figure 6f).
For the international survey, several statistical methods were applied using SPSS Statistics 24 to test the validity of survey responses. The metrics of Cronbach’s Alpha (α) and corrected item-total correlation (CITC) were utilized to check the internal consistency and reliability of the scale. In total, 136 relationships were tested for which values of α and CITC were in the ranges 0.513–0.912 and 0.7–0.956, respectively. Both these ranges are above the recommended limits; >0.5 for CITC and >0.7 for α [70]. Furthermore, the respondents belonged to three major groups based on income: lower-middle, upper-middle, and high-income as per World Bank classification. As the number of groups was >2, the datasets were unequal and not assumed to be normally distributed. Therefore, Kruskal-Wallis H-test and effect size (ES) was performed to test if the responses were significantly different based on their geo-economic distribution. Out of the 136 tested cases, H0 was rejected for 32 cases. Since, Cohen [50] suggested that if ES < 2xSD (standard deviations), the effect can be regarded as insignificant, and the results can be generalized for the entire dataset. For all the cases tested, ES was within 1xSD. Thus, the data was found to be internally consistent, homogenous, and reliable. Moreover, the concern for bias in the responses has been addressed qualitatively while designing the questionnaire instrument and selecting methods explained before.

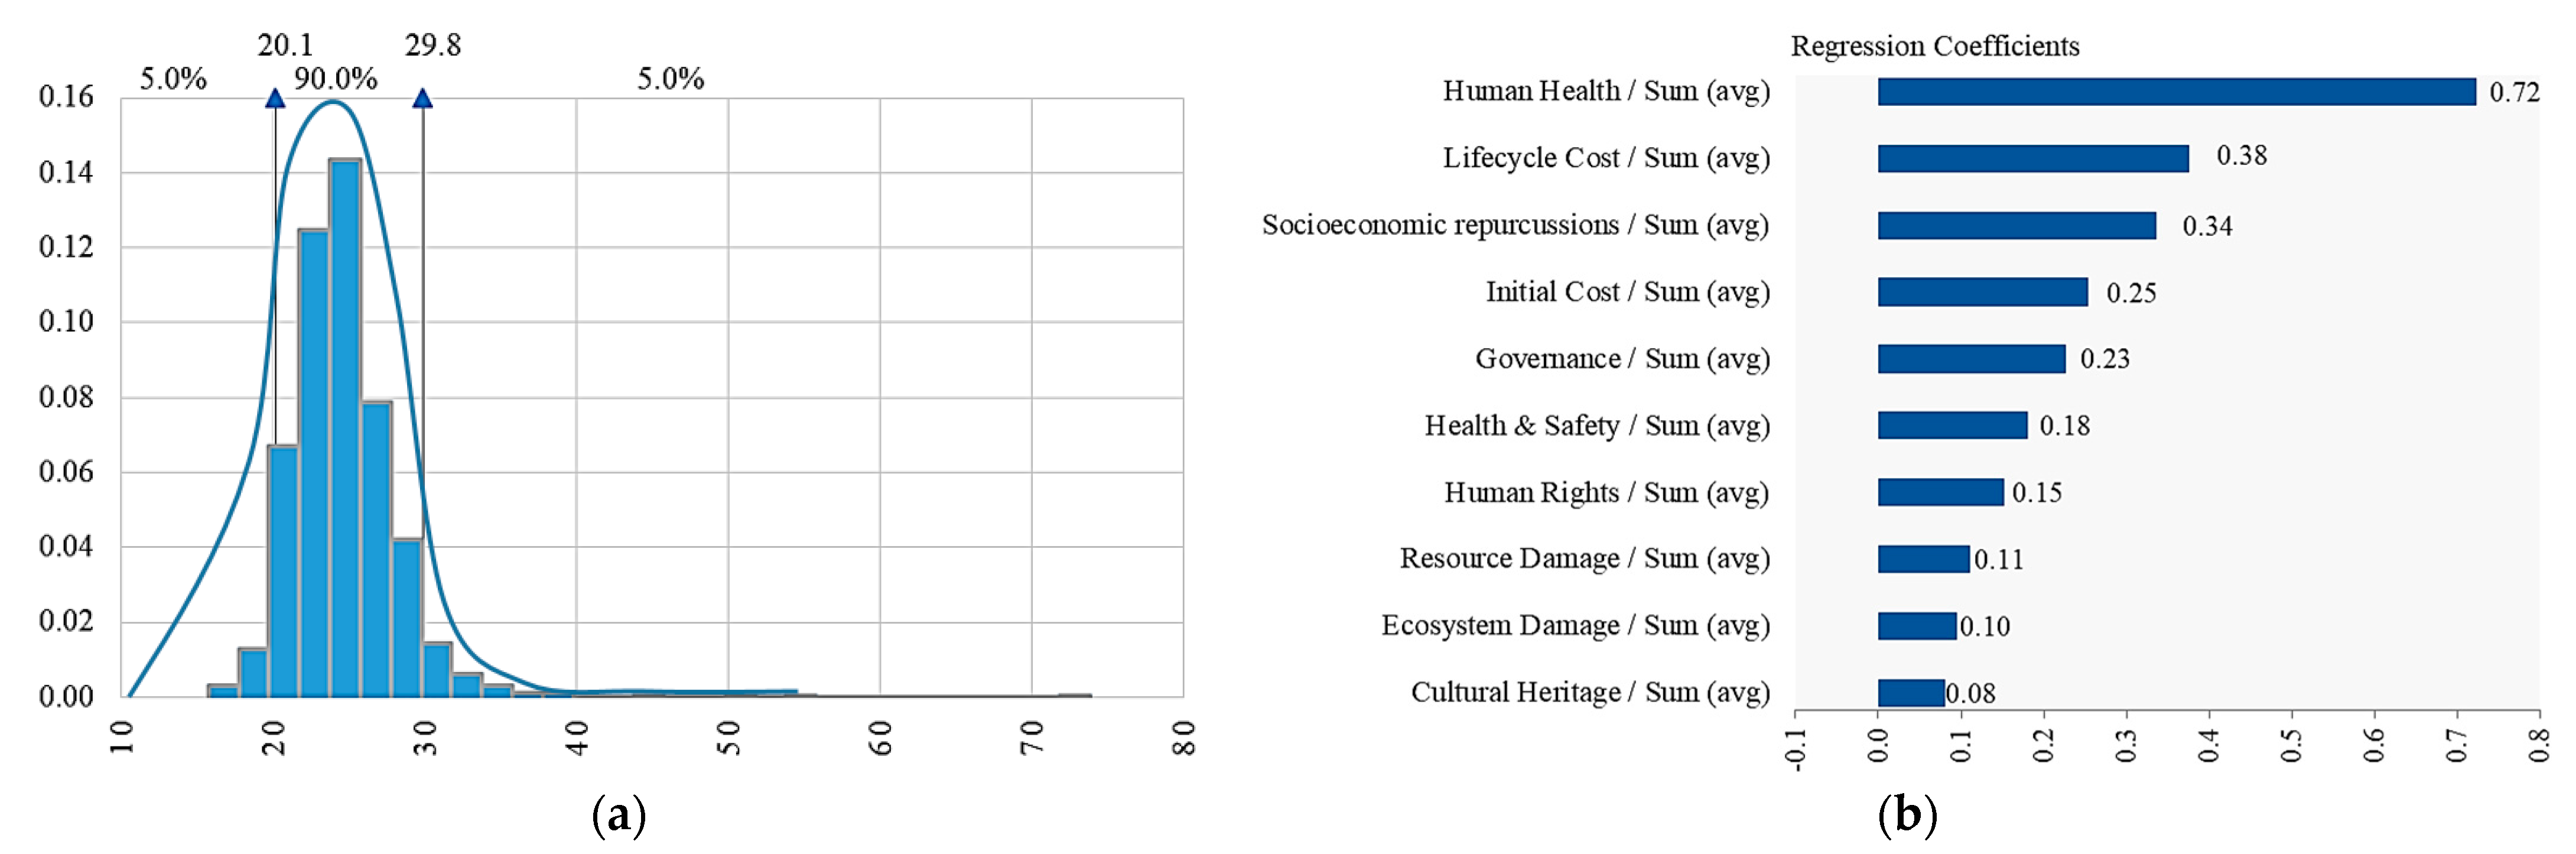
5.3.2. Modeling and Simulation

For each sustainability indicator, the probability density functions (PDF) were simulated using MCS to obtain probabilistic mean risk ranges as per Equations (3) and (4). The simulation results are summarized in Table 5. The probabilistic risk distributions were then modeled to reflect the overall risk impact of total sustainability through Equation (5). Overall, the mean risk index value for sustainability is 24.83 with a 45% probability that the risk will be above this value as shown in Figure 7a. However, the minimum and maximum risk limits can be used to develop risk threshold or tolerance limits. Overall, there is a 90% probability for the risk being in the range of 20.1–29.8. This implies that there is a 95% chance that the mean risk will be 24.83. The minimum value of the overall risk for sustainability is 17.82 and the maximum is 68.18. This implies that for a given P3 highway project, the overall estimated threat level ranges between 17.82 and 68.18 on a true scale if all the considered risk factors act together. These values can be used as minimum and maximum risk threshold levels for decision-making. A tornado diagram for overall sustainability ranking is shown in Figure 7b where human health is found as most sensitive to risk with the highest range for completion risk. This implies that if projects fail to complete within the stipulated time, the most significant impact will be on human health due to the increased and prolonged exposure to pollution, emissions, dust, and smoke causing both physical and emotional trauma.
Notably, the life-cycle cost has a maximum number of risks acting on it but is ranked lower than human health. This is due to the often-predictable nature of cost impacts with well-defined mitigations [51]. For social sustainability, the socio-economic repercussions indicator has the highest value of the risk index. This is because of the contextual variation between projects. Unforeseen risks can also create wide-ranging impacts and socio-economic repercussions. Regression modeling was then carried out for all the sustainability indicators to calculate the weights of their impact on total sustainability as expressed in Equations (5) and (6). The results revealed the sensitivity of every sustainability indicator for P3 risk factors. The same is represented here in Figure 7b through a tornado chart which ranks the dependent variables (risks) on basis of their effect on independent variables (sustainability indicators) based on their comparative regression coefficients.
In the case of total sustainability, this ranks the indicators in order of their impact on the overall sustainability risk on the project presented in Equations (5) and (6). Generally, the regression coefficient value signifies the measure of the change in output per unit change in input. It is noted that the effect of each risk is assessed independently. Therefore, this analysis is useful to identify the focus of a risk chain on a particular impact. The derived regression equations for each of the sustainability indicators are represented as Equations (8)–(14) in Table 6.

6. Model Validation through Case Studies

The application of the sustainability-based risk model is presented in Table 7. In the case studies, the values of risk for total sustainability are calculated using Equation (5). For M-2, this value is 50.3. However, for M-11, the value is 43.4. These values are relative and can be used for project comparison or alternative selection during feasibility aiding risk assessment. Each of the risks was rated on a scale of 0–1 for their impact on the project. The sum of the risk level on each indicator was then multiplied with the regression coefficients obtained in Equation (5) to get the values of Rsx for each sustainability indicator. The regression coefficients (rc) obtained from the software are represented in terms of standard deviation (SD). These values are multiplied with SD of output and divided by SD on the input to get the descaled value of rc (Drc). For example, to obtain Drc for IC, we use the calculation as follows: (0.25∗3.67)/1.39 = 0.66, where 3.67 is the SD for TS. These descaled values are then used to calculate the risk level on each indicator, Rsx. Finally, the values of Rsx are compared with the risk ranges obtained in Table 8 to see the risk performance of all sustainability indicators and the total sustainability, sustainability indicators, and total sustainability. All indicators except LCC have risk values in the range defined through simulation of the general risk model. This reflects on the robustness of the model and its capability to be used as a reliable tool for risk assessment. In the case of LCC, the risk values show abnormality because of the high level of country-related risk in the case of Pakistan.

6.1. Lahore-Islamabad Motorway Overlay and Modernization Project (M-2)

During the construction, the project faced a lack of coordination and communication between the stakeholders as quoted by the DPM office. The increased risks of rework were due to poor quality management and the rushing through of the work. A follow-up inspection issued nonconformance for a 6-km patch and was served a reconstruction notice. Since the road has gone into operation, accidents occur frequently on several blind sections, especially the section crossing the salt range. Patrício and Ferreira [73] surveyed road users to identify the influencing accidents on motorway M-2. It was found that careless driving, dozing off at the wheel, a continuous crossing of the yellow line while driving, brake failure in hilly areas (salt range), tire burst, and improper informatory signs on M-2 are significant causes. Apart from human life loss in accidents, animals are also frequently hit by passing cars as the motorway is located in rich habitat. A study reported the fatality of at least 392 animals during a two-year study period [74]. In this scenario, mitigation strategies S1, S2, and S3 can significantly help improve the health and safety situation on M-2 as suggested in Table 8. When the value of risk on LCC is compared with the defined limits, it surpasses the expected values. This can be attributed to the fact that on M-2, project demand and frequent contract variations are high. These risks are translated into the unexpected rise in toll rates increasing the risk of public opposition to the project. In the contract for M-2, it was the responsibility of the client, the National Highway Authority (NHA), to issue a public notice before any increase in toll, or changes in the contract. However, the toll was increased by 10% in 2020 without warning. This is in line with the issues identified by experts. The relevant mitigation measures for such a risk can be S4, S5, S6, S7, and S8. It should also be noted that the use of recycled asphalt was considered in the M-2 project, but this was not used after initial lab tests due to apparent non-conformance of standards. The mitigation strategies E1, E2, and E3 can help reduce the risks. The risk of the availability of resources remained very high in the project. For example, it was envisaged in the project documents that the performance grade bitumen/super pave method would be used but the required machinery and experienced staff were not available. The suggested mitigation strategy, in this case, can be F1, F2, and F3 (see Table 8). The risk-on resource and ecosystem damages are very high for the M-2 project due to an increase in air pollution. Khalid, et al. [54] found significantly raised levels of carbon and nitrogen in the vegetation in surrounding areas of M-2. So, E4, E5, E6, E7, and E8 are the relevant mitigation measures that can help keep toxicity levels under control.

6.2. Lahore–Sialkot Motorway Project (M11)

Like M-2, risks on financial sustainability indicators were quite high for M-11. This is prevalent from the increase in budget from 14 to 44 billion, devaluation of the currency, and delay of the project for several years. Such a risk scenario can be better managed by adopting F1, F2, F3, and F4 strategies (see Table 9). On the motorway, the safety risk is high due to lack of traffic police invigilation, and a high number of accidents, robberies, and even sexual assault have been reported deeply impacting governance and discouraging travelers from using the road, impacting the project revenues. Strategies S1, S2, S3, S4, and S5 can be used to overcome these issues (see Table 9). Additionally, there are no service areas or petrol pumps on the motorway which causes a nuisance, especially for nighttime travelers, increasing the risk of social disapproval. Strategies S6 and S7 can be beneficial for the improvement of this issue. This situation has worsened over the recent COVID-19 pandemic, as the number of on-duty staff has reduced due to social distancing. Situated very near the border, the motorway also holds a strategic position in case of border tension. It has also been reported that the local language is not written correctly on the signboards hurting public sentiment and increasing the risk of damaging cultural heritage. To reduce cultural heritage impacts, strategies S7, S8, S9, and S10 can be used. From this discussion, it can be deduced that prior detailed assessment can prevent hidden long-term impacts of the projects.

7. Proposed Implementation Framework

A heuristic framework to enable sustainable risk management in actual P3 projects is presented in Figure 8. Incorporating risk assessment and case study results, the framework proposes a reformed risk register for the purpose, which can be used as a tool for the assessment of the project (refer to Figure 8). Firstly, a risk breakdown structure is developed categorizing the risks over the P3 project life compatible with sustainability ideology. For shortlisting risks for further assessment, the identified risks are rated individually. Secondly, to perform a sustainability integrated risk assessment, a life-cycle approach is adopted modifying the risk assessment process. Although the current study has not extended the risk assessment to analyze the changes in risk impacts during different project stages systematically, it has addressed the notion of life-cycle dynamics by analyzing the risks ( R x ,   R y , R z , R n ) for their impact on sustainability indicators ( SI xn ,   SI yn , SI zn ) having both short- and long-ranging TBL impacts on the project environment. Analyzing the risk and sustainability impact interaction holistically is crucial in overcoming the short-term approach of the risk assessment process. This is a challenging task, attempted in the current study by a PI-based model by simulating the risk levels into probabilistic ranges and regression analysis for assessing the impact of individual critical risks on the sustainability indicators.
Project stakeholders are key to enabling risk–sustainability integration. An externally-based risk assessment is a keystone of efficient stakeholder engagement during the early planning of P3 projects, ensuring sustainability in (and of) the planning process. For this purpose, modifications in the risk register are proposed including columns for ‘affected stakeholders’ for each critical risk and how they will be affected by each CRF if it occurs by assessing the ‘nature of the impact on each stakeholder’. This can result in cost and time saving for separate stakeholder analysis, and social impact assessment forming integrated responsible teams. The developed risk register can be updated periodically to include dynamic life cycle changes. For example, stakeholders in P3 projects are of two main types: external ( E a ,   E b , E c , E n ) , and internal ( I i ,   I j , I o , I n ) . Both have different stakes in the project over the P3 contract duration. This is a possible future direction of the study. Other directions include studying the risk allocation structure for sustainability-based risk assessment.
In the current study, the sustainability indicators used for assessment are the sub-categories of sustainability indicators. For a purely quantitative study, inventory indicators need to be specified against these sub-categories for the desired application area through appropriate selection of the unit of analysis as presented in the “Future work” section of Figure 8. This will enable project managers to interpret sustainability under the project management umbrella and help conveniently and factually assess the real measure of risk impacts. In the proposed micro-level assessment at this stage, consideration of risk interrelationships, causalities, and the interrelations between sustainability indicators can be useful in proactively revealing issues. Though it may be impossible in concrete terms, various dynamic modeling techniques, like system dynamics, can be used for this purpose in the future.

8. Conclusions and Recommendations

The study has evaluated the impact of P3 risks on sustainability TBL. The impact of various risks is traced using a semi-quantitative approach. Through MCS, probabilistic risk ranges and risk levels are highlighted. This study helps P3 decision-makers to explore the long-ranging risk impacts over the dynamic project environment. Results reveal that human health damages are the most sensitive sustainability impact category sharing a very significant relationship with completion risk, creating unforeseen, comprehensive negative sustainability impacts. The study also reveals rich data for conducting more refined and sophisticated studies. The relationships established between the risks and sustainability indicators through the impact matrix help practitioners identify new causal information between the risk-sustainability interaction. The presented implementation framework in Section 6 also guides the practitioners to use our work in practice. In Figure 8 of Section 6, a risk matrix has been presented based on the results of this study which includes sustainability indicators that can serve as a simple tool of preliminary risk assessment in terms of sustainability.
Limitations of the study include the possibility of self-bias in risk categorization. To curb this, relevant literature has been consulted to keep logical consistencies in reasoning and theoretical constructs have been developed for the sake of a pragmatic assessment. Additionally, all the interviewees consulted for case studies had the same country of experience, Pakistan. Despite this, countries, where P3 is usually a natural choice for infrastructure projects, can benefit from the findings of the current study. Application of mitigation strategies in countries with different socio-political conditions and risk exposure may still be difficult. Future studies can improve upon this limitation. Another limitation of the study is its assumption of risks to be independent. Therefore, as a possible prospect, it is recommended to delve deeper into the quantification of impacts on inventory-level sustainability indicators. For a more accurate assessment, it can be useful to look into the life cycle assessment frameworks and identify the quantitative level indicators for sustainability-risk integration. Sophisticated dynamic modeling for risk assessment under micro-level risk interaction can be considered for this purpose. Future studies can consider modeling approaches such as agent-based modeling (ABM) or System Dynamics (SD) for the assessment of microlevel impacts. The use of fuzzy modeling can help quantify the qualitative factors in the study. Additionally, for future assessment, positive risks, and risks occurring due to the inclusion of sustainability criteria in P3 projects can be two interesting perspectives of the problem.

Supplementary Materials

The following supporting information can be downloaded at: https://www.mdpi.com/article/10.3390/su14010344/s1, Table S1. Literature Review Synthesis for Shortlisting Risk Factors; Table S2. Description of shortlisted risks.

Author Contributions

Conceptualization, M.J.T. and B.B.; methodology, B.B., H.A. and M.J.T.; software, B.B. and H.A.; validation, B.B., M.J.T. and K.M.M.; formal analysis, B.B., M.J.T., S.T. and N.A.; investigation, B.B., M.J.T. and T.Z.; resources, M.J.T., T.Z. and N.A.; data curation, B.B. and M.J.T.; writing—original draft preparation, B.B. and M.J.T.; writing—review and editing, S.T., K.M.M., T.Z. and N.A.; visualization, B.B. and H.A.; supervision, M.J.T. and T.Z.; project administration, B.B. and M.J.T.; funding acquisition, M.J.T. All authors have read and agreed to the published version of the manuscript.

Funding

This work was supported by the Higher Education Commission (HEC), Pakistan [grant number 20-4638].

Informed Consent Statement

Informed consent was obtained from all subjects involved in the study.

Acknowledgments

We acknowledge the help and support of experts in data collection and organizational support in developing case studies.

Conflicts of Interest

The authors declare no conflict of interest.

References

  1. Tallaki, M.; Bracci, E. Risk allocation, transfer and management in public–private partnership and private finance initiatives: A systematic literature review. Int. J. Public Sect. Manag. 2021, 34, 709–731. [Google Scholar] [CrossRef]
  2. Tariq, S.; Zhang, X. Critical Analysis of the Private Sector Roles in Water PPP Failures. J. Constr. Eng. Manag. 2021, 147, 04021015. [Google Scholar] [CrossRef]
  3. Cheng, Z.; Wang, H.; Xiong, W.; Zhu, D.; Cheng, L. Public–private partnership as a driver of sustainable development: Toward a conceptual framework of sustainability-oriented PPP. Environ. Dev. Sustain. 2021, 23, 1043–1063. [Google Scholar] [CrossRef]
  4. Kumar, L.; Jindal, A.; Velaga, N.R. Financial risk assessment and modelling of PPP based Indian highway infrastructure projects. Transp. Policy 2018, 62, 2–11. [Google Scholar] [CrossRef]
  5. Grimsey, D.; Lewis, M. Public Private Partnerships: The Worldwide Revolution in Infrastructure Provision and Project Finance; Edward Elgar Publishing: Cheltenham, UK, 2007. [Google Scholar]
  6. Liu, J.; Love, P.E.D.; Sing, M.C.P.; Smith, J.; Matthews, J. PPP Social Infrastructure Procurement: Examining the Feasibility of a Lifecycle Performance Measurement Framework. J. Infrastruct. Syst. 2017, 23, 04016041. [Google Scholar] [CrossRef]
  7. Zou, P.X.; Wang, S.; Fang, D. A life-cycle risk management framework for PPP infrastructure projects. J. Financ. Manag. Prop. Constr. 2008, 13, 123–142. [Google Scholar] [CrossRef]
  8. Shrestha, A.; Chan, T.K.; Aibinu, A.A.; Chen, C.; Martek, I. Risk Allocation Inefficiencies in Chinese PPP Water Projects. J. Constr. Eng. Manag. 2018, 144, 10. [Google Scholar] [CrossRef]
  9. Silvius, G. Integrating sustainability into project risk management. In Global Business Expansion: Concepts, Methodologies, Tools, and Applications; IGI Global: Hershey, PA, USA, 2018; pp. 330–352. [Google Scholar]
  10. Yuan, J.; Li, W.; Guo, J.; Zhao, X.; Skibniewski, M.J. Social Risk Factors of Transportation PPP Projects in China: A Sustainable Development Perspective. Int. J. Environ. Res. Public Health 2018, 15, 1323. [Google Scholar] [CrossRef] [PubMed] [Green Version]
  11. Ma, H.; Zeng, S.; Lin, H.; Zeng, R. Impact of Public Sector on Sustainability of Public–Private Partnership Projects. J. Constr. Eng. Manag. 2020, 146, 04019104. [Google Scholar] [CrossRef]
  12. Planning, S. Risk Management Planning, Sustainability Risks Management, and Risk Stakeholders. In Risk Management Strategies in Public-Private Partnerships; IGI Global: Hershey, PA, USA, 2017. [Google Scholar]
  13. Wang, Y.; Wang, Y.; Wu, X.; Li, J. Exploring the Risk Factors of Infrastructure PPP Projects for Sustainable Delivery: A Social Network Perspective. Sustainability 2020, 12, 4152. [Google Scholar] [CrossRef]
  14. Silvius, A.G.; Schipper, R.P. Sustainability in project management: A literature review and impact analysis. Soc. Bus. 2014, 4, 63–96. [Google Scholar] [CrossRef]
  15. Martens, M.L.; Carvalho, M.M. Key factors of sustainability in project management context: A survey exploring the project managers’ perspective. Int. J. Proj. Manag. 2017, 35, 1084–1102. [Google Scholar] [CrossRef]
  16. Aarseth, W.; Ahola, T.; Aaltonen, K.; Økland, A.; Andersen, B. Project sustainability strategies: A systematic literature review. Int. J. Proj. Manag. 2017, 35, 1071–1083. [Google Scholar] [CrossRef]
  17. Kivilä, J.; Martinsuo, M.; Vuorinen, L. Sustainable project management through project control in infrastructure projects. Int. J. Proj. Manag. 2017, 35, 1167–1183. [Google Scholar] [CrossRef]
  18. Yu, M.; Zhu, F.; Yang, X.; Wang, L.; Sun, X. Integrating Sustainability into Construction Engineering Projects: Perspective of Sustainable Project Planning. Sustainability 2018, 10, 784. [Google Scholar] [CrossRef] [Green Version]
  19. Anderson, D.R. The critical importance of sustainability risk management. Risk Manag. 2006, 53, 66. [Google Scholar]
  20. Diaz-Sarachaga, J.M.; Jato-Espino, D.; Castro-Fresno, D. Methodology for the development of a new Sustainable Infrastructure Rating System for Developing Countries (SIRSDEC). Environ. Sci. Policy 2017, 69, 65–72. [Google Scholar] [CrossRef] [Green Version]
  21. Shahriar, A.; Sadiq, R.; Tesfamariam, S. Risk analysis for oil & gas pipelines: A sustainability assessment approach using fuzzy based bow-tie analysis. J. Loss Prev. Process. Ind. 2012, 25, 505–523. [Google Scholar] [CrossRef]
  22. Qazi, A.; Shamayleh, A.; El-Sayegh, S.; Formaneck, S. Prioritizing risks in sustainable construction projects using a risk matrix-based Monte Carlo Simulation approach. Sustain. Cities Soc. 2021, 65, 102576. [Google Scholar] [CrossRef]
  23. Pinz, A.; Roudyani, N.; Thaler, J. Public–private partnerships as instruments to achieve sustainability-related objectives: The state of the art and a research agenda. Public Manag. Rev. 2018, 20, 1–22. [Google Scholar] [CrossRef]
  24. Javed, A.A.; Lam, P.T.; Chan, A.P. A model framework of output specifications for hospital PPP/PFI projects. Facilities 2013, 31, 610–633. [Google Scholar] [CrossRef]
  25. Fantozzi, F.; Bartocci, P.; D’Alessandro, B.; Arampatzis, S.; Manos, B. Public–private partnerships value in bioenergy projects: Economic feasibility analysis based on two case studies. Biomass Bioenergy 2014, 66, 387–397. [Google Scholar] [CrossRef]
  26. Patil, N.A.; Laishram, B. Public–private partnerships from sustainability perspective—A critical analysis of the Indian case. Int. J. Constr. Manag. 2016, 16, 161–174. [Google Scholar] [CrossRef]
  27. Atmo, G.; Duffield, C. Improving investment sustainability for PPP power projects in emerging economies: Value for money framework. Built Environ. Proj. Asset Manag. 2014, 4, 335–351. [Google Scholar] [CrossRef]
  28. Koppenjan, J.F. Public–Private Partnerships for green infrastructures. Tensions and challenges. Curr. Opin. Environ. Sustain. 2015, 12, 30–34. [Google Scholar] [CrossRef] [Green Version]
  29. Xiong, W.; Yuan, J.-F.; Li, Q.; Skibniewski, M.J. Performance objective-based dynamic adjustment model to balance the stakeholders’ satisfaction in PPP projects. J. Civ. Eng. Manag. 2015, 21, 539–547. [Google Scholar] [CrossRef]
  30. Love, P.; Liu, H.; Matthews, J.; Sing, C.P.; Smith, J. Future proofing PPPs: Life-cycle performance measurement and Building Information Modelling. Autom. Constr. 2015, 56, 26–35. [Google Scholar] [CrossRef]
  31. Agarchand, N.; Laishram, B. Sustainable infrastructure development challenges through PPP procurement process Indian perspective. Int. J. Manag. Proj. Bus. 2017, 10, 642–662. [Google Scholar] [CrossRef]
  32. PMI. A Guide to The Project Management Body of Knowledge (PMBOK Guide); Project Management Institute: Newton Square, PA, USA, 2017. [Google Scholar]
  33. Marchese, D.; Reynolds, E.; Bates, M.E.; Morgan, H.; Clark, S.S.; Linkov, I. Resilience and sustainability: Similarities and differences in environmental management applications. Sci. Total Environ. 2018, 613, 1275–1283. [Google Scholar] [CrossRef]
  34. Bocchini, P.; Frangopol, D.; Ummenhofer, T.; Zinke, T. Resilience and Sustainability of Civil Infrastructure: Toward a Unified Approach. J. Infrastruct. Syst. 2014, 20, 04014004. [Google Scholar] [CrossRef]
  35. Gray, P.; Wiedemann, P.M. Risk management and sustainable development: Mutual lessons from approaches to the use of indicators. J. Risk Res. 1999, 2, 201–218. [Google Scholar] [CrossRef]
  36. Park, J.; Seager, T.P.; Rao, P.S.C.; Convertino, M.; Linkov, I. Integrating Risk and Resilience Approaches to Catastrophe Management in Engineering Systems. Risk Anal. 2013, 33, 356–367. [Google Scholar] [CrossRef] [PubMed]
  37. Shen, L.; Tam, V.W.; Gan, L.; Ye, K.; Zhao, Z. Improving Sustainability Performance for Public-Private-Partnership (PPP) Projects. Sustainability 2016, 8, 289. [Google Scholar] [CrossRef] [Green Version]
  38. Heravi, G.; Hajihosseini, Z. Risk Allocation in Public–Private Partnership Infrastructure Projects in Developing Countries: Case Study of the Tehran–Chalus Toll Road. J. Infrastruct. Syst. 2012, 18, 210–217. [Google Scholar] [CrossRef]
  39. Ye, S.; Tiong, R.L.K. NPV-at-Risk Method in Infrastructure Project Investment Evaluation. J. Constr. Eng. Manag. 2000, 126, 227–233. [Google Scholar] [CrossRef]
  40. Jin, X.-H.; Doloi, H. Interpreting risk allocation mechanism in public–private partnership projects: An empirical study in a transaction cost economics perspective. Constr. Manag. Econ. 2008, 26, 707–721. [Google Scholar] [CrossRef]
  41. Xu, Y.; Chan, A.P.C.; Yeung, J.F.Y. Developing a Fuzzy Risk Allocation Model for PPP Projects in China. J. Constr. Eng. Manag. 2010, 136, 894–903. [Google Scholar] [CrossRef]
  42. Medda, F. A game theory approach for the allocation of risks in transport public private partnerships. Int. J. Proj. Manag. 2007, 25, 213–218. [Google Scholar] [CrossRef]
  43. Jin, X.-H.; Zhang, G. Modelling optimal risk allocation in PPP projects using artificial neural networks. Int. J. Proj. Manag. 2011, 29, 591–603. [Google Scholar] [CrossRef]
  44. Jin, X.-H. Model for Efficient Risk Allocation in Privately Financed Public Infrastructure Projects Using Neuro-Fuzzy Techniques. J. Constr. Eng. Manag. 2011, 137, 1003–1014. [Google Scholar] [CrossRef]
  45. Jin, X.-H. Neurofuzzy Decision Support System for Efficient Risk Allocation in Public-Private Partnership Infrastructure Projects. J. Comput. Civ. Eng. 2010, 24, 525–538. [Google Scholar] [CrossRef]
  46. Li, H.; Al-Hussein, M.; Lei, Z. Incentive genetic algorithm based time–cost trade-off analysis across a build–operate–transfer project concession period. Can. J. Civ. Eng. 2011, 38, 166–174. [Google Scholar] [CrossRef]
  47. Li, J.; Zou, P.X.W. Fuzzy AHP-Based Risk Assessment Methodology for PPP Projects. J. Constr. Eng. Manag. 2011, 137, 1205–1209. [Google Scholar] [CrossRef]
  48. Müller, A.B.; Avellán, T.; Schanze, J. Risk and sustainability assessment framework for decision support in’water scarcity–water reuse’situations. J. Hydrol. 2020, 591, 125424. [Google Scholar] [CrossRef]
  49. Sexton, K.; Linder, S.H. Integrated Assessment of Risk and Sustainability in the Context of Regulatory Decision Making. Environ. Sci. Technol. 2014, 48, 1409–1418. [Google Scholar] [CrossRef]
  50. Shiroyama, H.; Yarime, M.; Matsuo, M.; Schroeder, H.; Scholz, R.; Ulrich, A.E. Governance for sustainability: Knowledge integration and multi-actor dimensions in risk management. Sustain. Sci. 2012, 7, 45–55. [Google Scholar] [CrossRef]
  51. Arshad, H.; Thaheem, M.; Bakhtawar, B.; Shrestha, A. Evaluation of Road Infrastructure Projects: A Life Cycle Sustainability-Based Decision-Making Approach. Sustainability 2021, 13, 3743. [Google Scholar] [CrossRef]
  52. Linkov, I.; Satterstrom, F.; Kiker, G.; Batchelor, C.; Bridges, T.; Ferguson, E. From comparative risk assessment to multi-criteria decision analysis and adaptive management: Recent developments and applications. Environ. Int. 2006, 32, 1072–1093. [Google Scholar] [CrossRef]
  53. Akber, M.Z.; Thaheem, M.J.; Arshad, H. Life cycle sustainability assessment of electricity generation in Pakistan: Policy regime for a sustainable energy mix. Energy Policy 2017, 111, 111–126. [Google Scholar] [CrossRef]
  54. Patil, N.A.; Tharun, D.; Laishram, B. Infrastructure development through PPPs in India: Criteria for sustainability assessment. J. Environ. Plan. Manag. 2016, 59, 708–729. [Google Scholar] [CrossRef]
  55. Goedkoop, M.; Heijungs, R.; Huijbregts, M.; De Schryver, A.; Struijs, J.; Van Zelm, R. ReCiPe 2008: A Life Cycle Impact Assessment Method Which Comprises Harmonised Category Indicators at the Midpoint and the Endpoint Level. In Report I: Characterisation, 1st ed.; 2009; Volume 1, Available online: https://www.leidenuniv.nl/cml/ssp/publications/recipe_characterisation.pdf (accessed on 20 October 2021).
  56. Menoufi, K.; Castell, A.; Navarro, L.; Pérez, G.; Boer, D.; Cabeza, L.F. Evaluation of the environmental impact of experimental cubicles using Life Cycle Assessment: A highlight on the manufacturing phase. Appl. Energy 2012, 92, 534–544. [Google Scholar] [CrossRef]
  57. Benoît-Norris, C.; Vickery-Niederman, G.; Valdivia, S.; Franze, J.; Traverso, M.; Ciroth, A.; Mazijn, B. Introducing the UNEP/SETAC methodological sheets for subcategories of social LCA. Int. J. Life Cycle Assess. 2011, 16, 682–690. [Google Scholar] [CrossRef]
  58. Ahmad, T.; Thaheem, M.J. Developing a residential building-related social sustainability assessment framework and its implications for BIM. Sustain. Cities Soc. 2017, 28, 1–15. [Google Scholar] [CrossRef]
  59. Ahmad, T.; Thaheem, M.J. Economic sustainability assessment of residential buildings: A dedicated assessment framework and implications for BIM. Sustain. Cities Soc. 2018, 38, 476–491. [Google Scholar] [CrossRef]
  60. Fitch, G.J.; Odeh, I.; Kautz, F.; Ibbs, C.W. System Dynamics Models for the Valuation of Real Options in P3 Concession Project Agreements. J. Infrastruct. Syst. 2018, 24, 13. [Google Scholar] [CrossRef]
  61. Shen, L.Y.; Li, H.; Li, Q.M. Alternative Concession Model for Build Operate Transfer Contract Projects. J. Constr. Eng. Manag. 2002, 128, 326–330. [Google Scholar] [CrossRef]
  62. Ahmad, Z.; Thaheem, M.J.; Maqsoom, A. Building information modeling as a risk transformer: An evolutionary insight into the project uncertainty. Autom. Constr. 2018, 92, 103–119. [Google Scholar] [CrossRef]
  63. Ullah, F.; Ayub, B.; Siddiqui, S.Q.; Thaheem, M.J. A review of public-private partnership: Critical factors of concession period. J. Financ. Manag. Prop. Constr. 2016, 21, 269–300. [Google Scholar] [CrossRef]
  64. Bilal, M.; Khan, K.I.A.; Thaheem, M.J.; Nasir, A.R. Current state and barriers to the circular economy in the building sector: Towards a mitigation framework. J. Clean. Prod. 2020, 276, 123250. [Google Scholar] [CrossRef]
  65. Krumpal, I. Determinants of social desirability bias in sensitive surveys: A literature review. Qual. Quant. 2013, 47, 2025–2047. [Google Scholar] [CrossRef]
  66. Noy, C. Sampling Knowledge: The Hermeneutics of Snowball Sampling in Qualitative Research. Int. J. Soc. Res. Methodol. 2008, 11, 327–344. [Google Scholar] [CrossRef]
  67. Roumboutsos, A.; Anagnostopoulos, K.P. Public–private partnership projects in Greece: Risk ranking and preferred risk allocation. Constr. Manag. Econ. 2008, 26, 751–763. [Google Scholar] [CrossRef]
  68. Vose, D. Risk Analysis: A Quantitative Guide; John Wiley & Sons: New York, NY, USA, 2008. [Google Scholar]
  69. Milligan, G.W.; Cooper, M.C. A study of standardization of variables in cluster analysis. J. Classif. 1988, 5, 181–204. [Google Scholar] [CrossRef]
  70. Hosmer, D.W.; Lemesbow, S. Goodness of fit tests for the multiple logistic regression model. Commun. Stat. Theory Methods 1980, 9, 1043–1069. [Google Scholar] [CrossRef]
  71. Schmidt, R.; Voigt, M.; Mailach, R. Latin Hypercube Sampling-Based Monte Carlo Simulation: Extension of the Sample Size and Correlation Control. In Uncertainty Management for Robust Industrial Design in Aeronautics; Springer: Cham, Switzerland, 2019; pp. 279–289. [Google Scholar]
  72. Dillman, D. Constructing the Questionnaire. Mail and Internet Surveys; John Wiley & Sons: New York, NY, USA, 2000. [Google Scholar]
  73. Patrício, L.D.; Ferreira, J.J. Blockchain security research: Theorizing through bibliographic-coupling analysis. J. Adv. Manag. Res. 2020, 18, 1–35. [Google Scholar] [CrossRef]
  74. Tahir, H.M.; Khan, S.Y.; Arshad, M. Motorway (M 2): A Threat to the Wild Animals. Pak. J. Zool. 2013, 45, 1447–1451. [Google Scholar]
Figure 1. Process map of systematic literature review.
Sustainability 14 00344 g001
Figure 2. Shortlisted P3 risks.
Sustainability 14 00344 g002
Figure 3. Research Methodology.
Sustainability 14 00344 g003
Figure 4. Questionnaire Survey Format.
Sustainability 14 00344 g004
Figure 5. Significant risk factor–sustainability relationships (Impact Matrix).
Sustainability 14 00344 g005
Figure 6. Respondent demographics.
Sustainability 14 00344 g006
Figure 7. (a) Probabilistic risk distribution for sustainability. (b) The overall ranking of sustainability indicators.
Sustainability 14 00344 g007
Figure 8. Implementation framework for the study.
Sustainability 14 00344 g008
Table 1. Triple-bottom-line sustainability indicators.
Sustainability AreaCodeIndicators
Financial Sustainability (FS)I1Initial cost
I2Life-cycle cost
Social Sustainability (SS)I3Socio-economic repercussions
I4Health and safety
I5Cultural heritage
I6Governance
I7Human rights
Environmental Sustainability (ES)I8Resource damage
I9Ecosystem damage
I10Human health
Table 2. Interviewee Details.
Sr. No.DegreeRelevant ExperienceArea of ExpertiseCountryBackground
1PhD6 yearsSustainability AssessmentPakistanAcademia
2PhD12 yearsSustainability Assessment
/Roads/P3s
PakistanAcademia
3MS8 yearsRisk Management/Roads
/P3s
PakistanIndustry
4PhD9 yearsP3s/Risk ManagementPakistanAcademia
5MS28 yearsP3s/Roads/
Risk Management
PakistanIndustry
Each of the respondents was asked to rate the impact of each risk on individual sustainability indicators on a 5-point Likert scale (1—Very Low, 2—Low, 3—Medium, 4—High, and 5—Very High). All the relationships, having greater than two impact levels were considered significant. Based on this method, 68 significant relationships were identified.
Table 3. Interviewee Demographics.
Sr. No.Relevant Experience (yrs.)Relevant OrganizationDesignation in Organization
116Private SectorManager P3 projects
28Private SectorAsst. Manager P3 projects
315Public SectorDirector P3
428+Public SectorGeneral Manager P3
516Public SectorManager Planning
610Public SectorDeputy Director P3
Table 4. Project Case Data.
Project NameM2 (Lahore-Islamabad Motorway
Overlay and Modernization)
M11 (Construction of Lahore-Sialkot
Motorway)
BudgetApprox. PKR 46 BillionApprox. PKR 44 Billion
The financial mix of the projectPKR 25.78 billion from debt
PKR 11.05 billion and PKR 9.18 billion from toll during construction
PKR 12.6 billion from debt PKR 6.8 billion and PKR 1.4 billion from toll during construction, and PKR 18 billion and PKR 5 billion from Govt. of Pakistan (GOP) contribution and GOP loan respectively.
Financial CloseDecember 2014December 2015
Project TimelineConstruction period 3 years (including 6 months financial close period), Operations period 17 years (including 7 years debt repayment period)Financial close period 6 months, Construction period 2.5 years, Operations period 22 years (including 8 years debt repayment period)
Length367 Km90 Km
Project StatusIn the operations phase since 2016In the operations phase since 2020
Expected Financial Profit to GovernmentNHA revenue share PKR 209
Billion GOP taxes PKR 57 billion
GOP taxes worth PKR 28.65 billion
ConcessionaireM/s Motorway Operation &
Rehabilitation Engineering (Private) Limited—a subsidiary of M/s Frontier Works Organization (FWO), Pakistan
M/s Motorway Overlay and Rehabilitation Engineering Company (MORE)-a consortium of FWO, Bin Nadeem Associates (BNA), and Zeeruk International
Concession Period20 Years20 Years
Table 5. Simulation Results.
SINo. of RisksProbability Distribution StatisticsRisk Ranking
MinMeanMax5%95%SD12345
I190.763.0471.64.661.39R20R16R19R15R17
I2203.377.2912.245.129.730.92R3R20R19R17R16
I3151.855.0410.73.187.181.22R20R3R18R16R8
I440.041.475.260.572.670.67R18R9R9R15R12
I510.020.372.270.010.920.29R6R6
I670.412.736.511.464.170.82R8R16R19R20R17
I730.011.183.350.2992.150.57R16R17R15
I810.020.376.950.011.080.42R18
I910.0020.4510.0050.990.35R18
I1070.5162.6755.011.115.032.66R10R18R7R8R9
TS15.724.673.820.128.33.67I10I2I3I1I6
Table 6. Regression Equations for all indicators and total sustainability.
IndicatorRegression EquationsEq. No.
TS R ts = 2.9 + 0.25 I 1 + 0.38 I 2 + 0.34 I 3 + 0.18 I 4 + 0.08 I 5 + 0.23 I 6 + 0.15 I 7 + 0.11 I 18 + 0.1 I 9 + 0.72 I 10 (7)
IC R IC = 0.04 + 0.39 R 20 + 0.39 R 16 + 0.38 R 19 + 0.36 R 17 + 0.31 R 1 + 0.31 R 6 + 0.3 R 2 + 0.28 R 3 (8)
LCC R LCC = 1.37 + 0.26 R 3 + 0.26 R 20 + 0.26 R 19 + 0.25 R 17 + 0.25 R 16 + 0.24 R 4 + 0.24 R 15 + 0.24 R 9 + 0.23 R 7 + 0.23 R 10 + 0.22 R 12 + 0.22 R 18 + 0.21 R 8 + 0.21 R 14 + 0.2 R 11 + 0.19 R 1 (9)
SER R SER = 0.02 + 0.28 R 3 + 0.28 R 18 + 0.28 R 20 + 0.27 R 16 + 0.27 R 19 + 0.27 R 8 + 0.25 R 5 + 0.25 R 12 + 0.25 R 17 + 0.25 R 6 + 0.24 R 7 + 0.22 R 10 + 0.22 R 14 + 0.22 R 4 + 0.2 R 15 (10)
H&S R H & S = 0.55 R 18 + 0.52 R 9 + 0.44 R 15 + 0.42 R 12 (11)
Gov R Gov = 0.01 + 0.43 R 19 + 0.43 R 8 + 0.42 R 16 + 0.37 R 20 + 0.35 R 17 + 0.34 R 12 + 0.31 R 15 (12)
HR R HR = 0.01 + 0.64 R 16 + 0.6 R 17 + 0.52 R 15 (13)
HH R HH = 2.73 + 0.71 R 10 + 0.7 R 18 + 0.07 R 7 + 0.06 R 8 + 0.06 R 9 + 0.06 R 6 + 0.06 R 12 (14)
Table 7. Risk performance of case studies in terms of sustainability.
SICase Study 1 (M-2)Case Study 2 (M-11)Risk Ranges
Sum r c 1 SD D r c 1 R s x Sum r c 2 SD D r c 2 R s x MinMeanMax
IC60.251.390.663.965.80.251.390.663.830.763.047
LCC13.50.380.921.5220.513.90.380.921.5221.13.377.2912.2
SER10.10.341.221.0210.39.50.341.221.029.721.855.0410.7
H&S3.10.180.670.983.062.10.180.670.992.070.041.475.26
CH0.70.080.291.010.710.70.080.291.010.710.020.372.27
GN50.230.821.035.154.40.230.821.034.520.412.736.51
HR20.150.570.971.9320.150.570.971.930.011.183.35
RD0.90.110.420.960.870.50.110.420.960.480.020.376.95
ED0.90.10.351.050.940.50.10.351.050.520.0020.451
HH5.20.722.660.995.174.40.722.660.994.370.522.6755.01
TS48-3.67-50.342-3.67-43.415.724.673.8
Note: Sum = Summation of risks index values for each indicator, rc = Regression coefficient, SD = Standard deviation, Drc = descaled regression coefficient, Rsx = Risk level on each indicator.
Table 8. Mitigation Strategies for Case 1.
Risk Relevant to ProjectRelevant Sustainability IndicatorSuggested Mitigations
Accident due to negligence and poor workmanshipHealth and Safety (H&S)S1-Performance monitoring and procedural control system over project life-cycle
S2-Design adherence to safety standards
S3-Design requirements for access to people and animals
CorruptionHuman Rights (HR)S4-Strong accountability system
Frequent toll changes and public oppositionGovernance (GOV)S5-Translation of organizational experiences into policy procedures
Cultural Heritage (CH)S6-Guarantee on toll rate
S7-Additional revenue streams
S8-Better relationship management with the local community and government
Lack of confidence in local resourcesEcological Damage (ED)E1-Recycle and reuse waste material (asphalt)
E2-Proper hydrological studies before design
Human Health Damage (HH)E3-Environment and safety controls/Strict EPA criteria
Availability of resourcesLife Cycle Cost-(LCC)F1-Innovative design techniques
F2-Alternative construction techniques or resources locally available
F3-Appointing QA/QC inspector
Air Pollution and Risk of raised soil toxinsEcological Damage (ED)E4-Environmental monitoring over life-cycle
Resource Damage (RD)E5-Implementation and safeguard of environmental policies
E6-Appointing environmental specialists in the project team
E7-Tree plantation
E8-Selection of environment-friendly materials
Table 9. Mitigation Strategies for Case 2.
Risk Relevant to ProjectRelevant Sustainability IndicatorSuggested Mitigations
Financial RiskInitial Cost (IC)F1-Prioritization of projects with lesser political risks
F2-Government investment to ensure support (VGF)
F3-Selection of the appropriate P3 model
F4-Appointing financial experts
Unsafe RoadsHealth and Safety (H&S)S1-Performance monitoring and procedural control system over project life-cycle
S2-Design innovation (use of intelligent transportation system)
S3-Design adherence to safety standards
S4-Road Surveillance at night
S5-Emergency response service dedicated to every road section with clear roles and responsibility structure
Lack of sufficient petrol stations and rest areas causing social disapprovalSocio-Economic Risk (SER)S6-Public feedback mechanisms
S7-Conducting detailed socio-economic impact assessment
Health and Safety (H&S)S8-Design requirements for managing access and estimating user requirements properly
Hurting Public SentimentCultural Heritage (CH)S7-Conducting detailed socio-economic impact assessment
S9-Better relationship management with the local community and government
S10-Considering social factors in selecting road alignment
Publisher’s Note: MDPI stays neutral with regard to jurisdictional claims in published maps and institutional affiliations.

