Article

Analysis of the Effect of Financial Literacy, Practicality, and Consumer Lifestyle on the Use of Chip-Based Electronic Money Using SEM

1
Faculty of Economics and Business, Universitas Informatika dan Bisnis Indonesia, Bandung 40285, Indonesia
2
Department of Mathematics, Faculty of Mathematics and Natural Sciences, Universitas Padjadjaran, Sumedang 45363, Indonesia
*
Author to whom correspondence should be addressed.
Sustainability 2022, 14(1), 32; https://doi.org/10.3390/su14010032
Submission received: 28 November 2021 / Revised: 14 December 2021 / Accepted: 17 December 2021 / Published: 21 December 2021

Abstract

:
Industry 4.0 trends have a significant influence on the acceleration of technology in Indonesia. The development of financial technology has shifted conventional transactions to electronic money as a means of payment with a digital system. Electronic money users in Indonesia continue to grow, while several factors affect consumer decision making to use electronic money. This study aims to analyze the effect of financial literacy, practicality, and consumer lifestyle on consumer interest in using chip-based electronic money. This research uses a quantitative approach with primary data obtained through questionnaires to chip-based electronic money users. The analytical method used is Structural Equation Modeling (SEM) to verify the factors that determine the indicators of the findings of interest in the use of chip-based electronic money. The study results indicate that: (a) Financial literacy has a significant positive effect on interest in using chip-based electronic money by 14.6%; (b) Financial literacy has a significant positive effect on practicality in the use of chip-based electronic money by 51.8%; (c) Practicality in the use of chip-based electronic money has a significant positive effect on consumer lifestyles by 71.3%; (d) Practicality has a significant positive effect on the use of chip-based electronic money by 25%; and (e) Consumer lifestyle has a significant positive effect on the use of chip-based electronic money by 52.8%. The study results imply that it can be used as a consideration for making monetary policy in Indonesia, dealing with the rapid growth in the use of chip-based electronic money.

1. Introduction

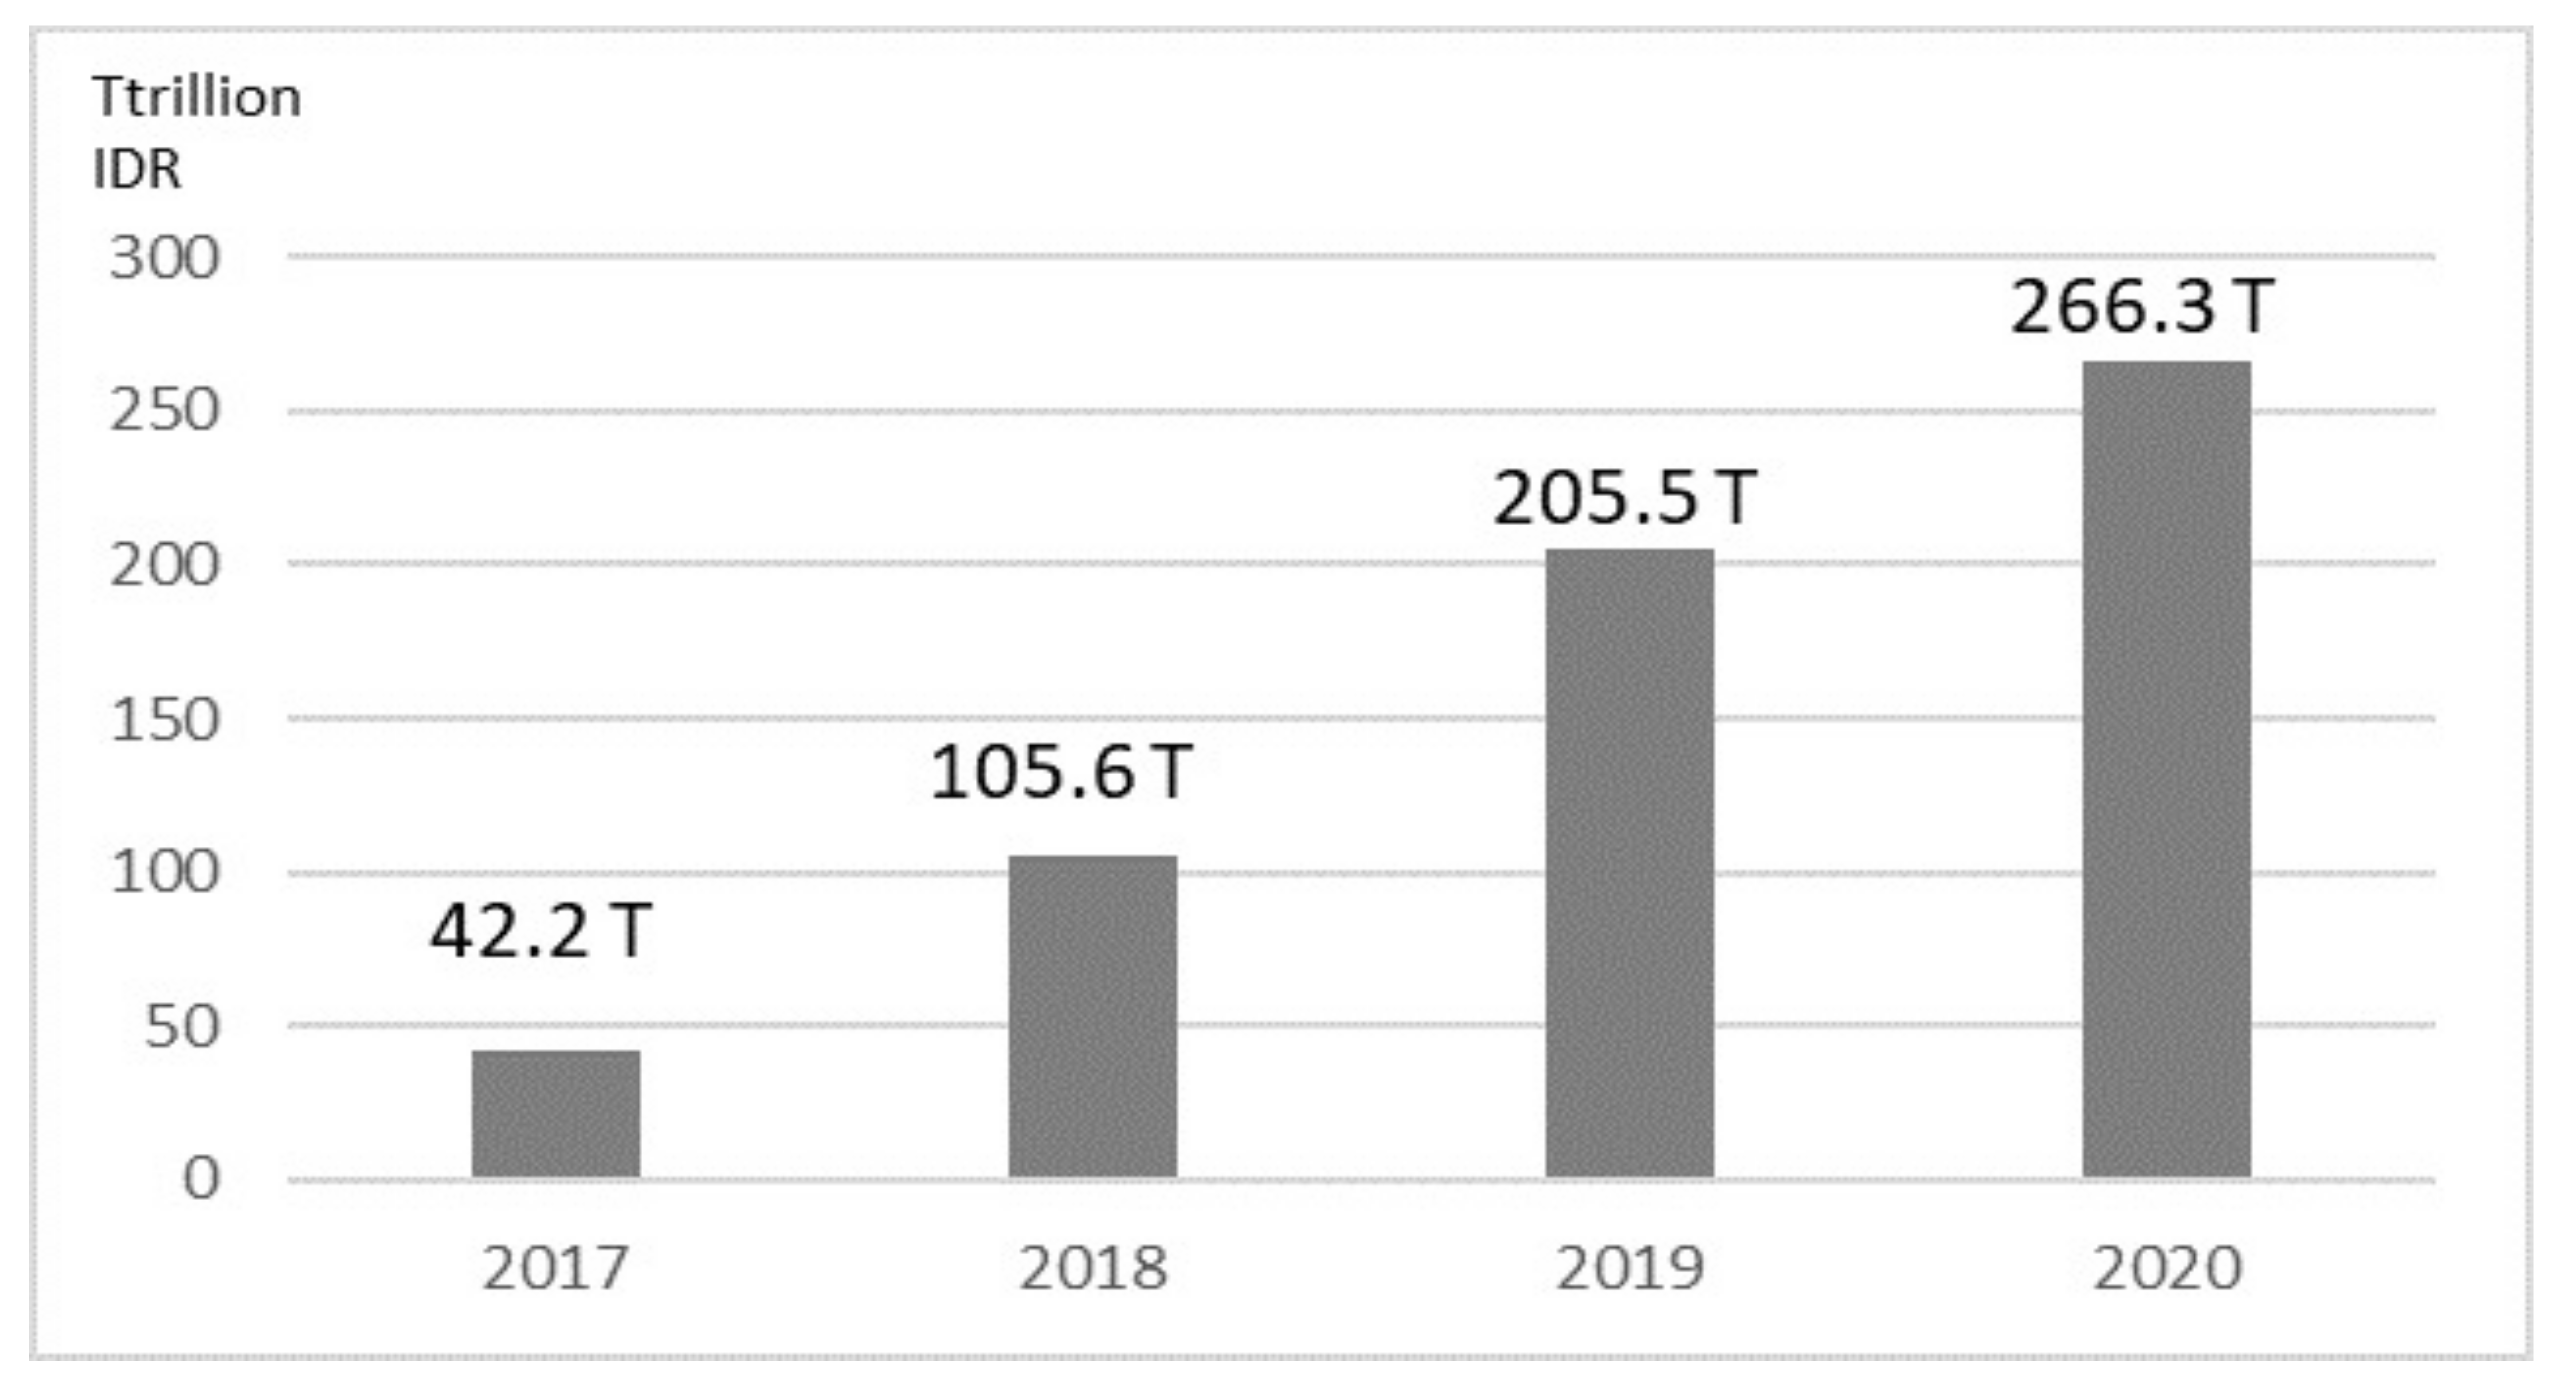
Technological developments occur rapidly along with the industry 4.0 trend. Current technologies have succeeded in influencing people’s lifestyles, one of which is a transaction payment mechanism. Financial activities using chip-based electronic money have begun to occur in the community. Chip-based electronic money is expected to process payments faster and easier than conventional systems [1,2]. It is expected to be used by all levels of society but it has not been evenly distributed among Indonesian people as consumers. Consumer behavior towards payment instruments has various characteristics and is influenced by several factors inside and outside the community including financial literacy, practicality, and lifestyle [3,4,5].
Financial literacy is one of the important things in the payment transaction process. Consumers with good financial literacy can choose effective and more profitable payment methods based on their respective financial considerations [6,7,8]. Then, lifestyle is a pattern of life that is expressed in activities, interests, and opinions so that it becomes a routine. Lifestyle can be a reflection of consumption behavior, for example, a modern lifestyle will increase habits to be active in using technology products, including financial problems [9,10,11]. Another factor is practicality, in the sense that the element of practicality on payment instruments has an important effect on people’s consumption behavior. There is a tendency to choose activities that are more practical in all community activities. Based on these three factors, chip-based electronic money can influence the people’s interest in using payment instruments [4,12,13].
Several studies have been conducted on the use of electronic money and consumer interest factors. For example, Ramadhani and Nugroho (2019) [14] analyzed the effect of electronic money on the amount of money circulating in Indonesia. The trend of electronic money in society has a significant effect on money circulation but has no significant effect on the inflation rate. Furthermore, Lim et al. (2019) [15] conducted a study of behavioral interest in using electronic wallet transactions (e-wallet) through the Quick Response (QR) code among millennials by using the theory of acceptance and integrated use of the technology model. The literature study suggests five variables, namely facility conditions, effort expectations, performance expectations, social influence, and behavioral interest in the use of e-wallet transactions using QR codes. Similar studies were also conducted by Foon and Fah (2011) [16] and Padashetty and Krishna (2013) [17]. Igamo and Falianty (2018) [18] examined aspects of the development of non-cash payment instruments, especially electronic money in Indonesia, using secondary data obtained from the Central Bureau of Statistics and Bank Indonesia. The use of electronic money for a financial transaction payment has an advantage that affects other payment instruments using an analysis of the Vector Error Correction Model (VECM). The results show that electronic money can increase private consumption spending as a measure of efficiency. Similar studies have also been carried out by Archana (2012) [19] and Dash (2014) [20].
Furthermore, Mensah and Jumah (2021) [21] analyzed the use of electronic money and consumer spending behavior. An increase in spending affects the behavior of consumers who use electronic money significantly. Income and expenses also affect the use of electronic money. A similar analysis has also been carried out by Jack and Suri (2014) [22]; Jack et al. (2010) [23], and Robb & Woodyard (2011) [24]. Yucha et al. (2020) [25] conducted a comparative analysis between cash and digital payment systems regarding changes in consumer buying behavior towards goods. The result is that cash payments are quite dominant, but there is an increase in the percentage of digital payments in the online market. Such research has also been carried out by AL-Rawashdeh et al. (2012) [26] and Govender et al. (2012) [27]. Then Yang, et al. (2021) [28] conducted an exploratory study on the effects of usability, ease of use, social influence, amenities, lifestyle compatibility, and trust on interest in using e-wallet. The study used a quantitative approach with a cross-sectional research design, and data were obtained from 501 respondents through Google Form. Data analysis was performed using partial least square structural equation modeling (PLS-SEM). The analysis results show that perceived benefits, ease of use, social influence, lifestyle, and trust have a significant positive effect on interest in using e-wallet. A similar analysis was also carried out by Gerrans et al. (2013) [29]. Mondego and Gide (2020) [30] conducted a study to identify more deeply the factors that influence consumer confidence in the mobile payment system (MPS) in Australia. The study used a quantitative approach based on data from a questionnaire survey of 200 respondents. Data analysis was performed using Partial Least Square Structural Equation Modeling (PLS-SEM). The analysis results show that behavioral and organizational factors have a significant effect on consumer trust, so they have an effect on the MPS system. However, the analysis results also show that technology, government, and personal factors have no significant effect on consumer confidence, and therefore they have no effect on the MPS system. Zhou (2021) [31] and Lipscomb et al. (2018) [32] also conducted a similar study.
Khatimah et al. (2019) [33] conducted a study to examine the correlation between consumer motivation to shop and social influence on interest in using electronic money as a means of payment. The data analyzed is the result of a survey of 249 respondents using e-money in Indonesia. Data analysis was performed using Partial Least Square Structural Equation Model (PLS-SEM). The analysis results show that consumers’ motivation to shop and social influences significantly affect the interest in using electronic money to pay.
Based on the description above, the research in this paper was carried out by referring to Yang, et al. (2021) [28], Mondego and Gide (2020) [30], and Khatimah et al. (2019) [33], although their research did not specifically analyze the factors that influence financial literacy, practicality, and consumer lifestyle on the use of electronic money. Therefore, this paper intends to analyze the effect of financial literacy, practicality, and consumer lifestyle on the use of chip-based electronic money. The objective of this study is to identify to what extent the level of financial literacy, practicality, and consumer lifestyle can affect the use of chip-based electronic money. In this paper, the use of chip-based electronic money is analyzed using Structural Equation Modeling (SEM). It is a multivariate analysis method that can be used to describe the simultaneous linear relationship between the indicator observation variables and variables that cannot be directly measured by latent variables. The study results can be applied to increase the use of chip-based electronic money or the application of digital financial education programs from the government for the people of Indonesia by knowing the behavior of consumer interest in chip-based electronic money.

2. Literature Review

2.1. Electronic Money

Electronic money or e-money is a form of electronic payment instrument obtained by depositing (top-up) a certain amount of money in advance to the issuer, either bank or fintech (Financial Technology). When used, the value of electronic money stored in electronic media will be reduced by the value of the transaction and after that, it can be refilled (top-up). Electronic media to store the value of electronic money can be in the form of chip-based or server-based. The use of electronic money as an innovative and practical means of payment is expected to help smooth payments for mass, fast, and microeconomic activities, so that its development can help smooth transactions on toll roads, in the field of transportation such as trains and other public transportation or transactions at minimarkets, food court, or parking [34].
The regulations related to the operation of electronic money in Indonesia have been regulated by Bank Indonesia as follows: (1) Bank Indonesia Regulation Number 11/12/PBI/2009 dated April 13, 2009, concerning Electronic Money, and (2) Bank Indonesia Circular Letter No. 11/11/DASP dated 13 April 2009, regarding Electronic Money [35].

2.2. Chip-Based Electronic Money

Chip-based electronic money is a form of the electronic medium for storing value on a chip. So, the value top-up of electronic money will be published on the chip-based electronic money media. The types of electronic money based on their records are registered and unregistered. Registered electronic money is chip-based electronic money in which the identity data of the holder is registered and recorded at the issuer. Unregistered chip-based electronic money is electronic money in which the identity data of the holder is not registered and is not recorded at the issuer [36]. These types of recording affect the differences in facilities. In registered chip-based electronic money, there are funds transfer and cash withdrawal facilities. Meanwhile, unregistered chip-based electronic money does not have these two facilities.
In addition, each chip-based electronic money media has its own policy from the issuer, e.g., related to the minimum and maximum top-up limits, daily transaction limits, or other regulations [37,38]. This is the fact that the money supply in each country needs to be limited and controlled to prevent people’s purchasing power from falling as well as to control the money supply remains in balance with the production of goods services [39,40].

2.3. Trend of Chip-Based Electronic Money Users

For the development of electronic money in Indonesia, according to Bank Indonesia, the number of chip-based electronic money circulating in Indonesia is growing rapidly. This is based on data obtained from [41]. The nominal use of chip-based electronic money in Indonesia can be seen in Figure 1.
Based on Figure 1, it can be seen that there is an increasing trend of chip-based electronic money transactions for the future. This trend of increasing chip-based electronic money transactions must be utilized by the public as consumers or business actors, as well as the government. The use of Electronic Money as a means of payment can provide the following benefits: (1) providing convenience and speed in conducting payment transactions without the need to carry cash; (2) electronic money is also able to increase transactions of business actors, record finances more regularly, and facilitate access to financial and banking services; and (3) easier transaction processes make people’s money circulate faster, thereby triggering an increase in the country’s economy.

2.4. Behavior of Consumer Interest in Chip-Based Electronic Money

Consumer behavior is needed to determine the characteristics of consumer interest in marketing a product. An understanding of consumers and the consumption process will produce a number of benefits, including the ability to help managers make decisions and provide basic knowledge when analyzing consumers by marketing researchers [42].
Consumer behavior can be interpreted as actions taken by consumers in decision making. Decision making can be categorized based on the desires that someone has and obtain benefits after consuming the choices taken. In addition, the benefits presented are divided into two, namely use values whose satisfaction can be calculated and use values whose satisfaction cannot be calculated. In addition, several factors influence consumers in taking action, including cultural, social, psychological, and personal factors [43].

2.5. Factors Influencing the Use of Chip-Based Electronic Money

Consumer behavior is strongly influenced by factors outside of humans (external) and within humans (internal). The main external factors are cultural and social factors, while the main internal factors are personal and psychological factors [44]. Several factors influencing consumer interest in chip-based electronic money are financial literacy, practicality, and lifestyle.
  • Financial Literacy
Financial literacy as knowledge and understanding of financial concepts is used to make effective financial choices. In addition, financial literacy can help improve the financial well-being of individuals and groups. Financial literacy has a relationship with a person’s ability to manage money [45,46]. The definition of financial literacy is conceptually divided into four parts, namely:
  • Ability to understand financial concepts, so that financial literacy can be applied in making financial decisions.
  • Ability to manage personal finances, by using their financial literacy to carry out financial activities such as recording income and expenses.
  • Ability to make the right decisions, using their financial literacy.
  • Carrying out financial planning effectively for future financial needs, financial literacy possessed is used to plan financial investments.
B.
Practicality
Practicality in use is a factor that people consider when using chip-based electronic money services. If someone believes that technology is easy to use, then that person will use it. Thus, practicality variable indicates that a system is not made to make it difficult for the user, but rather a system is made with the aim of providing practicality for the user. On the other hand, if someone believes that the information system is not easy to use, he/she will not use it [47,48].
C.
Lifestyle
Lifestyle is a pattern of life that is expressed in activities, interests, and opinions so that it becomes a routine. Lifestyle is formed from internal factors and external factors. The internal factors forming the lifestyle are attitudes, experiences and observations, personality, self-concept, and motives. While external factors are reference groups, family, social class, and culture. The formation of a person’s lifestyle is influenced by the situation encountered, social class, social group, family, and personal characteristics [2,49].

3. Material and Method

3.1. Indicators and Variables Used in This Study

The relationship between the influence of the independent variables, the intervening variable on the dependent variable, and the indicators that influence it will be investigated in this study. Practicality, lifestyle, financial literacy, and electronic money usage were included as latent variables in this study. The following research indicators were used to measure each of these variables, as shown in Table 1.

3.2. Sample Size, Reliability Test and Questionnaire Validity

The population in this study are people in Bandung City who use Chip-Based Electronic Money, both those who work as entrepreneurs and non-entrepreneurs. Data collection was carried out using a random sampling technique. Because the population is open, the number of samples studied is determined based on Roscoe’s Theory. The theory states that if the research is conducted using multivariate correlation analysis, then the number of samples must be at least 10 times the number of variables in the study. In this study, data collection was carried out using a questionnaire. Questionnaire is a research instrument that contains a series of questions with the aim of obtaining information from respondents [5,18]. In this study, the questionnaire contains 22 question items (variables), so that according to Roscoe’s Theory the minimum number of samples is 220 respondents. The number of samples in this study consisted of 550 respondents, so it is considered to have exceeded the minimum number according to Roscoe Theory.
Furthermore, testing the validity and reliability of the questionnaire needs to be done to test the level of validity of the items of the questionnaire. The next stage is to measure to what extent the results of questionnaire measurements can be trusted. The results of the validity test of the research questionnaire are declared valid if each question item in the questionnaire can reveal something that is measured using the questionnaire. The questionnaire validity test was carried out using the Principal Component Analysis (PCA) method. The three validity testing procedures in PCA are: (a) correlation between each item score/question item (research variable) and the total score of all items (item-to-total correlations/item-total-correlations); (b) correlations between item scores with one another (inter-item correlations); and (c) factor analysis (Principal Component Analysis) [4,50].

3.3. Structural Equation Modeling

The analytical method used in this study is the Structural Equation Modeling (SEM) method. Structural Equation Modeling, hereinafter referred to as SEM, is a combination of two statistical methods, namely: (i) factor analysis developed in psychology/psychometric analysis or sociology and (ii) simultaneous equation model developed in econometrics. There are two main advantages of using SEM: being able to test complex research models simultaneously and analyzing variables that cannot be measured directly and take into account errors [28,51].
SEM is divided into two types: Covariance Based SEM (CB-SEM) and Variance-Based SEM, better known as Partial Least Squares (SEM-PLS). There are several reasons for choosing which SEM method. In terms of objectives, if the research aims to test theories, confirm theories, or compare various alternative theories, then CB-SEM is used. This study uses the SEM-PLS method in factor analysis. The reason for using SEM-PLS is because this research is exploratory or an extension of existing theories and aims to identify the main determinant variables or predict certain constructs. The software used is Smart PLS 3.0. In general, two main stages must be carried out in testing the SEM method, namely: evaluation of the measurement model and evaluation of the structural model [28,30].
Before conducting the structural model analysis, a measurement model is first conducted to test the validity and reliability of the indicators forming the latent construct [33]. The summary of the evaluation criteria for the measurement model can be seen in Table 2.
Furthermore, a structural model is formed to examine the relationship that underlies or composes the latent variables into the measurement model and other construction variables. Parameters that indicate the regression of exogenous latent variables are labeled with the notation γ (“gamma”), while for the regression of the endogenous latent variables are labeled with the notation β (“beta”). Suppose that the random vectors η T =   η 1 ,   η 2 ,   , η m and ξ T =   ξ 1 ,   ξ 2 ,   , ξ n are endogenous and exogenous variables, forming a simultaneous equation with a system of linear equations. Thus, the general form of the structural equation model is defined as:
η = B η + Γ ξ + ζ
where B and Γ are coefficient matrices and ζ = ζ 1 ,   ζ 2 ,   , ζ m are error vectors in structural equations. Element B represents the effect of the η variable on the other η variables. In addition, the element presents a direct influence on the variable st in the variable η . It is assumed that st is not correlated with ζ and 1 − B is nonsingular [30,33].
The form of the structural model is obtained in the following order:
η = B η + Γ ξ + ζ , η B η   = Γ ξ + ζ , 1 B η = Γ ξ + ζ , η = ( 1 B 1 Γ ξ + ζ ,
with:
  • B : coefficient matrix of the endogenous latent variable with size m × n
  • Γ : exogenous latent variable coefficient matrix of size m × n
  • η : vector of the endogenous latent variable of size m × 1
  • ξ : vector of the exogenous latent variable of size n × 1
  • ζ : vector random residual relationship between η and ξ of size m × 1
Structural model evaluation was carried out with PLS by looking at the R-Square value for each dependent variable as the predictive power of the structural model. Changes in the value of R-Square can be used to explain whether certain latent variables on the dependent variable have a substantive effect. R-Square values of 0.75, 0.50, and 0.25 can be concluded that the model is strong, moderate, and weak [28,30]. The summary of the evaluation criteria for the structural model can be seen in Table 3.
After evaluating the model, the mediation effect was tested, which aims to see the relationship between the independent and dependent variables through the connecting variable. This means that the influence of the independent variable on the dependent variable can be direct but can also be through a connecting variable or the media. Testing the mediation effect in the SmartPLS 3.0 program uses a procedure developed by Baron and Kenny in 1986. According to Baron and Kenny, there are three stages of the model to test the mediation effect, namely:
  • The first model examines the effect of the independent variable (X) on the dependent (Y) and must be significant <5% (0.05)
  • The second model examines the effect of the independent variable (X) on mediation (M) and must be significant <5% (0.05).
  • The third model simultaneously examines the effect of the independent variable (X) on mediation (M) on the dependent variable (Y). In the last stage of testing, it is expected that the effect of the independent variable (X) on the dependent variable (Y) will be insignificant. In contrast, the effect of the mediating variable (M) on the dependent variable (Y) should be significant <5% (0.05) [30].
The final test looks at the coefficient value and the significance of the influence between variables using the mediating variable (M). This can be seen through the indirect effect coefficient and the significance value of the Indirect effect 5% (0.05) which is available in the SmartPLS 3.0 program [33].

4. Result and Discussion

4.1. Model Measurement

The model is measured by testing the validity and reliability of the indicators forming the construct of the model. Validity testing begins with convergent validity with loading factor and AVE parameters, then discriminant validity begins with cross-loading parameters, while reliability testing begins with Cronbach alpha and composite reliability parameters.

4.1.1. Convergent Validity

A validity test is used to measure the validity or validity of a questionnaire. The convergent validity test aims to assess the correlation between the indicators used in a construct. Convergent validity conditions are met if the indicators used in the same construct are correlated with each other. In this study, the data used were obtained from a questionnaire with a total of 550 respondents. The data were used as input to test the validity of the indicators contained in the SEM model. SmartPLS 3.0 software was used to facilitate data processing. Table 4 shows the results of testing the convergent validity of the SEM model of this study.
From Table 4, all loading values of the indicators used are >0.6. Thus, it can be concluded that all indicators have met one of the requirements of convergent validity. The requirements for loading factor >0.6 that meet the criteria for exploratory research are shown in Table 5.
From Table 5, all AVE values are greater than the minimum required AVE value (>0.5). This shows that the data in this study has met the two conditions for convergent validity.

4.1.2. Discriminant Validity

The discriminant validity test aims to see the correlation between indicators in one construct with indicators from other constructs. Discriminant validity criteria are met if the indicators from different constructs are not correlated. This is tested with the criterion of the value of the measured construct indicator loading being greater than loading to other constructs or having a low cross-loading value. The SmartPLS 3.0 software shows the cross-loading parameter values of the indicators used in this study as shown in the Table 6.
Based on the parameter values in Table 6, all cross-loading values of the indicators used are not greater than the loading value to the construct. In this case, the loading value is labeled in yellow. Therefore, in this test it meets the criteria of discriminant validity.

4.1.3. Reliability

A reliability test is used to assess the consistency and reliability of an indicator in measuring a construct. In this study, reliability was tested using Cronbach’s alpha and composite reliability approaches, with criteria for Cronbach’s alpha and composite reliability >0.6 for exploratory research. SmartPLS 3.0 software is used to test the reliability of the SEM model under study. Table 7 shows the composite reliability parameter value of the model.
Based on the results of Table 7, all construct variables in this study have a composite reliability value that is greater than the minimum required value of 0.6. This shows that the variables in this study have met one of the requirements for the reliability of the Cronbach Alpha parameter value in Table 8.
Based on the values in Table 8, all construct variables have Cronbach alpha values greater than 0.6. Thus, it has exceeded the minimum value required for the Cronbach alpha parameter criteria. This shows that the variables in this study have met both reliability requirements
The results of the overall measurement model with three test parameters have met the test criteria. Fulfillment of model measurement criteria with validity and reliability parameters shows that the indicator variables used have good accuracy, consistency, and accuracy in measuring each construct in this study.

4.2. Evaluation of Structural Model

Evaluation of the structural model is done by looking at the R-Square value for each dependent variable as the predictive power of the structural model. In this case, changes in the value of R-Square can indicate certain latent variables that have a substantive effect on the dependent variable. In addition, the evaluation is done by assessing the level of significance through the bootstrapping procedure.

4.2.1. R-Square Value

The R-square of the latent variable is one of the measures used to assess the predictive power of the structural model. The R-square value talks about the percentage of variance of a variable in the model that is explained by other variables in the same model. R-squares values of 0.75, 0.50 and 0.25 can be used to conclude whether a model can be categorized as a strong, moderate, or weak model. Table 9 shows the R-Square value of the latent variables contained in the SEM model.
From Table 9, it can be seen that there are three R-square values in this study. Each R-Square value represents an indicator variable, each variable has different characteristics. The characteristics of these variables, namely:
(1)
The R-square value of the Lifestyle variable is 0.508 or moderate. This shows that the variance of the Lifestyle variable can be explained by the variables in the model by 50.8% and the rest is explained by other variables outside the model.
(2)
The R-square value of the Chip-Based Electronic Money Usage variable is 0.681 or is classified as strong. This shows that the variance of the Electronic Money Usage variable can be explained by the variables in the model by 68.1% and the rest is explained by other variables outside the model.
(3)
The R-square value of the Practicality variable is 0.268 or classified as weak. This shows that the variance of the Practicality variable can be explained by the variables in the model by 26.8% and the rest is explained by other variables outside the model.

4.2.2. Significance Level

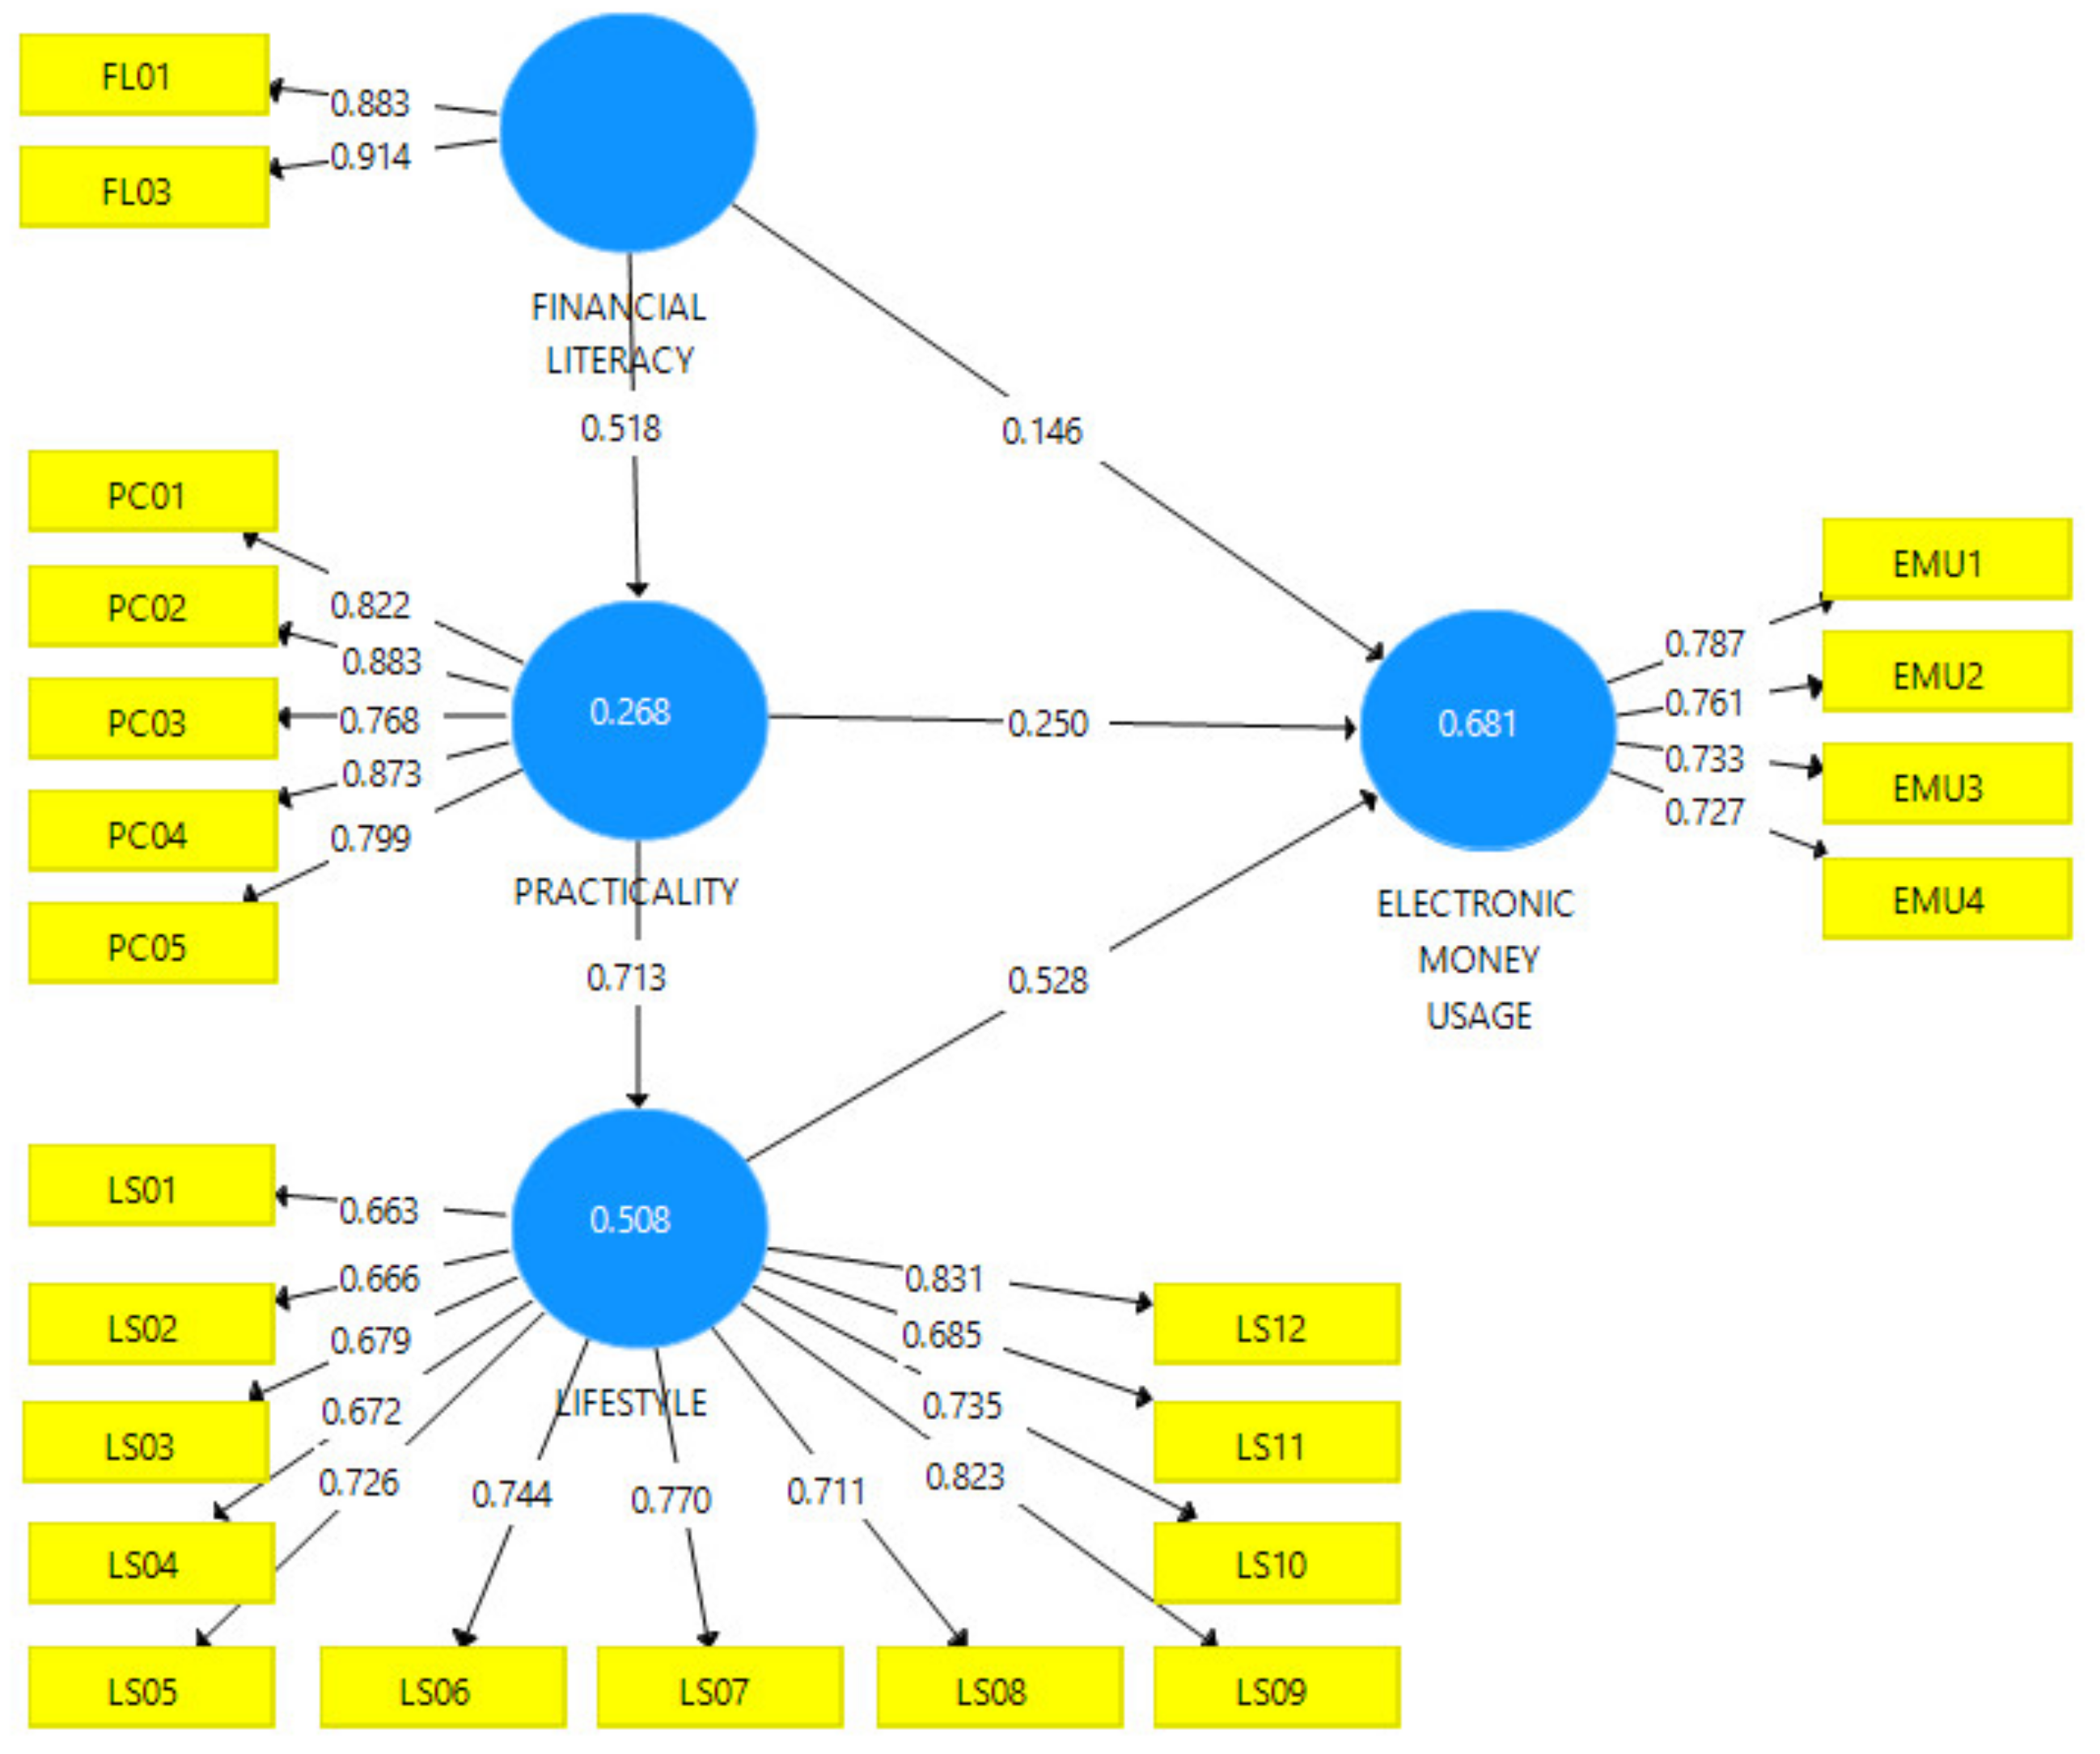
The final test of the evaluation of the structural model is done by looking at the level of significance through the bootstrapping procedure. The criterion for the significance value used is 5%. Before interpreting the significance test results, the output of the PLS algorithm and bootstrapping will first be displayed. The PLS algorithm output is used to see the magnitude of the path coefficient values between latent variables. In contrast, the bootstrapping output is used to see the magnitude of the t-statistical significance value. The following shows the output of the PLS algorithm and SEM bootstrapping using SmartPLS 3.0, as shown in Figure 2.
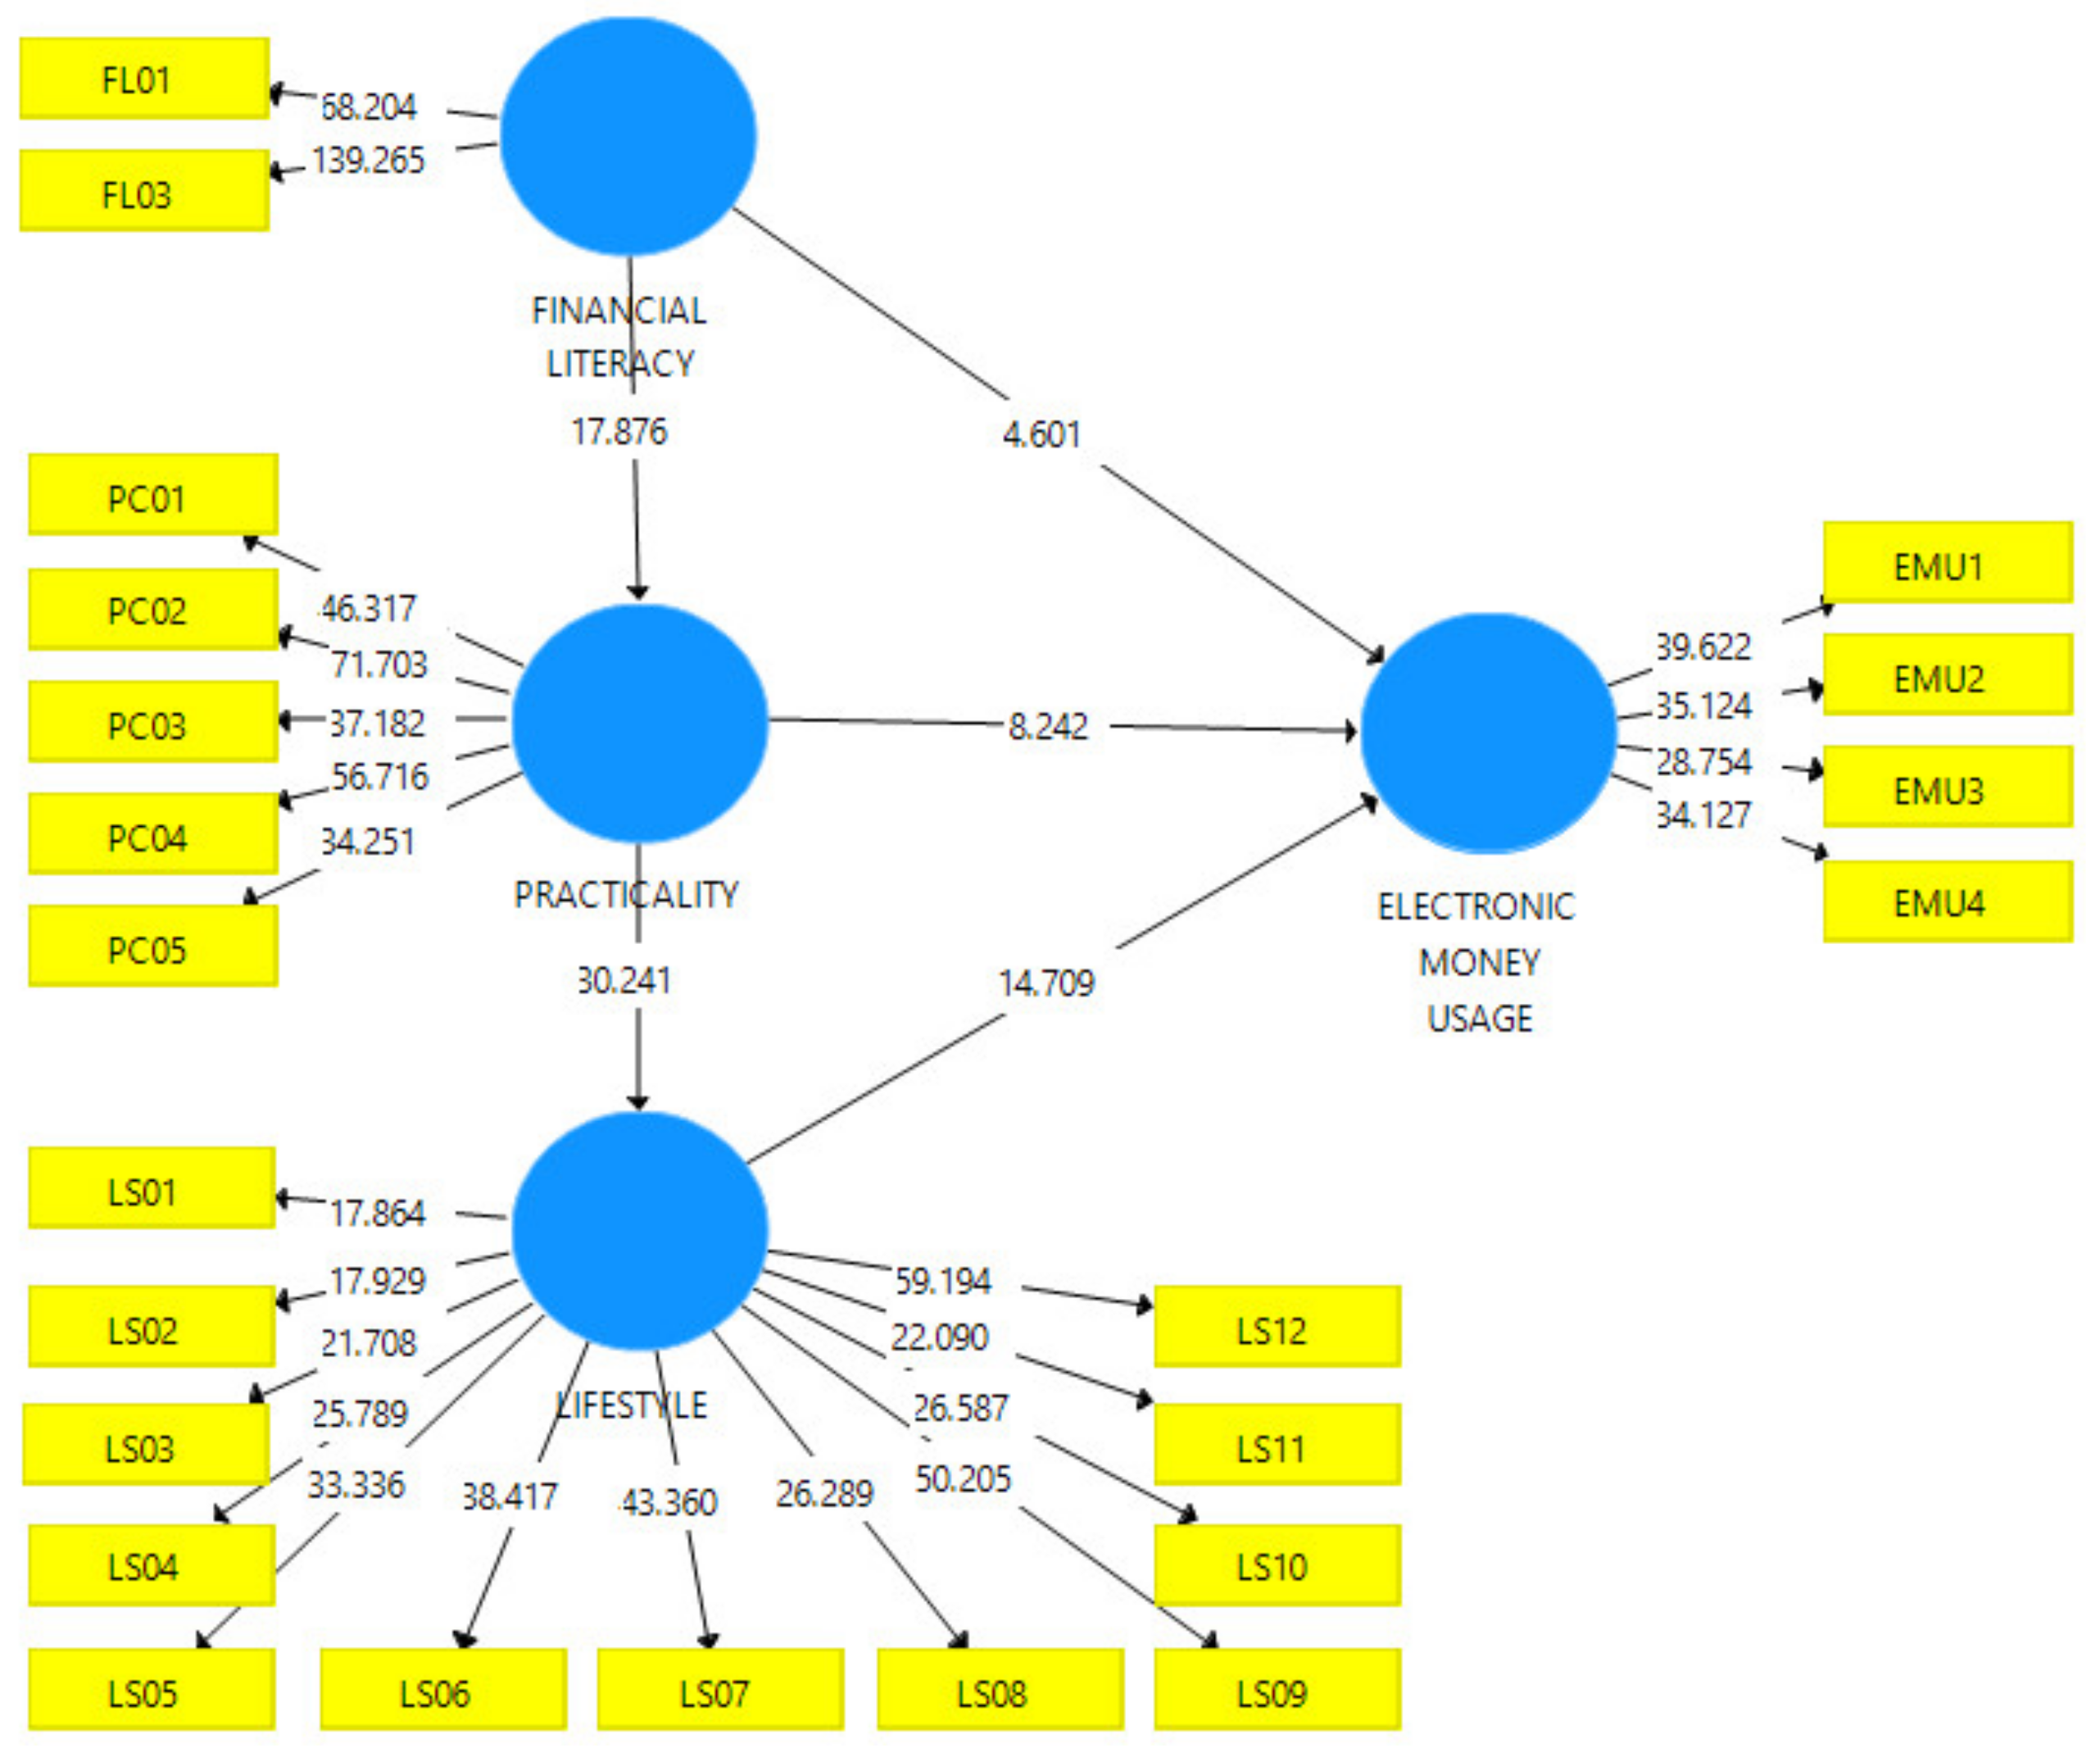
Figure 2 shows the magnitude of the path coefficient for each latent variable. Furthermore, the significance value can be seen through the bootstrap results given in Figure 3.
Figure 3 shows the magnitude of the t-statistic value of the relationship of each latent variable. In Figure 2 and Figure 3, you can see the magnitude of the path coefficient value and the t-statistic value, but for a clearer analysis, it will be shown in Table 10 and continued with hypothesis testing.
Based on the values of the path coefficient and p-value given in Table 10, it can be explained that:
Lifestyle towards Chip-Based Electronic Money Usage
Hypothesis 1 (H1).
Lifestyle has a positive effect on Chip-Based Electronic Money Usage;
Based on the table, the p-value is 0.000, and the path coefficient is 0.528. Because p-value < 0.05, then H1 is accepted. Thus, Lifestyle has a positive effect on Chip-Based Electronic Money Usage.
  • Financial Literacy on Chip-Based Electronic Money Usage
Hypothesis 2 (H2).
Financial Literacy has a positive effect on Chip-Based Electronic Money Usage;
Based on the table, the p-value is 0.000, and the path coefficient is 0.146. Because p-value < 0.05, then H2 is accepted. Thus, Financial Literacy has a positive effect on Chip-Based Electronic Money Usage.
2.
Practicality of Chip-Based Electronic Money Usage
Hypothesis 3 (H3).
Practicality has a positive effect on Chip-Based Electronic Money Usage;
Based on the table, the p-value is 0.000, and the path coefficient is 0.25. Because p-value < 0.05, then H3 is accepted. Thus, Practicality has a positive effect on Chip-Based Electronic Money Usage.
3.
Financial Literacy on Practicality
Hypothesis 4 (H4).
Financial Literacy has a positive effect on Practicality;
Based on the table, the p-value is 0.000, and the path coefficient is 0.518. Because p-value < 0.05, then H4 is accepted. Thus, Financial Literacy has a positive effect on practicality.
4.
Practicality to Lifestyle
Hypothesis 5 (H5).
Practicality has a positive effect on Lifestyle;
Based on the table, the p-value is 0.000, and the path coefficient is 0.713. Because p-value < 0.05, then H5 is accepted. So, practicality has a positive effect on Lifestyle.

4.3. Mediation Effect Test

The mediation effect test aims to see the relationship between the independent and dependent variables through the connecting variable. This means that the influence of the independent variable on the dependent variable can occur directly and through the connecting variable or the media. The results of the mediation effect test can be seen in Table 11 with the size of the p-value, t-statistics, and the indirect effect value, as follows.
Based on the values of the mediating effect test results given in Table 11, it can be explained that:
(1)
Financial Literacy on Lifestyle through Practicality
Hypothesis 6 (H6).
Financial Literacy affects Lifestyle through Practicality;
Based on the table, the p-value is 0.000, and the indirect effect is 0.369. This means that H6 is accepted, or Financial Literacy mediation model on Lifestyle through Practicality is accepted. Financial Literacy on Chip-Based Electronic Money Usage.
(2)
Financial Literacy on Chip-Based Electronic Money Usage through Practicality and Lifestyle
Hypothesis 7 (H7).
Financial Literacy affects Chip-Based Electronic Money Usage through Practicality and Lifestyle;
Based on the table, the p-value is 0.000, and the indirect effect is 0.195. This means that H7 is accepted, or the Financial Literacy mediation model on Chip-Based Electronic Money Usage through Practicality and Lifestyle is accepted.
(3)
Financial Literacy on Chip-Based Electronic Money Usage through Practicality
Hypothesis 8 (H8).
Financial Literacy affects Chip-Based Electronic Money Usage through Practicality;
Based on the table, the p-value is 0.000, and the indirect effect is 0.13. This means that H8 is accepted, or the Financial Literacy mediation model has an effect on Chip-Based Electronic Money Usage through accepted Practicality.
(4)
Practicality of Chip-Based Electronic Money Usage through Lifestyle
Hypothesis 9 (H9).
Practicality affects Chip-Based Electronic Money Usage through Lifestyle;
Based on the table, the p-value is 0.000, and the indirect effect is 0.376. This means that H9 is accepted, or the Practicality mediation model has an effect on Chip-Based Electronic Money Usage through Lifestyle is accepted.

5. Discussion

The analysis results can be used as a basis for discussion as follows:
Financial literacy has a significant positive effect on the interest in using chip-based electronic money. This means that the wider the person’s financial literacy, the higher the interest in using electronic money. This can be assumed because the wider the person’s financial literacy, the more likely that person will use technology that helps financial activities, i.e., chip-based electronic money.
Financial literacy has a significant positive effect on practicality in the use of chip-based electronic money. This means that the richer the understanding of a person’s financial literacy, the easier it is for that person to use chip-based electronic money. This can be assumed because if someone understands good financial literacy, someone will be easier to use chip-based electronic money which is basically practical. Thus, the practicality of access to chip-based electronic money is easy and not hampered.
Practicality in the use of chip-based electronic money has a significant positive effect on consumers’ lifestyles. This means that the existence of practical value in the use of chip-based electronic money affects consumer behavior in their financial lifestyle. This can be assumed because the practical value offered by chip-based electronic money allows consumers to prefer chip-based electronic money in transactions. Thus, it can shape the lifestyle of consumers who tend to prioritize chip-based electronic money for financial transactions.
Practicality has a significant positive effect on the use of chip-based electronic money. This means that the greater the value of practicality offered, the greater the person’s desire to use chip-based electronic money. This can be assumed because the easier and more practical the form of the product offered, the greater the person’s desire to use the product.
Consumer lifestyle has a significant positive effect on the use of chip-based electronic money. This means that the more advanced the person’s lifestyle makes the desire to use chip-based electronic money increases. In this study, it can be assumed that the more modern the person’s lifestyle is, it directly allows consumers to access the latest technology, one of which is chip-based electronic money. Thus, in this case, the lifestyle will affect the payment instrument chosen for transactions.

6. Conclusions

In this paper, research has been conducted on the analysis of the effect of financial literacy, practicality, and consumer lifestyle on the use of chip-based electronic money using the Structural Equation Model (SEM). Based on the analysis results, it can be concluded that the factors of financial literacy, practicality, and consumer lifestyle have a positive effect on the use of chip-based electronic money. The analysis results show that: (a) Financial literacy has a significant positive effect on interest in using chip-based electronic money with a path coefficient value of 14.8%; (b) Financial literacy has a significant positive effect on practicality in the use of chip-based electronic money with a path coefficient value of 51.2%; (c) Practicality in the use of electronic money has a significant positive effect on consumers’ lifestyles with a path coefficient value of 71.9%; (d) Practicality has a significant positive effect on the use of chip-based electronic money with a path coefficient value of 25.7%; and (e) Consumer lifestyle has a positive effect on the use of chip-based electronic money with a path coefficient value of 51.9%.
In this paper, the analysis of the effect of financial literacy, practicality, and consumer lifestyle on the use of chip-based electronic money only considers three influential factors. For further research, it is recommended for researchers to consider other factors which are more comprehensive.

Author Contributions

Conceptualization, B.F.; methodology, B.F. and S.; collecting data, B.F.; writing—original of paper draft preparation, B.F. and S.; writing—review and editing, M.D.J. and S.; visualization, M.D.J. and S.; supervision, S.; project administration, M.D.J. and S.; funding acquisition, B.F. and S. All authors have read and agreed to the published version of the manuscript.

Funding

This research received no external funding.

Institutional Review Board Statement

Ethical institutional review and approval were waived for this study because neither institution nor government was involved. In this study, there were no respondents on behalf of an institution or government. Therefore, this research can be validated only with the consent of the respondents. This is also following the regulations of Law Number 14 of 2008 concerning openness of public information (https://jdih.esdm.go.id/storage/document/UU%20No.%2014%20Thn%202008.pdf, accessed on 8 December 2021) and Law Number 11 of 2008 Articles 5 and 6 concerning the ratification of agreed information electronically or print media (https://jdih.kemenkeu.go.id/fulltext/2008/11tahun2008uu.htm, accessed on 8 December 2021).

Informed Consent Statement

All subjects gave their informed consent for inclusion before they participated in the study.

Data Availability Statement

Data is contained within the article.

Acknowledgments

The authors are grateful to referees for their careful reading, suggestion, and valuable comments which have improved the paper substantially.

Conflicts of Interest

The authors declare no conflict of interest.

References

  1. Aggarwal, S.; Brailovskaya, V.; Robinson, J. Cashing In (and Out): Experimental Evidenceon the Effectsof Mobile Money in Malawi. AEA Papers Proc. 2020, 110, 599–604. [Google Scholar] [CrossRef]
  2. Arifin, A.Z. Influence of Financial Attitude, Financial Behavior, Financial Capability on Financial Satisfaction. Adv. Soc. Sci. Educ. Humanit. Res. ASSEHR 2018, 186, 100–103. [Google Scholar]
  3. Safitri, M.; Sari, R.C. The Effect of Financial Knowledge and the Use of E-Money toward Financial Behavior of Undergraduate Students Faculty of Economics Yogyakarta State University. Nominal Barom. Ris. Akunt. Manaj. 2021, 10, 31–46. [Google Scholar] [CrossRef]
  4. Nugroho, A.; Najib, M.; Simanjuntak, M. Factors Affecting Consumer Interest in Electronic Money Usage with Theory of Planned Behavior (TPB). J. Consum. Sci. 2018, 3, 5–27. [Google Scholar] [CrossRef] [Green Version]
  5. Khoirunnisaa, J.; Johan, I.R. The Effects of Financial Literacy and Self-Control towards Financial Behavior among High School Students in Bogor. J. Consum. Sci. 2020, 5, 73–86. [Google Scholar] [CrossRef]
  6. Atkinson, A.; Messy, F.A. Measuring Financial Literacy: Results of the OECD International Network on Financial Education (INFE) Pilot Study; OECD Working Papers on Finance, Insurance and Private Pensions, 15; OECD: Paris, France, 2012; pp. 2–33. [Google Scholar]
  7. Boon, T.H.; Yee, H.S.; Ting, H.W. Financial Lit eracy and Personal Financial Planning in Klang Valley, Malaysia. Int. J. Econ. Manag. 2011, 5, 149–168. [Google Scholar]
  8. Farida, M.N.; Soesatyo, Y.; Aji, T.S. Influence of Financial Literacy and Use of Financial Technology on Financial Satisfaction through Financial Behavior. Int. J. Educ. Lit. Stud. 2021, 9, 86–95. [Google Scholar] [CrossRef]
  9. Asif, M.; Krogstie, J. Research Issues in Personalization of Mobile Services. Int. J. Inf. Eng. Electron. Bus. 2012, 4, 1–8. [Google Scholar] [CrossRef] [Green Version]
  10. Chuan, C.S.; Seong, L.C.; Chau, W.H. Financial Satisfaction, Resource Transfers and Bequest Motives among Malay sia’s Urban Older Adults. In Proceedings Book of ICETSR, 2014, Malaysia Handbook on the Emerging Trends in Scientific Research; PAK Publishing Group: Singapore, 2014; pp. 106–129. [Google Scholar]
  11. Falahati, L.; Sabri, M.F.; Paim, L.H.J. Assess ment a Model of Financial Satisfaction Predictors: Ex amining the Mediate Effect of Financial Behaviour and Financial Strain. World Appl. Sci. J. 2012, 20, 190–197. [Google Scholar]
  12. Widiyati, D.; Hasanah, N. Factors Affecting the Use of E-Money: Study on E-Money User in City of South Tangerang. Accountability 2020, 9, 36–45. [Google Scholar] [CrossRef]
  13. Filona, F.; Misdiyono, M. Factors affecting the adoption of electronic money using Technology Acceptance Model and Theory of Planned Behavior. Jurnal Ilmiah Ekonomi Bisnis 2019, 24, 108–120. [Google Scholar] [CrossRef] [Green Version]
  14. Ramadhani, R.; Nugroho, W. Analysis of the Effect of Exchange Rates, E-Money and Interest Rates on the Amount of Money Supply and Its Implications on the Inflation Level in Indonesia 2012–2017 Period. Int. J. Account. Financ. IJAFAP 2019, 2, 1–17. [Google Scholar]
  15. Lim, F.-W.; Ahmad, F.; Talib, A.N.B.A. Behavioural Intention towards Using Electronic Wallet: A Conceptual Framework in the Light of the Unified Theory of Acceptance and Use of Technology (UTAUT). Imp. J. Interdiscip. Res. IJIR 2019, 5, 79–86. [Google Scholar]
  16. Foon, Y.S.; Fah, B.C.Y. Internet banking adoption in Kuala Lumpur: An Application of UTAUT Model. Int. J. Bus. Manag. 2011, 6, 161–167. [Google Scholar]
  17. Padashetty, S.; Krishna, S.V. An Empirical Study on Consumer Adoption of Mobile Payments in Bangalore City: A Case Study. Int. J. Arts Sci. Commer. 2013, 4, 54–57. [Google Scholar]
  18. Igamo, A.M.; Falianty, T.A. The Impact of Electronic Money on the Efficiency of the Payment System and the Substitution of Cash in Indonesia. Sriwijaya Int. J. Dyn. Econ. Bus. 2018, 2, 237–254. [Google Scholar]
  19. Archana, V.R. Financial Inclusion for Banks in India. Int. Index. Ref. Res. J. 2012, 1, 45–46. [Google Scholar]
  20. Dash, M. Determinants of Customers’ Adoption of Mobile Banking: An Empirical Study by Integrating Diffusion of Innovation with Attitude. J. Internet Bank. Commer. 2014, 19, 25–29. [Google Scholar]
  21. Mensah, M.N.A.; Jumah, A. Electronic Money and Consumer Spending Behaviour: Evidence from Ghana. J. Adv. Manag. Appl. Econ. 2021, 11, 105–125. [Google Scholar] [CrossRef]
  22. Jack, W.; Suri, T. Evidence from Kenya’s Mobile Money Revolution. Am. Econ. Rev. 2014, 104, 183–223. [Google Scholar] [CrossRef]
  23. Jack, W.; Suri, T.; Townsend, R. Monetary Theory and Electronic Money: Reflections on the Kenyan Experience. FRB Richmond Econ. Q. 2010, 96, 83–122. [Google Scholar]
  24. Robb, C.A.; Woodyard, A.S. Financial Knowl edge and Best Practice Behavior. J. Financ. Couns. Plan. 2011, 22, 60–70. [Google Scholar]
  25. Yucha, N.; Setiawan, S.; Muttaqiin, N.; Ekasari, R.; Mauladi, K.F. Digital Payment System Analysis of Buying Decision in Indonesia. J. Asian Financ. Econ. Bus. 2020, 7, 323–328. [Google Scholar] [CrossRef]
  26. AL-Rawashdeh, B.; Abu-Errub, A.; Areiqat, A.; Dbbaghieh, M. Information Technology Role in Reducing E-Banking Services Risk in Jordanian Banking Sector. J. Comput. Sci. 2012, 8, 374–381. [Google Scholar]
  27. Govender, I.; Sihlali, W. A Study of Mobile Banking Adoption Among University Students Using An Extended TAM. Mediterr. J. Soc. Sci. 2014, 5, 453–457. [Google Scholar] [CrossRef]
  28. Yang, M.; Al-Mamun, A.; Mohiuddin, M.; Nawi, N.C.; Zainol, N.R. Cashless Transactions: A Study on Intention and Adoption of e-Wallets. Sustainability 2021, 13, 831. [Google Scholar] [CrossRef]
  29. Gerrans, P.; Speelman, C.; Campitelli, G. The Relationship Between Personal Financial Wellness and Financial Wellbeing: A Structural Equation Modelling Approach. J. Fam. Econ. Issues 2013, 35, 145–160. [Google Scholar] [CrossRef] [Green Version]
  30. Mondego, D.Y.; Gide, E. Exploring the Factors That Have Impact on Consumers’ Trust in Mobile Payment Systems in Australia. J. Inf. Syst. Technol. Manag. Jistem USP 2020, 17, e202017009. [Google Scholar] [CrossRef]
  31. Zhou, T. An Empirical Examination of Initial Trust in Mobile Banking. Internet Res. 2021, 21, 527–540. [Google Scholar] [CrossRef]
  32. Lipscomb, M.; Schechter, L. Subsidies Versus Mental Accounting Nudges: Harnessing Mobile Payment Systems to Improve Sanitation. J. Dev. Econ. 2018, 135, 235–254. [Google Scholar] [CrossRef]
  33. Khatimah, H.; Susanto, P.; Abdullah, N.L. Hedonic Motivation and Social Influence on Behavioral Intention of E-Money: The Role of Payment Habit as a Mediator. Int. J. Entrep. 2019, 23, 1–9. [Google Scholar]
  34. Aron, J. Mobile Money and the Economy: A Review of the Evidence. World Bank Res. Obs. 2018, 33, 135–188. [Google Scholar] [CrossRef] [Green Version]
  35. Kishore, S.V.K.; Sequeira, A.H. An Empirical Investigation on Mobile Banking Service Adoption in Rural Karnataka. SAGE Open 2016, 6, 1–21. [Google Scholar] [CrossRef] [Green Version]
  36. Moenjak, T.; Kongprajya, A.; Monchaitrakul, C. Fintech, Financial Literacy, and Consumer Saving and Borrowing: The Case of Thailand.; DBI Working Paper Series No. 1100; Asian Development Bank Institute: Chiyoda, Tokyo, 2020; pp. 1–32. [Google Scholar]
  37. Luburić, R. Knowledge and Learning in Terms of Operational Risk Management in the Financial and Banking Systems. Int. J. Qual. Res. 2016, 10, 559–568. [Google Scholar]
  38. Luburić, R.; Fabris, N. Financial Literacy in Terms of Quality of Life. In Proceedings of the VI International Conference "Quality System Condition for Successful Business and Competitiveness", Kopaonik, Serbia, 28–30 November 2018. [Google Scholar]
  39. Januaviani, T.M.A.; Sukono; Lesmana, E.; Kalfin. Modeling of Money Supply Using LASSO Regression and Simulated Annealing. J. Adv. Res. Dyn. Control. Syst. 2020, 12, 840–848. [Google Scholar]
  40. Januaviani, T.M.A.; Sukono; Lesmana, E.; Kalfin; Bon, A.T. Analysis of the factors affecting the money supply in Indonesia using the multiple linear regression model. In Proceedings of the International Conference on Industrial Engineering and Operations Management, Harare, Zimbabwe, 7–10 December 2020; Volume 59, pp. 1888–1895. [Google Scholar]
  41. Indonesian Bank. Nominal Electronic Money Users in Indonesia 2020 (Indonesia Bank. Nominal Pengguna Uang Elektronik di Indonesia 2020). Available online: https://www.bi.go.id/id/default.aspx (accessed on 8 December 2021).
  42. Kim, J.; Lennon, S.J. Effects of Reputation and Website Quality on Online Consumers’ Emotion, Perceived Risk and Purchase Intention: Based on the Stimulus-Organism-Response Model. J. Res. Interact. Mark. 2013, 7, 33–56. [Google Scholar] [CrossRef]
  43. Kirbis, I.Š.; Vehovec, M.; Galic, Z. Relationship Between Financial Satisfaction and Financial Literacy: Exploring Gender Differences. Drus. Istraz. 2016, 26, 165–185. [Google Scholar] [CrossRef] [Green Version]
  44. Hastings, J.S.; Madrian, B.C.; Skimmyhorn, W.L. Financial Literacy, Financial Education, Economy Outcome. Annu. Rev. Econ. 2013, 5, 347–373. [Google Scholar] [CrossRef] [Green Version]
  45. Lusardi, A.; Mitchell, O.S. The Economic Impor tance of Financial Literacy: Theory and Evidence. J. Econ. Lit. 2014, 52, 5–44. [Google Scholar] [CrossRef] [Green Version]
  46. Moon, C.S.; Ohk, K.; Choi, C. Gender Differences in Financial Literacy Among Chinese University Students and the Influential Factors. Asian Women 2014, 30, 3–25. [Google Scholar]
  47. Archuleta, K.L.; Dale, A.; Spann, S.M. College students and financial distress: Exploring debt, financial Satisfaction, and Financial Anxiety. J. Finan c. Couns. Plan. 2013, 24, 50–62. [Google Scholar]
  48. Yeo, J.H.; Fisher, P.J. Mobile Financial Technol ogy and Consumers’ Financial Capability in the Unit ed States. J. Educ. Soc. Policy 2017, 7, 80–93. [Google Scholar]
  49. Liu, G.-S.; Tai, P.T. A Study of Factors Affecting the Intention to Use Mobile Payment Services in Vietnam. Econ. World 2016, 4, 249–273. [Google Scholar]
  50. Kim, C.; Mirusmonov, M.; Lee, I. An Empirical Examination of Factors Influencing the Intention to Use Mobile Payment. Comput. Hum. Behav. 2010, 26, 310–322. [Google Scholar] [CrossRef]
  51. Elastika, R.W.; Sukono; Dewanto, S.P. Analysis of Factors Affecting Students’ Mathematics Learning Difficulties Using SEM as Information for Teaching Improvement. Int. J. Instr. 2021, 14, 281–300. [Google Scholar] [CrossRef]
Figure 1. Nominal Use of Chip-Based Electronic Money in Indonesia.
Sustainability 14 00032 g001
Figure 2. PLS Algorithm Output.
Sustainability 14 00032 g002
Figure 3. Bootstrap Output.
Sustainability 14 00032 g003
Table 1. Research variables and indicators.
Latent VariableIndicator
PracticalityPC01 Ease of use
PC02 Convenience to understand
PC03 Experience of use
PC04 Flexibility of use
PC05 Ease of Media Access
LifeStyleLS01 Preference for payment speed
LS02 Preference for Accuracy Payment
LS03 Feeling safe when making a transaction
LS04 Preferences for promotion
LS05 Payment efficiency perception compared to physical money
LS06 Family recommendation
LS07 Friend recommendations
LS08 Social environment recommendations
LS09 Availability of resources
LS10 Confidence in electronic payment tools
LS11 Confidence in electronic money benefits
LS12 Perception for payment tools
Financial LiteracyFL01 Ability to understand Financial Concepts
FL03 Ability to Manage Personal Finances
Electronic Money UsageEMU1 Use of electronic money because of its convenience
EMU2 Use of electronic money because the promotion is offered
EMU3 Use of electronic money due to trust in organizers
EMU4 Use of electronic money due to recommendations
Table 2. Summary of Measurement Model Evaluation Criteria.
Validity and ReliabilityParameterCriteria
Convergent ValidityLoading Factor
  • >0.70 for Confirmatory Research
  • >0.60 for Exploratory Research
Average Variance Extracted (AVE)>0.50 for confirmatory and exploratory research
Discriminant ValidityCross LoadingLoading to another construct is lower than its loading value on the construct
ReliabilityCronbach’s Alpha
  • >0.70 for Confirmatory Research
  • >0.60 still acceptable for exploratory research
Composite Reliability
  • >0.70 for Confirmatory Research
  • >0.60 still acceptable for Exploratory Research
Table 3. Summary of the Evaluation Criteria for the Structural Model.
ParameterCriteria
R-square0.67; 0.33 and 0.19 (indicating strong, moderate and weak modes)
Significance Level5% (0.05)
Table 4. Parameter Value of Loading Factor.
VariablesIndicatorLoading ValueStatus
LifestyleLS010.663Passed
LS020.666Passed
LS030.679Passed
LS040.672Passed
LS050.726Passed
LS060.744Passed
LS070.77Passed
LS080.711Passed
LS090.823Passed
LS100.735Passed
LS110.685Passed
LS120.831Passed
Financial LiteracyFL010.883Passed
FL030.914Passed
Chip-Based Electronic Money UsageEMU10.787Passed
EMU20.761Passed
EMU30.733Passed
EMU40.727Passed
PracticalityPC010.822Passed
PC020.883Passed
PC030.768Passed
PC040.873Passed
PC050.799Passed
Table 5. AVE Parameter Values.
Latent VariablesAverage Variance Extracted (AVE)Details
Lifestyle0.566Passed
Financial Literacy0.808Passed
Chip-Based Electronic
Money Usage
0.529Passed
Practicality0.689Passed
Table 6. Cross Loading Parameter Value.
Chip-Based Electronic Money UsageFinancial LiteracyLifestylePracticality
EMU10.7870.5300.6750.524
EMU20.7610.3540.6330.380
EMU30.7330.4320.5530.654
EMU40.7270.4630.5210.547
FL010.4720.8830.4880.455
FL030.5900.9140.5940.476
LS010.4040.3300.6630.430
LS020.4000.3200.6660.433
LS030.4940.3450.6790.439
LS040.6140.4420.6720.450
LS050.6590.4570.7260.593
LS060.6840.5040.7440.534
LS070.5620.4830.7700.462
LS080.4540.4060.7110.508
LS090.6620.5510.8230.590
LS100.5980.4310.7350.589
LS110.5740.3520.6850.545
LS120.6930.5720.8310.584
PC010.6160.5340.6220.822
PC020.5360.4360.6330.883
PC030.7070.4480.6310.768
PC040.5330.3870.5370.873
PC050.4660.2970.4940.799
Table 7. Composite Reliability Parameter Value.
Latent VariablesComposite ReliabilityDetails
Lifestyle0.839Passed
Financial Literacy0.894Passed
Chip-Based Electronic Money Usage0.931Passed
Practicality0.917Passed
Table 8. Parameter Value of Cronbach Alpha.
Latent VariablesCronbach’s AlphaDetails
Lifestyle0.744Passed
Financial Literacy0.764Passed
Chip-Based Electronic Money Usage0.919Passed
Practicality0.887Passed
Table 9. Value of R-Square Variable.
R SquareDetails
Lifestyle0.508Moderate
Chip-Based Electronic Money Usage0.681Strong
Practicality0.268Weak
Table 10. Path Coefficient and p-Value.
Coefficientp-ValueDecision
Lifestyle -> Chip-Based Electronic Money Usage0.5280.000Reject Null Hypothesis
Financial Literacy -> Chip-Based Electronic Money Money Usage0.1460.000Reject Null Hypothesis
Practicality -> Chip-Based Electronic Money Usage0.250.000Reject Null Hypothesis
Financial Literacy -> Practicality0.5180.000Reject Null Hypothesis
Practicality -> Lifestyle0.7130.000Reject Null Hypothesis
Table 11. Summary of Mediation Effect Test Results.
Original Sample (O)T-Statisticsp-ValueDecision
Financial Literacy -> Practicality -> Lifestyle0.36912.7890.000Reject Null Hypothesis
Financial Literacy -> Practicality -> Lifestyle -> Chip-Based Electronic Money Usage0.1959.5080.000Reject Null Hypothesis
Financial Literacy -> Practicality -> Chip-Based Electronic Money Usage0.137.0030.000Reject Null Hypothesis
Practicality -> Lifestyle -> Chip-Based Electronic Money
Usage
0.37612.5690.000Reject Null Hypothesis
Publisher’s Note: MDPI stays neutral with regard to jurisdictional claims in published maps and institutional affiliations.

