Article

Urban Rail Transit in Bangkok: Chronological Development Review and Impact on Residential Property Value

by
Varameth Vichiensan
1,2,*,
Vasinee Wasuntarasook
1,
Yoshitsugu Hayashi
3,
Masanobu Kii
4 and
Titipakorn Prakayaphun
5
1
Department of Civil Engineering, Faculty of Engineering, Kasetsart University, Bangkok 10900, Thailand
2
Center for Logistics Engineering Technology and Management, Faculty of Engineering, Kasetsart University, Bangkok 10900, Thailand
3
Center for Sustainable Development and Global Smart City, Chubu University, Kasugai 487-8501, Japan
4
Faculty of Engineering and Design, Kagawa University, Takamatsu 761-0396, Japan
5
Department of Constructional Engineering, Graduate School of Engineering, Chubu University, Kasugai 487-8501, Japan
*
Author to whom correspondence should be addressed.
Sustainability 2022, 14(1), 284; https://doi.org/10.3390/su14010284
Submission received: 8 November 2021 / Revised: 13 December 2021 / Accepted: 16 December 2021 / Published: 28 December 2021
(This article belongs to the Special Issue Sustainable Urban Design: Urban Externalities and Land Use Planning)

Abstract

:
Bangkok suffered from the world’s worst traffic congestion in the 1990s due to rapidly increasing car ownership, reflecting the economic growth and road-dependent transport policy beginning in the 1960s. Due to its monocentric but scattered urban structure, traffic congestion is severe, causing tremendous economic loss, deteriorating air quality, and badly affecting the quality of life. A historical review reveals that the urban and transport plan and development were not efficiently coordinated, resulting in unorganized suburbanization and progressively more severe traffic congestion. It is important to reveal the impact of the transportation project on the housing market in order to incorporate the policies for transportation and urban development. To define the impact, the OLS hedonic price model and the local multiscale geographically weighted regression (MGWR) model were estimated, along with the condominium sales data. The results revealed that the impact of rail transit on a rise in property value significantly varied across the study area. It was estimated that, for the area along the major rail transit corridor in the city center, a premium of a location 100-m closer to the station would be more than 200 USD per square meter. At the same time, the value would be less than 80 USD for the area along the rail corridor in the suburb. These findings provide policy insights for future urban and railway development, including the proper coordination of rail transit development and urban development with subcenters, transit-oriented development, and improved pedestrian flow around transit stations.

1. Introduction

Large cities in developing countries are typically characterized by inadequate public transport service, high car dependency, and consequent traffic congestion. Private transport is dominant, while road provision is found to be positively correlated with congestion in Asian cities [1]. Urban rail transit systems have been planned and developed to reduce congestion and enhance economic development in the urban areas, which often sheds light on land value acquisition in order to capitalize on the benefits introduced by rail transit [2].
Bangkok, the capital of Thailand, is known as one of the world’s most traffic-congested cities [3]. The problem is caused by its high population density, poor road hierarchy, and the rapidly increasing car ownership reflecting the high economic growth that resulted in a road-oriented transport policy beginning in the 1960s. Due to its monocentric urban structure, the large but scattered central core attracted suburban commuters accessing work, education, business, commercial, recreation, and other activities. However, as public transport was insufficient and of poor quality, car ownership and dependency continuously increased, resulting in a large amount of private vehicle traffic entering and departing the city center, which combined with cross-city travel severely congests the road network. Traffic congestion has caused huge economic loss, large energy consumption, deteriorated air quality, and badly affects the inhabitant’s quality of life [4]. Over past decades, the government implemented a transit master plan and developed several rail transit lines to alleviate and solve the urban problems caused by traffic congestion.
Opened in 1999, the first two urban rail transit lines significantly influenced the increase in property value along the rail corridors in terms of the residential property price, listing land price, or assessed land values [5,6]. Following the first two lines, another five rail transit lines have been developed. Real estate development along the rail corridors was apparent, and high speculation occurred in some areas. However, the actual number of passengers using these rail transit lines is still lower than forecast in the master plan. Many people still use private cars, meaning the traffic congestion problems have not been relieved and are perhaps getting worse.
A preliminary question this study addresses is how the urban rail transit projects were developed and the impact they had on urban development in Bangkok. Whether urban rail transit would increase land values, and subsequently residential property values, the spatial variation of the impact upon a geographical area (i.e., city structure and the overall rail transit network) was still unclear. Moreover, the impact might be different at different project phases, for example, during the project announcement period, the construction period, the opening period, and extending to whether delays might occur at some time following the opening of the service, etc.
The objectives of this study were, firstly, to investigate the planning and development of the urban rail transit system in the Bangkok metropolitan area along with its influence on urban development. Secondly, we examined the spatial distribution of the urban rail transit impact regarding a rise in residential property value. The findings of this study define a need for more efficient integration of urban and public transportation planning and development. We also provide useful information concerning how to capitalize on benefits brought by urban rail transit development, and shed light on a land value capture instrument. Moreover, this study gives evidence of rising land values in the context of a developing country, and takes a spatial distribution of the effects into consideration.
The paper proceeds as follows. The following section presents a historical review of urban development in Bangkok, including its urban rail transit development. Section 3 describes an analysis of the impact rail transit development has on rising property value, in which the literature review, data, model, and results are presented. Section 4 discusses the results and policy implications. The paper concludes with a final remark and defines some limitations in Section 5.

2. Chronological Review of Urban Rail Transit Development in Bangkok

In 1782, the city of Bangkok was founded on the right bank of the Chao Phraya River. Canals were dug for transportation and security reasons, and they also drew people to live along the waterway network. The city expanded along the canals as they were dug further, the reason that Bangkok was once dubbed “the Venice of the East”.
Since the introduction of western-style roads in the 1860s, water-based transport systems were replaced by more convenient road-based transport systems, such as rickshaws and horse-drawn trams. The transition away from water-based transportation has been regarded as the starting point for ribbon development. Cars and electric trams were introduced in the 1900s. Electric trams operated for nearly 70 years until the service was discontinued in 1968 due to tram track systems being blamed for blocking road traffic.
The first National Economic and Social Development Plan, which focused on national economic growth, was launched in 1961. Infrastructure, particularly transportation and communication, was prioritized as a result of the decentralized policy implemented in all regions. Development of roads and highways to connect the entire country began, with Bangkok as its starting point. In contrast, the focus of railway development was on making existing services more efficient and sufficient to meet demand. The plan also mentioned traffic congestion in Bangkok and how to solve problems by building and expanding roads. Furthermore, the promotion of investment in the industrial sector, where Bangkok was the only port and had access to infrastructure, attracted factories to Bangkok and its surrounding areas.
The Greater Bangkok Plan 2533, or the Litchfield Plan, the first comprehensive Bangkok urban planning initiative, was launched in 1960 by an American consultant of the same name. It includes a land-use plan, transportation projects, and public utility projects. This was a road network-oriented city modeled after American cities. However, despite the plan’s recommendations, there has been a significant amount of network construction to meet traffic demand. The first town planning act, which used the Litchfield Plan as a model, was passed in 1975.
Most economic, industrial, and service activities are concentrated in cities, resulting in increased migration from the countryside to cities. The construction of a road network to spread prosperity to the vacant suburbs is still ongoing. Accessibility and cheaper land in the outskirts contribute to residential and commercial development as well. The city has grown along arterial roads in all directions, with industrial, residential, and commercial locations causing the city’s urban territory to expand. Since residential areas are settled on the outskirts of the city while the Central Business District (CBD) is located in the inner core, uncontrolled urban sprawl results in longer commutes to commuter destinations such as workplaces and schools. People rely on private vehicles to travel because public transportation is insufficient to meet demand.

2.1. Urban Rail Transit Planning and Development

To alleviate traffic congestion, urban rail transit for Bangkok has been proposed, studied, planned, and developed through a series of studies and plans, as summarized in Table 1. In 1972, the Thai government requested the German government assistance in studying, planning, and solving traffic congestion problems, resulting in the Bangkok Transport Study [7], which proposed a plan for highway and mass rapid transit development, as well as car usage restrictions and city planning. This plan proposed an elevated bus system as the first phase of mass transit, which would transform into heavy rail later; however, the plan was not implemented. Following this, no transportation plans were in place until 1994.
In 1994, the first mass rapid transit master plan, the Mass Rapid Transit System Master Plan (MTMP), was launched. This master plan was regarded as an integrated framework of urban rail transit systems in BMR, the main concept of which was heavily influenced by a recommendation of reforming Bangkok based on Transit Oriented Development, a study by JICA (Japan International Cooperation Agency) conducted during 1992 and 1996 [8,9]. It proposed to build a railway network in the urban area in two phases between 1995 and 2011, covering a total distance of 135 km. The Conceptual Mass Rapid Transit Implementation Plan (CTMP), an adapted version of the MTMP plan, recommended the construction of 179-km of rail transit in 1996.
During the 1997 economic crisis, three projects of the rail transit system were undertaken: the Hopewell project, the Bangkok Transportation System (commonly known as BTS SkyTrain, presently the dark and light green lines), and the blue line. The mass transit development plan was put on hold due to financial difficulties, as the economic situation was not conducive to investment. As a result, existing rail transit schemes were modified from their original plans, and all other proposed construction, including the ongoing Hopewell project, was suspended. In addition, a feeder plan was proposed in 1998 to develop an additional 11 feeder-type mass transit system, including light rail and monorail systems, to facilitate access to the main transit lines. Following the financial crisis, the Urban Rail Transportation Master Plan (URMAP) in BMR was announced in 2000, which proposed building 375 km of rail transit network within 20 years. This plan was a guide for urban development that used a radial-circumferential pattern to spread the city center densities out by rail transit.
After the economic recovery, a new plan was announced in 2004, namely The Bangkok Mass Transit Implementation Plan (BMT), which included the first phase of rail transit development with a railway network of 291 km, and was expected to be completed by 2009. In 2006, a new rail transit network was proposed, updating the BMT plan from 7 to 10 railway lines totaling 365.5 km covering the Bangkok metropolitan region. Due to the project implementation, feasibility in socioeconomic, planning, and detailed design were reviewed again to ensure compliance with general infrastructure development standards. Furthermore, the bidding process was altered to allow foreign investment in megaprojects under the “Thailand: Partnership for Development” scheme. However, the implementation of the master plan did not proceed as planned due to funding shortfalls and construction delays. The rail transit development plan was reviewed once again. In 2007, the cabinet approved 5 urgent rail transit projects of 135 km in length. Because of rapid suburban development, an updated rail transit network was proposed in 2008 to cover a larger area, having 9 railway lines covering 311 km.
As a result of the changing economic, social, and land use conditions, the rail transit plans were updated several times over the past decade. The latest rail transit master plan is the so-called Mass Rapid Transit Master Plan (M-Map) that has been in place for over 10 years, up to the writing of this article. It represents a 20-year development plan for an urban railway from 2010 to 2029, consisting of 12 railway lines totaling 509 km [10].
It can be observed that during the ten years (2000 to 2010), there were more than five revisions of the rail transit master plan. The constructions were significantly delayed, meaning opening the service was also delayed. The incomplete network directly affected the ridership, and poor network coverage and connectivity have made rail travel less popular than expected.
To cope with the changing situation, the government has recently begun developing the second mass rapid transit master plan (M-Map2) that is expected to more efficiently integrate the rail transit system with the other public transport modes under the current urban form [11].
As of October 2021, 7 urban railway lines of 208 km have been in operation: the dark green, light green, blue, airport rail link, purple, dark red, and light red lines. An additional three lines of 86.1 km, the pink, yellow, and orange lines, are under construction and expected to open by 2024, as summarized in Table 2. It is noted that the actual ridership of every line is less than forecast. In addition to these rail transit lines designated in the rail transit master plan, there were the bus rapid transit (BRT) (length of 15.9 km, 12 stations) opened in 2010 and the gold line of an automated people mover (length of 2.7 km, 3 stations) opened in 2021, respectively.
The development of the first three railway lines (the dark and light green lines since 1999 and the blue line since 2004) presented an image of the urban railway as a clean, comfortable, and fast mode of transport which has efficiently attracted young and middle-income people who would otherwise travel by private cars. With the additional two lines of the airport rail link and the purple line, the rail transit ridership has been increasing, as clearly shown in Figure 1. The total number of urban rail transit passengers reached more than 1 million trips per day in late 2019, just prior to the COVID-19 pandemic.
However, due to the limited coverage of the rail transit network and inefficient feeder service, many people still shifted away from public transport and relied heavily on private cars. As evidenced by the decreasing number of bus passengers but continuously rising number of private vehicle registrations at an approximate increase rate of 32.8% per year, as shown in Figure 2.
Road traffic congestion continues and is becoming even more severe than before. The average speed on the main road is shown in Figure 3, revealing that the morning congestion is more severe. It is worth noting that during September 2011 and December 2012, the government launched its “first-car policy” that refunded the excise tax to the car buyers to boost the domestic economy. However, this suddenly increased by more than 1.25 million the number of private cars nationwide, including in the severely congested Bangkok area, and has made the traffic more terrible, as reflected by a jump in car registrations and reduced speeds during 2012, shown in Figure 2 and Figure 3.

2.2. Land Value Appreciation along the Urban Rail Corridors

This section investigates the change in land value along the railway corridors. The assessed land value is officially published by the Treasury Department of Thailand every 4 years. The assessment is done over a road section based on locational attributes such as land use category, proximity to main roads, size of a land parcel, etc. The assessed land value is used to levy the property’s taxes over the 4-year period. Figure 4 shows the change of the assessed land value of some selected locations along the present and the near future railway corridors, as published in the years from 1996 to 2016, which were used in 2020 and extended to 2021 due to the COVID-19 pandemic. The GDP per capita is shown to reference the economic status at each period. It is observed that the Asian economic crisis of 1997 was reflected by a drop in land values for several years until the recovery started in 2000. The land value in the CBD along the dark and light green lines has highly appreciated compared with that of the blue line. The areas of the blue, dark green south extension, and airport link line have moderately appreciated. For the newly opened blue line west extension and the under-construction yellow and pink lines, the land appreciated very little. However, a rise in land value along the purple line has been obvious since 2008, when the construction started.
While real estate along the first generation of rail lines (initial sections of the dark and light green lines and the blue line) exhibited a significant land value rise, the construction of the second-generation sections (i.e., extensions of the existing lines and the new lines) caused a boom in the real estate along these new corridors. This is obvious for the purple line in the suburb where many new high-rise residential projects were developed. But as sales were not good, many condominium units remain empty.

3. Analysis on Impact of Rail Transit Development

As the rail transit development in Bangkok over the past decades has drastically changed people’s thinking and lifestyle, this study examines its impact on urban development.

3.1. Literature Review

3.1.1. Property Value Uplift

The development of urban rail transit has impacted the urban area in various dimensions. For example, the light rail transit in London had great impact on spatial accessibility and social equity [12]. The light rail transit in Los Angles was found to have a synergy effect on the bus ridership [13]. The Bay Area Rapid Transit (BART) in San Francisco moved the city toward a multi-centered structure [14]. A study in Wuhan, China, found that rail transit has a significant impact on future land-use change and land-use density [15]. A study in the Dallas-Fort Worth metropolitan area similarly found that rail transit stations positively impacted population density [16]. The light rail transit in Addis Ababa was perceived to have a high contribution concerning urban sustainability in various dimensions, i.e., economically, socially, and environmentally [17]. The new metro Line 4 in Rio de Janeiro was found to have significantly reduced the vehicle-kilometer traveled (VKT), energy consumption, and carbon emission [18]. A study of 35 Chinese cities over twelve years revealed that rail transit markedly elevated the real estate prices while taking into account such external factors as GDP per capita, economic climate, and population density [19].
Urban rail transit was found to have a great impact on real estate. In many cases, it was found that rail transit station proximity had a positive impact on residential property value, such as in Shanghai [20], Kuala Lumpur [21], Bangkok [6,22,23,24], Portland [25], Buffalo [26], London [27], Hamburg [28], Lisbon [29], Melbourne [30], etc. However, in some cities the impact was not spatially even across the city, i.e., being positive and negative in different areas, such as reported in San Diego [31], Tyne and Wear region [32], Ottawa [33], etc. By contrast, a study in the Netherlands found that the Randstad Rail had a positive effect on the residential properties within a 400 to 800 m radius, but had a negative effect on the value of residential properties in close proximity, within a 400-m radius, to the station, [34]. Astonishingly, a study in Jakarta found that the proximity of rail transit stations did not exhibit a significant impact on property value [35].
Moreover, some studies found that the impact of rail transit station proximity was not stable over time. A study of the subway in Seoul found that the rail transit impact on property value was significantly positive only prior to the service opening [36], while a study in Sydney found that the impact was negative in the project announcement stage but turned positive in the project construction phase [37].

3.1.2. Hedonic Pricing Model

The hedonic approach has long been employed to analyze the impact of urban rail transit on property value. The hedonic price model generally considers property value as a function of structural characteristics, transport accessibility, and neighborhood environment. Different forms of hedonic price models have been adopted.
The dependent variable, which is the property value, could be the listing price of the property [29,32], the assessed property value [38], or the actual transaction price [21,39,40,41,42,43]. The price in different years would be adjusted for inflation and other external factors [30]. The value of the property price may be considered as the total price [24,25,27,28,33,36,37,43,44,45,46] or the price per unit area, i.e., price per square foot or per square meter of the area [6,20,22,23,26,31,34,35,39,47,48,49,50,51,52].
Structural characteristics may include size, building age, number of rooms, other functions, etc. Transport accessibility includes proximity to transport facilities such as (mostly) rail transit station, bus stop [45,48], freeway, major highway, bike-sharing station [48], bus frequency [53], rail service [30], etc., while some studies consider activity opportunities [32,52]. The proximity of a rail transit station could be represented as straight line distance [23,31,44,47], network distance [54], or another impedance measure such as travel time [39]. Neighborhood attributes include distance to CBD [26,30,31,36] or subcenter [20,41,54], public services such as shopping, education, healthcare, parks, etc. Some studies include land use characteristics or transit-oriented development (TOD) environments such as a mixed land-use type, job-housing balance, the density of certain population groups, etc. [47]. Some studies considered the interaction between accessibility and the TOD environment [54].
The hedonic regression model can be specified as follows.
y = X β + ε
where y is a vector ( n × 1 ) of observations corresponding to a dependent variable, X is a matrix ( n × k ) of observations of k independent variables, β is a vector ( k × 1 ) of regression parameters, ε is a vector ( n × 1 ) of errors assumed to be normally distributed.
The functional form could be linear [23,25,26,31,33,43,47,48,51,53], semi-log [20,24,27,28,29,30,34,35,36,37,41,42,44,46,49,50,52], or log-linear (log-log) [6,21,22,39,45,55]. Temporal dimension could be incorporated in the model by adding a dummy variable of year [25,31].
The ordinary least square (OLS) model solution for the coefficients is obtained as
β ˆ = ( X X ) 1 X y

3.1.3. Model with Spatial Effects

Spatial effects refer to spatial dependence and spatial heterogeneity [56,57]. Spatial dependence refers to the spatial relationship of a variable’s values for a pair of locations at a distance apart. Spatial heterogeneity refers to the uneven distribution of a variable’s value across space. To take into account the spatial effects, spatial lag or spatial error terms may be added to the classical OLS model [23,38,41,45,46,48,52,54]. The estimation gives a single solution of variable coefficients and the spatial parameters over the study area, i.e., the global model.
In contrast to the global spatial hedonic model, research over the past decade paid attention to the local variation of the solution over the study area, i.e., so-called nonstationarity, which refers to a situation when parameter estimates vary across the study area.
Geographically weighted regression (GWR) was developed to reflect the nonstationarity [58]. In hedonic study, GWR has been employed to determine the impact of rail transit on property value [6,21,22,30,32,33,40,41,42,44,45,46,50,59]. For example, a study in Tyne and Wear Region, UK, using GWR, found that nonstationarity exists in the relationship between transport accessibility and land value, in which the transport accessibility has a positive effect on land value in some areas but has a negative or no effect in the other areas [32].
As GWR is a regression model in which the coefficients, β , are allowed to vary spatially [40,58], the OLS model may be rewritten for each local model at observation location o as follows:
y o = X o β o + ϵ o
where the sub-index o indicates an observation point where the model is estimated. The coefficients β o are determined by examining the set of points within a well-defined neighborhood of each of the sample points. The local solution for the coefficients is obtained as
β ˆ o = ( X W o 1 X ) 1 X W o 1 y
where W o is the diagonal matrix denoting the geographical weighting of each observed data for regression point o.
The weighting scheme W o is calculated with a kernel function based on the proximities between regression point o and the N data points around it. Several kernel functions can be used for the weighting scheme. For example, a Gaussian kernel function is specified with the diagonal elements are defined by w o i = exp ( d o i 2 / θ 0 2 ) and the off-diagonal elements are all equal to 0, where d o i is usually the Euclidean distance between the estimation point o and the data point i, θ o is a parameter, the so-called bandwidth for the estimation point o. Some studies used non-Euclidean distance and obtained not only a better model fit but also useful insights into the nature of the subject being studied [40].
The optimal value of the bandwidth can be found by minimizing the cross-validation score, minimizing the Akaike Information Criterion (AIC), which accounts for a trade-off between accuracy and complexity, or the corrected version of the Akaike Information Criterion (AICc), which takes into account the sample size [40]. As a traditional goodness-of-fit indicator, the conventional coefficient of determination (R2) and adjusted R2, which consider the sample size and number of explanatory variables, are determined.
As the classical GWR model is estimated based on a single value of the optimal bandwidth for the whole model, the Multiscale Geographically Weighted Regression (MGWR) was developed [60]. MGWR relaxed this assumption by allowing different bandwidths to be used with different explanatory variables. The estimation of the MGWR model involves multiple different bandwidths for given variables at the same time, i.e., it uses a back-fitting approach where the ordinary GWR is initialized, and goodness-of-fit for each variable is tested to find the most suitable bandwidth to reflect the scale of operation for the given dataset [60,61]. Recently MGWR was used in the hedonic analysis, for example to determine the factor influencing Airbnb property listing price [61].
Moreover, the GWR model framework has been used in related researches, such as in determining the impact of transportation on land-use change [58], the impact of a constructed environment on rail transit ridership [62], or in various spatial econometric such as spatial interpolation [63], etc.

3.2. Data

The study area was the Bangkok metropolitan region (BMR), covering the 7762 square-kilometer area with a registered population in 2021 of 11 million persons and 5.9 million households. It comprises Bangkok (the country’s capital governed by the Bangkok Metropolitan Administration (BMA) and five surrounding provinces: Nonthaburi, Pathum Thani, Samut Prakan, Samut Sakhon, and Nakhon Pathom. BMR is a monocentric city with a large urban core in the center where high-density commercial and residential areas are concentrated.
The target residential property was the condominium building located within 3 km (the road network distance) from the nearest station. As the transaction price of the private property sale was not disclosed to the public, this study was based on the listing price of a condominium. Data collection was conducted in September 2021 by gathering the listing price and associated structural characteristics: building age and building category. By screening out the super-luxury properties having a unit price of more than Thai Baht 300,000 per square meter, 512 condominium buildings or projects were used as data for this study. They were both finished, fully furnished, ready-to-move, or under construction. Some condominiums had more than one layout type: studio room, 1-bedroom unit, 2-bedroom unit, duplex unit, etc., resulting in different prices even in the same building. In total, we collected 1374 condominium sale units and determined an average price for each property to be used for the subsequent analysis (n = 512). The descriptive statistic of the condominium unit data is presented in Table 3, and the distribution of listing price per floor area is shown with reference to the corridor of the ten urban railway lines and a BRT line in Figure 5.
The mean listing price was Thai Baht, THB 4916,129.92 (approximately USD 147,134.51). The mean listing price per unit floor area was THB 113,626.89 (approximately USD 3399.97), and the mean floor area was 40.96 square meters, considered as a representative size of a condominium unit when interpreting the result. The average age of the building was about 2 years, of which more than half were newly constructed or under construction. Among the sample buildings, the proportion of the high-rise category (more than 8 stories) and the low-rise category (not more than 8 stories) was nearly equal.
The locational characteristics include the linear distance of the condominium to the city center (Siam interchange station of the two green lines), the network distance to the nearest station of the urban railway lines or bus rapid transit (BRT), and the linear distances to shopping mall, hospital, and university, respectively. The network distance is considered for the station proximity to reflect the travel route of the network, which is usually longer than the linear distance. On average, the condominium was about 1 km away from the station, although many were located very close to the station within walking distance.
It is worth noting that some common explanatory variables in a general hedonic pricing model were not entered in the final model presented in this paper. For instance, the locational characteristics such as proximity to a public park or elementary school were preliminarily investigated and found to not have a significant influence on the condominium price. This finding was judged intuitive to the local circumstance and lifestyle in which the condominium residents were mostly middle-aged workers or young university students who had less interest in a public park or elementary school. Similarly, proximity to a main road or bus stop were also not significant because all the sampled condominiums were located along the urban railway corridors that usually coincided with the main road corridors, so they all had access to bus stops within walking distance, i.e., the effects were common and not as significant as the other variables being analyzed.

3.3. Model Specification

In this study, due to the skewness in the data, the regression model is specified as log-log expression in which the listing price is the dependent variable and the characteristics of the condominium unit as the locational characteristics are the explanatory variables as follows:
ln ( P r i c e P e r S q m ) = β 0 + β 1 ln ( A r e a ) + β 2 H i g h r i s e + β 3 Age + β 4 ln ( D i s t C B D ) + β 5 ln ( D i s t S t n ) + β 6 ln ( D i s t M a l l ) + β 7 ln ( D i s t H o s p ) + β 6 ln ( D i s t U n i v )
where ln (   ) is the natural logarithm; P r i c e P e r S q m is the listing price per square meter of a condominium in Thai Baht; A r e a is the area of each condominium unit in square meter; H i g h r i s e is a dummy variable: the value is 1 if the building has more than 8 stories and 0 otherwise; D i s t C B D is the linear distance to the city center (the green line’s Siam Station) in kilometers; D i s t S t n is the network distance to the nearest station in kilometers; D i s t M a l l is the linear distance to the nearest shopping mall in kilometers; D i s t H o s p is the linear distance to the nearest shopping mall in kilometers; D i s t U n i v is the linear distance to the nearest university in kilometers; β 0 , β 1 ,…, β 6 are the parameters to be estimated with the data.
The GWR and MGWR models are specified similarly to the OLS model but, for the data of n observations, we have n local models with n specific parameters for each location, i.e., β 0 n , β 1 n ,…, β 6 n . The weighting scheme is based on the adaptive bi-square kernel function: w o i = ( 1 d o i 2 / θ 0 2 ) 2 for d o i < θ and w o i = 0 otherwise; where o indicates the estimation point and i indicates the other data point. This provides a continuous, near-Gaussian weighting function up to distance θ from the regression point and then zero weights any data points beyond θ , but more numerically efficient.
The OLS model was estimated by using IBM SPSS Statistics 27 software [64], while the GWR and MGWR models were estimated by using MGWR software [65].

3.4. Results

3.4.1. OLS Model Results

The OLS model gives a single set of (global) coefficients for the study area. Estimated by using the observed data (n = 512). The Pearson’s correlation coefficient (<0.8) and the variance inflation factors (VIF) (<10) were checked [65]. The results indicated that there was no serious multicollinearity among the variables. The estimated coefficients of the OLS model are presented in Table 4, where all coefficients have an intuitive sign and most of them are statistically significant. It was revealed that the size of the unit, being in a high-rise building, as well as in proximity to the city center, the nearest railway station, the nearest shopping mall, the nearest hospital all had positive influences on the listing price per square meter of the condominium unit, while the age of the building had a negative effect. Notice that in the global model, the proximity to a university was not significant but may be locally significant in the local GWR and MGWR models.
The estimation results revealed that the most significant variable is the proximity to the city center. According to the log-log specification, it could be interpreted that for a percentage, being closer to the city center will lead to a 0.356% increase in the property value. Likewise, for a percentage, being closer to a railway station will lead to a 0.062% increase in the listing price of the condominium unit, i.e., at the mean price, the premium for each 100 m closer to the station was about THB 705/sq.m. or approximately (USD) 21.15/sq.m. A similar interpretation can be made regarding the proximity to a shopping mall or hospital. However, the proximity to a university is not globally significant as suggested by the OLS model, but may be significant at some locations, as will be discussed for the local model.
The superiority of the OLS model shown in Table 5, compared with that of the GWR and MGWR models, will be presented in the next subsection. Obviously, the OLS model, a global model, has a larger residual than the local models. The goodness of fit indicators, AICc and adjusted R2, indicate that the local models are superior to the OLS model, i.e., a higher adjusted R2 (0.811 & 0.822 vs. 0.589) and lower AICc (747.318 & 702.542 vs. 1009.875). Considering the two local models, both GWR and MGWR models gave similar results, but the MGWR model had slightly better performance. Therefore, the next section will mainly present and discuss the results of the MGWR model, as a representative local model, to keep the paper concise.

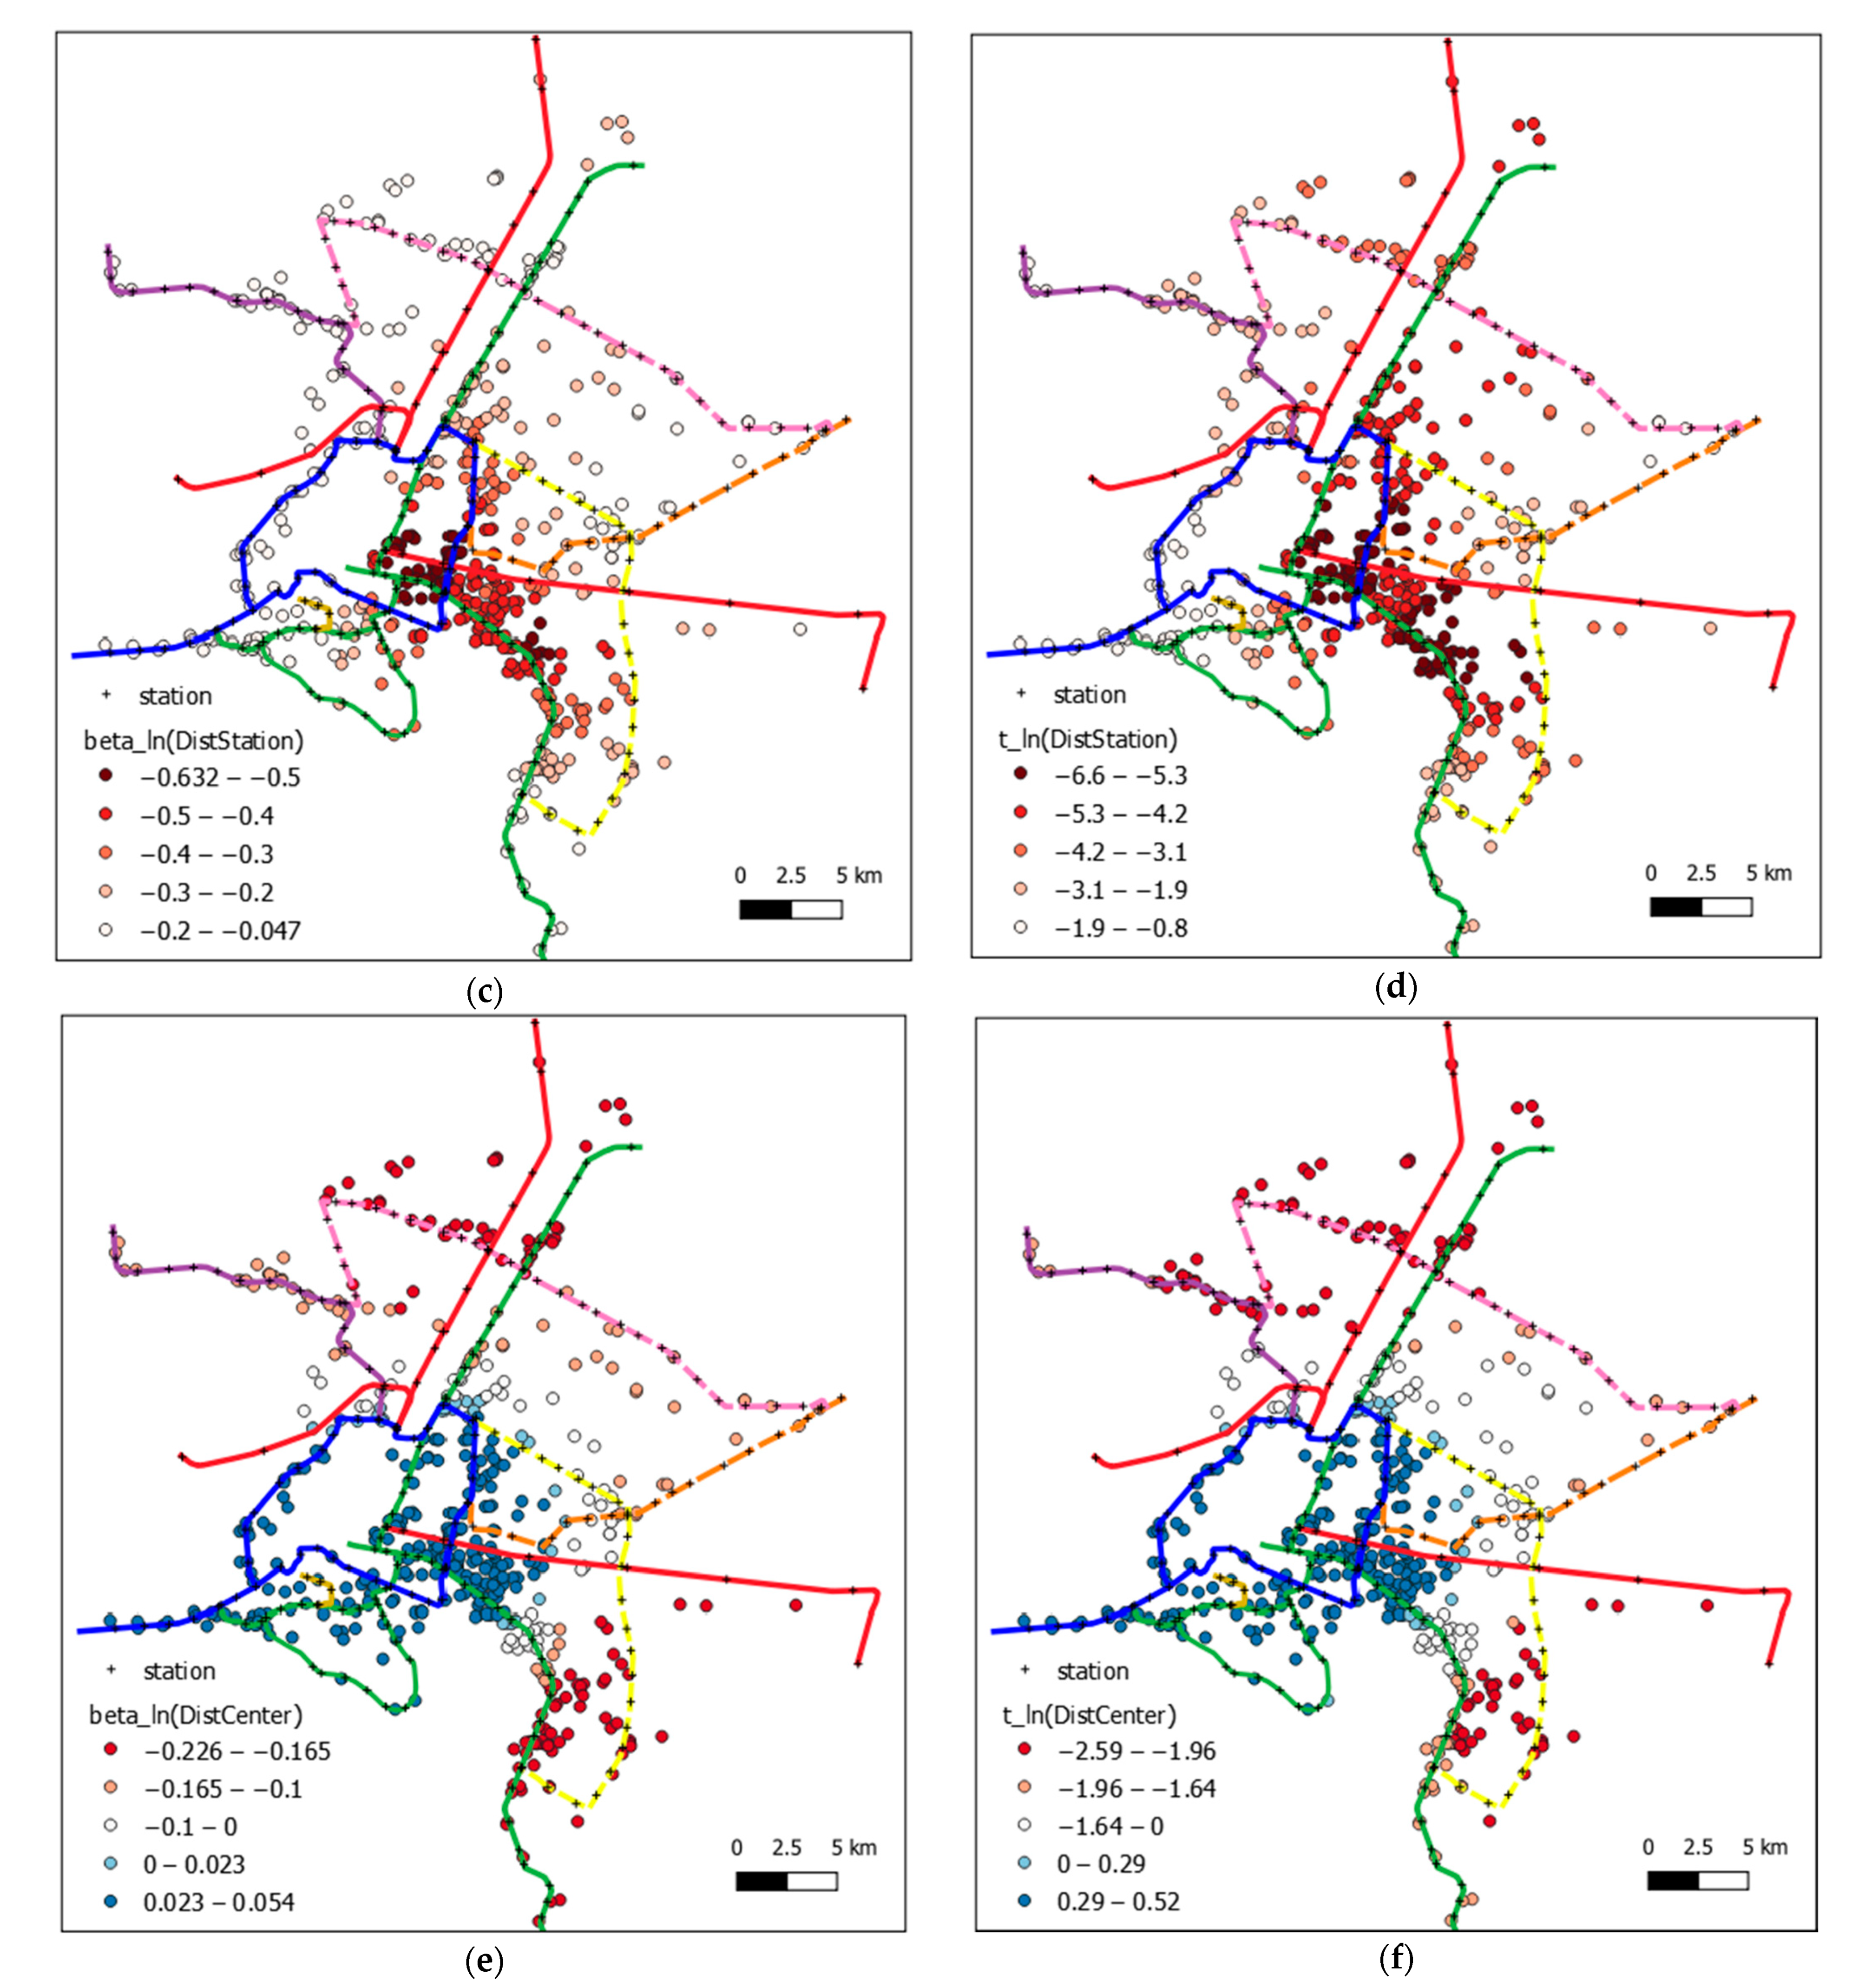
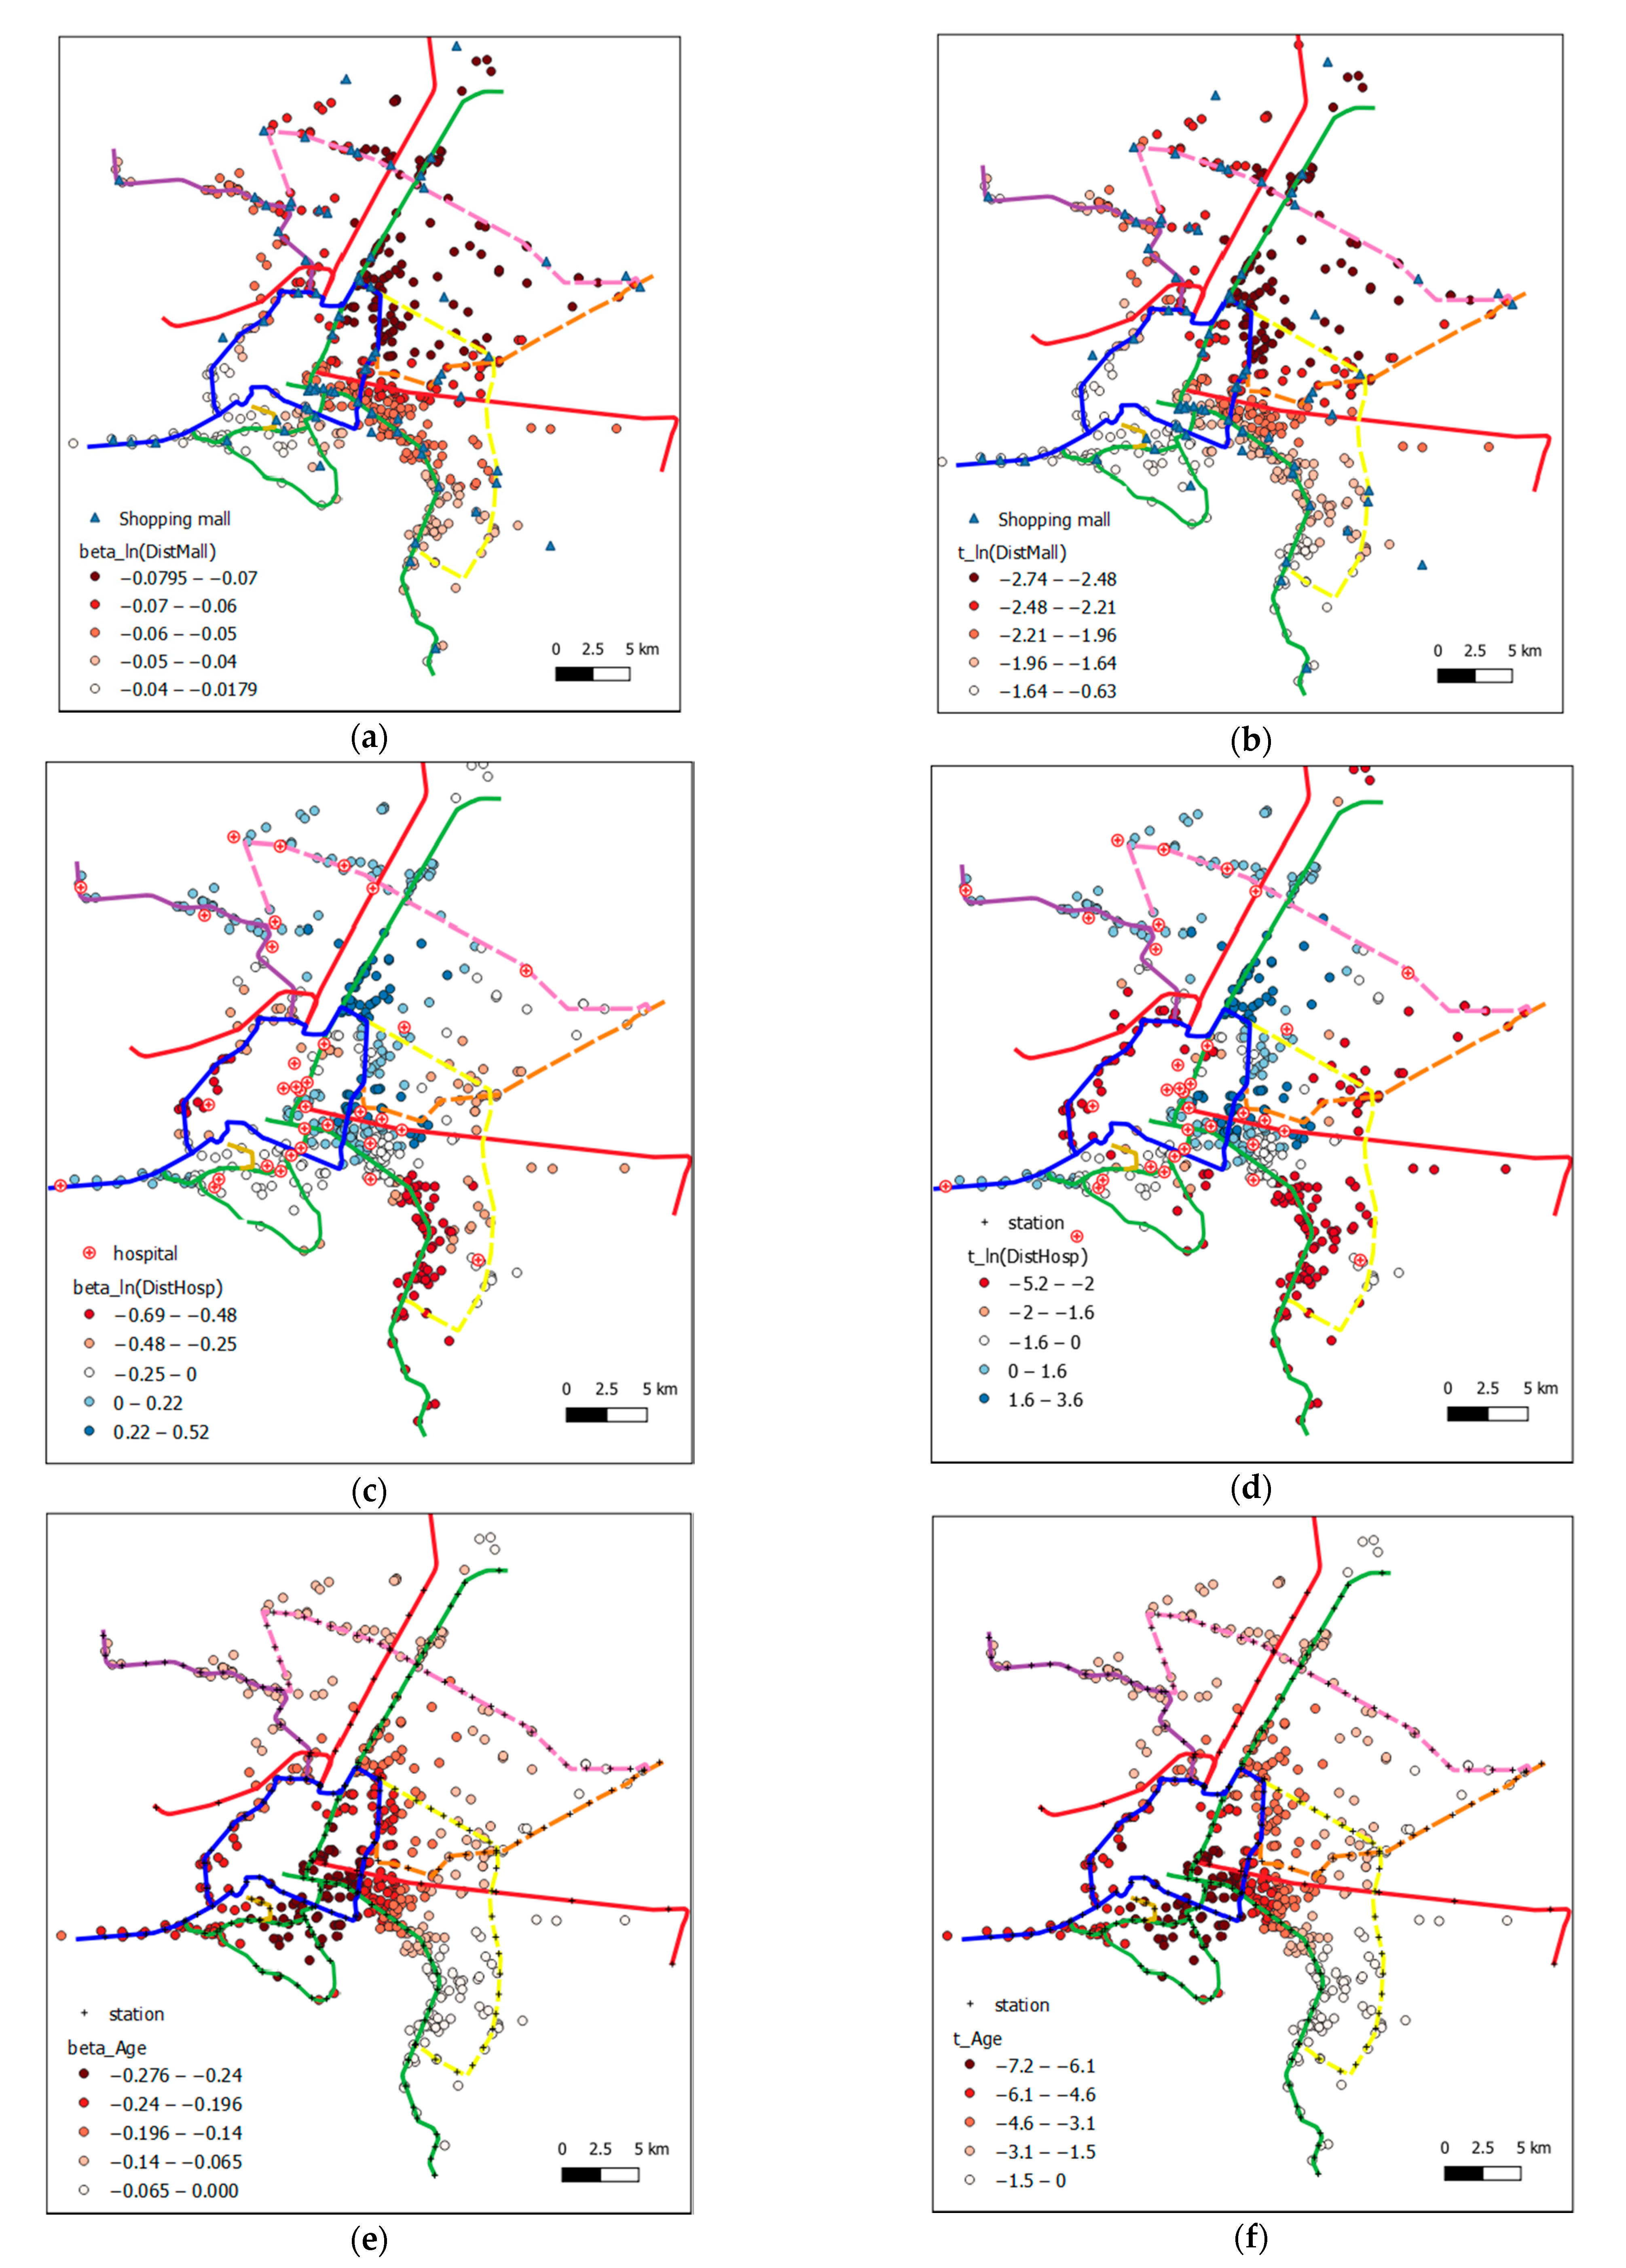
3.4.2. MGWR Model Results

While the OLS model uses all data points for the estimation, the local models, i.e., GWR and MGWR, use only a subset of the data from the neighborhood where the boundary is determined through the bandwidth. As described in Section 4.3, the GWR model uses a single optimal bandwidth for the whole model, while the MGWR determines an appropriate bandwidth, or so-called scale, for each explanatory variable. A smaller bandwidth indicates a more local process, while larger bandwidth indicates a more global process, approaching the OLS model. The result of the GWR model with an adaptive bi-squared kernel reported the optimal bandwidth as 99.
The MGWR results with the estimated coefficients and covariate-specific bandwidth are shown in Table 6. It was found that the effect of proximity to a shopping mall was rather global, i.e., applicable across the study area, while the effect of proximity to a railway station, city center, hospital, or university was rather local. The summary of the estimated coefficients indicates the different influence each explanatory variable has on the property value. For the variables with larger bandwidth, the variation of the variables was relatively small. For example, the standard deviation of the estimates related to the proximity to a shopping mall is small, while for the city center, railway station, or hospital, it was quite large.
It was found that station proximity has a positive effect on the property value, following the trends indicated by the global model. However, the magnitude of the influence varies considerably, as indicated by the large range between the minimum and maximum value, as well as its standard deviation.
The mapping of the R2 values and residual of the MGWR model at each data location are shown in Figure 6a,b. Obviously, the MGWR model has a good local fit, i.e., strong R2 and small residual, mostly along the existing two green lines and the blue line. However, the model fit is low for the existing purple line and the under-construction pink, yellow, and orange lines.
The distribution of the estimated coefficients and corresponding t-value of some explanatory variables are shown in Figure 6 and Figure 7. Regarding the station proximity (Figure 6c,d), it is obvious that a condominium in the city center and mostly along the green line has a very powerful influence on the station proximity, as shown by the large (absolute) coefficient values as well as large t-values. Regarding the effect of the city center (Figure 6e,f), the estimate is not statistically significant in the central area around the blue line, indicating that as long as the property is in the central area, being closer to the city center does not directly increase its value. This underpins the large monocentric city structure of Bangkok.
Regarding the effect of shopping mall proximity, as discussed above, the process is rather global and the coefficients are mostly large and significant, as shown in Figure 7a,b. This reflects the fact that the shopping mall in Bangkok is not only for shopping but is a public space people visit for various activities ranging from restaurants, supermarkets, off-school education for kids, indoor gym, entertainment, etc. Thus, it has become an essential part of the city for modern living in Bangkok. On the other hand, the effect of hospital proximity is relatively local, indicated by negative and significant coefficients (Figure 7c,d) in the central area, especially the city center, and location along the inner part of the green line, as well as the blue line. But the outside site, such as along the purple line, does show significance. As for the building age (Figure 7e,f), the effect is quite pronounced in the city center and the initial green and blue line sections, where market competition is high. For other areas along the new railway lines, i.e., purple, pink, yellow, and orange, the condominiums are mostly new, so there is not much difference.
Furthermore, as described above and revealed by Figure 6c,d, the impact of station proximity on property value is significant but varies considerably over the study area. It is observed that the area in the city center and the area along the initial section of the green and blue lines have very high elasticity, i.e., more pronounced impact, while the other areas along the newly extended or under-construction railway lines have lower elasticity value. From the interpretation of the log-log regression coefficients of ln(DistStation) variable, different elasticity values may suggest different premiums of station proximity in the different areas, as summarized in Table 7. The highest premium paid to be 100 m closer to the station is more than THB 6650 or approximately USD 200 for the city center area and the core CBD area along the light green line’s initial section, which has been in operation since 1999, and the blue line’s initial section, which has been in operation since 2004. The other CBD area and the high-density residential area along the initial sections of both lines have a moderate impact on station proximity, being valued at around USD 120 to 160 per each 100 m closer to the station. On the other hand, the areas along the newly developed or being-developed railway corridors still do not perceive a very strong impact of station proximity, being valued at around USD 80 to 120 per each 100 m closer to the station.

4. Discussion

4.1. Unorganized Urban and Rail Transit Development

The root of the traffic congestion in Bangkok has been the lack of urban and transport plans since the beginning. Fortunately, Bangkok turned its policy from over-emphasizing road development to mass rapid transit development in the 1990s. However, the urban and transportation plans were still not well coordinated but remained mutually independent. The unstable mass transit master plan and delayed construction created unorganized urban development. Land in some areas was over speculated where suburbanization progressed prior to rail transit development and resulted in massive private car use.
The case of the purple line was evidence of the lose-lose solution: the government lost investment with the low rail ridership, the real estate developers lost business as a large number of condominium units remained unsold, and importantly society has absorbed vast economic losses because severe traffic congestion has continued and become more severe. The auto-dependent lifestyle had been consolidated before the purple line opened.
High speculation during the announcement and construction period created an over-supplied condominium market condition. In other words, for the purple line, the impact of the rail transit was noticeable until the service opened, but not nowadays. This phenomenon was similar to that of Zhengzhou, China, where the impact of rail transit on residential property was high only during the planning and construction phase [49]. Similarly, in Seoul, Korea, where the line-5 subway had a significant impact only prior to its opening, after service started the property value was determined by its structural factors and neighborhood characteristics rather than station proximity [36].
Therefore, it is important that urban and transport development are efficiently integrated and well-coordinated so that rail transit can play an important role and have a major influence in shaping urban development into a desirable form.

4.2. Spatially Varying Impact on Residential Property Value Uplift

The spatial hedonic analysis results showed that rail transit station proximity has a positive impact on lifting property value, similar to several emerging Asian cities [6,20,21,22,23,24], but not in Jakarta, Indonesia, where the impact was not significant [35]. In more detail, this study found a premium value of USD 846 per 100 m closer to the urban rail transit station in Bangkok, which was estimated based on the 0.062% elasticity value obtained from the OLS model presented earlier. The value was slightly higher than the premium value of USD 759 per 100 m closer to the LRT station in Kuala Lumpur, Malaysia [21].
Moreover, this study found that the station proximity impact significantly varied across the city along different railway lines in Bangkok. In other words, we found high impact in the city center, as well as in the commercial and medium-density residential areas, and found low impact in the low-density residential areas in the suburbs. Such a spatially varying positive impact of rail transit on property value increase was similarly found in Brisbane, where the area with high network coverage showed a more highly positive impact than in the area with low network coverage [46].
Since the impact was not uniform across the city, the uniform land value capture scheme would be inappropriate, as recommended in [32]. Therefore, the rate of value capture must be determined in accordance with the extent of impact or benefit brought by the rail transit. Moreover, the appropriate timing of value capture must be carefully considered. This study found that the impact is not immediately known right before or after the project implementation, as also supported by the findings in [43].

4.3. Polycentric Development

As indicated by the hedonic model results showing that the influence of the city center (core CBD) on property value is huge, Bangkok could be said to be a monocentric city. The earlier study also concluded that Shanghai, China, was a monocentric city [48]. These two Asian cities share the similar characteristics of high density and severe traffic congestion. However, they are different in that Shanghai has a longer history of rail transit and the subcenter proximity has a significant impact on property value, indicating that Shanghai is transforming into a polycentric city [20].
For Bangkok, in aiming to reduce suburbanization that causes long commuting travel and severe congestion in the central district, a concept of polycentric development with subcenters has been proposed and discussed in the urban planning stage. However, it has not been achieved yet. Developing subcenters at major rail transit nodes will reduce car dependency and increase the number of railway passengers in both directions of travel between subcenters. However, it was recently found by simulation that expansion of the urban rail network and the formation of sub-centers alone will not reduce the overall road traffic volume but will significantly increase traffic demand, resulting in higher congestion on both road and rail networks [66].
It is generally agreed that high-density residential area development near the railway stations, i.e., transit-oriented development (TOD), will alleviate automobile dependency and road traffic congestions. However, to achieve a polycentric city structure would need strong public policy initiatives, including strict enforcement of land use regulation, road user charges, public transport reform, mobility management, etc. The classical TOD literature also supports that a compact and multi-centered city structure would need a strong public policy initiative such as readjustment of land around the station and becoming an equity partner in building transit-based housing, together with pricing measures such as collecting parking fees in the downtown area, etc. [14].
In addition, it was shown that a shift in workplace and travel departure time could effectively alleviate traffic congestion during peak hours [4]. Mobility as a Service (MaaS) could also be an efficient instrument to move a city towards polycentric, as it was expected to change people’s mobility patterns, i.e., from private car to public transport or sharing-mobility service [67]. This study proposes to promote sharing workplaces, i.e., co-working spaces, at major transit nodes that have the potential to become subcenters, where people work remotely and travel to the city center conveniently by rail. People could adopt MaaS to decide reasonably: where to work remotely and at which sharing-workplace, which sharing-transport mode to utilize, what package of services are desired, etc. This will simultaneously promote the surrounding residential area.

4.4. Walkability in the TOD Environment

Based on the original TOD concept, [68], the combination of raised density, mixed land use, street connectivity, and walkability improvements reduces automobile travel and increases both non-motorized and public transport travel, such as reported in [69,70,71,72,73,74]. The previous hedonic studies found that the interaction of rail transit proximity and a TOD neighborhood significantly impacted property value [50,54]. As walkability is an important element of TOD, walkability in the walkable boundary (800-m radius) [42] and walking distance to a transit station [54] were found significant to property value increase. However, an evaluation of walkability around rail transit stations in Bangkok revealed that walkability was generally poor and needed substantial improvements [75]. Our results imply that poor walkability, especially in suburban areas, leads to a lower property price near stations and facilities. As shown in Figure 6 and Figure 7, the absolute value of coefficients regarding the distance to stations and facilities are higher in the central area, but they are lower in the suburban area. This may reflect that walkability strongly affects the property price at the city center. However, in the suburbs where people mainly depend on cars, the proximity to rail transit stations does not affect property price.
Since walking is the most natural, healthy, clean, cheap, and inclusive mode of transport, walking is the foundation for sustainable and equitable access and mobility in a city. Recognizing it as the primary mode of travel is essential to the success of the TOD policy [76,77]. On the other hand, walking can also be the most enjoyable, safe, and affordable way of getting around if walkways and streets are attractive, vibrant, secure, uninterrupted, and well protected from road traffic. Moreover, walking will be more pleasant if shop vendors and services are available along the route [78]. Complete walkways and crossings must fully support all users in compliance with locally applicable or international standards. Unfortunately, the walkway has not been officially developed and tightly integrated with railway development in Bangkok. This will be a key factor to encourage successful rail transit usage.

5. Concluding Remarks

This study firstly presented a chronological review of the urban transportation plans and development in Bangkok. It revealed that automobile dependency has consistently increased and indicated that efficient planning and development of rapid mass transit along with urban development has become more important.
A hedonic analysis of the condominium listing price was presented by employing the local GWR and MGWR models, which provide better information than the global OLS model. The results underline the current monocentric city structure of Bangkok and the positive impact of rail transit proximity, supporting the existing literature in Asian developing cities [6,20,21,22,23,24]. This result contradicts the general finding in Jakarta, Indonesia, where the property value is determined mainly by structural attributes, due to the fact that station access is generally convenient and walkability is low in Jakarta [35].
Variation of the impact of rail transit on property value increase for different parts of the city and different rail transit lines is in line with findings for other cities such as in [21,46]. This study showed that being 100-m closer to the rail transit station along the major rail corridor in the city center in Bangkok would raise the condominium listing price per sq.m. of more than USD 200. However, the premium would be lower than USD 80 for the area along the rail corridor in the suburbs. As the rail transit impact on property value increase was found to vary over the geographical area, as well as for different rail transit lines, a non-uniform land value capture would sound more plausible, as also suggested in [32]. In addition to the spatial effect, it was also found that the impact was sometimes not stable over time; for example, the purple line impact on the nearby residential development was significant only before the opening of the service. Proper timing of value capture must be carefully considered, as is also supported by the findings in [43].
As a primary limitation, this study was based on the listing price of the condominium, which may be different from the actual transaction price that was not publicly available. Further study is recommended to collect the real transaction price using data obtained from a field survey to examine the significance of the rail transit impact on the real market value. However, the distribution of the sampling data across the real estate market must be carefully controlled as the real estate developers are less likely to disclose such highly business-confidential information to the public.
Although these results are considered robust in capturing the impact of proximity to rail transit stations and other major urban nodes on residential property value, the hedonic pricing model would be more comprehensive if other general variables were included and discussed. These include structural attributes such as floor level, scenic view, elevator proximity, and car parking, along with common facilities such as swimming pool or fitness gym, etc.; transport accessibility attributes such as road, bus stop, paratransit, etc.; and neighborhood attributes such as public parks, schools, etc. However, spatial variations of the impact will be greater at different locations across the city, and require a more sophisticated model structure to precisely capture all the spatially varying effects.
The findings of this study contribute as evidence an increase of land value in the context of a developing country where the city has been developed in a disorderly fashion, and the transport and traffic situation has become chaotic. Policy insights for future urban and railway development are addressed concerning proper coordination of rail transit development with urban development with subcenters, as well as for transit-oriented development and walkability improvement around the rail transit stations.

Author Contributions

Conceptualization, V.V., M.K. and Y.H.; Methodology, V.V., V.W., M.K. and Y.H.; Investigation, V.V., V.W. and T.P.; Formal analysis, V.V. and M.K.; Data Curation, V.V., V.W. and T.P.; Writing—original draft preparation, V.V. and V.W.; Writing—review and editing, V.V., M.K., Y.H., V.W. and T.P.; Funding acquisition, V.V., M.K. and Y.H. All authors have read and agreed to the published version of the manuscript.

Funding

This study was supported by the Science and Technology Research Partnership for Sustainable Development (SATREPS) JST/JICA Grant (No. JPMJSA1704) and JST RISTEX-ELSI Grant (No. JPMJRX20J6), Japan.

Institutional Review Board Statement

Not applicable.

Informed Consent Statement

Not applicable.

Conflicts of Interest

The authors declare no conflict of interest. The funders had no role in the design of the study; in the collection, analyses, or interpretation of data; in the writing of the manuscript; or in the decision to publish the results.

References

  1. Bank, A.D. Asian Development Outlook 2019 Update: Fostering Growth and Inclusion in Asia’s Cities; Asian Development Bank: Manila, Philippines, 2019. [Google Scholar]
  2. Abiad, A.; Farrin, K.; Hale, C. Sustaining Transit. Investment in Asia’s Cities: A Beneficiary-Funding and Land Value Capture Perspective; Asian Development Bank: Manila, Philippines, 2019. [Google Scholar]
  3. Bhu-Anantanondh, N.; Kanyajit, S.; Suwannanon, A.; Sinloyma, P. Solving Bangkok’s Traffic Problems. Cosmop. Civ. Soc. Interdiscip. J. 2021, 13, 46–61. [Google Scholar] [CrossRef]
  4. Achariyaviriya, W.; Hayashi, Y.; Takeshita, H.; Kii, M.; Vichiensan, V.; Theeramunkong, T. Can Space–Time Shifting of Activities and Travels Mitigate Hyper-Congestion in an Emerging Megacity, Bangkok? Effects on Quality of Life and CO2 Emission. Sustainability 2021, 13, 6547. [Google Scholar] [CrossRef]
  5. Vichiensan, V.; Malaitham, S.; Miyamoto, K. Hedonic Analysis of Residential Property Values in Bangkok: Spatial Dependence and Nonstationarity Effects. J. East. Asia Soc. Transp. Stud. 2011, 9, 886–899. [Google Scholar] [CrossRef]
  6. Malaitham, S.; Fukuda, A.; Vichiensan, V.; Wasuntarasook, V. Hedonic pricing model of assessed and market land values: A case study in Bangkok metropolitan area, Thailand. Case Stud. Transp. Policy 2020, 8, 153–162. [Google Scholar] [CrossRef]
  7. Kocks, K.F. Bangkok Transportation Study (BTS). Final Report; Thai-German Technical Cooperation: Bangkok, Thailand, 1975. [Google Scholar]
  8. Japan International Cooperation Agency (JICA). Preliminary Study on an Improvement Plan for Railway Transport in and around the Bangkok Metropolis in Consideration of Urban Development in the Kingdom of Thailand; JICA: Bangkok, Thailand, 1992.
  9. Japan International Cooperation Agency (JICA). The Study on an Improvement Plan for Railway Transport in and around the Bangkok Metropolis in Consideration of Urban Development in the Kingdom of Thailand, Final Report; JICA: Bangkok, Thailand, 1995.
  10. Office of Transport and Traffic Policy and Planning. Mass Rapid Transit Master Plan in Bangkok Metropolotan Region: M-MAP; Office of Transport and Traffic Policy and Planning: Bangkok, Thailand, 2010.
  11. Japan International Cooperation Agency (JICA). Data Collection Survey on the Development of Blueprint for the Second Mass Rapid Transit. Master Plan. (M-Map2) in The Kingdom of Thailand; JICA: Bangkok, Thailand, 2019.
  12. Cuthill, N.; Cao, M.; Liu, Y.; Gao, X.; Zhang, Y. The Association between Urban Public Transport Infrastructure and Social Equity and Spatial Accessibility within the Urban Environment: An Investigation of Tramlink in London. Sustainability 2019, 11, 1229. [Google Scholar] [CrossRef] [Green Version]
  13. Lee, J.; Boarnet, M.; Houston, D.; Nixon, H.; Spears, S. Changes in Service and Associated Ridership Impacts near a New Light Rail Transit Line. Sustainability 2017, 9, 1827. [Google Scholar] [CrossRef] [Green Version]
  14. Cervero, R.; Landis, J. Twenty years of the Bay Area Rapid Transit system: Land use and development impacts. Transp. Res. Part A Policy Pract. 1997, 31, 309–333. [Google Scholar] [CrossRef]
  15. Zhao, L.; Shen, L. The impacts of rail transit on future urban land use development: A case study in Wuhan, China. Transp. Policy 2019, 81, 396–405. [Google Scholar] [CrossRef]
  16. Alquhtani, S.; Anjomani, A. Do Rail Transit Stations Affect the Population Density Changes around Them? The Case of Dallas-Fort Worth Metropolitan Area. Sustainability 2021, 13, 3355. [Google Scholar] [CrossRef]
  17. Sekasi, J.; Martens, M.L. Assessing the Contributions of Urban Light Rail Transit to the Sustainable Development of Addis Ababa. Sustainability 2021, 13, 5667. [Google Scholar] [CrossRef]
  18. Andrade, C.; D’Agosto, M. The Role of Rail Transit Systems in Reducing Energy and Carbon Dioxide Emissions: The Case of The City of Rio de Janeiro. Sustainability 2016, 8, 150. [Google Scholar] [CrossRef] [Green Version]
  19. Zhang, X.; Liu, X.; Hang, J.; Yao, D.; Shi, G. Do Urban Rail Transit Facilities Affect Housing Prices? Evidence from China. Sustainability 2016, 8, 380. [Google Scholar] [CrossRef] [Green Version]
  20. Pan, H.; Zhang, M. Rail Transit Impacts on Land Use: Evidence from Shanghai, China. Transp. Res. Rec. J. Transp. Res. Board 2008, 2048, 16–25. [Google Scholar] [CrossRef]
  21. Dziauddin, M.F. Estimating land value uplift around light rail transit stations in Greater Kuala Lumpur: An empirical study based on geographically weighted regression (GWR). Res. Transp. Econ. 2019, 74, 10–20. [Google Scholar] [CrossRef]
  22. Vichiensan, V.; Miyamoto, K. Influence of Urban Rail Transit on House Value: Spatial Hedonic Analysis in Bangkok. J. East. Asia Soc. Transp. Stud. 2010, 8, 986–996. [Google Scholar]
  23. Anantsuksomsri, S.; Tontisirin, N. The Impacts of Mass Transit Improvements on Residential Land Development Values: Evidence from the Bangkok Metropolitan Region. Urban. Policy Res. 2015, 33, 195–216. [Google Scholar] [CrossRef]
  24. Chalermpong, S. Rail Transit and Residential Land Use in Developing Countries: Hedonic Study of Residential Property Prices in Bangkok, Thailand. Transp. Res. Rec. J. Transp. Res. Board 2007, 2038, 111–119. [Google Scholar] [CrossRef]
  25. Welch, T.F.; Gehrke, S.R.; Wang, F. Long-term impact of network access to bike facilities and public transit stations on housing sales prices in Portland, Oregon. J. Transp. Geogr. 2016, 54, 264–272. [Google Scholar] [CrossRef]
  26. Hess, D.B.; Almeida, T.M. Impact of Proximity to Light Rail Rapid Transit on Station-area Property Values in Buffalo, New York. Urban. Stud. 2007, 44, 1041–1068. [Google Scholar] [CrossRef]
  27. Song, Z.; Cao, M.; Han, T.; Hickman, R. Public transport accessibility and housing value uplift: Evidence from the Docklands light railway in London. Case Stud. Transp. Policy 2019, 7, 607–616. [Google Scholar] [CrossRef]
  28. Brandt, S.; Maennig, W. The impact of rail access on condominium prices in Hamburg. Transportation 2012, 39, 997–1017. [Google Scholar] [CrossRef]
  29. Martínez, L.M.; Viegas, J.M. Effects of Transportation Accessibility on Residential Property Values. Transp. Res. Rec. 2009, 2115, 127–137. [Google Scholar] [CrossRef]
  30. Li, Q.; Wang, J.; Callanan, J.; Lu, B.; Guo, Z. The spatial varying relationship between services of the train network and residential property values in Melbourne, Australia. Urban. Stud. 2020, 58, 335–354. [Google Scholar] [CrossRef]
  31. Ryan, S. The Value of Access to Highways and Light Rail Transit: Evidence for Industrial and Office Firms. Urban. Stud. 2005, 42, 751–764. [Google Scholar] [CrossRef] [Green Version]
  32. Du, H.; Mulley, C. Relationship Between Transport Accessibility and Land Value: Local Model Approach with Geographically Weighted Regression. Transp. Res. Rec. J. Transp. Res. Board 2006, 1977, 197–205. [Google Scholar] [CrossRef]
  33. Hewitt, C.M.; Hewitt, W.E.T. The effect of proximity to urban rail on housing prices in Ottawa. J. Public Transp. 2012, 15, 43–65. [Google Scholar] [CrossRef]
  34. Forouhar, A.; Van Lierop, D. If you build it, they will change: Evaluating the impact of commuter rail stations on real estate values and neighborhood composition in the Rotterdam–The Hague metropolitan area, The Netherlands. J. Transp. Land Use 2021, 14, 949–973. [Google Scholar] [CrossRef]
  35. Berawi, M.A.; Miraj, P.; Saroji, G.; Sari, M. Impact of rail transit station proximity to commercial property prices: Utilizing big data in urban real estate. J. Big Data 2020, 7, 71. [Google Scholar] [CrossRef]
  36. Bae, C.-H.C.; Jun, M.-J.; Park, H. The impact of Seoul’s subway Line 5 on residential property values. Transp. Policy 2003, 10, 85–94. [Google Scholar] [CrossRef]
  37. Chen, Y.; Yazdani, M.; Mojtahedi, M.; Newton, S. The impact on neighbourhood residential property valuations of a newly proposed public transport project: The Sydney Northwest Metro case study. Transp. Res. Interdiscip. Perspect. 2019, 3, 100070. [Google Scholar] [CrossRef]
  38. Kawamura, K.; Mahajan, S. Hedonic Analysis of Impacts of Traffic Volumes on Property Values. Transp. Res. Rec. 2005, 1924, 69–75. [Google Scholar] [CrossRef]
  39. Shin, K.; Washington, S.; Choi, K. Effects of Transportation Accessibility on Residential Property Values: Application of Spatial Hedonic Price Model in Seoul, South Korea, Metropolitan Area. Transp. Res. Rec. J. Transp. Res. Board 2007, 1994, 66–73. [Google Scholar] [CrossRef]
  40. Lu, B.; Charlton, M.; Harris, P.; Fotheringham, A.S. Geographically weighted regression with a non-Euclidean distance metric: A case study using hedonic house price data. Int. J. Geogr. Inf. Sci. 2014, 28, 660–681. [Google Scholar] [CrossRef]
  41. Seo, W.; Nam, H.K. Trade-off relationship between public transportation accessibility and household economy: Analysis of subway access values by housing size. Cities 2019, 87, 247–258. [Google Scholar] [CrossRef]
  42. Zolnik, E. Geographically weighted regression models of residential property transactions: Walkability and value uplift. J. Transp. Geogr. 2021, 92, 103029. [Google Scholar] [CrossRef]
  43. Ko, K. Case study of property value transfer attributed to transit: Spatial and temporal hedonic price impact of light rail in Minnesota’s Twin Cities. J. Public Transp. 2021, 23, 1–25. [Google Scholar] [CrossRef]
  44. Huang, Z.; Chen, R.; Xu, D.; Zhou, W. Spatial and hedonic analysis of housing prices in Shanghai. Habitat Int. 2017, 67, 69–78. [Google Scholar] [CrossRef]
  45. Yang, L.; Chau, K.W.; Szeto, W.Y.; Cui, X.; Wang, X. Accessibility to transit, by transit, and property prices: Spatially varying relationships. Transp. Res. Part D Transp. Environ. 2020, 85, 102387. [Google Scholar] [CrossRef]
  46. Mulley, C.; Ma, L.; Clifton, G.; Yen, B.; Burke, M. Residential property value impacts of proximity to transport infrastructure: An investigation of bus rapid transit and heavy rail networks in Brisbane, Australia. J. Transp. Geogr. 2016, 54, 41–52. [Google Scholar] [CrossRef] [Green Version]
  47. Cervero, R.; Duncan, M. Neighbourhood Composition and Residential Land Prices: Does Exclusion Raise or Lower Values? Urban. Stud. 2004, 41, 299–315. [Google Scholar] [CrossRef]
  48. Li, H.; Wei, Y.D.; Wu, Y.; Tian, G. Analyzing housing prices in Shanghai with open data: Amenity, accessibility and urban structure. Cities 2019, 91, 165–179. [Google Scholar] [CrossRef]
  49. Zhang, D.; Jiao, J. How Does Urban Rail Transit Influence Residential Property Values? Evidence from An Emerging Chinese Megacity. Sustainability 2019, 11, 534. [Google Scholar] [CrossRef] [Green Version]
  50. Li, J.; Huang, H. Effects of transit-oriented development (TOD) on housing prices: A case study in Wuhan, China. Res. Transp. Econ. 2020, 80, 100813. [Google Scholar] [CrossRef]
  51. Sasaki, M.; Yamamoto, K. Hedonic Price Function for Residential Area Focusing on the Reasons for Residential Preferences in Japanese Metropolitan Areas. J. Risk Financ. Manag. 2018, 11, 39. [Google Scholar] [CrossRef] [Green Version]
  52. Cordera, R.; Coppola, P.; Dell’Olio, L.; Ibeas, Á. The impact of accessibility by public transport on real estate values: A comparison between the cities of Rome and Santander. Transp. Res. Part A Policy Pract. 2019, 125, 308–319. [Google Scholar] [CrossRef]
  53. Gallo, M. The Impact of Urban Transit Systems on Property Values: A Model and Some Evidences from the City of Naples. J. Adv. Transp. 2018, 2018, 1767149. [Google Scholar] [CrossRef]
  54. Su, S.; Zhang, J.; He, S.; Zhang, H.; Hu, L.; Kang, M. Unraveling the impact of TOD on housing rental prices and implications on spatial planning: A comparative analysis of five Chinese megacities. Habitat Int. 2021, 107, 102309. [Google Scholar] [CrossRef]
  55. Jim, C.Y.; Chen, W.Y. Value of scenic views: Hedonic assessment of private housing in Hong Kong. Landsc. Urban. Plan. 2009, 91, 226–234. [Google Scholar] [CrossRef]
  56. Anselin, L. Spatial Econometrics: Methods and Models; Kluwer Academic Publishers: Dordrecht, The Netherlands, 1988. [Google Scholar]
  57. Anselin, L.; Bera, A.K. Spatial Dependence in Linear Regression Models with an Introduction to Spatial Econometrics. In Handbook of Applied Economic Statistics; CRC Press: Boca Raton, FL, USA, 1995. [Google Scholar]
  58. Fotheringham, A.S.; Brunsdon, C.; Charlton, M. Geographically Weighted Regression: The Analysis of Spatially Varying Relationships; John Wiley & Sons: Chichester, UK, 2002; p. 282. [Google Scholar]
  59. Lee, J.S.; Li, M.-H. The impact of detention basin design on residential property value: Case studies using GIS in the hedonic price modeling. Landsc. Urban. Plan. 2009, 89, 7–16. [Google Scholar] [CrossRef]
  60. Fotheringham, A.S.; Yang, W.; Kang, W. Multiscale Geographically Weighted Regression (MGWR). Ann. Am. Assoc. Geogr. 2017, 107, 1247–1265. [Google Scholar] [CrossRef]
  61. Hong, I.; Yoo, C. Analyzing Spatial Variance of Airbnb Pricing Determinants Using Multiscale GWR Approach. Sustainability 2020, 12, 4710. [Google Scholar] [CrossRef]
  62. Li, S.; Lyu, D.; Huang, G.; Zhang, X.; Gao, F.; Chen, Y.; Liu, X. Spatially varying impacts of built environment factors on rail transit ridership at station level: A case study in Guangzhou, China. J. Transp. Geogr. 2020, 82, 102631. [Google Scholar] [CrossRef]
  63. Vichiensan, V.; Páez, A.; Kawai, K.; Miyamoto, K. Nonstationary Spatial Interpolation Method for Urban Model Development. Transp. Res. Rec. 2006, 1977, 103–111. [Google Scholar] [CrossRef]
  64. IBM Corp. IBM SPSS Statistics for Windows, Version 27.0; IBM Corp: Armonk, NY, USA, 2020. [Google Scholar]
  65. Oshan, T.; Li, Z.; Kang, W.; Wolf, L.; Fotheringham, A. mgwr: A Python Implementation of Multiscale Geographically Weighted Regression for Investigating Process Spatial Heterogeneity and Scale. ISPRS Int. J. Geo-Inf. 2019, 8, 269. [Google Scholar] [CrossRef] [Green Version]
  66. Kii, M.; Vichiensan, V.; Llorca, C.; Moreno, A.; Moeckel, R.; Hayashi, Y. Impact of Decentralization and Rail Network Extension on Future Traffic in the Bangkok Metropolitan Region. Sustainability 2021, 13, 13196. [Google Scholar] [CrossRef]
  67. Lopez-Carreiro, I.; Monzon, A.; Lois, D.; Lopez-Lambas, M.E. Are travellers willing to adopt MaaS? Exploring attitudinal and personality factors in the case of Madrid, Spain. Travel Behav. Soc. 2021, 25, 246–261. [Google Scholar] [CrossRef]
  68. Cervero, R.; Kockelman, K. Travel demand and the 3Ds: Density, diversity, and design. Transp. Res. Part D Transp. Environ. 1997, 2, 199–219. [Google Scholar] [CrossRef]
  69. Lee, J.-S.; Nam, J.; Lee, S.-S. Built Environment Impacts on Individual Mode Choice: An Empirical Study of the Houston-Galveston Metropolitan Area. Int. J. Sustain. Transp. 2014, 8, 447–470. [Google Scholar] [CrossRef]
  70. Nasri, A.; Zhang, L. The analysis of transit-oriented development (TOD) in Washington, D.C. and Baltimore metropolitan areas. Transp. Policy 2014, 32, 172–179. [Google Scholar] [CrossRef]
  71. Sung, H.; Oh, J.T. Transit-oriented development in a high-density city: Identifying its association with transit ridership in Seoul, Korea. Cities 2011, 28, 70–82. [Google Scholar] [CrossRef]
  72. Tang, B.-S.; Wong, S.W.; Ho, W.K.O.; Wong, K.T. Urban land uses within walking catchment of metro stations in a transit-oriented city. J. Hous. Built Environ. 2020, 35, 1303–1319. [Google Scholar] [CrossRef]
  73. Vergel-Tovar, C.E.; Rodriguez, D.A. The ridership performance of the built environment for BRT systems: Evidence from Latin America. J. Transp. Geogr. 2018, 73, 172–184. [Google Scholar] [CrossRef]
  74. Zemp, S.; Stauffacher, M.; Lang, D.J.; Scholz, R.W. Classifying railway stations for strategic transport and land use planning: Context matters! J. Transp. Geogr. 2011, 19, 670–679. [Google Scholar] [CrossRef]
  75. Ozawa, H.; Fukuda, A.; Malaitham, S.; Vichiensan, V.; Luathep, P.; Numa, H. Evaluation of walking environments around urban railway stations in Bangkok and consideration of improvement plans. Asian Transp. Stud. 2021, 7, 1–12. [Google Scholar] [CrossRef]
  76. Nakamura, K.; Gu, F.; Wasuntarasook, V.; Vichiensan, V.; Hayashi, Y. Failure of Transit-Oriented Development in Bangkok from a Quality of Life Perspective. Asian Transp. Stud. 2016, 4, 194–209. [Google Scholar] [CrossRef]
  77. Nakamura, K.; Morita, H.; Vichiensan, V.; Togawa, T.; Hayashi, Y. Comparative Analysis of QOL in Station Areas between Cities at Different Development Stages, Bangkok and Nagoya. Transp. Res. Procedia 2017, 25, 3188–3202. [Google Scholar] [CrossRef]
  78. Vichiensan, V.; Nakamura, K. Walkability Perception in Asian Cities: A Comparative Study in Bangkok and Nagoya. Sustainability 2021, 13, 6825. [Google Scholar] [CrossRef]
Figure 1. Rail Transit Ridership in Bangkok until 2019, just before the COVID-19 pandemic.
Sustainability 14 00284 g001
Figure 2. Decreasing bus passengers versus increasing private vehicle registrations.
Sustainability 14 00284 g002
Figure 3. Severe congestion continues.
Sustainability 14 00284 g003
Figure 4. Assessed land values along urban railway corridors. GDP per capita is shown as a reference to the economic status at each period.
Sustainability 14 00284 g004
Figure 5. Condominium listing price per square meter along the mass transit lines.
Sustainability 14 00284 g005
Figure 6. MGWR: (a) adjusted R2 (b) residual, (c,d) distance to nearest station: coefficient (c) & t-value (d), (e,f) distance to city center: coefficient (e) & t-value (f).
Sustainability 14 00284 g006aSustainability 14 00284 g006b
Figure 7. MGWR: (a,b) distance to shopping mall: coefficient (a) & t-value (b), (c,d) distance to hospital: coefficient (c) & t-value (d), (e,f) age of building: coefficient (e) & t-value (f).
Sustainability 14 00284 g007
Table 1. Development of the mass rapid transit plans in Bangkok.
YearStudy/PlanSummary
1972The Bangkok Transport StudyHighway and rail transit development.
1994The Mass Rapid Transit
System Master Plan (MTMP)
Rail transit development during 1995–2011 (135 km).
1996The Conceptual Mass Rapid Transit Implementation Plan (CTMP)MTMP adapted version (179 km).
1998The Feeder Transit System
Study
Additional 11 LRT and monorail projects (206 km).
2000The Urban Rail Transportation
Master Plan (URMAP)
Rail transit network development in BMR
in 20 years (375 km).
2004The Bangkok Mass Transit
Implementation Plan (BMT)
The 1st phase development of 7 lines
(291 km), expected to complete by 2009.
200610 Lines of Mass Transit
Network
BMT adapted version, 10 lines (365.5 km).
20075 Urgent Mass Transit LinesHigh priority urban railway lines,
5 lines (135 km).
2008Concept of Mass Transit
Network
Extension to the suburbs, 9 lines (311 km).
2010Mass Rapid Transit Master
Plan (M-Map)
Urban railway development during
2010 to 2029, 12 lines (509 km).
OngoingThe Second Mass Rapid
Transit Master Plan (M-Map2)
A study being carried out in cooperation with JICA.
Table 2. Present and near future rail transit lines in Bangkok.
LineSystemSectionYear OpenedDistance (km)Ridership
(Passengers/Day)
Forecasted 2021Actual 2021
Dark
Green
Heavy railInitial section19996.5227,000675,000
South extension 120097.574,000
South extension 2201356,000
Light
Green
Heavy railInitial199917550,000
East extension 120115.373,000
East extension 220181383,000
North extension 1201919134,000
North extension 2202046,000
BlueHeavy railInitial200420539,000332,356
South extension201914206,000
West extension201913229,000
Airport rail linkHeavy railEast section201028.5125,00070,729
PurpleHeavy railNorth section201623151,00059,466
Dark RedHeavy railNorth section202126239,000*
Light RedHeavy railWest section 120211598,000*
PinkMonorailFull line(2022)34.5199,054**
YellowMonorailFull line(2022)30.4195,000**
OrangeHeavy railEast section(2024)21.2170,000**
* Official statistics to be published by the end of 2021, ** Projects under construction, (): Expected.
Table 3. Descriptive statistics of the data.
Data ItemsUnitMeanStd. Dev.Min.Max.
Representative listing priceThai Baht (THB)4,916,1293,741,751899,00021,500,000
Representative listing price per sq.m.Thai Baht (THB)113,62656,86132,050300,000
Floor areaSquare meter40.9618.5921.70223.00
Age of the buildingMonth25.0628.170.00248.00
Building category (dummy)Dichotomous
(>8 stories = 1)
0.490.500.001.00
Distance to the city center (linear)Kilometer9.515.190.7726.38
Distance to the nearest station (linear)Kilometer0.690.560.012.95
Distance to the nearest station (network)Kilometer1.060.760.013.97
Distance to the nearest shopping mall (linear)Kilometer1.210.910.028.58
Distance to the nearest hospital (linear)Kilometer2.411.860.0710.91
Distance to the nearest university (linear)Kilometer3.602.630.0815.21
Table 4. Global coefficients of the OLS model.
VariablesUnstandardized
Coefficient
Standard
Error
Standardized
Coefficient
t-ValueVIF
Constant11.6130.186 62.289 **
ln(AreaSqM)0.2030.0470.1444.361 **1.359
Highrise0.0940.0300.1013.169 **1.267
Age−0.0030.001−0.210−6.892 **1.151
ln(DistCenter)−0.3560.027−0.500−13.075 **1.818
ln(DistStation)−0.0620.018−0.110−3.381 **1.316
ln(DistMall)−0.0640.018−0.113−3.571 **1.243
ln(DistHosp)−0.0560.018−0.104−3.077 **1.426
ln(DistUniv)−0.0300.020−0.049−1.5331.247
** statistically significant at 0.001 level.
Table 5. Model diagnostics: OLS, GWR, and MGWR models.
OLSGWRMGWR
Residual sum of squares207.04677.36174.016
Log-likelihood−494.718−242.697−231.382
AIC1007.436693.560656.669
AICc1009.875747.318702.542
R20.5960.8490.855
Adj.R20.5890.8110.822
Table 6. Results of the MGWR model: bandwidth and summary of the local coefficients.
VariablesBandwidthLocal Coefficients
MeanStd. Dev.MinMedianMax
Constant440.3110.655−0.7010.1931.577
ln(AreaSqM)1030.040.062−0.1140.0290.193
Highrise920.1350.104−0.0680.1230.368
Age197−0.1540.08−0.277−0.173−0.003
ln(DistCenter)153−0.2720.351−1.111−0.1040.028
ln(DistStation)98−0.2760.145−0.626−0.267−0.043
ln(DistMall)478−0.0540.014−0.079−0.055−0.011
ln(DistHosp)48−0.0620.269−0.68−0.0370.472
ln(DistUniv)1550.0730.092−0.1350.0820.272
Table 7. Elasticity of property value related to the rail transit station proximity.
ElasticityAreaRail line, Section
(Years in Service)
Approximate Increased Property Value for Each 100 m Station Proximity
>0.5Interchange
station
in city center &
city center
Light green, initial section
(22 years);
Blue, initial section
(17 years)
>6650 THB/sq.m.
(>200 USD/sq.m.)
0.4–0.49Central business district,
commercial
Light green, initial section
(22 years);
Dark green, initial section
(22 years);
Blue, initial section
(17 years)
5320–6650 THB/sq.m.
(160–200 USD/sq.m.)
0.3–0.39High-density
residential
3990–5320 THB/sq.m.
(120–160 USD/sq.m.)
0.2–0.29Medium-density residentialDark green, south extension 2
(8 years);
Light green, inner north extension
(3 years)
2660–3990 THB/sq.m.
(80–120 USD/sq.m.)
<0.2Medium-to-low density
residential
Purple, initial section
(5 years);
Light green,
north extension 2
(3 years);
Light green, south extension 2
(3 years);
Blue, west extension (3 years);
Pink, yellow, orange
(under construction)
<2660 Baht/sq.m.
(<80 USD/sq.m.)
Publisher’s Note: MDPI stays neutral with regard to jurisdictional claims in published maps and institutional affiliations.

