Abstract
In recent years, the air transport sector has played a significant role in the economy of the areas served. The demand for air travel has doubled every fifteen years and has grown faster with respect to other industries. This is also due to the introduction of low-cost airlines (LCA). In the coming decades, more efficient management of airports will become an essential aspect to address. A clear understanding of the current airport structure based on the analysis of the operational efficiency will therefore be necessary. All air carriers seek to expand their operations at airports, which tend to operate efficiently in order to reduce costs. However, in carrying out their activities and maximizing operational efficiency, airports should simultaneously manage to increase their passengers’ satisfaction. All over the world, passengers are demanding higher levels of service and regulators are paying increasing attention to the provision of airport services and the quality of the services supplied. Starting from these considerations, the aim of this paper is to study the efficiency of an airport through joint analysis of the operational efficiency (with the Data Envelopment Analysis -DEA-model) for the airport manager (by maximizing the exploitation of existing infrastructures), taking into consideration the quality of airport services as perceived by the user. The original and added value of this work lies in the quantitative analysis of the main characteristics that determine the efficiency of main European airports, also taking into account the quality perceived by the users during their trips with the air mode. Thus, the efficiency of 103 European airports in 37 different countries, for the year 2018, were compared, highlighting the effect of low-cost airlines. This aspect, as far as the authors know, has not been treated in the literature. Indeed, this study represents a decision support system (DSS) tool for operational managers in the air sector for the identification of the characteristics that improve airport efficiency. This paper refers to the pre-COVID-19 period because it would not be useful to make an efficiency analysis influenced by the pandemic, since the latter represents a specific event. Therefore, this analysis provides interesting inputs for both researchers and practitioners to manage the issue of efficiency in ordinary contexts. Moreover, the airline industry is characterized by cut-throat competition, and it may be very useful in the close future to examine this issue to improve firms’ management in the industry.
1. Introduction
To compete economically with other nations, a country should have advanced transport networks and infrastructures [1]. Roads, ports, railways, and airports represent a vital part of the development process of nations as well as a key component of the commercial relations and the well-being of people [1].
Air transport is the most efficient long-distance mode of transport in the world [2].
According to research carried out by the International Civil Aviation Organization [3], if global aviation was a country, it would generate a total contribution equal to 2.4 trillion euros to the gross domestic product (GDP) together with 65.5 million jobs, comparable to the economy of the United Kingdom. Air transport in Europe, on the other hand, supports a total of 12.2 million jobs and generates 720.2 billion Euros of contribution to the European GDP, representing 6.4% of the global market [3].
The economic debate on the sector is developing around the results obtained by the deregulation policies. The air transport sector is characterized by a competition market, which began in Europe at the end of the 1980s, based on the results and experiences in USA. The European Union (EU) deregulation has abolished the limits on both capacity and tariffs applied in favor of the free market, in which all the decisions are taken as a consequence of the meeting between supply and demand [4]. Under the effects of these deregulation pressures, the air transport sector market has moved towards more competitive contexts, characterized by high competition between multiple carriers, with a constant growth in transport demand which has consequently brought about the need for better infrastructures supporting the system [5].
The interest in performance measurement has increased in recent decades, with the recognition of its importance for private and public organizations in a constantly changing business environment [6,7,8,9,10,11].
Several scholars [12,13] have questioned the performance dimensions, since the multifaceted nature of airports has led to claim specific dimensions (i.e., efficiency/productivity, service quality, security, commercial, economic/financial, environmental, social, competitiveness). In reality, airports, at the worldwide level, are no longer considered as huge facilities and public utilities, but as complex service organizations [14]. As a consequence, a wider perspective of airport performance is needed. More precisely, what matters is to understand how the airport industry has evolved and addressed the different aspects of performance measurement.
In the light of the previous considerations, the perception of airports as complex service organizations leads one to take into consideration the interests of the different stakeholders, such as customers, local governments, regulators, etc. Consequently, the focus of airport performance is not just related to the measurement of the operational and financial indexes, but it counts on a more holistic and multidimensional approach [14,15,16]. The performance measurement becomes an essential activity for supporting decision makers with regard to the airport investment cycle.
Furthermore, passenger satisfaction has assumed a key role in representing a core dimension of airport performance [17]. A clear gap emerging from the referring literature is the fact that efficiency is measured in terms of productivity [18,19] and as a measure of the operational and financial indexes. Passenger satisfaction [17] is analyzed separately for the performance measurement, generally with qualitative analysis and not through quantitative measures. This demonstrates that there is still room for improvements. In this paper, a methodology is presented for verifying airport efficiency through joint analysis of the operational efficiency for the airport manager, taking into consideration the quality of airport services as perceived by the user. This paper adopts an overlapping perspective between productivity and passenger satisfaction, offering a wider view on airport efficiency.
The proposed methodology was applied to compare the efficiency of 103 European airports in 37 different countries. The original and added value of this work lies in the quantitative analysis of the main characteristics that determine the efficiency of the main European airports, also taking into account the quality perceived by users during their travels with the air mode. This aspect, as far as the authors are aware, has not been dealt with in the literature.
The proposed methodology of joint analysis of operational efficiency taking into consideration the quality of airport services as perceived by the user, can represent a Decision Support System (DSS) tool for operational managers in the air sector for the identification of the characteristics that improve airport efficiency. Furthermore, the proposed methodology could be useful in the evaluation of investments; in particular, it could be useful for sovereign funds and capital analysts to evaluate the most efficient airports in which to invest, e.g., for additional services to users. For this purpose, the paper is structured as follows. In Section 2, a literature review of methods for estimating airport efficiency and estimating passengers’ satisfaction are reported. Section 3 deals with the illustration of the case studies where the proposed methodology of analysis will be applied. In Section 4, the methodology and results are presented. Finally in Section 5, conclusions are described and both academic and managerial insights are addressed.
2. A Literature Review
In the coming decades, more efficient management of airports will become an essential aspect to address [5,20,21,22].
The structural changes in the aviation industry have led to a growing interest in airport benchmarking. Although it is obvious that air carriers use airports, there are few studies focusing on the operational efficiency of airports, while many can be found related to economic analysis [23,24,25,26] and environmental impacts [25,27,28].
The studies carried out in relation to the technical operational aspect are usually aimed at analyzing and comparing the efficiency and productivity of only major international airports [5,29,30,31].
2.1. Methods for Estimating Airport Efficiency
From an operational point of view, it is possible to distinguish two different methods to measure efficiency that have been mostly applied in the airport field, i.e., the parametric and non-parametric methods.
The parametric method consists of formulating an ad hoc function able to make inferences by defining the form of statistical distribution of the sample, depending on a finite set of parameters to be estimated. For this purpose, the method requires given hypotheses to be satisfied, such as normality, homoskedasticity, independence, and identical stochastic distribution of the error [32]. In order to implement this method, the stochastic frontier analysis (SFA) methodology, first introduced by Aigner and Chu in 1968, can be used. This method is used for efficiency tests; however, it has mainly been used to evaluate the efficiency of profit and non-profit organizations. Some studies related to the application of SFA to measure airport efficiency are: a stochastic frontier investigation of worldwide airports [23], technical efficiency of UK airports [24], a stochastic frontier analysis to estimate the relative efficiency of Spanish airports [25], and a stochastic frontier analysis applied to an Italian airport [33].
Parametric methods are limited by the need to introduce very restrictive hypotheses, which are very often difficult to justify. However, the distribution model is often not known, or it is not possible to satisfy these difficult hypotheses which are, however, necessary to make their application valid [32].
Among the non-parametric methods, the most widely applied in the airport field is the Data Envelopment Analysis (DEA) model. This is a performance evaluation process that has been used in recent decades since it is suitable for testing various aspects of airport efficiency, being able to perform multidimensional comparisons [34], taking into consideration several input and output variables at the same time, and for the processing of which specific calculation software has been created. The limit of this model is represented by its sensitivity to the data and parameters considered. Indeed, by selecting other input and output variables or by considering fewer parameters for the evaluation, different results can be obtained [35].
“A DMU is to be rated as fully (100%) efficient on the basis of available evidence if and only if the performances of other DMUs does not show that some of its inputs or outputs can be improved without worsening some of its other inputs or outputs” [36].
Gillen and Lall [29] were the first to apply the DEA model for evaluating the efficiency of twenty-one US airports with reference to the period from 1989 to 1993. There are several examples of application of the DEA model for the analysis of the efficiency of American airports; for example, Sarkis and Talluri [37] evaluated, through a variation of the DEA model, the efficiency of forty-four US airports in the period from 1990 to 1994, and reported that the top five airports fell within warm or stable weather areas, while the bottom five performers fell in colder weather climes. Furthermore, all the airports with the highest performance were hub airports. Diana [38] focused on ten US airports with reference to the summer periods of the years 2000, 2007, and 2008, with the aim of establishing whether the propagation of delays could depend on whether the airports operate in highly concentrated markets or operate in less concentrated markets. The conclusion was that there was no significant evidence for operating in one market or another.
In Europe, studies analyzing the efficiency of airports using the DEA method are not very recent. For example, Pels et al. [39] analyzed thirty-three European airports considering the period from the year 1995 to 1997. In their study, they concluded that airports on average operated with returns to scale constant in relation to the number of aircraft movements, and increasing returns to scale in relation to the number of passenger movements. In addition, business travelers were more sensitive to airport access times than leisure travelers.
Adler et al. [40] evaluated the efficiency of eighty-five small European regional airports with reference to the period from 2002 to 2009. In their study, they introduced environmental variables in order to understand their impact on airport management, concluding that, in Europe, airports operating as part of a group failed to achieve reasonable levels of non-aeronautical revenue, compared to autonomous airports, necessarily having to resort to regional incentives.
In Greece, the efficiency study of 38 airports carried out by Fragoudaki and Giokas [41] concluded that the performance of the airports was positively influenced by the location of the island and the hotel infrastructure available.
Examples of the application of the DEA model for the analysis of airport efficiency were also carried out in Turkey by Gillen and Lall [29] and Gok and Ugural [42] (in the reference period between the year 2007 and the year 2009.). The results obtained from both studies showed that the efficiency of international airports was greater than that of regional airports.
More recently Liu [43], analyzing east Asian airports, concluded that airport efficiency was positively influenced by the number of airlines served and destinations, while non-aeronautical revenues and quality of service had a significant impact on financial efficiency.
In this paper, to study the efficiency of 103 European airports, the DEA model based on constant returns on a CCR (Charnes, Cooper and Rhodes) scalewas developed with an output-oriented approach, to allow us to define the best airports from the point of view of operational efficiency.
2.2. Methods for Estimating Passengers’ Satisfaction
All air carriers seek to expand their operations at airports, which tend to operate efficiently in order to reduce costs. However, in carrying out their activities as well as maximizing their operational efficiency, airports should simultaneously manage to increase passengers’ satisfaction. All over the world, passengers are demanding higher levels of service and regulators are paying increasing attention to the provision of airport services and the quality of service provision [44].
Therefore, increasing passengers’ satisfaction provides an important aspect for airport competition. However, when an airport is too crowded, this can in turn lead to problems connected with comfort, long waiting times at check-in and for baggage claim, less availability of trolleys, etc. These aspects represent some of the most important quality indicators for users [45].
Several researchers have tried to define the key performance indicators (KPIs) to be considered, based on passengers’ perceptions related to the quality of services in airports. These are classified as objective and subjective criteria. Objective KPIs can be directly measured through waiting times, walking distance, etc. In comparison, subjective KPIs are related to staff courtesy, comfort, cleanliness, etc. and cannot be measured directly [46].
There are various techniques applied in the literature for the assessment of the quality of services (SQ), and the most used are: factor analysis, analytic hierarchical process (AHP), the importance–performance analysis (IPA), multi criteria decision making (MCDM), and the SERVQUAL questionnaire.
Factor analysis is widely applied in complex studies that include a large number of performance indicators, specifically using confirmatory factor analysis (CFA) combined with exploratory factor analysis (EFA) and regression. [10,47]. The analytic hierarchical process (AHP) is used to weight indicators based on the concept of pairwise comparisons. [48,49]. The importance–performance analysis (IPA) method allows comparison of passengers’ perceptions on the importance of service indicators using a back propagation neural networks approach. [50,51]. The multi criteria decision making (MCDM) technique has been applied to solve problems with multiple and complex attributes. However, its application in the airport terminal has emerged in the last decade, generally combined with other conventional methods. [52,53].
The SERVQUAL questionnaire is the most common method for assessing the SQ of any facility. It is based on comparing the quality expected by the customer of a specific service with the quality experienced by him/her. It is defined by five key dimensions: tangibility, reactivity, reliability, safety, and empathy [46,54].
Starting from these considerations, in order to correctly study the efficiency of an airport, it is then necessary to carry out a joint analysis of the operational efficiency for the airport manager (by maximizing the exploitation of existing infrastructures), taking into consideration the quality of airport services perceived by the user.
Specifically, in order to be able to estimate the extent of the variation in the output characteristics while also considering the quality of services as perceived by users, reference was made to the surveys of the Airports Council International (ACI) [55]. In March 2019, the winners of the Airport Service Quality Awards were proclaimed. The ACI recognizes those airports around the world that supply the best customer experience in the opinion of their passengers.
The optimal characteristics that each airport should have were calculated from the results of the analysis of the operational efficiency obtained from the DEA model, jointly taking into account the surveys of the quality of services perceived by users through the surveys.
3. The Case Study
An analysis and comparison of the performance of 103 European airports in 37 countries was carried out. The study considered all the main European airports (excluding military and special airports), selected so that the sampling rate was homogeneous among the 37 nations. The originality of the approach considered was to consider all the main airports of 37 European countries, defined as main by the ACI annual report [55]. Therefore, the analyses performed were carried out considering both small airports and larger airportsthe real hubs. Among all the airports reported by the ACI, the main airports were chosen (in terms of the demand) so that the sum of the number of inhabitants of the cities where the airports are placed was equal to 30% of the population of all the nations. In this way, each nation presents a constant sampling. Moreover, considering that the units are homogeneous, the results of the analysis provided better consistency. It is necessary to point out that the chosen population data was not limited only to the city served by the airport but refers to the metropolitan area of the city.
For the 103 airports studied, the following data were collected:
- (i)
- The physical infrastructures in the year of analysis (2018) were:
- (a)
- The number of runways at the airport [56,57];
- (b)
- Total length of the airport runways [56,57].
In Table A1 in Appendix A, the data collections for 103 European airports are reported. The airport with the highest number of runways was Amsterdam Airport Schiphol in the Netherlands and the airports with the longest runways were Amsterdam Airport Schiphol in the Netherlands, Madrid–Barajas Airport in Spain, and Da Vinci–Fiumicino Airport in Italy. The smallest airports in terms of physical infrastructure were placed in Romania.
- (ii)
- The services in the year of analysis (2018) (see Table A1 in Appendix A) were:
- -
- Airport connectivity [55]. The International Civil Aviation Organization (ICAO) generally defines connectivity as an indicator of a network’s concentration and its ability to move passengers from an origin to a destination. Two different types of connectivity can be distinguished:
- ▪
- Direct connectivity: indicates the number of destinations directly available from the airport.
- ▪
- Indirect connectivity: measures the number of flights and/or number of destinations connected with a stopover, multiplied by the quality of the stopover, and expressed by a percentage value depending on the travel time with the stopover compared to the direct flight time.
- -
- The number of traditional aircraft movements per day. The arrivals and departures of infra-weekly days from each airport website were considered, excluding weekends (January–March 2019) [56,58,59].
- -
- The number of movements of low-cost aircrafts per day. From the same sample described above, low-cost flights were distinguished from full cost ones [56,58,59].
- (iii)
- The number of passengers moved during 2018 (see Table A1 in Appendix A), obtained from the traffic reports of each individual airport).
The airport with the highest degree of air connectivity was London Heathrow Airport in the United Kingdom, while the airports with the highest number of low-cost movements were Barcelona El Prat Airport in Spain, Amsterdam Airport Schiphol in the Netherlands, and Düsseldorf Airport in Germany. Regarding the number of traditional movements, the airport with the highest value of movements was Paris Charles de Gaulle Airport in France, while the airports with the highest number of passenger movements were London Heathrow Airport in the United Kingdom, Paris Charles de Gaulle Airport in France, and Amsterdam Airport Schiphol in the Netherlands.
4. Using the DEA Model to Estimate the Efficiency of Airports
Data envelopment analysis (DEA) was introduced in 1978 by Charnes, Cooper, and Rhodes (CCR) and is one of the most commonly used non-parametric methods for the empirical analysis of production efficiency based on sample data. In recent years, this method has mainly been used to assess the efficiency of banks [60,61,62,63], hospitals [64,65,66], and universities [67,68,69], and is becoming increasingly popular in the productivity study of companies in different sectors, such as the airport sector [20,70].
The data envelopment analysis calculation model is a non-parametric method based on a linear programming that is used to measure the operational efficiency of homogeneous entities, called decision making units (DMU), receiving inputs and producing outputs [54] (Figure 1).

Figure 1.
The structure of the DEA model.
This method allows for evaluation of the efficiency of available resources (inputs) used to generate a set of results (outputs), compared to other units of the group.
The DEA model allows for the calculation of the efficiency of all the units evaluated within the sample considered, in a relatively simple way. The advantage of the DEA methodology is related to its multidimensional approach, which allows the performance of an efficiency analysis with multiple factors on both the inputs and the outputs side [54].
On the basis of the data collected, an efficiency frontier or a frontier of production possibilities was then developed, which was used as a reference set to determine the relative efficiency of other production units of the analyzed sample [54].
The DEA models can be divided in terms of the nature of their returns to scale:
- -
- The models with variable returns to scale (VRS) are represented by the BCC model, so called because of its authors [71]. This model estimates the pure technical efficiency [20].
- -
- The CRS model, so called because of its authors (Charnes, Copper, and Rhodes), with constant returns to scale estimates the overall technical efficiency, allowing a deeper insight into the causes of inefficiency [20].
In this analysis, an output-oriented CCR basic approach was developed, since the interest was aimed at maximizing the operational results of each individual DMU. In this way, the overall technical efficiency scores of the airports were obtained, indicating the ability of the analyzed DMUs to produce a given amount of outputs starting from a given set of inputs. This was also because the aim was to identify the maximum contribution of each operating result for the purpose of technical efficiency, thus neglecting any possible infrastructural change of the airports.
The objective of the DEA model is to be able to make each analyzed unit appear as efficient as possible compared to the other units, by comparing the level of inputs and outputs of each DMU with that of the other units, using a system of weights α and β which makes the homogenization of the quantities considered possible.
In the case of the airport analysis, an Effi objective function for measuring the efficiency of each DMUi airport was identified. This efficiency ratio is represented through the use of the [72] notation, shown in Equation (1):
where:
represents the absolute efficiency score of the airport i;
Ohi indicates the h outputs used for the airport i;
Iki represents the k inputs used for the airport i;
α and β are the optimal weights maximizing the efficiency ratio.
The fractional problem should be applied to each unit and subjected to the following constraints:
The relative efficiency of each DMUi, identified by the single airport, was then defined by a percentage value included in the interval [0, 1], where the efficiency will have maximum value when the Effi ratio is equal to 1, while for values different from 1 the DMU will be inefficient.
This represents a nonlinear fractional type problem; therefore, in order to be solved, it is necessary to convert it into a linear programming problem. In order to do this, it is first necessary to perform a normalization to 1 of the numerator (according to the approach of the output-oriented DEA model), minimizing the function found in the denominator (as suggested by [54]).
The formulation (1) subject to the constraints (2) is equivalent to the linear programming problem (3):
This linear programming problem can be solved with the use of a software especially developed for the calculation of efficiency through the DEA model.
In this study, general aviation was not considered, and the focus was instead on the scheduled flights and, in particular, on the exclusive transport of passengers, thus neglecting freight transport.
The input data are generally made up of resources that are available to all airports and airport operations managers to help with generating the output results necessary for the airport operational performance [54].
The output data, on the other hand, are generally made up of the operational results generated by the airport, such as the number of aircraft movements, the number of passengers, the quantity of goods shipped, or the movements of the general aviation [54].
When selecting inputs and outputs, the following key aspects should be respected:
- -
- The suitability of the selected variables with respect to the economic importance of technical efficiency;
- -
- The availability of the data requested for all the DMUs;
- -
- The optimal number of inputs and outputs compared to the number of DMUs. It is recommended that the minimum number of DMUs is at least three times the total number of inputs and outputs [73];
- -
- The uniqueness of the information contained in the input and output points, to avoid duplication and redundancy.
The inputs and outputs taken into consideration in applying the DEA approach vary between different studies in the scientific literature, as reported in Table 1.

Table 1.
Input and output most frequently used in the scientific literature of the sector.
From the point of view of the inputs variable, economic-financial factors, such as labor [24] and operational costs [40,74], or factors taking into account the physical infrastructure of the airport, such as the number of runways [70,74], the terminal area [39,42,74,75], the check-in counters, or the number of boarding gates [39,76], are considered.
With regard to the representative factors of airport infrastructures, those that usually fall within the study of the operational performance are related to the part of the airport called air-side, i.e., the area where the flight infrastructures are present, such as the landing strip, the aprons for aircraft, the fittings connecting the aprons to the runway, and the taxiways.
Since some data were not available for all the airports in the sample under analysis, some variables were excluded in advance from the model.
The characteristics required by the problem, the availability of data, and the introduction of experimental variables allowed us to consider two input variables and four output variables for this efficiency study.
The input variables, representative of the size of the airport infrastructure, are:
- -
- The number of runways at the airport [74,77];
- -
- Total length of the airport runways [20,39,40,42,74,76].
As output variables, the operating results in terms of the number of passengers moved were taken into account, according to [20,21,39,40,42,74,75,76,77,78].
In this analysis, we introduced three specific outputs not considered in previous airport efficiency studies present in the scientific literature, including:
- -
- The movement of low-cost aircrafts, in order to consider the impact of low-cost airlines on operational efficiency.
- -
- The movement of traditional (non-low-cost) aircrafts, to be able to make a comparison between the contribution provided by traditional carriers compared to the contribution provided by low-cost carriers for the purposes of airport efficiency results.
- -
- The airport connectivity of each unit, taking into consideration the sum of the direct and indirect connectivity of each analyzed airport. In considering this variable, the 2001 study by Adler and Berechman was taken as a reference, which considered connectivity data such as the distance of the airport from the center.
Main Results
As specified in the previous section, to estimate the efficiency of the airports, a DEA analysis was conducted on a sample of 103 European airports, using the constant returns to scale (CCR) model with an output-oriented approach. The linear programming problem shown in Equation (3)—Section 4, was solved with MaxDEA 8 Basic software. The results obtained from the analysis show that the overall average score (for the 103 European airports) of the relative technical efficiency is 0.355, indicating that most of the units in the sample are inefficient.
In Figure 2, the relationships between the input/output variables and the corresponding efficiency values are shown, obtained for each airport analyzed. Considering the current data of the analysis sample, it is possible to observe that an analysis of only the inputs or only the outputs cannot allow for efficiency computation.
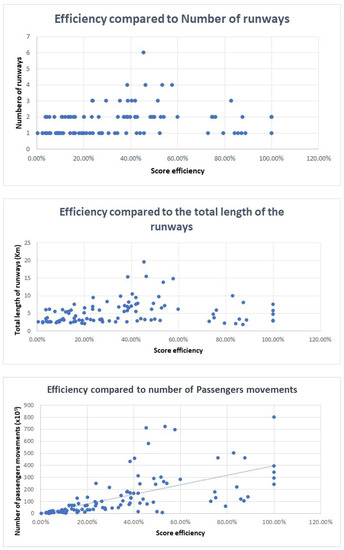
Figure 2.
Distribution graphs: the relationships between the input/output variables and the respective efficiency values.
It can be observed from the first two scatter figures that airport efficiency is not influenced by the number or by the length of the runways. The airports with the highest number of passenger movements do not all achieve the total efficiency. It is therefore necessary to carry out a joint analysis of the inputs and outputs of each airport through the use of the DEA model, which allows identification of the characteristics to be improved (inputs and outputs) in order to reach a condition of total efficiency. Indeed, the MaxDEA also provides a series of projections between the results, reported in Table A2 in Appendix A, i.e., the values that the inefficient units should reach to obtain a total efficiency score.
These values are identified as the algebraic sum of the original values, the slacks, and the radial movements. They are different according to the efficiency levels of each unit and in the output-oriented case, they correspond to a variation in the production levels with the same input.
Therefore, this methodology makes it possible to identify the strengths and weaknesses of each airport (DMU) and, through a benchmarking analysis, the improvements required from an exclusively operational point of view.
For example, the Lyon–Bron airport (LYN) in France has an efficiency value equal to 0.872.
Our results (highlighted in bold in in Table A2 in Appendix A) indicate that an increase in the connectivity index can be due to an increase of 15% of the number of movements of low-cost aircrafts and the number of movements of traditional aircrafts, and with a reduction of the number of runways equal to 25%.
This result highlights that the DEA method presents a series of criticalities for the efficiency analysis. Specifically, to reach the perfect efficiency, it also provides the reduction of inputs, such as the number and length of runway, although this represents an inapplicable aspect since it would not make sense to dispose of a usable runway or reduce its length.
For this reason, the approach followed in this research was to fix the input and maximize the output with the aim of maximizing efficiency. On the basis of the results of the efficiency score obtained, a detailed analysis was carried out for the ten most efficient airports, reported in Table 2.
Table 2.
Efficiency scores and variables associated with the 10 most efficient airports.
The CCR-O model used in this specific analysis identified five airports with a score equal to 1, which are therefore fully efficient:
- -
- Düsseldorf Airport in Germany (DUS).
- -
- Dublin International Airport in Ireland (DUB).
- -
- Jönköping Airport in Sweden (JKG).
- -
- Sabiha Gökçen Airport in Turkey (SAW).
- -
- London Heathrow Airport in the United Kingdom (LHR).
This means that the size of operations at these airports are optimal and, at the same time, able to effectively transform assigned inputs into outputs thanks to appropriate management methods, practices, and processes.
Specifically, London Heathrow (LHR) airport (see Table 2) had the highest number of passengers moved in the sample analyzed. Moreover, the airport was the second in the sample for the number of traditional aircraft movements. The airports of Düsseldorf (DUS) in Germany, Dublin (DUB) in Ireland, and Sabiha Gökçen (SAW) in Turkey were among the top seven airports in the sample for the number of movements of low-cost aircrafts, which confirms the hypothesis of the importance of this factor for airport performance.
The other airports, although inefficient, still had high scores (between 0.84 and 0.89).; thus, it would be possible to improve their results through modest increases in output starting from the set of resources defined.
Another analysis was then carried out by looking at the ten least efficient airports that resulted from the processing of the sample data (Table 3).
Table 3.
Efficiency scores and variables associated with the 10 least efficient units.
By examining the data from these airports, it is easy to see that they all have an air connectivity index, number of passengers moved, number of movements of low-cost aircraft, and number of movements of traditional aircrafts well below the average values of the sample.
Therefore, despite the structural characteristics they are equipped with, these airports are unable to attract airlines and consequently land or take off a large number of aircrafts. This inevitably also leads to a low number of passengers moved.
Technical inefficiency thus represents poor management of the resources available when the maximum output is not reached. This means that it is necessary to proportionally increase the outputs and stimulate demand, especially when trying to attract airlines to enter into contracts with airports or to increase the number of stopovers.
The airport with the lowest degree of efficiency occupying the last position in the sample was that of Satu Mare in Romania (SUJ), which together with the other two airports in Romania, Mihail Kogălniceanu (CND) and Bacău (BCM), and the airports of Tomsk in Russia (TOF), La Rochelle in France (LRH), and Trapani-Birgi in Italy (TPS) fell within the last ten positions for the number of passengers moved and the connectivity in the analyzed sample.
For some of these airports, such as Bacău Airport in Romania (BCM), percentage changes based on projections to the optimal value indicate a reduction in the number of runways or runway length. However, the runways are not an input for which this type of operation can be performed, so these data mean that these variables are not fully used.
With reference to the outputs, however, these airports should significantly increase all four elements considered to reach a condition of efficiency, as reported in the model projections. With regard to the aircraft movements, looking at the last ten airports, there are five airports that fell into the last eight positions for the number of movements of low-cost aircrafts:
- -
- Satu Mare Airport in Romania (SUJ);
- -
- Tomsk Airport in Russia (TOF);
- -
- La Rochelle Airport in France (LRH);
- -
- Chișinău Airport in Moldova (KIV);
- -
- Tivat Airport in Montenegro (TIV).
Among these ten, six airports fell into the bottom eight positions for the number of traditional aircraft movements:
- -
- Satu Mare Airport in Romania (SUJ)
- -
- Tomsk Airport in Russia (TOF)
- -
- La Rochelle Airport in France (LRH)
- -
- Mihail Kogălniceanu Airport in Romania (CND)
- -
- Trapani-Birgi Airport in Italy (TPS)
- -
- Bacău Airport in Romania (BCM)
To understand what, on average, are the most important characteristics for the efficiency of an airport, an analysis was carried out comparing the average virtual weights of the outputs, obtaining the results shown in Table 4.
Table 4.
Relative comparison of the average virtual weights of operating results.
The virtual weights β’ were obtained from the product of the outputs values with the corresponding absolute weights generated by the MaxDEA software.
The comparison showed that the number of passengers moved has a weight on efficiency almost twice that of the air connectivity index (1.77).
The number of low-cost aircrafts moved weighs about one and a half times more than the air connectivity index (1.62), and similarly the number of passengers moved weighs about one and a half times more than the number of movements of traditional aircraft (1.42). The number of movements of low-cost aircraft also has a higher weight than the number of movements of traditional aircrafts (1.30), while the number of movements of traditional aircraft has a weight slightly higher than the air connectivity index (1.25). Finally, the number of passengers moved has a weight higher than the number of movements of low-cost aircrafts (1.10).
In view of these relationships, it is possible to state that of the outputs present for this analysis, the order of importance for the purposes of the airport efficiency is as follows:
- Number of passenger movements;
- Number of low-cost movements;
- Number of traditional movements;
- Air connectivity.
Based on these results related to the examined context, it is possible to say that on average an increase in the number of passengers and movements will have a greater effect on efficiency than an increase in connectivity. On the other hand, the number of movements of low-cost aircrafts appears to have a greater impact on efficiency than the number of movements of traditional aircrafts.
5. The Quality Perceived by the User
The assessment of the quality of services (SQ) provided to its users is an important challenge in the assessment of the functional efficiency of airports. The functional efficiency of an airport terminal is a measure of the efficiency in terms of process times, comfort, and travel experience.
Airport service quality (ASQ) is the main global benchmarking program for airport passengers’ service, providing the research tools and management information to better understand the opinions and needs of users through a measurement of passengers’ satisfaction, while they travel across an airport, based on key performance indicators [79]). The Airport Council International (ACI) has defined airport service quality (ASQ) as “The overall level of passenger satisfaction measured by survey responses”.
To determine, in an operational way, what the variation was in airport outputs, the efficiency was re-computed, using the DEA model, establishing as best practices those airports that obtained the best score from the point of view of operational efficiency (described in Section 4) and that were jointly among the best airports in relation to the quality of services as perceived by the user, based on the ACI world airport service quality program published on 6 March 2019. The best airport referred to is the airport of Dublin.
Main Results
From the results of the analysis that jointly took into account the operational efficiency and the quality of services as perceived by the user, it is possible to identify the percentage variations of the output values such that the sample airports can reach the optimal values relating to the selected best practices; that is, the values that the airports should reach to obtain a total efficiency score from both an operational and functional point of view. These variations, shown in Table A3 in Appendix A, were obtained with respect to the initial values.
Therefore, this methodology allows for identification of the improvement objectives for each airport to achieve maximum operational and functional efficiency.
In this research, the approach followed was to fix the inputs and analyze only the variations of the outputs, with the aim of maximizing the operational efficiency and the quality level of the service as perceived by the users. It is possible to observe that some of the airports that in the previous operational analysis did not reach total efficiency, through the DEA model that takes into account the quality of services perceived by users, are now totally efficient and are not required to increase their outputs.
In particular, nine airports were perfectly efficient (score 1 in Table A3 in Appendix A), and do not require an increase in their output (the variation of the outputs with respect to the current scenario is 0%), while, for example BGY airport, was not perfectly efficient (score 0.94) and the results (shown in in Table A3 in Appendix A) highlight that the most important outputs to be maximized to achieve perfect efficiency (score 1) are air connectivity (it should increase by 157% compared to the present value) and movements/day of traditional aircrafts (it should increase by 256% compared to the present value).
The results of this analysis may be useful for service operators, because for each airport it is possible to identify which outputs to maximize in order to achieve better operational efficiency, aiming also at a high level of user satisfaction.
6. Conclusions and Further Perspectives
The results of this research can support a methodological proposal for assessing the performance of airports in Europe. The DEA model (CCR), based on constant returns to scale with an output-oriented approach, was chosen as the evaluation method, in relation to the airport that jointly presents the highest quality of airport services as perceived by users. This made possible the relative technical efficiency of the transformation of two measured entrances (number and total length of airways) and four exits, integrating experimental variables for analysis (number of passenger movements, air connectivity index, number of movements of low-cost aircraft, and number of traditional aircraft movements), for which the existence of a relationship with the operational efficiency of the airports was calculated.
The inputs and outputs were chosen on the basis of the existing data available and the most appropriate results for the analysis in question. Once the data was collected, they were processed with the MaxDEA software (MaxDEA Software Ltd., Beijing, China), through which it was possible to carry out a detailed analysis considering multiple input and output factors at the same time.
The result show that, taking into account the inputs and outputs used in the analysis, the average efficiency score of the European airports analyzed is 0.35.
By applying the output-oriented DEA model, a ranking of the ten most efficient airports and one of the ten least efficient airports was identified for the context of analysis, selecting those with total efficiency, i.e., the airports that were able to effectively transform inputs, maximizing their results through best practices and appropriate processes in managing operations. In relation to this study, there were five fully efficient airports, or 4.85% of all airports in the sample. In all other cases analyzed, the airports were classified as inefficient in their ability to transform predetermined inputs into maximum output potential. Management recommendations for these inefficient airports should primarily aim at increasing demand to increase the number of aircraft and passengers. Subsequently, on the basis of the results of the ACI ASQ Award 2019, the best practices were determined among the most efficient airports at an operational level that would allow to joint maximization of operational efficiency and users’ quality perception, while ensuring that resource saturation is not reached such as to reduce the perceived quality of airport services offered to users.
The percentage projections obtained allow indications of the right maneuvers that these airports should carry out to improve their performance and move closer to efficiency.
It was also shown that the most important characteristics that maximize the efficiency of an airport are the number of passenger movements and the number of low-cost aircraft movements. This shows that, other things being equal, an airport with more low-cost movements is more efficient than an airport with fewer low-cost movements and more movements with traditional carriers.
However, this data runs the risk of being too strong, if taken out of the fact that an aiport is not allowed to operate with 0.35 runways. There is a minimum airport size—european aviation safety agency European Union Aviation Safety Agency (EASA) certification rules, for example, define the minimum length of runways as well as the length, width, and separation required to handle a typical LCC B737 rather than an A320 series aircraft. Therefore, the airport efficiency must also be connected to the minimum runway size. Given a constrained minimum production unit size, airports are effectively maximizing passengers by competing within catchment areas and with other airports serving low-cost airlines.
In conclusion, the application of the DEA model, while not allowing the identification of the causes and factors on which airport inefficiencies depend, proves to be a useful methodology for achieving a synthetic assessment in terms of operational and functional performance. Through this analysis, it is possible to understand which good practices should be promoted to achieve perfect efficiency without reducing the quality of services as perceived by users.
It is useful to underline that in this paper, a methodology was presented for verifying airport efficiency through joint analysis of the operational efficiency taking into consideration the quality of airport services as perceived by the user; however, a “functional efficiency” measure has not been proposed. An interesting future development would be to introduce a “functional efficiency” measure, estimated considering operational and financial indexes and passengers’ satisfaction.
Further perspectives should consider the comparison of the results reported here with those obtained with other methods. Furthermore, future research may employ the application of the same methodology to other case studies, such as American airports. Implementing a survey at the airports analyzed is also suggested, to assess the actual service quality perceived by users. In this way, the proposed method can be enriched by considering the perceived services quality for all the airports in the sample, and not only for the value of the best airport as carried out in this analysis.
Author Contributions
Study conceptions, methodology formulation and quantitative estimations: I.H.; quantitative estimation M.E.; supervision V.d.C.; data collection G.d.G.; study conceptions F.P. The text is a joint work of all authors. All authors have read and agreed to the published version of the manuscript.
Funding
This manuscript is the result of research work that did not receive any funds for the preparation of itis research. The study received no external funding.
Institutional Review Board Statement
Not applicable.
Informed Consent Statement
Not applicable.
Conflicts of Interest
The authors declare no conflict of interest.
Appendix A
Table A1.
The data collections for 103 European airports.
Table A1.
The data collections for 103 European airports.
| DMU | No. Airways | Airways Length (Km) | Air Connectivity | No. Passenger Movements in 2018 (Mln) | Movem/Day Low-Cost (Thousand) | Movem/Day Traditional (Thousand) |
|---|---|---|---|---|---|---|
| SZG | 1 | 2.75 | 818 | 1.84 | 9.02 | 9.43 |
| VIE | 2 | 7.10 | 8,201 | 24.83 | 51.18 | 170.16 |
| BRU | 3 | 9.84 | 8417 | 10.52 | 17.90 | 217.56 |
| CRL | 1 | 2.55 | 593 | 7.45 | 18.91 | 56.06 |
| LGG | 2 | 6.03 | 22 | 0.30 | 15.68 | 26.46 |
| SJJ | 1 | 2.60 | 620 | 1.03 | 2.88 | 10.55 |
| BOJ | 1 | 3.20 | 373 | 3.28 | 3.35 | 19.93 |
| SOF | 1 | 3.60 | 2136 | 6.96 | 19.11 | 41.66 |
| VAR | 1 | 2.52 | 320 | 2.28 | 4.65 | 13.11 |
| ZAG | 1 | 3.25 | 2475 | 3.34 | 2.28 | 41.41 |
| LCA | 1 | 3.00 | 1291 | 8.07 | 11.47 | 37.89 |
| PFO | 1 | 2.70 | 212 | 2.87 | 5.43 | 8.49 |
| BRQ | 2 | 3.45 | 117 | 0.50 | 8.23 | 32.94 |
| PRG | 2 | 6.97 | 5532 | 16.80 | 40.98 | 114.55 |
| CPH | 3 | 9.70 | 8,933 | 30.30 | 88.28 | 175.13 |
| TLL | 1 | 3.48 | 1830 | 3.01 | 4.41 | 44.15 |
| HEL | 3 | 9.46 | 5545 | 25.00 | 4.17 | 121.48 |
| BIA | 1 | 2.52 | 243 | 1.53 | 4.82 | 11.69 |
| BIQ | 1 | 2.25 | 350 | 1.18 | 3.71 | 7.05 |
| BOD | 2 | 5.52 | 649 | 6.80 | 18.35 | 31.62 |
| CDG | 4 | 13.82 | 19,658 | 72.23 | 30.25 | 450.69 |
| LRH | 1 | 2.26 | 66 | 0.24 | 1.49 | 2.24 |
| LYN | 1 | 1.82 | 3477 | 10.28 | 22.55 | 99.85 |
| MPL | 2 | 3.70 | 66 | 1.88 | 3.66 | 12.82 |
| MRS | 2 | 5.87 | 912 | 10.15 | 17.31 | 95.19 |
| NTE | 1 | 2.90 | 1481 | 0.72 | 38.26 | 24.95 |
| PUF | 1 | 2.50 | 355 | 0.61 | 0.57 | 9.38 |
| TBS | 2 | 5.50 | 1231 | 1.58 | 3.82 | 16.79 |
| BRE | 2 | 3.33 | 5387 | 1.61 | 9.41 | 36.58 |
| CGN | 3 | 8.14 | 2185 | 12.96 | 88.07 | 56.13 |
| DUS | 2 | 5.70 | 8100 | 24.30 | 127.49 | 91.33 |
| FMO | 1 | 2.17 | 746 | 1.03 | 3.34 | 31.71 |
| FRA | 4 | 14.80 | 19,029 | 69.51 | 88.73 | 423.38 |
| HAJ | 3 | 6.92 | 2868 | 6.32 | 37.92 | 40.84 |
| HAM | 2 | 6.92 | 6208 | 17.23 | 33.65 | 46.35 |
| MUC | 2 | 8.00 | 13,636 | 46.30 | 32.38 | 380.62 |
| STR | 1 | 3.35 | 1495 | 11.83 | 71.43 | 53.02 |
| SXF | 1 | 3.60 | 1361 | 0.82 | 6.46 | 0.89 |
| TXL | 2 | 5.45 | 7674 | 1.60 | 5.16 | 9.81 |
| ATH | 2 | 7.80 | 6479 | 24.14 | 40.75 | 176.35 |
| HER | 2 | 4.28 | 1370 | 8.10 | 2.23 | 53.45 |
| BUD | 2 | 6.72 | 4175 | 14.87 | 39.46 | 75.57 |
| KEF | 2 | 6.12 | 2,124 | 9.80 | 29.94 | 38.06 |
| DUB | 2 | 4.71 | 8374 | 29.45 | 108.22 | 114.47 |
| BGY | 2 | 3.71 | 928 | 12.90 | 82.07 | 7.46 |
| BLQ | 1 | 2.80 | 889 | 8.51 | 32.11 | 39.39 |
| CAG | 1 | 2.80 | 862 | 4.36 | 22.01 | 18.87 |
| CIA | 1 | 2.21 | 391 | 5.84 | 52.39 | 0.26 |
| FCO | 4 | 15.30 | 11,308 | 43.00 | 75.09 | 232.65 |
| LIN | 2 | 3.04 | 3,226 | 9.23 | 7.63 | 107.67 |
| MXP | 2 | 7.84 | 7417 | 24.73 | 25.87 | 168.64 |
| NAP | 1 | 2.64 | 2,085 | 9.93 | 49.86 | 23.46 |
| PMO | 2 | 5.39 | 1223 | 6.60 | 10.95 | 37.33 |
| TPS | 1 | 2.70 | 82 | 0.48 | 2.98 | 2.98 |
| TRN | 1 | 3.30 | 1796 | 4.08 | 14.51 | 31.00 |
| TRS | 1 | 3.00 | 355 | 0.73 | 6.74 | 8.69 |
| VRN | 1 | 3.07 | 1036 | 3.46 | 9.72 | 22.93 |
| PRN | 1 | 2.50 | 667 | 2.17 | 2.65 | 5.74 |
| VNO | 1 | 2.52 | 1417 | 4.92 | 18.05 | 29.14 |
| SKP | 1 | 3.04 | 557 | 2.16 | 6.91 | 11.28 |
| MLA | 2 | 5.83 | 2042 | 6.81 | 11.87 | 36.86 |
| KIV | 2 | 5.97 | 656 | 1.42 | 1.97 | 12.14 |
| TGD | 1 | 2.50 | 415 | 0.70 | 0.96 | 9.57 |
| TIV | 1 | 2.50 | 315 | 0.91 | 0.96 | 9.61 |
| AMS | 6 | 19.47 | 15,988 | 71.05 | 153.95 | 345.49 |
| EIN | 1 | 3.00 | 419 | 6.20 | 11.28 | 27.36 |
| OSL | 2 | 6.55 | 6568 | 26.59 | 45.43 | 181.10 |
| SVG | 2 | 5.01 | 1525 | 3.85 | 10.36 | 35.06 |
| TRD | 1 | 3.00 | 1332 | 4.44 | 10.76 | 47.51 |
| KRK | 2 | 5.10 | 1997 | 6.77 | 20.80 | 14.76 |
| KTW | 1 | 3.20 | 666 | 4.84 | 20.96 | 20.05 |
| POZ | 1 | 2.50 | 753 | 2.48 | 7.32 | 17.07 |
| WAW | 2 | 5.49 | 5434 | 17.76 | 4.31 | 136.41 |
| WRO | 1 | 2.50 | 1033 | 3.35 | 16.69 | 15.81 |
| LIS | 2 | 6.12 | 6595 | 29.03 | 23.55 | 190.16 |
| OPO | 1 | 3.48 | 2099 | 11.94 | 24.55 | 67.47 |
| BBU | 1 | 3.10 | 3704 | 13.82 | 59.11 | 63.86 |
| BCM | 1 | 2.50 | 57 | 0.45 | 3.23 | 1.06 |
| CLJ | 1 | 2.10 | 532 | 2.78 | 10.65 | 13.23 |
| CND | 1 | 3.50 | 46 | 0.13 | 3.24 | 3.24 |
| OMR | 1 | 2.10 | 32 | 21.86 | 0.56 | 0.41 |
| SUJ | 1 | 2.50 | 13 | 0.08 | 0.33 | 0.66 |
| LED | 2 | 7.18 | 4587 | 18.12 | 28.46 | 136.95 |
| SVO | 3 | 10.45 | 6567 | 45.80 | 53.13 | 125.47 |
| TOF | 1 | 2.50 | 198 | 0.54 | 0.25 | 3.86 |
| VKO | 2 | 6.56 | 1783 | 12.60 | 36.81 | 128.27 |
| BTS | 2 | 6.09 | 236 | 2.29 | 7.52 | 13.96 |
| BCN | 3 | 9.93 | 10,747 | 50.17 | 167.29 | 168.36 |
| MAD | 4 | 15.45 | 1288 | 57.89 | 73.77 | 336.06 |
| VLC | 1 | 3.22 | 2213 | 7.80 | 28.96 | 46.84 |
| ARN | 3 | 8.30 | 8261 | 21.56 | 6.40 | 25.13 |
| JKG | 2 | 2.80 | 202 | 39.31 | 80.56 | 277.49 |
| BSL | 2 | 5.72 | 2517 | 8.58 | 53.25 | 44.02 |
| GVA | 2 | 4.72 | 6553 | 17.70 | 75.10 | 112.06 |
| ZRH | 3 | 9.50 | 10,486 | 31.11 | 32.13 | 246.33 |
| ADB | 2 | 6.48 | 1580 | 13.41 | 26.73 | 55.03 |
| ESB | 2 | 7.50 | 2295 | 16.74 | 64.53 | 53.28 |
| SAW | 1 | 3.00 | 708 | 34.06 | 89.61 | 95.77 |
| IEV | 1 | 2.31 | 900 | 2.81 | 1.51 | 22.15 |
| KBP | 2 | 7.50 | 2029 | 12.60 | 3.53 | 68.44 |
| LGW | 2 | 5.88 | 4689 | 46.08 | 105.31 | 178.65 |
| LHR | 2 | 7.56 | 25,354 | 80.10 | 31.55 | 444.07 |
| MAN | 2 | 6.10 | 7325 | 28.36 | 61.78 | 139.46 |
Table A2.
MaxDEA projections of the percentage variations of input and output.
Table A2.
MaxDEA projections of the percentage variations of input and output.
| DMU | No. Airways | Airways Length | Air Connectivity | No. Passenger Movements | Movem/Day Low-Cost | Movem/Day Traditional |
|---|---|---|---|---|---|---|
| SZG | 0.00% | 0.00% | 509.85% | 768.97% | 509.85% | 624.17% |
| VIE | 0.00% | −2.87% | 84.69% | 202.05% | 84.69% | 97.69% |
| BRU | 0.00% | 0.00% | 257.21% | 919.31% | 251.16% | 181.92% |
| CRL | 0.00% | 0.00% | 515.26% | 298.73% | 162.45% | 162.45% |
| LGG | 0.00% | 0.00% | 25634.06% | 22358.81% | 822.58% | 822.58% |
| SJJ | −12.24% | 0.00% | 1012.33% | 2130.05% | 1012.33% | 1012.33% |
| BOJ | 0.00% | 0.00% | 2165.27% | 973.27% | 838.75% | 838.75% |
| SOF | 0.00% | −6.68% | 191.03% | 428.81% | 191.03% | 269.41% |
| VAR | 0.00% | 0.00% | 985.56% | 1170.35% | 985.56% | 985.56% |
| ZAG | −13.99% | 0.00% | 340.54% | 932.48% | 495.42% | 361.19% |
| LCA | 0.00% | 0.00% | 336.33% | 316.72% | 320.96% | 316.72% |
| PFO | 0.00% | 0.00% | 985.95% | 985.95% | 1114.57% | 1377.37% |
| BRQ | 0.00% | 0.00% | 2911.36% | 8859.00% | 807.49% | 807.49% |
| PRG | 0.00% | −2.21% | 150.27% | 342.57% | 150.27% | 181.66% |
| CPH | 0.00% | 0.00% | 93.74% | 200.85% | 93.74% | 117.01% |
| TLL | 0.00% | 0.00% | 492.94% | 1146.52% | 372.30% | 372.30% |
| HEL | 0.00% | 0.00% | 317.83% | 317.83% | 2488.85% | 343.04% |
| BIA | 0.00% | 0.00% | 1059.08% | 1818.77% | 1059.08% | 1059.08% |
| BIQ | −4.52% | 0.00% | 1118.89% | 1390.01% | 1118.89% | 1118.89% |
| BOD | 0.00% | 0.00% | 643.22% | 804.79% | 643.22% | 643.22% |
| CDG | 0.00% | 0.00% | 122.76% | 106.26% | 153.14% | 86.90% |
| LRH | 0.00% | 0.00% | 3750.14% | 8202.16% | 3750.14% | 3750.14% |
| LYN | −24.79% | 0.00% | 14.63% | 89.16% | 14.63% | 14.63% |
| MPL | 0.00% | 0.00% | 5251.85% | 2406.48% | 2170.27% | 2170.27% |
| MRS | 0.00% | 0.00% | 1484.09% | 547.89% | 278.26% | 278.26% |
| NTE | 0.00% | 0.00% | 91.09% | 2702.98% | 91.09% | 156.85% |
| PUF | −7.50% | 0.00% | 1718.31% | 4551.78% | 4277.28% | 1718.31% |
| TBS | −15.70% | 0.00% | 1213.28% | 3199.71% | 1213.28% | 1527.52% |
| BRE | −53.83% | 0.00% | 99.90% | 2019.60% | 99.90% | 410.76% |
| CGN | −2.28% | 0.00% | 157.22% | 518.52% | 157.22% | 330.22% |
| DUS | 0.00% | 0.00% | 0.00% | 0.00% | 0.00% | 0.00% |
| FMO | 0.00% | 0.00% | 457.99% | 2455.97% | 869.65% | 422.33% |
| FRA | 0.00% | −4.28% | 89.33% | 119.88% | 73.19% | 73.19% |
| HAJ | −1.88% | 0.00% | 321.64% | 597.00% | 321.64% | 321.64% |
| HAM | 0.00% | 0.00% | 160.33% | 321.01% | 160.33% | 625.76% |
| MUC | 0.00% | −6.19% | 79.47% | 72.05% | 14.23% | 14.23% |
| STR | 0.00% | −8.30% | 16.53% | 192.21% | 16.53% | 101.18% |
| SXF | 0.00% | −2.35% | 532.53% | 4554.39% | 532.53% | 20138.92% |
| TXL | −27.92% | 0.00% | 138.16% | 3503.66% | 340.89% | 3163.36% |
| ATH | 0.00% | −9.96% | 163.91% | 214.76% | 102.43% | 102.43% |
| HER | −2.23% | 0.00% | 508.37% | 537.46% | 2724.74% | 508.37% |
| BUD | 0.00% | −0.36% | 188.23% | 393.91% | 188.23% | 301.67% |
| KEF | 0.00% | 0.00% | 324.17% | 387.53% | 324.17% | 384.38% |
| DUB | 0.00% | 0.00% | 0.00% | 0.00% | 0.00% | 0.00% |
| BGY | −37.07% | 0.00% | 33.14% | 217.47% | 33.14% | 1464.39% |
| BLQ | 0.00% | 0.00% | 134.67% | 236.91% | 134.67% | 134.67% |
| CAG | 0.00% | 0.00% | 225.31% | 383.11% | 225.31% | 256.08% |
| CIA | −26.40% | 0.00% | 33.29% | 329.25% | 25.90% | 26699.63% |
| FCO | 0.00% | −10.26% | 159.53% | 247.73% | 159.53% | 184.89% |
| LIN | −35.50% | 0.00% | 106.39% | 289.22% | 413.97% | 106.39% |
| MXP | 0.00% | −7.46% | 178.51% | 214.45% | 133.94% | 133.94% |
| NAP | 0.00% | 0.00% | 37.11% | 119.73% | 37.11% | 201.87% |
| PMO | 0.00% | 0.00% | 713.97% | 808.87% | 713.97% | 713.97% |
| TPS | −1.83% | 0.00% | 2390.59% | 5299.94% | 2390.59% | 2553.96% |
| TRN | 0.00% | 0.00% | 262.86% | 680.99% | 262.86% | 347.47% |
| TRS | 0.00% | 0.00% | 921.01% | 3345.04% | 921.01% | 921.01% |
| VRN | 0.00% | 0.00% | 456.32% | 778.62% | 456.32% | 456.32% |
| PRN | −19.19% | 0.00% | 941.58% | 941.58% | 941.58% | 1915.83% |
| VNO | 0.00% | 0.00% | 198.80% | 317.88% | 198.80% | 198.80% |
| SKP | 0.00% | 0.00% | 775.10% | 1048.06% | 775.10% | 775.10% |
| MLA | 0.00% | 0.00% | 592.20% | 668.21% | 592.20% | 592.20% |
| KIV | −6.25% | 0.00% | 2554.64% | 4062.79% | 2554.64% | 2554.64% |
| TGD | −15.88% | 0.00% | 1602.80% | 3870.43% | 2019.40% | 1602.80% |
| TIV | 0.00% | 0.00% | 1775.15% | 3092.53% | 2914.43% | 1743.50% |
| AMS | 0.00% | 0.00% | 120.13% | 159.61% | 120.13% | 123.74% |
| EIN | 0.00% | 0.00% | 948.86% | 444.00% | 420.06% | 420.06% |
| OSL | 0.00% | 0.00% | 124.83% | 170.38% | 89.15% | 89.15% |
| SVG | −1.09% | 0.00% | 635.36% | 1127.04% | 635.36% | 635.36% |
| TRD | 0.00% | 0.00% | 406.61% | 654.59% | 261.94% | 261.94% |
| KRK | 0.00% | 0.00% | 397.30% | 397.30% | 397.30% | 867.90% |
| KTW | 0.00% | −2.60% | 274.91% | 622.47% | 274.91% | 471.84% |
| POZ | 0.00% | 0.00% | 537.54% | 798.59% | 537.54% | 537.54% |
| WAW | −1.83% | 0.00% | 169.97% | 249.52% | 1079.39% | 169.97% |
| WRO | 0.00% | 0.00% | 259.53% | 405.73% | 259.53% | 284.47% |
| LIS | 0.00% | 0.00% | 165.33% | 133.40% | 105.42% | 105.42% |
| OPO | 0.00% | −3.53% | 194.39% | 208.20% | 127.49% | 127.49% |
| BBU | 0.00% | 0.00% | 12.48% | 100.65% | 12.48% | 61.47% |
| BCM | −12.68% | 0.00% | 2115.48% | 5745.10% | 2115.48% | 7088.30% |
| CLJ | −11.87% | 0.00% | 396.40% | 512.62% | 396.40% | 396.40% |
| CND | 0.00% | −13.32% | 2567.77% | 26455.29% | 2567.77% | 3025.69% |
| OMR | 0.00% | 0.00% | 1044.66% | 18.71% | 10,883.45% | 29,159.77% |
| SUJ | 0.00% | 0.00% | 18,152.03% | 36,729.50% | 18,152.03% | 18,152.03% |
| LED | 0.00% | −1.24% | 294.38% | 321.93% | 168.29% | 168.29% |
| SVO | 0.00% | 0.00% | 270.73% | 147.38% | 147.97% | 315.83% |
| TOF | −26.70% | 0.00% | 3868.24% | 4931.13% | 5668.19% | 3868.24% |
| VKO | 0.00% | 0.00% | 672.39% | 472.24% | 157.02% | 157.02% |
| BTS | 0.00% | 0.00% | 2751.54% | 2885.77% | 1731.66% | 1731.66% |
| BCN | 0.00% | −2.25% | 20.70% | 114.47% | 20.70% | 138.61% |
| MAD | 0.00% | −8.67% | 186.20% | 163.29% | 115.49% | 115.49% |
| VLC | 0.00% | 0.00% | 118.73% | 318.28% | 118.73% | 170.46% |
| ARN | −26.82% | 0.00% | 236.91% | 307.88% | 441.13% | 1840.16% |
| JKG | 0.00% | 0.00% | 0.00% | 0.00% | 0.00% | 0.00% |
| BSL | 0.00% | 0.00% | 160.30% | 305.71% | 160.30% | 163.33% |
| GVA | −0.22% | 0.00% | 33.87% | 89.72% | 33.87% | 33.87% |
| ZRH | 0.00% | 0.00% | 158.24% | 235.74% | 138.02% | 138.02% |
| ADB | 0.00% | 0.00% | 468.83% | 435.28% | 394.02% | 394.02% |
| ESB | 0.00% | −16.46% | 138.85% | 319.07% | 138.85% | 339.94% |
| SAW | 0.00% | 0.00% | 0.02% | 0.00% | 0.00% | 0.00% |
| IEV | −18.50% | 0.00% | 594.94% | 825.47% | 1275.74% | 594.94% |
| KBP | 0.00% | 0.00% | 1102.75% | 531.78% | 959.32% | 534.16% |
| LGW | 0.00% | 0.00% | 31.45% | 38.92% | 31.45% | 31.45% |
| LHR | 0.00% | 0.00% | 0.00% | 0.00% | 0.00% | 0.00% |
| MAN | 0.00% | 0.00% | 66.83% | 87.77% | 66.83% | 66.83% |
Table A3.
Projections of the percentage variations of input and output with service quality.
Table A3.
Projections of the percentage variations of input and output with service quality.
| DMU | Score | Air Connectivity | No. Passenger Movements | Movem/Day Low-Cost | Movem/Day Traditional |
|---|---|---|---|---|---|
| DUB | 1 | 0.00% | 0.00% | 0.00% | 0.00% |
| LYN | 1 | 0.00% | 0.00% | 0.00% | 0.00% |
| MUC | 1 | 0.00% | 0.00% | 0.00% | 0.00% |
| STR | 1 | 0.00% | 0.00% | 0.00% | 0.00% |
| CIA | 1 | 0.00% | 0.00% | 0.00% | 0.00% |
| BBU | 1 | 0.00% | 0.00% | 0.00% | 0.00% |
| OMR | 1 | 0.00% | 0.00% | 0.00% | 0.00% |
| BCN | 1 | 0.00% | 0.00% | 0.00% | 0.00% |
| LGW | 1 | 0.00% | 0.00% | 0.00% | 0.00% |
| BGY | 0.940 | 157.18% | 6.33% | 6.33% | 256.07% |
| CDG | 0.863 | 15.85% | 15.85% | 227.84% | 27.54% |
| BRE | 0.846 | 18.24% | 1067.40% | 339.11% | 400.04% |
| NAP | 0.841 | 18.93% | 19.08% | 18.93% | 84.39% |
| FRA | 0.811 | 23.36% | 23.36% | 23.36% | 44.73% |
| GVA | 0.792 | 26.33% | 65.55% | 26.33% | 26.33% |
| TXL | 0.789 | 26.79% | 1850.39% | 671.75% | 2702.00% |
| MAN | 0.756 | 32.30% | 32.30% | 32.30% | 53.75% |
| VIE | 0.740 | 35.15% | 53.58% | 35.15% | 47.82% |
| LIS | 0.736 | 35.90% | 35.90% | 79.88% | 35.90% |
| OSL | 0.680 | 47.07% | 57.35% | 47.07% | 47.07% |
| SVO | 0.661 | 111.81% | 51.28% | 91.82% | 237.29% |
| LIN | 0.645 | 80.21% | 86.12% | 393.75% | 55.06% |
| CPH | 0.635 | 57.40% | 63.59% | 57.40% | 57.40% |
| ZRH | 0.631 | 58.52% | 75.77% | 73.87% | 89.66% |
| MAD | 0.626 | 69.00% | 59.68% | 59.68% | 82.82% |
| ATH | 0.611 | 63.65% | 63.65% | 63.65% | 63.65% |
| AMS | 0.602 | 66.09% | 66.09% | 66.09% | 81.91% |
| NTE | 0.601 | 66.50% | 1650.42% | 66.50% | 106.97% |
| MXP | 0.580 | 72.41% | 76.27% | 72.41% | 100.25% |
| OPO | 0.569 | 80.18% | 75.74% | 75.74% | 75.74% |
| BLQ | 0.564 | 222.96% | 107.39% | 77.43% | 77.43% |
| ARN | 0.559 | 78.97% | 120.85% | 827.34% | 1561.45% |
| WAW | 0.557 | 79.53% | 79.53% | 1055.59% | 88.10% |
| VLC | 0.552 | 81.06% | 96.87% | 81.06% | 81.06% |
| HAM | 0.538 | 85.92% | 129.81% | 85.92% | 492.68% |
| FCO | 0.536 | 86.73% | 86.73% | 86.73% | 117.18% |
| CRL | 0.535 | 460.57% | 132.47% | 86.77% | 86.77% |
| PRG | 0.527 | 89.64% | 115.70% | 89.64% | 93.40% |
| ESB | 0.517 | 93.42% | 93.42% | 93.42% | 141.01% |
| VKO | 0.499 | 362.64% | 254.53% | 100.54% | 100.54% |
| BRU | 0.491 | 103.61% | 438.71% | 206.65% | 121.15% |
| CGN | 0.484 | 170.57% | 152.79% | 106.48% | 106.48% |
| LED | 0.458 | 119.10% | 152.31% | 118.27% | 118.27% |
| BUD | 0.438 | 128.35% | 128.35% | 128.35% | 136.86% |
| SOF | 0.437 | 129.05% | 144.72% | 129.05% | 129.05% |
| ZAG | 0.436 | 129.16% | 461.51% | 706.17% | 284.64% |
| BSL | 0.428 | 133.88% | 211.44% | 133.88% | 154.03% |
| HEL | 0.401 | 149.07% | 149.07% | 1485.88% | 180.38% |
| VNO | 0.377 | 165.16% | 238.76% | 165.16% | 165.16% |
| LCA | 0.374 | 167.36% | 167.36% | 167.36% | 167.36% |
| TRD | 0.363 | 229.39% | 331.85% | 175.39% | 175.39% |
| CAG | 0.355 | 225.59% | 199.88% | 181.69% | 181.69% |
| TRN | 0.353 | 183.34% | 331.20% | 183.34% | 231.77% |
| MRS | 0.348 | 933.39% | 252.31% | 187.10% | 187.10% |
| KTW | 0.324 | 209.01% | 209.01% | 209.01% | 217.97% |
| TLL | 0.304 | 229.02% | 567.62% | 301.08% | 282.16% |
| WRO | 0.294 | 246.19% | 313.34% | 240.03% | 240.03% |
| ADB | 0.291 | 300.80% | 243.90% | 243.90% | 292.08% |
| HER | 0.285 | 339.69% | 250.70% | 2760.16% | 250.70% |
| KEF | 0.283 | 253.37% | 253.37% | 253.37% | 254.39% |
| FMO | 0.277 | 437.99% | 1102.49% | 544.90% | 260.66% |
| EIN | 0.275 | 573.57% | 263.80% | 325.02% | 263.80% |
| KBP | 0.273 | 468.01% | 266.94% | 1304.07% | 386.47% |
| HAJ | 0.240 | 329.41% | 583.67% | 317.31% | 317.31% |
| CLJ | 0.231 | 606.99% | 367.66% | 332.83% | 332.83% |
| SXF | 0.228 | 338.91% | 2403.47% | 338.91% | 16577.50% |
| VRN | 0.223 | 348.56% | 404.87% | 348.56% | 348.56% |
| KRK | 0.221 | 351.51% | 361.62% | 351.51% | 960.02% |
| IEV | 0.213 | 369.48% | 369.48% | 1349.99% | 435.41% |
| MLA | 0.199 | 401.33% | 403.54% | 401.33% | 577.49% |
| POZ | 0.185 | 440.44% | 536.15% | 440.44% | 440.44% |
| BOD | 0.184 | 729.77% | 510.04% | 444.77% | 444.77% |
| SZG | 0.182 | 449.94% | 752.55% | 449.94% | 673.76% |
| BRQ | 0.181 | 5504.98% | 3821.63% | 451.38% | 451.38% |
| PMO | 0.178 | 462.82% | 462.82% | 462.82% | 462.82% |
| SVG | 0.170 | 488.87% | 664.08% | 488.87% | 520.11% |
| BOJ | 0.153 | 1034.52% | 551.73% | 927.86% | 551.73% |
| LGG | 0.148 | 21,951.86% | 14,443.14% | 577.14% | 577.14% |
| PRN | 0.148 | 573.99% | 573.99% | 964.49% | 1872.30% |
| SKP | 0.135 | 639.83% | 639.83% | 639.83% | 639.83% |
| SJJ | 0.133 | 652.87% | 1346.82% | 652.87% | 1127.03% |
| VAR | 0.131 | 876.42% | 665.25% | 698.47% | 665.25% |
| PFO | 0.130 | 778.47% | 669.35% | 669.35% | 734.17% |
| TBS | 0.126 | 696.47% | 1901.59% | 939.62% | 1548.99% |
| BIA | 0.122 | 1099.23% | 1076.13% | 722.53% | 722.53% |
| TRS | 0.118 | 748.44% | 2098.54% | 748.44% | 748.44% |
| TGD | 0.092 | 988.95% | 1937.29% | 2048.87% | 1238.22% |
| BIQ | 0.090 | 1017.09% | 1073.18% | 1017.09% | 1017.09% |
| PUF | 0.079 | 1173.00% | 2233.33% | 3520.55% | 1266.05% |
| MPL | 0.078 | 8021.40% | 1190.07% | 1382.59% | 1190.07% |
| TIV | 0.075 | 1334.65% | 1469.80% | 2039.93% | 1232.37% |
| BTS | 0.074 | 2129.96% | 1851.39% | 1257.60% | 1257.60% |
| KIV | 0.062 | 1505.10% | 2311.29% | 1840.85% | 2341.60% |
| BCM | 0.057 | 1722.36% | 1729.54% | 1668.25% | 1668.25% |
| TPS | 0.051 | 3849.39% | 2950.41% | 1879.27% | 1879.27% |
| CND | 0.049 | 4256.26% | 9893.10% | 1942.22% | 1942.22% |
| TOF | 0.044 | 2182.40% | 2560.48% | 8158.92% | 3216.09% |
| LRH | 0.032 | 5829.08% | 5764.77% | 3002.23% | 3002.23% |
| SUJ | 0.008 | 22,939.11% | 23,353.85% | 13,085.53% | 13,085.53% |
References
- European Commission. Transport in the European Union, Current Trends and Issues, Pages 11. 2018. Available online: https://ec.europa.eu/transport/sites/transport/files/2018 (accessed on 15 May 2020).
- Bowen, J.; Rodrigue, J.P. Air Transport. 2017. Available online: https://transportgeography.org/?page_id=1765 (accessed on 15 May 2020).
- ICAO-International Civil Aviation Organization. Aviation Benefits Report. 2019. Available online: https://www.icao.int (accessed on 15 May 2020).
- IATA-International Air Transport Association. World Air Transport Statistics. 2019. Available online: https://www.iata.org (accessed on 15 May 2020).
- Martin, J.C.; Roman, C. An Application of DEA to Measure the Efficiency of Spanish Airports prior to Privatization. J. Air Transp. Manag. 2001, 7, 149–157. [Google Scholar] [CrossRef]
- Bourne, M.; Melnyk, S.A.; Bititci, U.; Platts, K.; Andersen, B. Emerging issues in performance measurement. Manag. Account. Res. 2014, 25, 117–118. [Google Scholar] [CrossRef]
- Choong, K.K. Understanding the features of performance measurement system: A literature review. Meas. Bus. Excell. 2013, 17, 102–121. [Google Scholar] [CrossRef]
- Franco-Santos, M.; Lucianetti, L.; Bourne, M. Contemporary performance measurement systems: A review of their consequences and a framework for research. Manag. Account. Res. 2012, 23, 79–119. [Google Scholar] [CrossRef] [Green Version]
- Lampe, H.W.; Hilgers, D. Trajectories of efficiency measurement: A bibliometric analysis of DEA and SFA. Eur. J. Oper. Res. 2015, 240, 1–21. [Google Scholar] [CrossRef]
- Bezerra, G.C.; Gomes, C.F. Performance measurement in airport settings: A systematic literature review. Benchmarking Int. J. 2016, 23, 1027–1050. [Google Scholar] [CrossRef]
- Pacagnella Junior, A.C.; Hollaender, P.S.; Mazzanati, G.V.; Bortolotto, W.W. Efficiency drivers of international airports: A worldwide benchmarking study. J. Air Transp. Manag. 2021, 90. [Google Scholar] [CrossRef]
- Baltazar, M.E.; Rosa, T.; Silva, J. Global decision support for airport performance and efficiency assessment. J. Air Transp. Manag. 2018, 71, 220–242. [Google Scholar] [CrossRef] [Green Version]
- Adler, N.; Liebert, V. Joint impact of competition, ownership form and economic regulation on airport performance and pricing. Transp. Res. Part A Policy Pract. 2014, 64, 92–109. [Google Scholar] [CrossRef]
- Gillen, D. The evolution of airport ownership and governance. J. Air Transp. Manag. 2011, 17, 3–13. [Google Scholar] [CrossRef]
- Fernandes, E.; Pacheco, R.R. Airport management: A strategic approach. Transportation 2007, 34, 129–142. [Google Scholar] [CrossRef]
- Skouloudis, A.; Evangelinos, K.; Moraitis, S. Accountability and stakeholder engagement in the airport industry: An assessment of airports’ CSR reports. J. Air Transp. Manag. 2012, 18, 16–20. [Google Scholar] [CrossRef]
- Suárez-Alemán, A.; Jiménez, J.L. Quality assessment of airport performance from the passengers’ perspective. Res. Transp. Bus. Manag. 2016, 20, 13–19. [Google Scholar] [CrossRef]
- Fernandes, E.; Pacheco, R.R. Efficient use of airport capacity. Transp. Res. Part A Policy Pract. 2002, 36, 225–238. [Google Scholar] [CrossRef]
- Štichhauerová, E.; Pelloneova, N. An efficiency assessment of selected german airports using the DEA model. J. Compet. 2019, 11, 135–151. [Google Scholar]
- Danesi, A.; Lupi, M. An application of Data Envelopment Analysis (DEA) to evaluate technical and scale efficiency of Italian airports. In Methods and Models for Planning the Development of Regional Airports Systems; Marino, L., Ed.; FrancoAngeli: Milan, Italy, 2008; pp. 86–97. [Google Scholar]
- Gitto, S.; Mancuso, P. Bootstrapping the Malmquist indexes for Italian airports. Int. J. Prod. Econ. 2012, 135, 403–411. [Google Scholar] [CrossRef]
- Cavusoglu, S.S.; Macário, R. Minimum delay or maximum efficiency? Rising productivity of available capacity at airports: Review of current practice and future needs. J. Air Transp. Manag. 2021, 90, 101947. [Google Scholar] [CrossRef]
- Oum, T.H.; Yu, C. Measuring airports’ operating efficiency: A summary of the 2003 ATRS global airport benchmarking report. Transp. Res. Part E Logist. Transp. Rev. 2004, 40, 515–532. [Google Scholar] [CrossRef]
- Barros, C.P.; Dieke, P.U.C. Measuring the economic efficiency of airports: A Simar Wilson. Transp. Res. Part E Logist. Transp. Rev. 2008, 44, 1039–1051. [Google Scholar] [CrossRef]
- Martín, J.C.; Román, C.; Voltes-Dorta, A. A stochastic frontier analysis to estimate the relative efficiency of Spanish airports. J. Prod. Anal. 2009, 31, 163–176. [Google Scholar] [CrossRef]
- Castelli, L.; Pellegrini, P.; Pesenti, R. Airport slot allocation in Europe: Economic efficiency and fairness. Int. J. Revenue Manag. 2012, 6, 28–44. [Google Scholar] [CrossRef]
- Lu, C.; Morrell, P. Determination and Applications of Environmental Costs at Different Sized Airports—Aircraft Noise and Engine Emissions. Transportation 2006, 33, 45–61. [Google Scholar] [CrossRef] [Green Version]
- Upham, P.; Thomas, C.; Gillingwater, D.; Raper, D. Environmental capacity and airport operations: Current issues and future prospects. J. Air Transport. Manag. 2003, 9, 145–151. [Google Scholar] [CrossRef]
- Gillen, D.; Lall, A. Developing measures of airport productivity and performance: An application of data envelopment analysis. Transp. Res. Part E Logist. Transp. Rev. 1997, 33, 261–273. [Google Scholar] [CrossRef]
- Pels, E.; Nijkamp, P.; Rietveld, P. Relative Efficiency of European Airports. Transp. Policy 2001, 8, 183–192. [Google Scholar] [CrossRef]
- Lu, W.; Park, S.H.; Huang, T.; Yeo, G.T. An analysis for Chinese airport efficiency using weighted variables and adopting CFPR. Asian J. Shipp. Logist. 2019, 35, 230–242. [Google Scholar] [CrossRef]
- Cullinane, K.; Wang, T.F.; Song, D.W.; Ji, P. The technical efficiency of container ports: Comparing data envelopment analysis and stochastic frontier analysis. Transp. Res. Part A Policy Pract. 2006, 40, 354–374. [Google Scholar] [CrossRef]
- Scotti, D.; Malighetti, P.; Martini, G.; Volta, N. The impact of airport competition on technical efficiency: A stochastic frontier analysis applied to Italian airport. J. Air Transp. Manag. 2012, 22, 9–15. [Google Scholar] [CrossRef] [Green Version]
- Cooper, W.W.; Seiford, L.M.; Tone, K.; Zhu, J. Some models and measures for evaluating performances with DEA: Past accomplishments and future prospects. J. Prod. Anal. 2007, 28, 151–163. [Google Scholar] [CrossRef]
- Sameni, M.K.; Preston, J.; Sameni, M.K. Evaluating efficiency of passenger railway stations: A DEA approach. Res. Transp. Bus. Manag. 2016, 20, 33–38. [Google Scholar] [CrossRef]
- Cooper, W.W.; Seiford, L.M.; Zhu, J. Data envelopment analysis: History, models, and interpretations. In Handbook on Data Envelopment Analysis; Springer: Boston, MA, USA, 2011; pp. 1–39. [Google Scholar]
- Sarkis, J.; Talluri, S. Performance based clustering for benchmarking of US airports. Transp. Res. Part A Policy Pract. 2004, 38, 329–346. [Google Scholar] [CrossRef]
- Diana, T. Do market-concentrated airports propagate more delays than less concentrated ones? A case study of selected U.S. airports. J. Air Transp. Manag. 2009, 15, 280–286. [Google Scholar] [CrossRef]
- Pels, E.; Nijkamp, P.; Rietveld, P. Inefficiencies and scale economies of European airport operations. Transp. Res. Part E Logist. Transp. Rev. 2003, 39, 341–361. [Google Scholar] [CrossRef]
- Adler, N.; Ülkü, T.; Yazhemsky, E. Small regional airport sustainability: Lessons from benchmarking. J. Air Transp. Manag. 2013, 33, 22–31. [Google Scholar] [CrossRef]
- Fragoudaki, A.; Giokas, D. Airport performance in a tourism receiving country: Evidence from Greece. J. Air Transp. Manag. 2016, 52, 80–89. [Google Scholar] [CrossRef]
- Gok, U.; Ugural, S. Assessment of Turkish airports’ efficiency using data envelopment analysis. Актуальні Прoблеми Екoнoміки 2014, 2, 470–478. [Google Scholar]
- Liu, D. Measuring aeronautical service efficiency and commercial service efficiency of East Asia airport companies: An application of Network Data Envelopment Analysis. J. Air Transp. Manag. 2016, 52, 11–22. [Google Scholar] [CrossRef]
- Pabedinskaitė, A.; Akstinaitė, V. Evaluation of the Airport Service Quality. Procedia Soc. Behav. Sci. 2014, 110, 398–409. [Google Scholar] [CrossRef] [Green Version]
- Fodness, D.; Murray, B. Passengers’ expectations of airport service quality. J. Serv. Mark. 2007, 21, 492–506. [Google Scholar] [CrossRef]
- Thampan, A.; Sinha, K.; Gurjar, B.R.; Rajasekar, E. Functional efficiency in airport terminals: A review on Overall and Stratified Service Quality. J. Air Transp. Manag. 2020, 87, 101837. [Google Scholar] [CrossRef]
- Bandeira, M.C.G.; Correia, A.R. Analysis of the Degree of Importance of the Airport Passenger Terminal Components in Sao Paulo/Guarulhos International Airport; Technological Institute of Aeronautics (ITA): São Paulo, Brazil, 2008. [Google Scholar]
- Eshtaiwi, M.; Badi, I.; Abdulshahed, A.; Erkan, T.E. Determination of key performance indicators for measuring airport success: A case study in Libya. J. Air Transp. Manag. 2018, 68, 28–34. [Google Scholar] [CrossRef]
- Chao, C.C.; Lin, H.C.; Chen, C.Y. Enhancing airport service quality: A case study of Kaohsiung International Airport. J. East. Asia Soc. Transp. Stud. 2013, 10, 2235–2254. [Google Scholar]
- Mikulić, J.; Krešić, D.; Miličević, K. Key-Driver Analysis with Extended Back-Propagation Neural Network Based Importance-Performance Analysis (BPNN-IPA). In Intelligent Decision Making in Quality Management; Springer: Cham, Switzerland, 2016; pp. 447–461. [Google Scholar]
- Tsai, W.H.; Hsu, W.; Chou, W.C. A gap analysis model for improving airport service quality. Total Qual. Manag. Bus. Excell. 2011, 22, 1025–1040. [Google Scholar] [CrossRef]
- Prakash, C.; Barua, M.K. A robust multi-criteria decision-making framework for evaluation of the airport service quality enablers for ranking the airports. J. Qual. Assur. Hosp. Tour. 2016, 17, 351–370. [Google Scholar]
- Parasuraman, A.; Zeithaml, V.A.; Berry, L. SERVQUAL: A multiple-item scale for measuring consumer perceptions of service quality. Journal of retailing 1988, 64, 12–40. [Google Scholar]
- Charnes, A.; Cooper, W.W.; Rhodes, E. Measuring the Efficiency of Decision Making Units. Eur. J. Oper. Res. 1978, 2, 429–444. [Google Scholar] [CrossRef]
- ACI-Airport Council International. Airport Industry Connectivity Report. 2018. Available online: http://www.seo.nl/uploads/media/2018Airport_Industry_Conductivity_Report_2018_01.pdf (accessed on 15 May 2020).
- EUROCONTROL-European Organisation for the Safety of Air Navigation. European Airports. Available online: https://www.ead.eurocontrol.int/publicuser/protect/pu/main.jsp (accessed on 15 May 2020).
- AIP-Aeronautical Information Publication. EAD Basic. Available online: https://www.ead.eurocontrol.int/cms-eadbasic/opencms/en/login/ead-basic/ (accessed on 15 May 2020).
- CEPS-Centre for European Policy Studies. Low-Cost Airlines Bringing the EU Closer Together. 2018. Available online: https://www.ceps.eu/wp-content/uploads/2018 (accessed on 15 May 2020).
- EUROSTAT-European Statistical Office. Air Traffic Report. 2018. Available online: https://ec.europa.eu/eurostat/statistics-explained (accessed on 15 May 2020).
- Casu, B.; Molyneux, P. A comparative study of efficiency in European banking. Appl. Econ. 2003, 35, 1865–1876. [Google Scholar] [CrossRef] [Green Version]
- Staub, R.B.; e Souza, G.D.S.; Tabak, B.M. Evolution of bank efficiency in Brazil: A DEA approach. Eur. J. Oper. Res. 2010, 202, 204–213. [Google Scholar] [CrossRef]
- Xiaogang, C.; Skully, M.; Brown, K. Banking efficiency in China: Application of DEA to pre- and post-deregulation eras: 1993–2000. China Econ. Rev. 2005, 16, 229–245. [Google Scholar]
- Eskelinen, J. Comparison of variable selection techniques for data envelopment analysis in a retail bank. Eur. J. Oper. Res. 2017, 259, 778–788. [Google Scholar] [CrossRef] [Green Version]
- Hofmarcher, M.M.; Paterson, I.; Riedel, M. Measuring Hospital Efficiency in Austria—A DEA Approach. Health Care Manag. Sci. 2002, 5, 7–14. [Google Scholar] [CrossRef] [PubMed]
- Biørn, E.; Hagen, T.P.; Iversen, T.; Magnussen, J. The Effect of Activity-Based Financing on Hospital Efficiency: A Panel Data Analysis of DEA Efficiency Scores 1992–2000. Health Care Manag. Sci. 2003, 6, 271–283. [Google Scholar] [CrossRef] [PubMed]
- Kacak, H.; Ozcan, Y.A.; Kavuncubasi, S. A new examination of hospital performance after healthcare reform in Turkey: Sensitivity and quality comparisons. Int. J. Public Policy 2014, 10, 178–194. [Google Scholar] [CrossRef]
- Ahn, T.; Seiford, L.M. Sensitivity of DEA to Models and Variable Sets in a Hypothesis Test Setting: The Efficiency of University Operations; Quorum Books: New York, NY, USA, 1993. [Google Scholar]
- Anderson, T.R.; Daim, T.U.; Lavoie, F.F. Measuring the efficiency of university technology transfer. Technovation 2007, 27, 306–318. [Google Scholar] [CrossRef]
- Kounetas, K.; Anastasiou, A.; Mitropoulos, P.; Mitropoulos, I. Departmental efficiency differences within a Greek university: An application of a DEA and Tobit analysis. Int. Trans. Oper. Res. 2011, 18, 545–559. [Google Scholar] [CrossRef]
- Curi, C.; Gitto, S.; Mancuso, P. The Italian airport industry in transition: A performance analysis. J. Air Transp. Manag. 2010, 16, 218–221. [Google Scholar] [CrossRef]
- Banker, R.D.; Charnes, A.; Cooper, W.W. Some Models for Estimating Technical and Scale Inefficiencies in Data Envelopment Analysis. Manag. Sci. 1984, 30, 1078–1092. [Google Scholar] [CrossRef] [Green Version]
- Doyle, J.; Green, R. Efficiency and cross-efficiency in DEA: Derivations, meanings and uses. J. Oper. Res. Soc. 1994, 45, 567–578. [Google Scholar] [CrossRef]
- Zhu, J. Quantitative Models for Performance Evaluation and Benchmarking. Data Envelopment Analysis with Spreadsheets; Springer International Publishing: New York, NY, USA, 2014. [Google Scholar]
- Lai, P.L.; Potter, A.; Beynon, M.; Beresford, A. Transport Policy, Evaluating the efficiency performance of airports using an integrated AHP/DEA-AR technique. Transp. Policy 2015, 42, 75–85. [Google Scholar] [CrossRef]
- Yu, M.-M. Assessment of Airport Performance Using the SBM-NDEA Model. Omega 2010, 38, 440–452. [Google Scholar] [CrossRef]
- Malighetti, P.; Martini, G.; Paleari, S.; Redondi, R. An empirical investigation on the efficiency, capacity and ownership of Italian airports. Riv. di Politica Econ. 2007, 3, 16. [Google Scholar]
- Curi, C.; Gitto, S.; Mancuso, P. Socio-Economic Planning Sciences, New evidence on the efficiency of Italian airports: A bootstrapped DEA analysis. Socio-Econ. Plan. Sci. 2011, 45, 84–93. [Google Scholar] [CrossRef]
- Barros, C.P.; Dieke, P.U. Performance evaluation of Italian airports: A data envelopment analysis. J. Air Transp. Manag. 2007, 13, 184–191. [Google Scholar] [CrossRef]
- ACI-Airport Council International. World Airport Service Quality Awards Releases. 2019. Available online: https://aci.aero/news/2019/03/06/worlds-top-airports-for-customer-experience-revealed/ (accessed on 15 May 2020).
Publisher’s Note: MDPI stays neutral with regard to jurisdictional claims in published maps and institutional affiliations. |
© 2021 by the authors. Licensee MDPI, Basel, Switzerland. This article is an open access article distributed under the terms and conditions of the Creative Commons Attribution (CC BY) license (https://creativecommons.org/licenses/by/4.0/).