1. Introduction
Daily traffic accidents increase annually, causing a significant number of death and disability cases. According to the World Health Organization (WHO), 1.35 million death cases occur worldwide every year, representing 2.2% of the total number of deaths [
1]. The main reasons of traffic accidents are speeding, reckless driving, driver fatigue, the presence of loose animals on roads, and poor infrastructure. Most fatalities and disabilities in these accidents occur because of the late response from emergency medical assistance. The time after the traumatic injury is called golden hour, where providing essential medical and surgical aid at that time increases the probability of saving human lives by one-third on average [
2]. Thus, significant efforts have been allocated in the recent past with the goal of providing efficient and prompt rescue operations. The Internet of Things (IoT) is one of the tools that has been utilized to achieve this goal.
The IoT was presented back in automobile industries to provide different information and entertainment applications with the aim of providing a comfortable driving experience and luxury journey. Recently, the IoT has been employed to increase the safety of drivers and passengers. Several research works have presented IoT systems to detect, localize, report, model, and analyze road accidents [
3,
4,
5,
6,
7]. The main drawbacks of the existing accident detection systems are the high cost and limitation to high-end vehicles only. Most of these systems depend on a smartphone, and if it is ejected outside the vehicle, the system may fail and affect the results. In addition, some of the systems require a certain placement of the smartphone, meaning the driver cannot keep his smartphone in any other place such as their pocket, bag, etc. Reporting the accident event only without any other essential information such as the type of accident, degree of severity, and driver’s medical information reduces the efficiency of rescue support and medical aid. Such information gives the medical emergency staff sight about the damages sustained by the vehicle and the extent of injuries sustained by the victims.
This paper presented an accident detection and classification system based on the IoT that can be used effectively with any vehicle. It generates an immediate response to accidents by contacting the necessary entities. The accident information is also reported including location, level of severity, speed of the car at the accident time, and the car crash sides. The main contributions of the paper are:
An efficient accident detection and classification system: the system reports accidents automatically with an essential information using an efficient IoT platform. A group of sensors is used in a vehicle to acquire an accident-related data. The data are processed in a micro-controller and classified based on severity level using a classification model. If an accident is detected, the microcontroller sends an emergency alert through a GSM transmitter. The system does not require a high-end vehicle or smartphone to be used.
A comparative study between different machine learning classifiers with the consideration of different vehicle movement parameters to obtain the most accurate model for accident severity level classification. Four classification models including Gaussian Mixture Model (GMM), Naive-Bayes Tree (NB), Decision Tree (DT), and Classification and Regression Trees (CART) were compared. The considered classification variables were speed, crash spot and severity, rotation and altitude, and flame and smoke levels.
A prototype of the proposed system. The prototype was developed and tested with a reasonable number of accident events.
The reset of the paper is organized as follows.
Section 2 discusses the related works and highlights the main difference between the proposed system and the existing systems.
Section 3 details the proposed system including the architecture and operation as well as the classifier models. In
Section 4, the implementation and the findings are discussed. Finally, the paper is concluded.
2. Related Works
Internet of Things (IoT) technology plays a significant role behind the current changes in the automobile business. Several research projects have employed an IoT medium to detect, localize, report, model, and analyze road accidents. Here, we discuss the most related works and highlight our system contribution. Different accident detection systems have been proposed in the literature.
A call notification system was proposed in [
8] that detects an accident and reports the location through cloud and SEEDUINO to the nearest hospital. The system consists of an XBee WiFi Module, XBee Shield, GPS Module, and Seeeduino. The main limitations of the system are low accuracy, since accident is detected using crash sensors only, that it requires a cloud computing server, and hospitals must be logged into the server twenty-four hours a day. Dashora, C. et al. proposed an accident detection system that uses an accelerometer to reads two simultaneous acceleration and sends the data to the cloud [
9]. The difference between two accelerations is calculated to detect the accident. If the car is at a high speed and get into an accident from the front side, then the difference will be positive. If the car gets into an accident from the back side, the speed of the car suddenly increases, and thus the difference will be negative and constitute a negative value. The person in the control room locates the accident from attached GPS reading and calls the nearest hospital to the accident location. Similarly, an IoT-based vehicle collision detection system was proposed in [
10]. A vibration sensor was added as an enhancement to the system to monitor the health of the driver and send an emergency SMS or voice call to the driver’s emergency contacts.
In addition, several solutions have been proposed that depend on a smartphone. Ali and Alwan [
11] proposed a system that consists of several cases to detect low-speed and high-speed car accidents. In case of high speed, if the smartphone’s acceleration is greater than four, then there is an accident which is identified by the smartphone’s application. However, it leads to triggering of false alarms in a few cases since mobiles are the subject. In [
12], a modern smartphone and a prefabricated sensor platform termed as Sensor drone was used to obtain the values of different physical parameters relevant to vehicle motion (i.e., speed, direction, rotation, and g-force, etc.). The Sensor drone remains attached to the smartphone via Bluetooth connection to send the data to the smartphone. Most of the processing machine is handled by the smartphone and only relevant details such as venue, name, nature of the accident, etc. are transmitted to the IoT server. The IoT server delivers emergency alerts to various emergency services such as EMS, the local police station and fire service, and other receivers such as relatives, insurers, blood donors, towing service, etc. after assessing the situation.
The solutions report the accident event only to different entities without reporting the accident type or severity level. The authors in [
13] proposed an accident detection system that determines causes and injuries. The system contains a heart-rate sensor embedded in the seat belt. Upon accident detection, the system reports the accident to emergency services through Wi-Fi. The limitation of the system is that seat belt must be worn to record heartbeats. An Accident Detection and Classification (ADC) system was proposed in [
14] to detect accidents and report their type using a fusion of the smartphone’s built-in and connected sensors. Three machine learning models were compared to determine the best ADC model. The models were tested with the consideration of five vehicle movement parameters (i.e., speed, absolute linear acceleration (ALA), change-in-altitude, pitch, and roll) which were used to obtain the accident class (i.e., collision, rollover, fall-off, or no-accident).
Table 1 summarizes the discussion of related works.
3. Proposed Accident Detection and Classification System
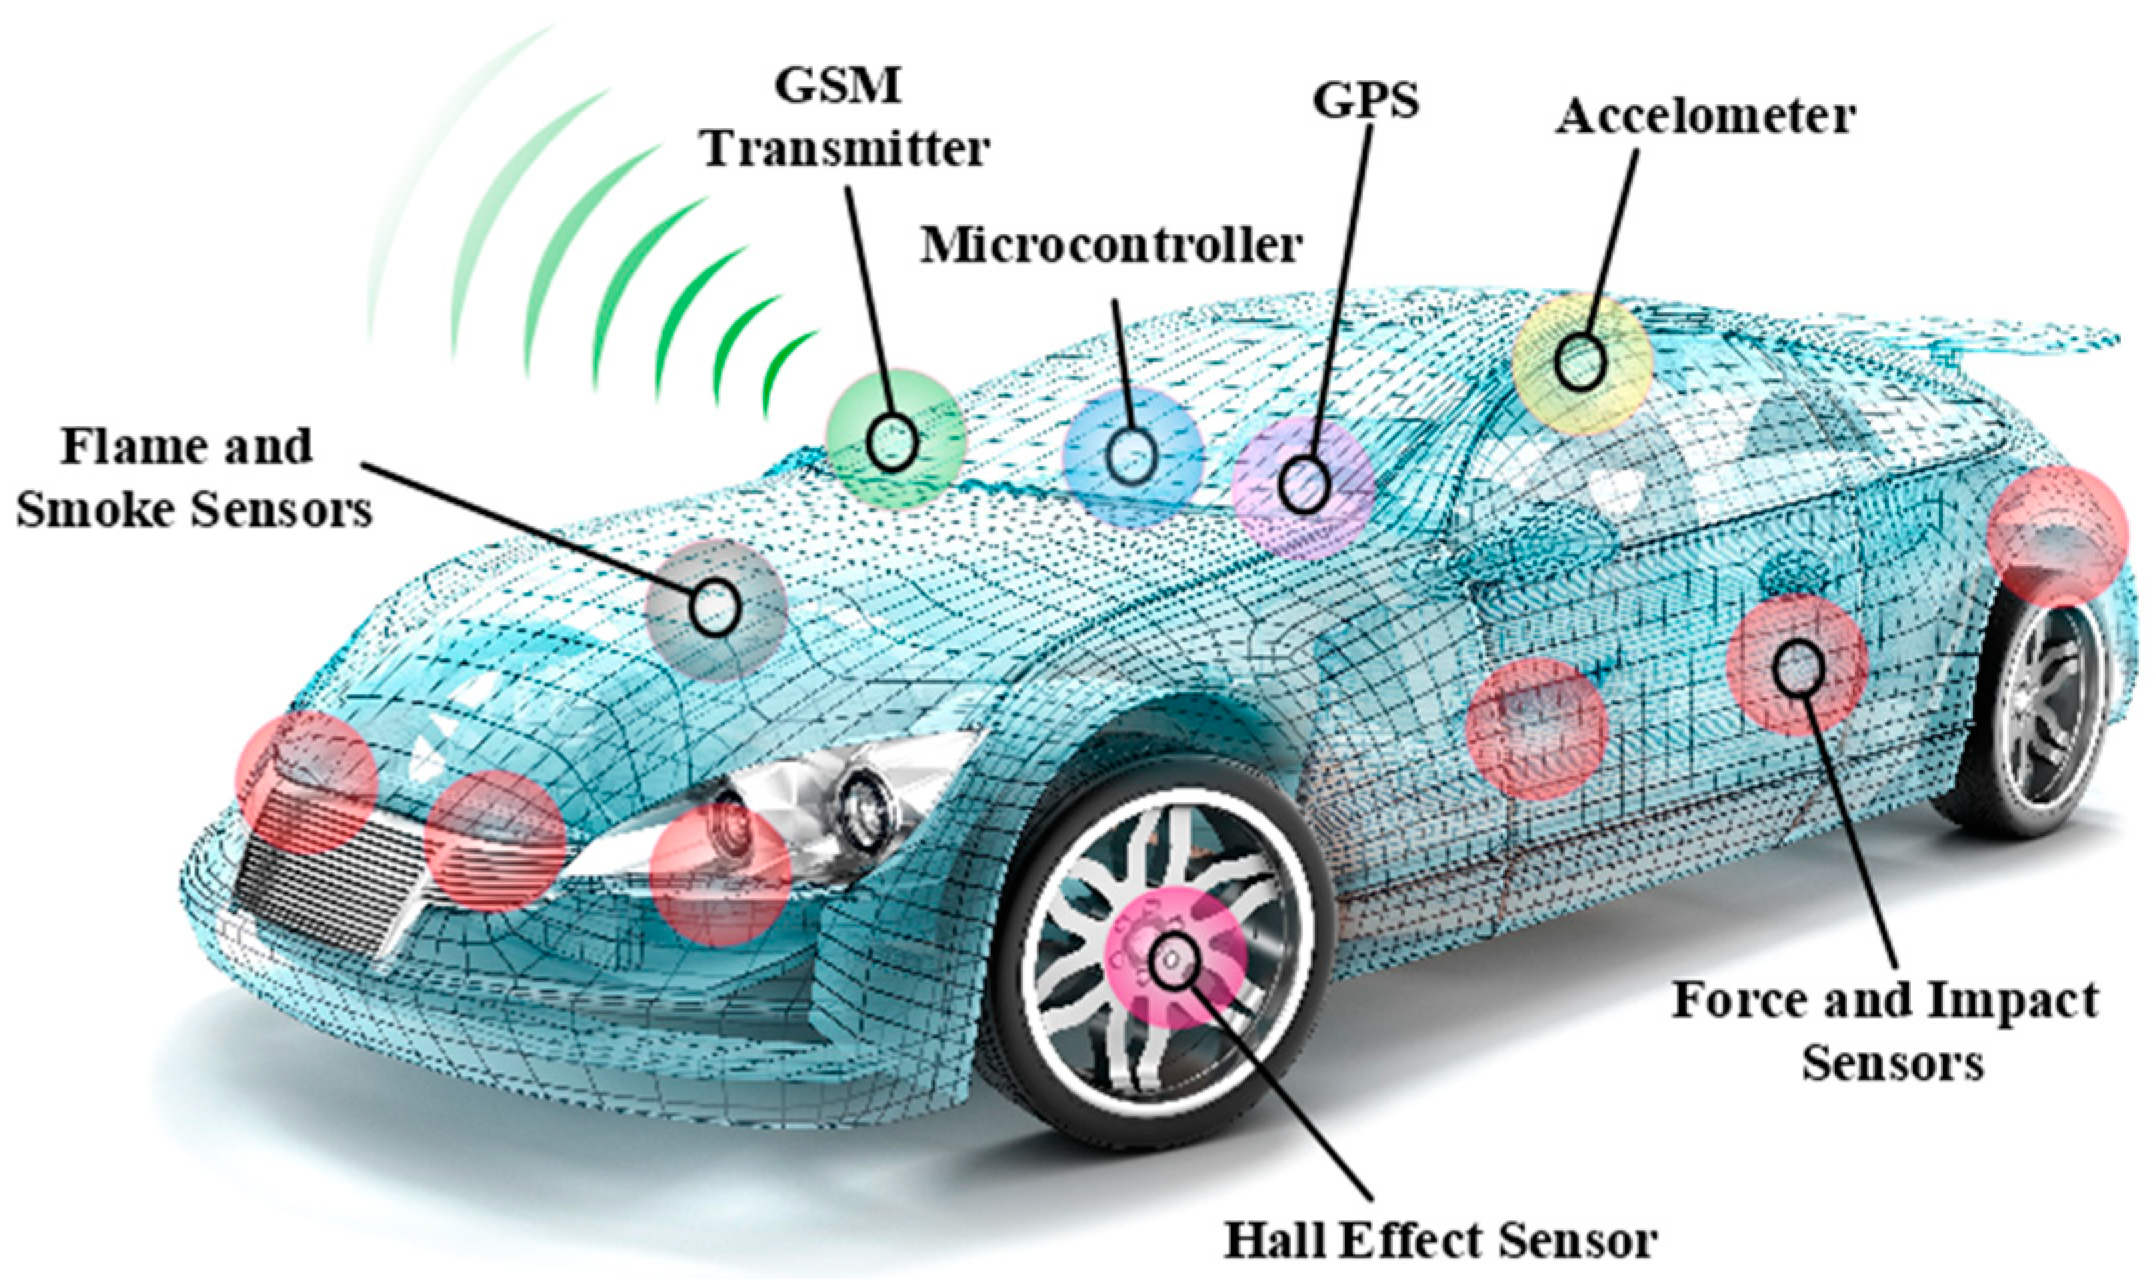
The proposed system detects and classifies accidents for an immediate response by sending emergency alerts to various emergency services providers. It consists of a microcontroller, GPS, and group of sensors to determine different physical parameters related to vehicle motion. The components have wireless connection capability to send the data to the microcontroller which processes the collected data. The next sub-sections detail system architecture and operation, parameter estimation methods, and classification models.
3.1. Architecture and Operation
The architecture of the accident detection and classification system is illustrated in
Figure 1. For data acquisition, the system utilizes a group of sensors including a Hall effect sensor, vibration sensor, accelerometer, flame and smoke sensors, and force and impact sensors. The collected data are sent to a microcontroller for processing and events classification. If an accident is detected, the microcontroller sends an emergency alert through a GSM transmitter.
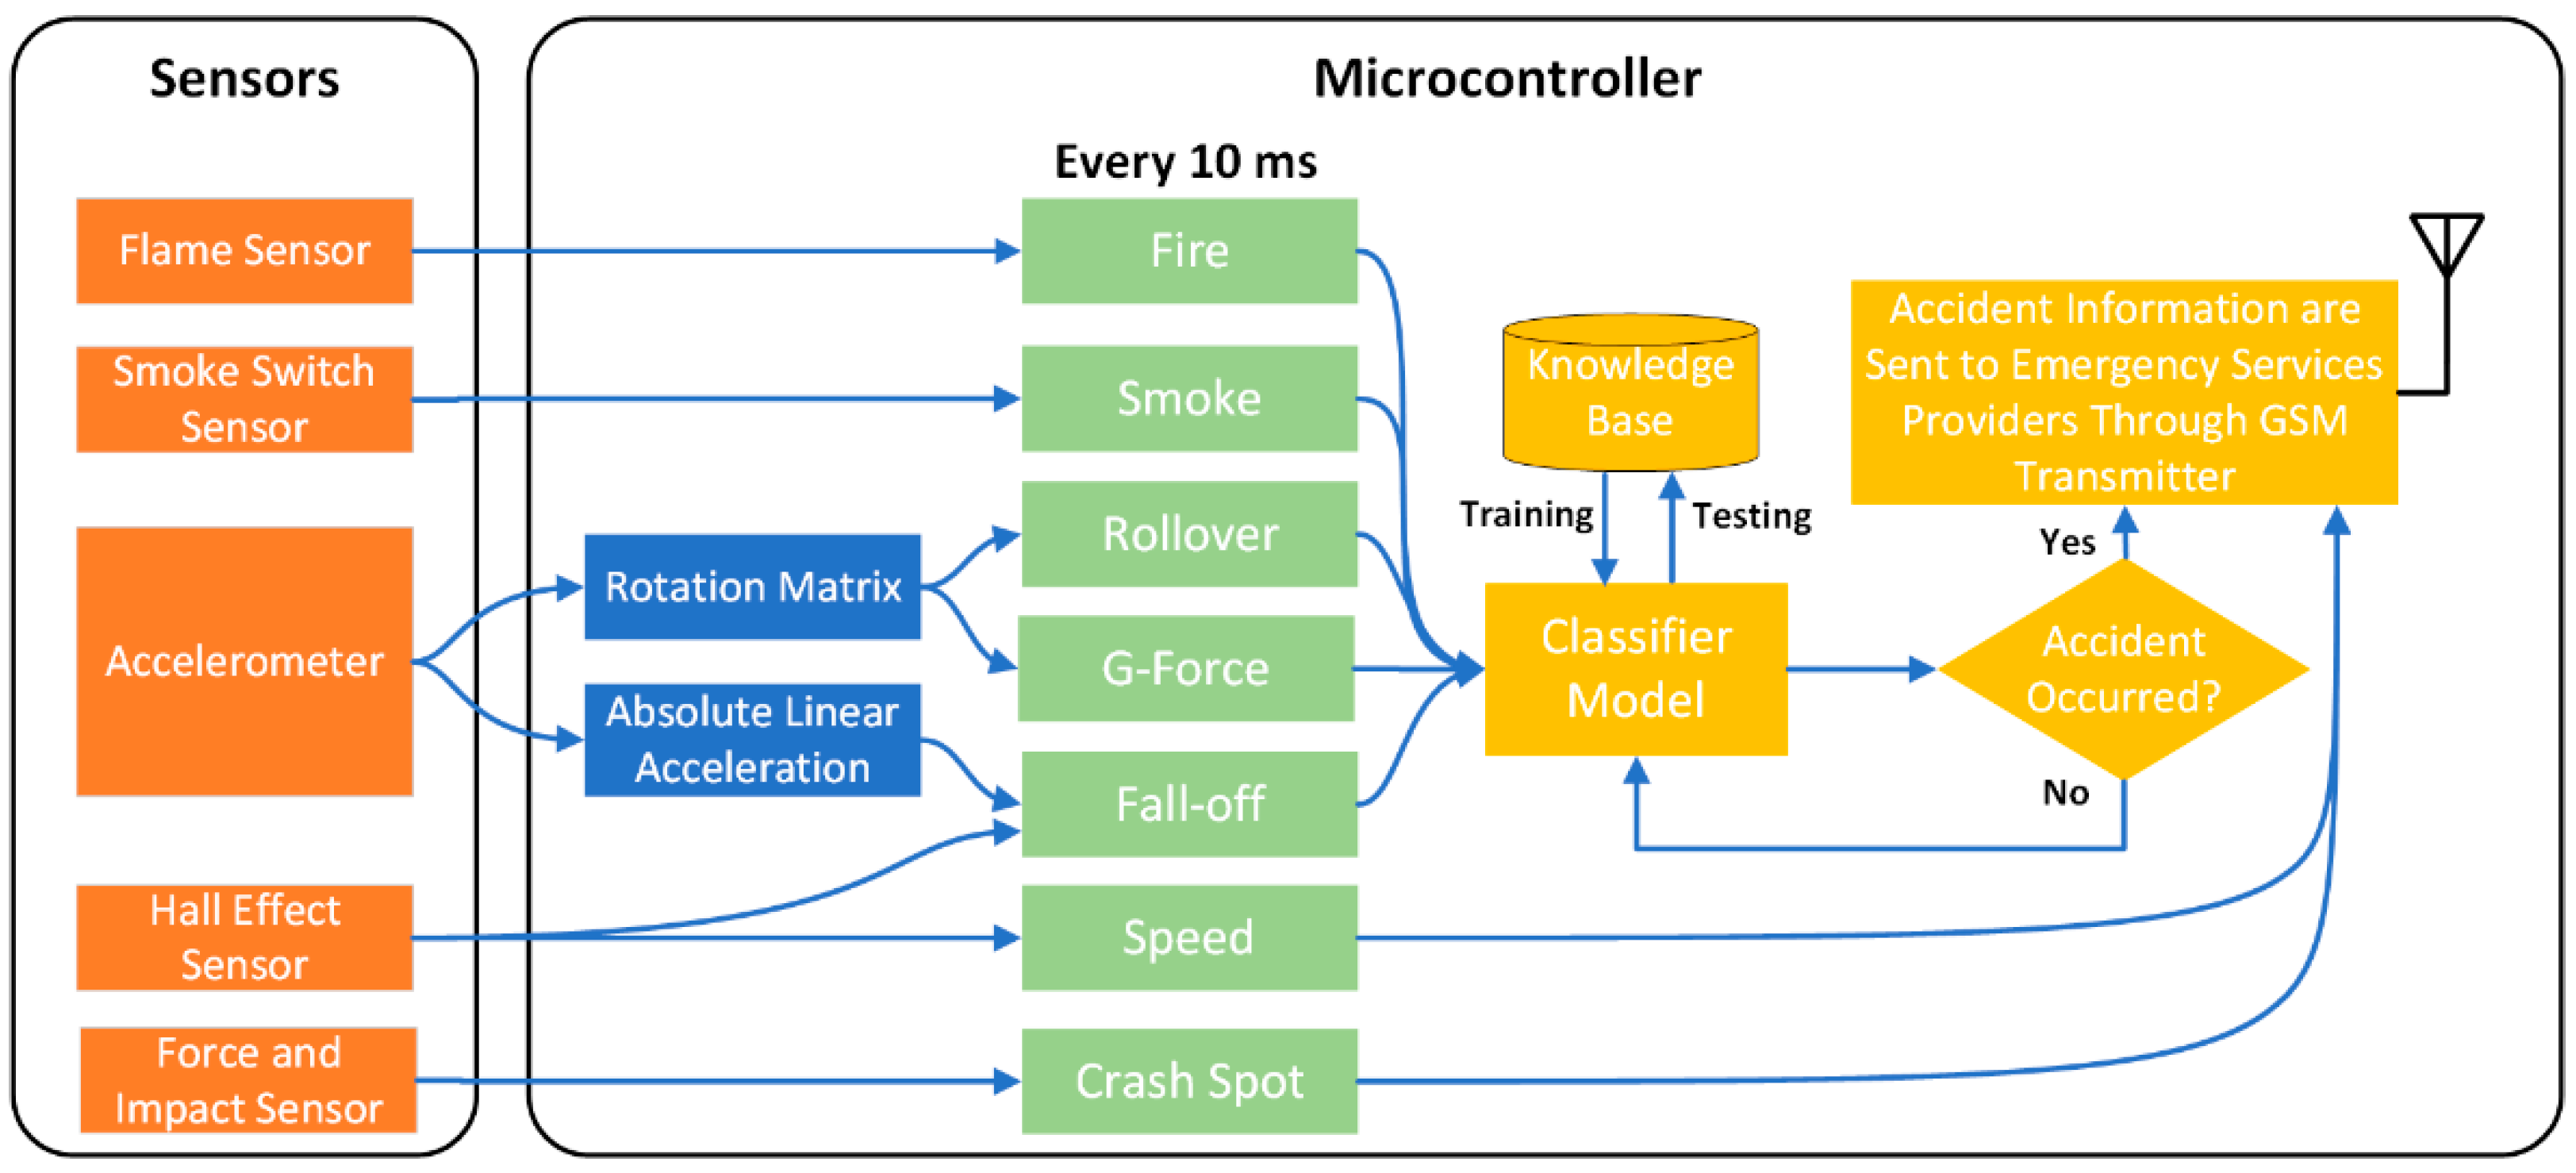
Figure 2 shows the operation flow of accident detection and classification. After data acquisition, the physical variables of the vehicle are sent to the microcontroller including speed, rotation, altitude, crash spot, flame, and smoke levels.
The microcontroller processes the data and transmits the determined criteria values to the classifier. The collected data are processed every 10 ms to ensure accurate decisions and minimize the usage of resources and processing capabilities. The accidents are classified into different severity levels based on five criteria. The calculation of these criteria and the threshold of each criterion are described in the next sub-section. Different classification models, discussed in
Section 3.3, were examined in our system to identify the more accurate model. After classification, the accident information including accident class, speed of vehicle, and the crash spots are sent to emergency services providers through a GSM transmitter.
3.2. Detection and Classification Variables
The variables that are used in our system, detection methods, and sensor types are described in this section.
3.2.1. Speed
A vehicle’s speed changes immediately or becomes zero eventually due to an accident event such as collision or a fall-off. We examined three methods for speed data acquisition to utilize the most accurate method in our system which are the Hall Effect Sensor and Global Positioning System (GPS). The Hall Effect sensor determines the vehicle speed by measuring the generated magnetic pulse which is proportional to the speed. It is activated by the magnetic field and operated by a single permanent magnet attached to a vehicle’s wheel. The sensor consists of a rectangular p-type semiconductor material that passes a continuous current through itself. The magnetic field exerts a force semiconductor and consequently deflects the charge carriers to either side of the semiconductor slab. This generates a measurable voltage proportional to the strength of the magnetic field [
15]. The speed of the vehicle can be also determined by a GPS device that receives information related to location, speed, and time of the vehicle from satellites. This information is sent in a National Marine Electronics Association (NEMA) sentence known as
$GPRMC [
16]. An example of a
$GPRMC NEMA sentence with a speed of 044.3 knots is as follows:
The evaluation results showed that Hall Effect sensor has a higher accuracy than GPS and hence it was adopted in our system.
Table 2 illustrates the accuracy of speed estimation using the Hall Effect sensor and GPS.
3.2.2. Crash Spot and Severity
The crash spot is deducted by a force sensor that detects physical pressure, squeeze, and weight. The sensor is a variable resistor that varies in resistance depending on the applied pressure. It consists of several layers; hence, the pressure reduces resistance since more resistive carbon elements touch the conductive traces [
17]. In addition, the impact sensor is used to determine the spot and intensity of an accident event in which three different thresholds are specified for potential force levels. The sensor function is based on generating an electrical impulse proportional to the acceleration decrement of a vehicle. The sensor contains a sensing plate that is pushed towards contacts upon motion state change to complete the circuit. The force level is measured by gravitational force equivalent (g-force) which is the measurement of the type of force per unit mass [
18].
3.2.3. Rotation and Altitude
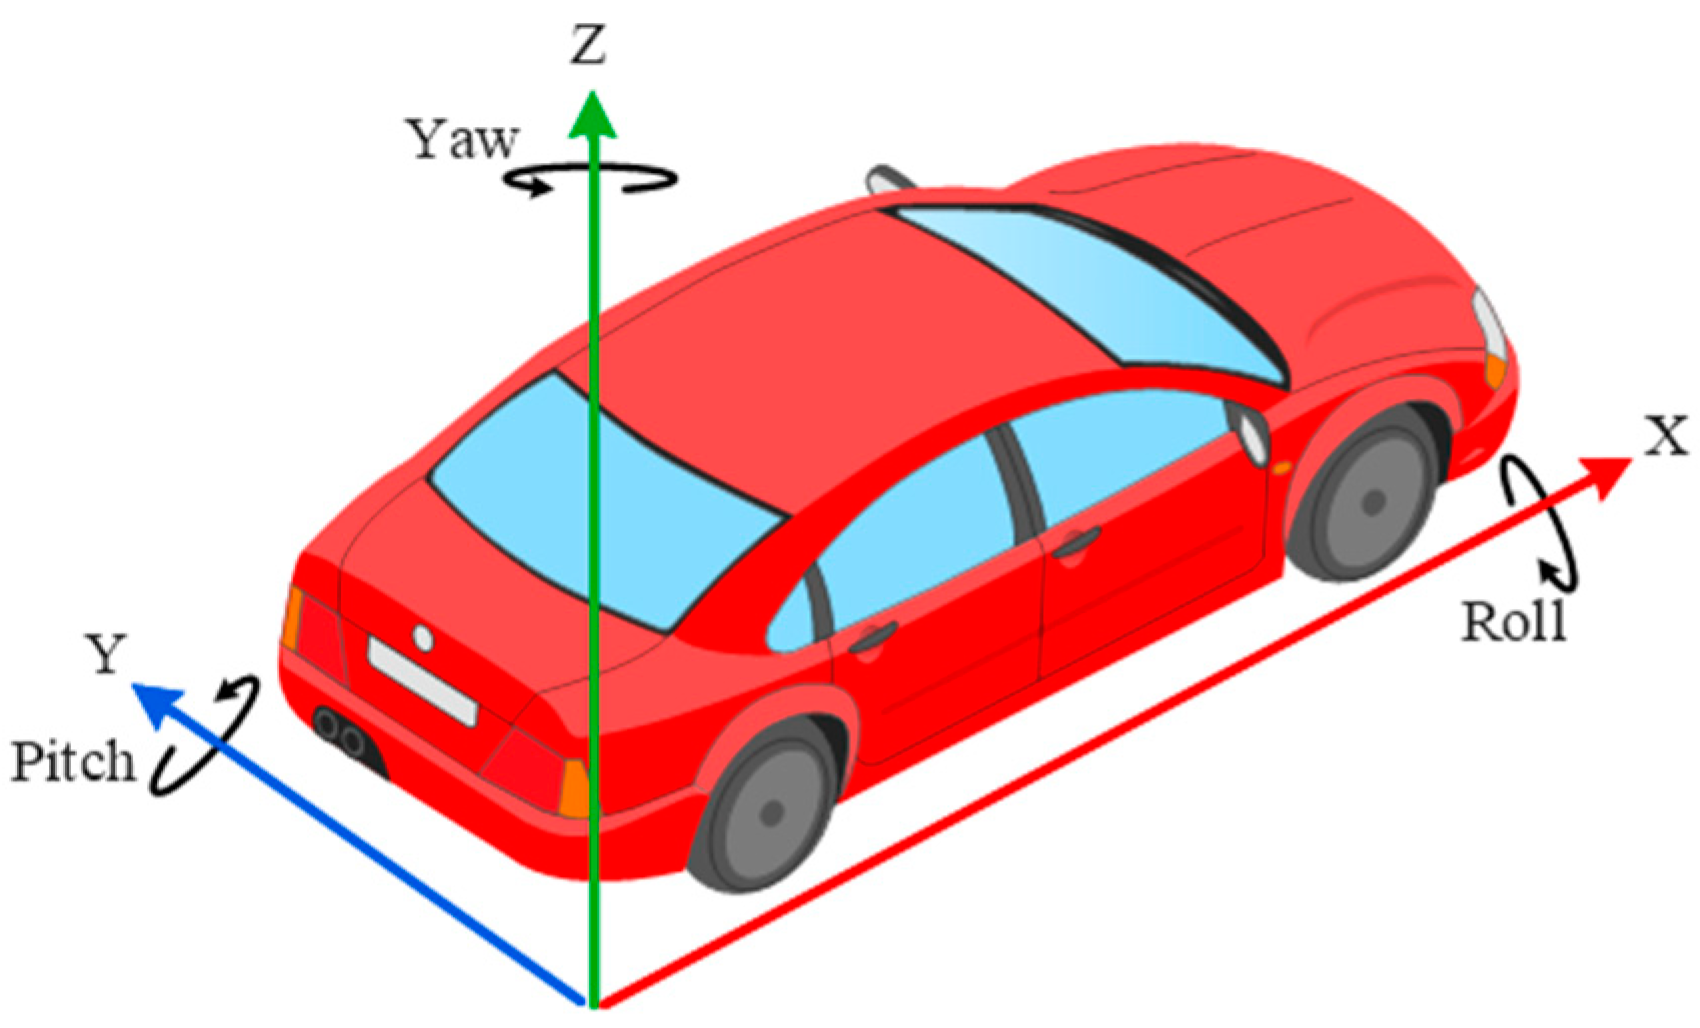
The rollover and fall-off of a vehicle due to an accident were identified using an accelerometer by calculating the rotation and altitude. The data sheet of any accelerometer denotes positive
x,
y, and
z axes on its package. Accelerometers detect the difference between the linear acceleration of an object and the local gravitational field. Hence, a linear acceleration aligned these axes results in a positive accelerometer output while a gravitational filed component aligned same axes direction results in a negative output.
Figure 3 shows the utilized coordination in our system. The
x-axis is along of the body axis of the vehicle while the
z-axis is aligned with gravity. Moreover, the
y-axis is aligned at right angles to both the
x and
z axes. To estimate the rollover event, the roll
Ø and pitch
θ angles of a vehicle around the
x and y axes are calculated in which a rollover occurs when roll
Ø or pitch
θ angles are larger than 90° [
19].
To detect the fall-off event, the three axes acceleration and the ground speed from the Hall Effect sensor are considered [
20]. Two frames of acceleration data were determined for analysis including present time (
t) and prior time (
). The fall-off event was categorized into (i) linear fall: the fall occurs without external force where only z-axis acceleration
changes. The
z-axis acceleration will follow free falling condition
, and (ii) non-linear fall: the fall occurs by an external force in which more than one axis changes. In this case, the deceleration is distributed in more than one axis and the Absolute Linear Altitude (ALA) is considered, which is calculated based on
x,
y, and
z components [
21]. To minimize the utilization of resources and system capabilities, a 10 ms Moving Maximum technique [
22] was employed. Instead of considering the accelerometer signal that is generated every 0.5 ms with a 2000 Hz, the peak value of each and every 10 ms time window (i.e., …,
K−2,
K−1,
K,
K+1, …) was considered as shown in
Figure 4.
The acceleration from x, y or z axes at the present time is represented as , while at previous time frame is represented as . There are two conditions must be met for non-linear fall. The first condition is . The second condition is the speed from the Hall Effect sensor turning into zero after a large acceleration change.
3.2.4. Flame and Smoke
Accidents that cause fire in vehicles are mostly high severity level and could require special medical care. Therefore, flame and smoke are sensed in our system as fire indicators. For flame detection, a photonic sensor is used, which converts incident photons into charge carriers. It reacts on the electromagnetic radiation from flames including the infrared (IR) spectrum, visual light, and the ultraviolet (UV) spectrum. The flame is detected if the wavelength is larger than
. To avoid false alarms, the sensor detects radiation at different narrow or wide wavelength regions either in a combination of IR and UV regions or just different regions in the IR spectrum [
23]. On the other hand, a Chemiresistors sensor is employed, which detects the change in the sensing material resistance when the gas encounters the material [
24]. Consequently, it generates analog volage proportional to the amount of detected smoke. Three different smoke levels were identified in our system, which are low with 0.1–1.5 V, medium with 1.6–2.5 V, and high with 2.6–3 V.
3.3. Classification Models
This works compared four classification models including Gaussian Mixture Model (GMM), Naive-Bayes Tree (NB), Decision Tree (DT), and Classification and Regression Trees (CART) to determine the most accurate model for the system. Seven physical parameters related to vehicle movement were used to train and test each classification model. The parameters are speed, fire, crash spot, smoke, rollover, fall-off, and g-force.
3.3.1. Gaussian Mixture Model (GMM)
GMM is a parametric Probability Density Function (PDF) that is formed of the weighted sum of Gaussian component densities. The number of components in each GMM is varied according to the number of training data points. GMM is parameterized by the values of mixture component weight and variances/covariance [
25]. This work employed GMM to obtain the information about accident severity level, i.e., high, medium, and low. Hence, within each GMM, the components obtained finer-level details from the feature vectors of each severity level. The decision about the accident classification depends on its probability in feature vectors of a specific model. From a given training data, GMM refines the weight of each distribution and estimates the parameters using the iterative Expectation-Maximization (EM) algorithm. Upon model generation, conditional probabilities can be determined for unknown data points.
The accident classification model is explained by the mean vector and covariance matrix parameters. For a feature vector
x, the Gaussian mixture model for an accident severity level is identified as the weighted sum of
K Gaussian component densities.
where
is the component densities and
are the mixture weights. Each component density is a D-variate Gaussian function of the form.
where
is the covariance matrix for
component and
is a mean vector. The mixture weights fulfill the constraint that
. The operation of GMM in an accident classification system consists of two phases as shown in
Figure 5; (i) Feature extraction: the feature vector is derived from identified accident dataset using EM algorithm in GMM splitting and optimization block. (ii) Accident classification: in this phase, the trained models are assessed by feeding them with features of all unidentified accidents. Then, the probability of unidentified vector features related to a specific model is calculated. Accordingly, the model with high probability is considered as a potential accident class.
3.3.2. Naive-Bayes Tree (NB)
NB Tree is a probabilistic model based on the Bayes theorem with high classification accuracy on small databases and linear scale capability with the number of inputs [
26]. It has low computation complexity and can be trained quickly [
20]. The model assumes that the input variables are independent in which each feature in a class has no relation to the presence of another feature. For accident classification, the input variables are rollover, fall-off, smoke, fire, and g-force, whereas the output variables are the severity levels.
The conditional probability of a class occurrence of the target variable
y given that the
x vector occurred
is represented as:
and
values are derived from the data. For all entries, the denominator remains static and can be removed; hence, the proportionality can be represented as:
The class
y is determined as the class with highest probability as follows:
3.3.3. Decision Tree (DT)
The DT classifier is a non-parametric classifier and generates the classification model in a tree-like structure [
27]. The main advantage of DT is that different feature subsets and decision rules can be used at different classification phases. DT includes one root node, internal and leaf nodes, and branches. Each internal node performs a test on an attribute, and each branch has one possible value for that attribute and each leaf contains class labels. The classification of input data starts from the tree root, and it is broken down into a leaf by splitting variables. The selection of the splitting variables and the necessary of further splitting are determine based on the entropy and the gain in information. The entropy measures the uncertainty amount of an event and it is calculated as:
where
represents the input variables for accident classification with
m distinct values, while
represents the probability of taking a specific variable from
i number of options. The expected unpredictability of
n outcome from the input variables
D is calculated by:
where
is the number of observations and
c is the total observations. The information gain is the difference between actual and expected entropy is calculated as
. In our system, five variables were used, including fall-off, rollover, g-force, fire, and smoke level. Part of the dataset was used as a training dataset to determine the DT model that fits the data, and the other part was used as a testing dataset to examine the model performance.
3.3.4. Classification and Regression Trees (CART)
CART is a very successful decision tree induction method [
25]. It is a nonparametric method that builds binary trees from continuous and discrete features of the data. The analysis of continuous features considers all possible binary splits into intervals (−∞, a) and (a, ∞), while all possible splits of symbols set into two disjoint and complementary subsets are considered. Each tree node is labeled with the class label dominating in the node. The possible misclassification cost must be considered in the decisions; thus, the surrogate splits technique is employed to handle missing data values. The data object is passed to another test if it does not describe a value necessary for the original test of a tree node. Consequently, the new test exploits another feature to generate a similar split to the original test. The selection of best split is based on an impurity measure, specifically, the Gini index. For a dataset
D, the Gini index is calculated as:
where
Q represents the number of classed and
is the fraction of records in
D of class
and it is obtained by:
4. Implementation and Results
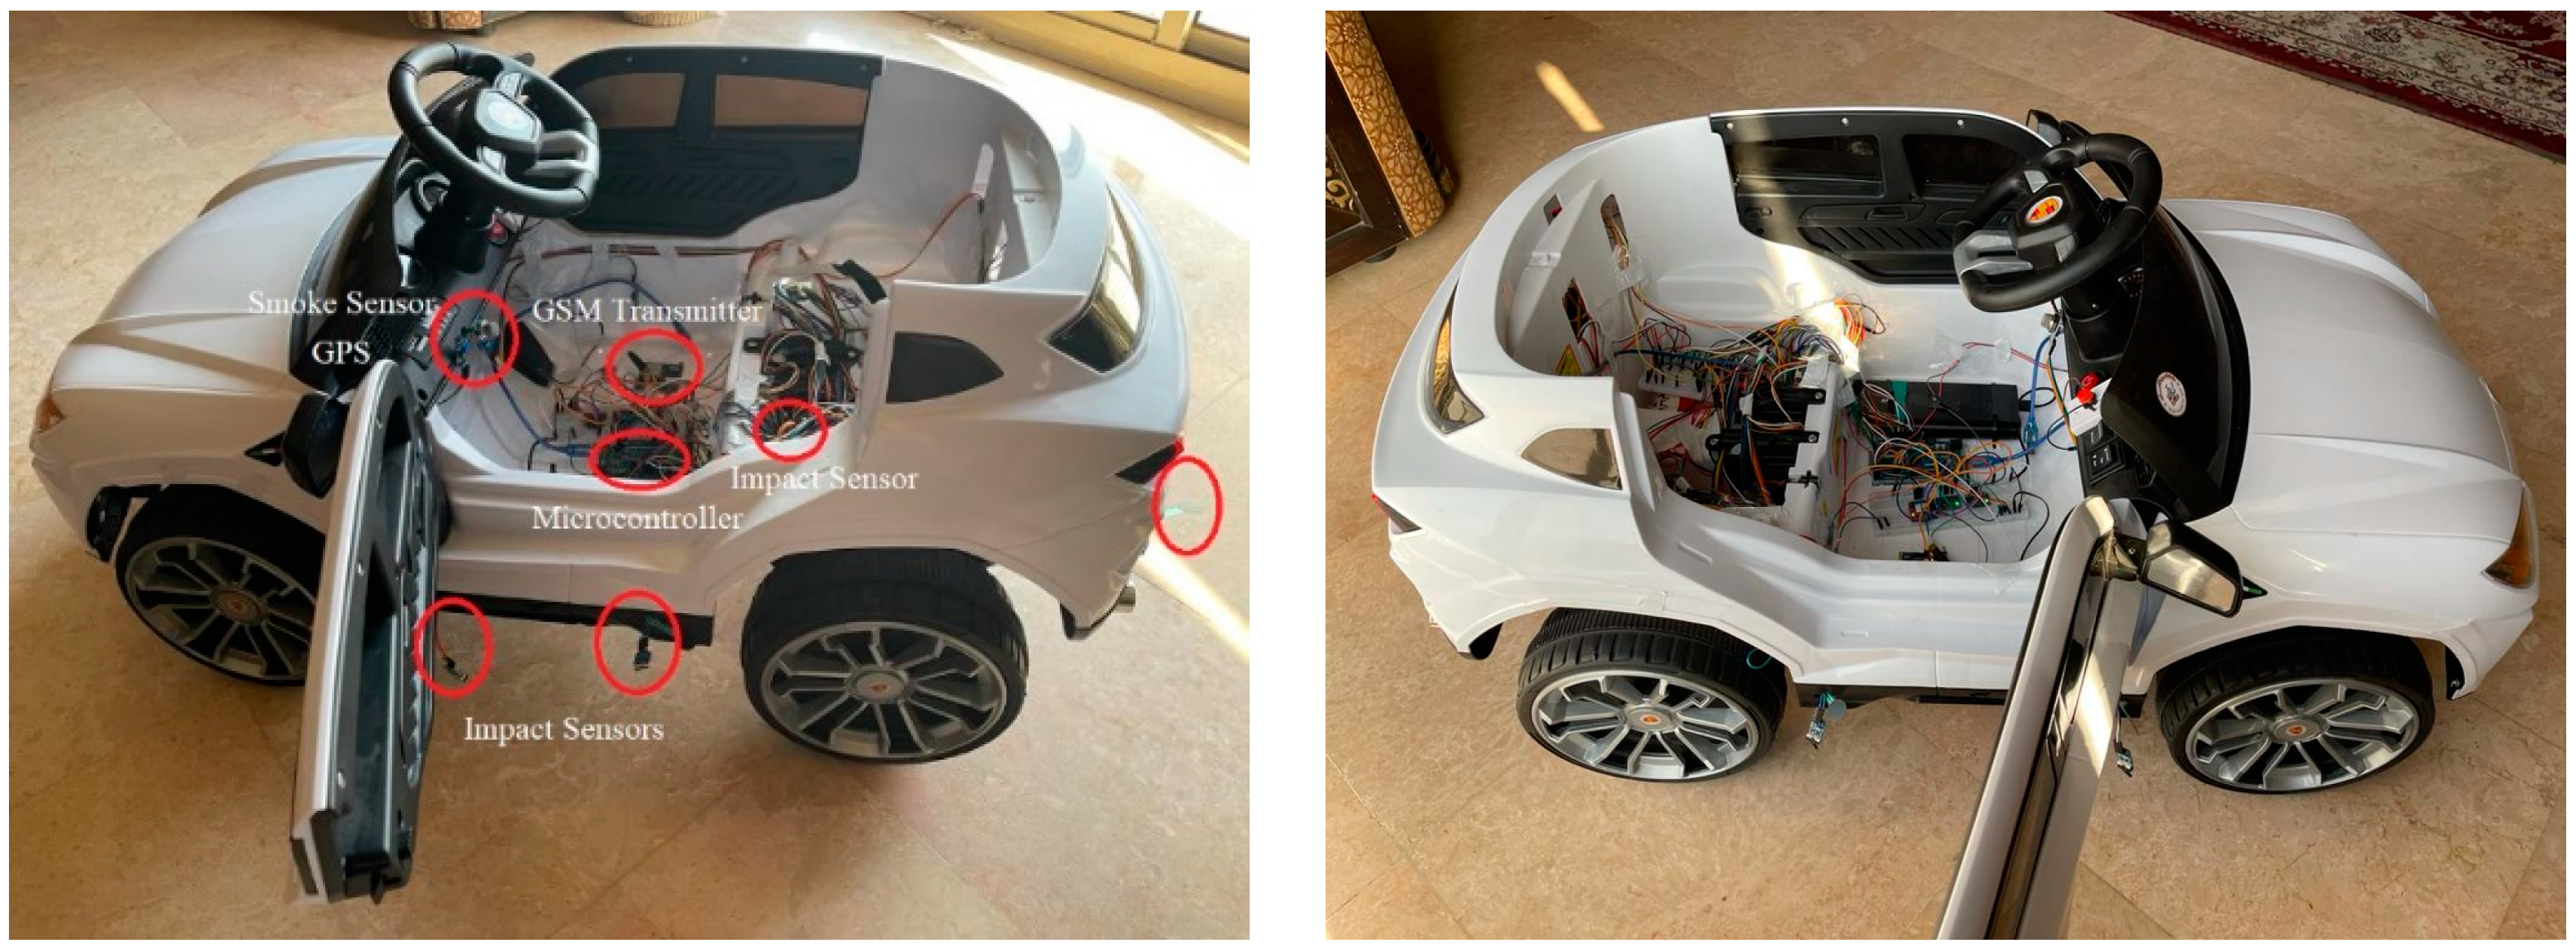
The hardware components of this work were Arduino mega (microcontroller), FSR 402 Force Sensitive (Force sensor), LM 393 IR Flame (Flame sensor), MQ2 Gas switch (Smoke sensor), ShockLog 298 (Impact sensor), 6AT8002–4AB00 Siemens (Accelerometer), GT-U7 car GPS navigation (GPS), and GSM 900, SIM 900 (GSM transmitter). A radio-controlled car was utilized to simulate real-life accident scenarios. The dimensions of the car were 40 cm height, 56 cm width and 101 cm length. The other specifications were 80 m operating distance and 50° maximum turning angle. The impact sensor was placed in the center of gravity in the car to ensure high accuracy readings as specified by National Highway Traffic Safety Administration (NHTSA) [
28]. The positions of other sensors do not affect the accuracy of the readings.
Figure 6 shows the hardware setup of the implementation.
The microcontroller was programmed to perform all processing. The microcontroller continuously processes the data from the sensors and estimates the physical variables of the vehicle including speed, rotation, altitude, crash spot, flame, and smoke levels. If the microcontroller detects an accident, it sends to emergency a message containing accident location, crash sides, and severity level. To collect the dataset, 950 experiments of rollover, fall-off, and fire with different values of g-forces by changing the speed value were conducted. To mimic the fire and smoke, a lighter was used near to the sensors. More gas was emitted to increase the smoke level. For the fall-off experiment, the remoted car was dropped with different deviation angles onto a mattress from around an 8-foot height. On the other hand, for the rollover experiment, a thick wooden board was used to incline the car by 40°.
From the 980 experimental observations, 784 (80%) observations were used for training classification models and 196 observations (20%) were used for testing. The considered performance metrics were (i) precision: the rate of correct accident classifications and it is calculated as true positive prediction divided by all positive predictions, (ii) recall: the rate of accidents that were predicted by the model, which was calculated as true positive predictions divided by actual positive predictions, and (iii) F1-score: the harmonic mean of precision and recall, which was calculated as F1-score = 2 * ((precision * recall)/(precision + recall)) [
29]. The system performance of the system using different classification models is summarized in
Table 3. Using GMM in the testing dataset, the means were 0.90, 0.87, and 0.86 for precision, recall, and F1-score, respectively. The results showed that GMM had better results with low severity levels. On the other hand, using the NB model, the mean of precision, recall, and F1-score were 0.86, 0.89, and 0.88, respectively. The DT classifier had the same performance with the three types of severity. Finally, the average precision, recall, and F1-score of the system using CART were observed to be 0.90, 0.86, and 0.86, respectively. In the severity level, the model performed best with the high level with an F1-score of 0.907, followed by fall-off and rollover.
According to the experimental results and the literature, the classification criteria of each accident event are determined as illustrated in
Table 4. The accidents were classified based on severity into high, medium, and low. The accident severity level depends mainly on g-force value and fire occurrence. It can be observed that accident severity was considered high whenever g-force was higher than 40 g. The accident severity was considered medium in most cases when the g-force value was between 20 g and 40 g, while when the g-force value was between 20 g and 40 g, it was considered low in most cases.
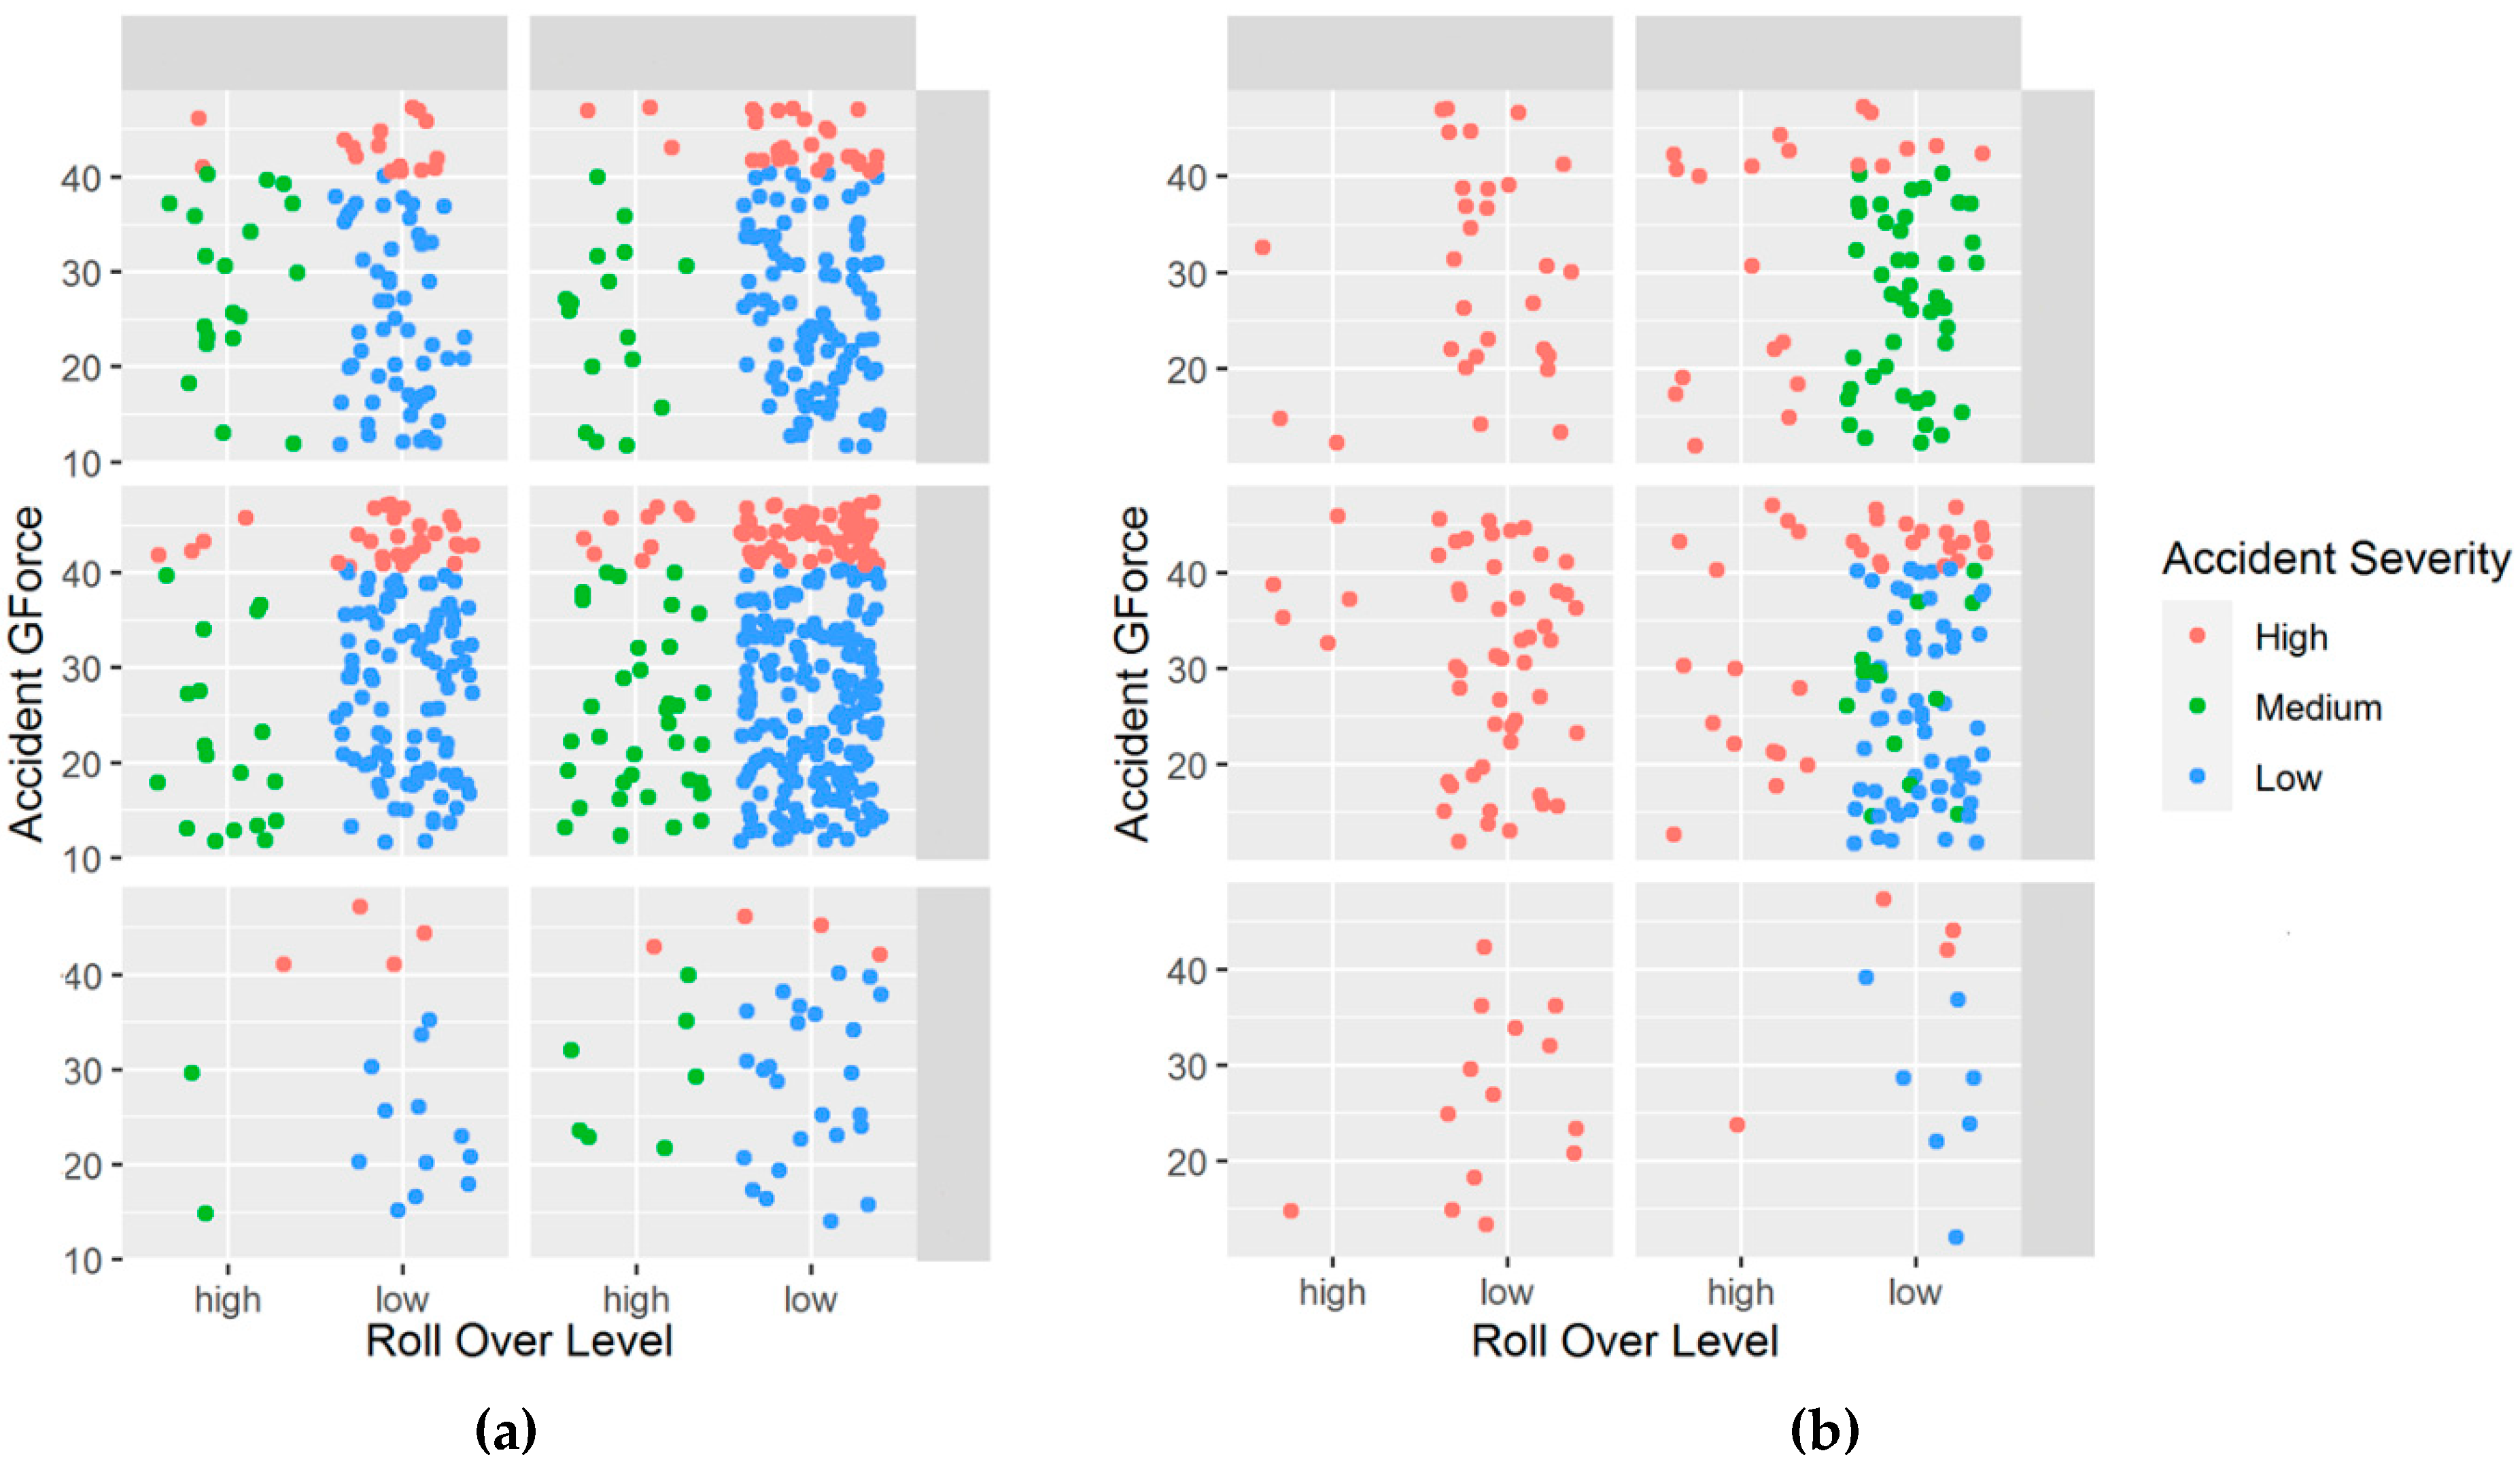
Figure 7 demonstrates the relation and the effect of each criterion on accident severity level. In
Figure 7a, the severity level of accidents if there is no fire occurs depends on g-force and roll off levels. The severity level was high when the g-force was higher than 40 g whether fall off was high or low and regardless of the smoke level. For accident events with g-forces of less than 40 g, the accident severity level was classified as medium when the roll over level was high and it was classified as low when the roll over level was low.
Figure 7b shows the effect of fire event on accident severity level, which depends on g-force and fall off levels. The accident severity level was high when the fall off level was high regardless of the values of g-force, roll over, and smoke levels. However, when the g-force level was lower than 40 g, the severity level was medium if the smoke level was high and low if the smoke level was medium or low.
The time complexity of the solution depends on the utilized classification model. The time complexity represents the estimated time to run a model. It is the number of operations performed by the model. Let n be number of training examples, and k the number of features. The time complexity of GMM was the highest compared with the other models [
30]. On the other hand, DT and CRT had the lowest time complexity for low and medium numbers of examples [
31]. In NB, the time complexity was linear and calculated as O(nk) [
32]. Hence, CART was considered the most suitable classification model for the proposed accident detection system.


 ,
, 


