
Aerosol Characteristics and Their Impact on the Himalayan Energy Budget

 ,
,  , ,
, ,  ,
,  ,
,  ,
,  ,
,  and
and 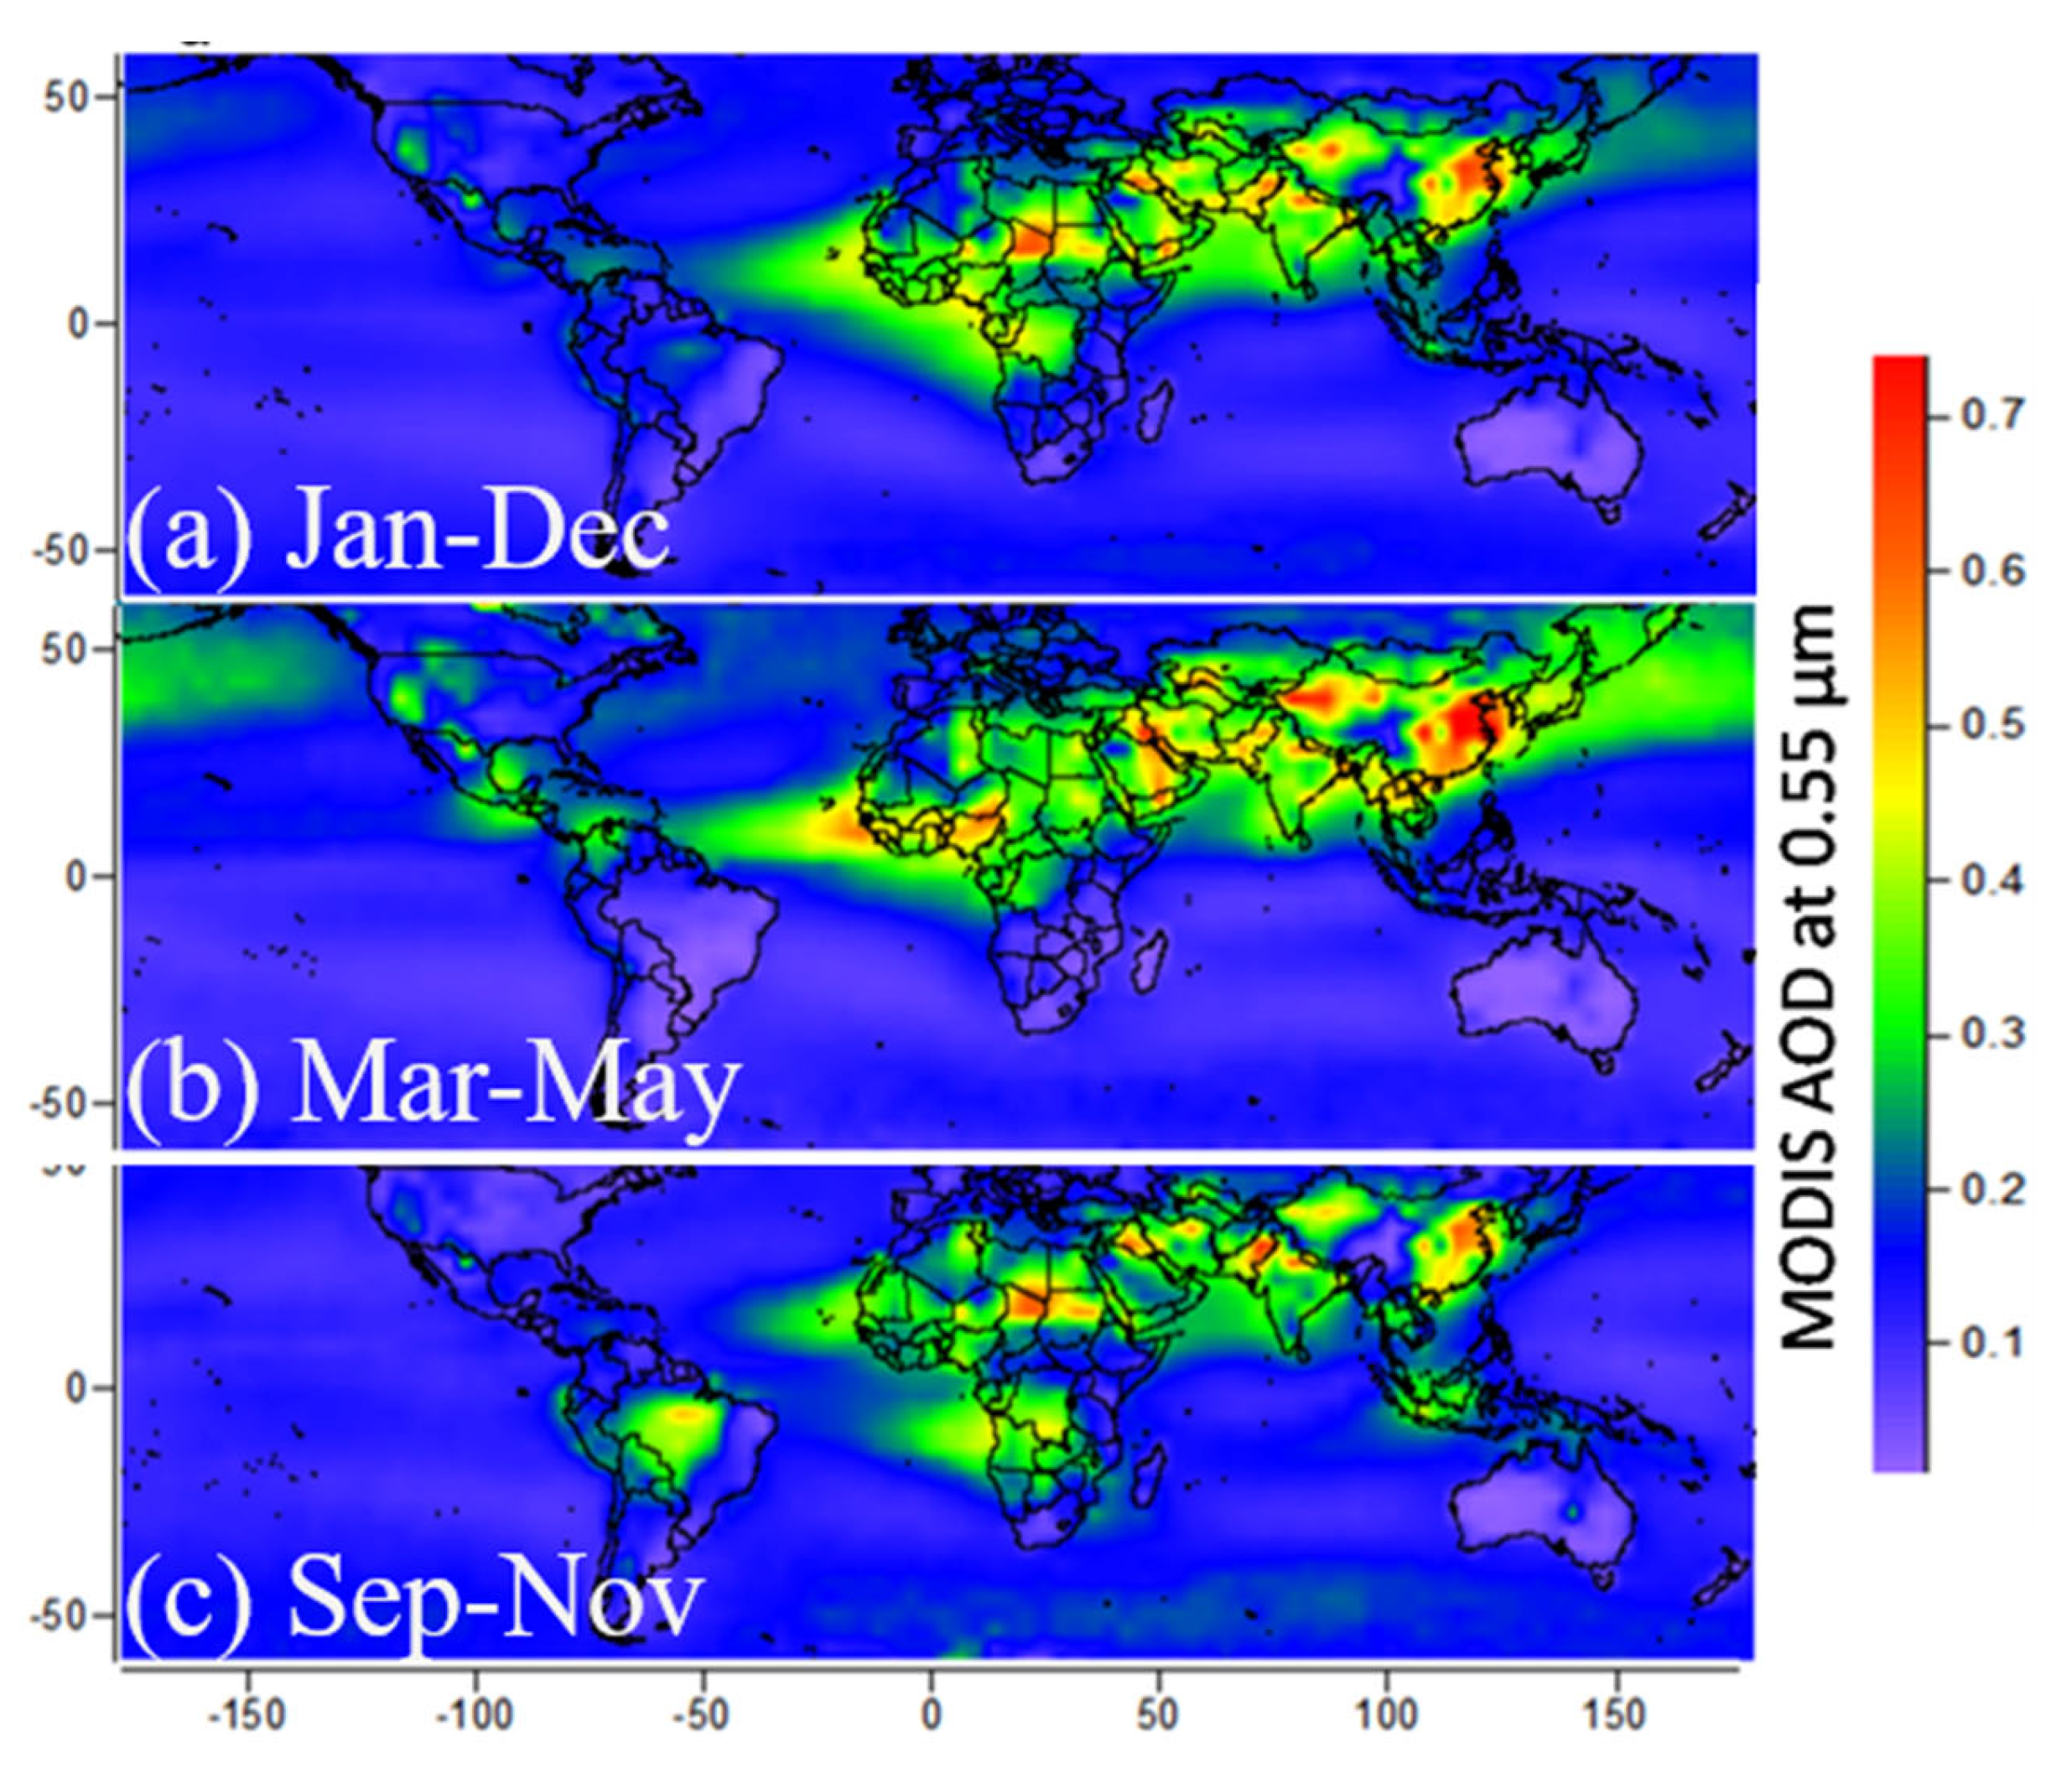
Abstract
:1. Introduction
2. Materials and Methods
3. Results
3.1. A View of Global Aerosol Characteristics
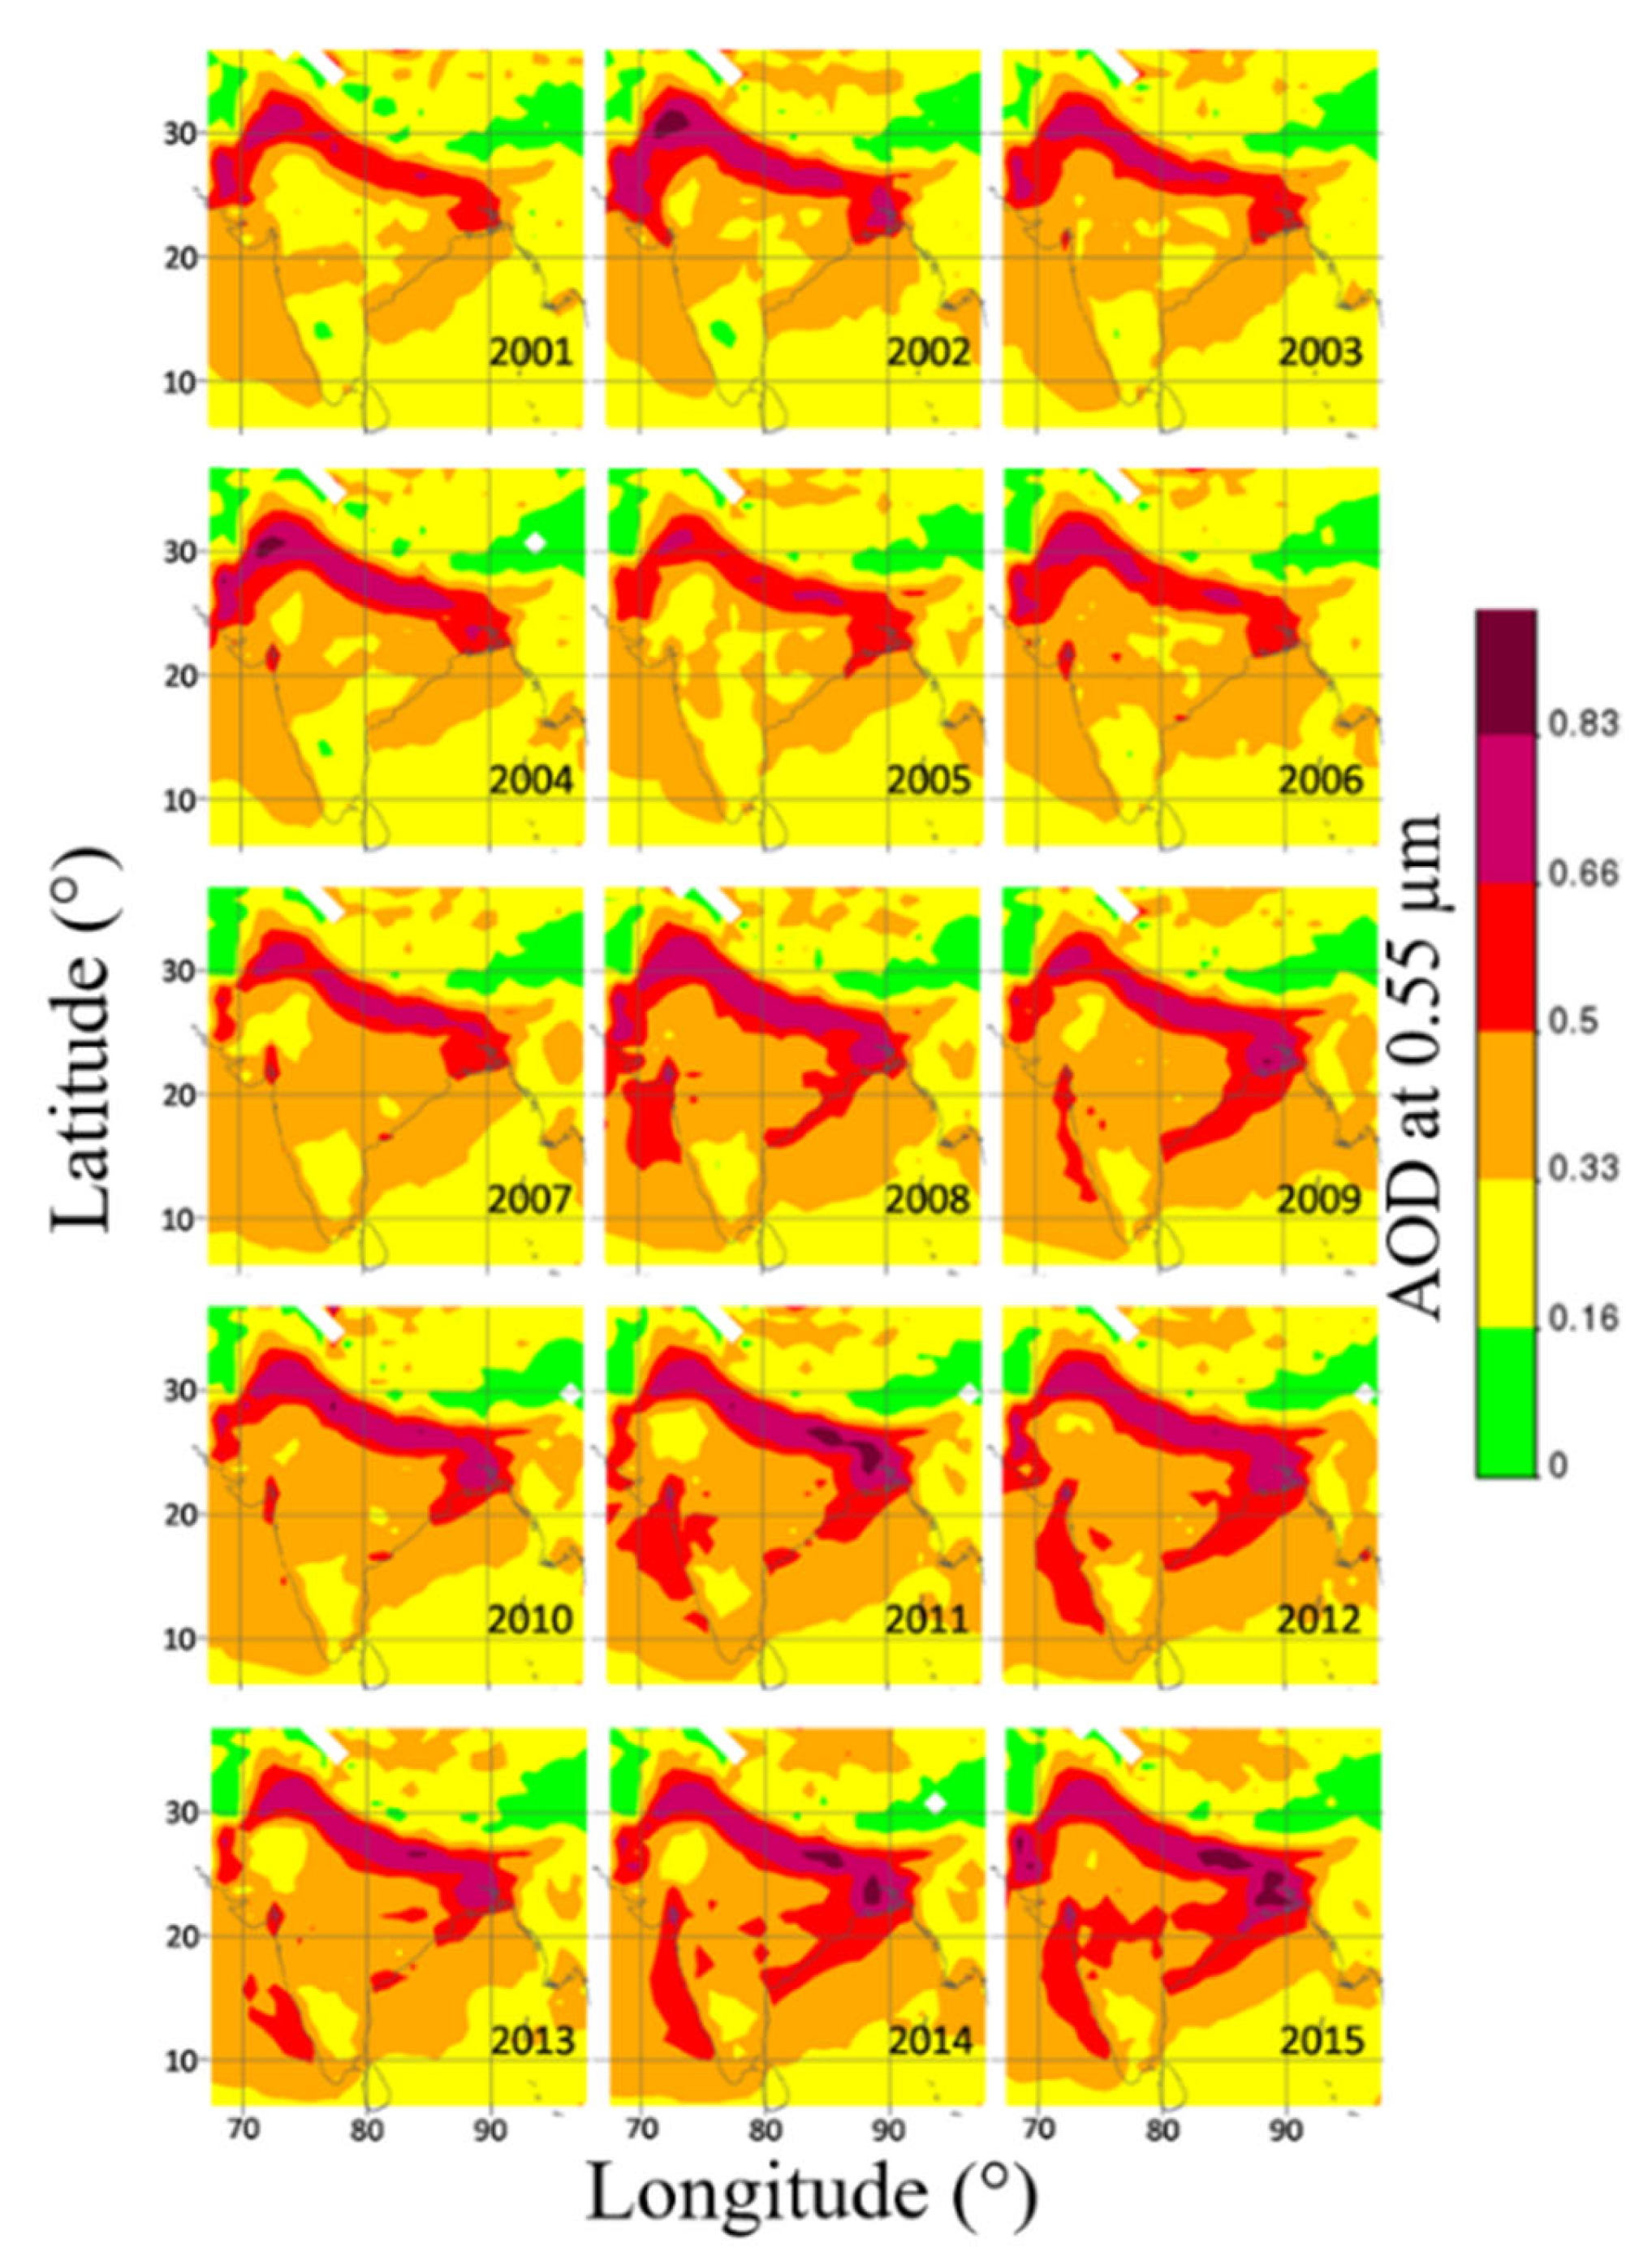
3.2. A View of Regional Aerosol Characteristics: Indian Region
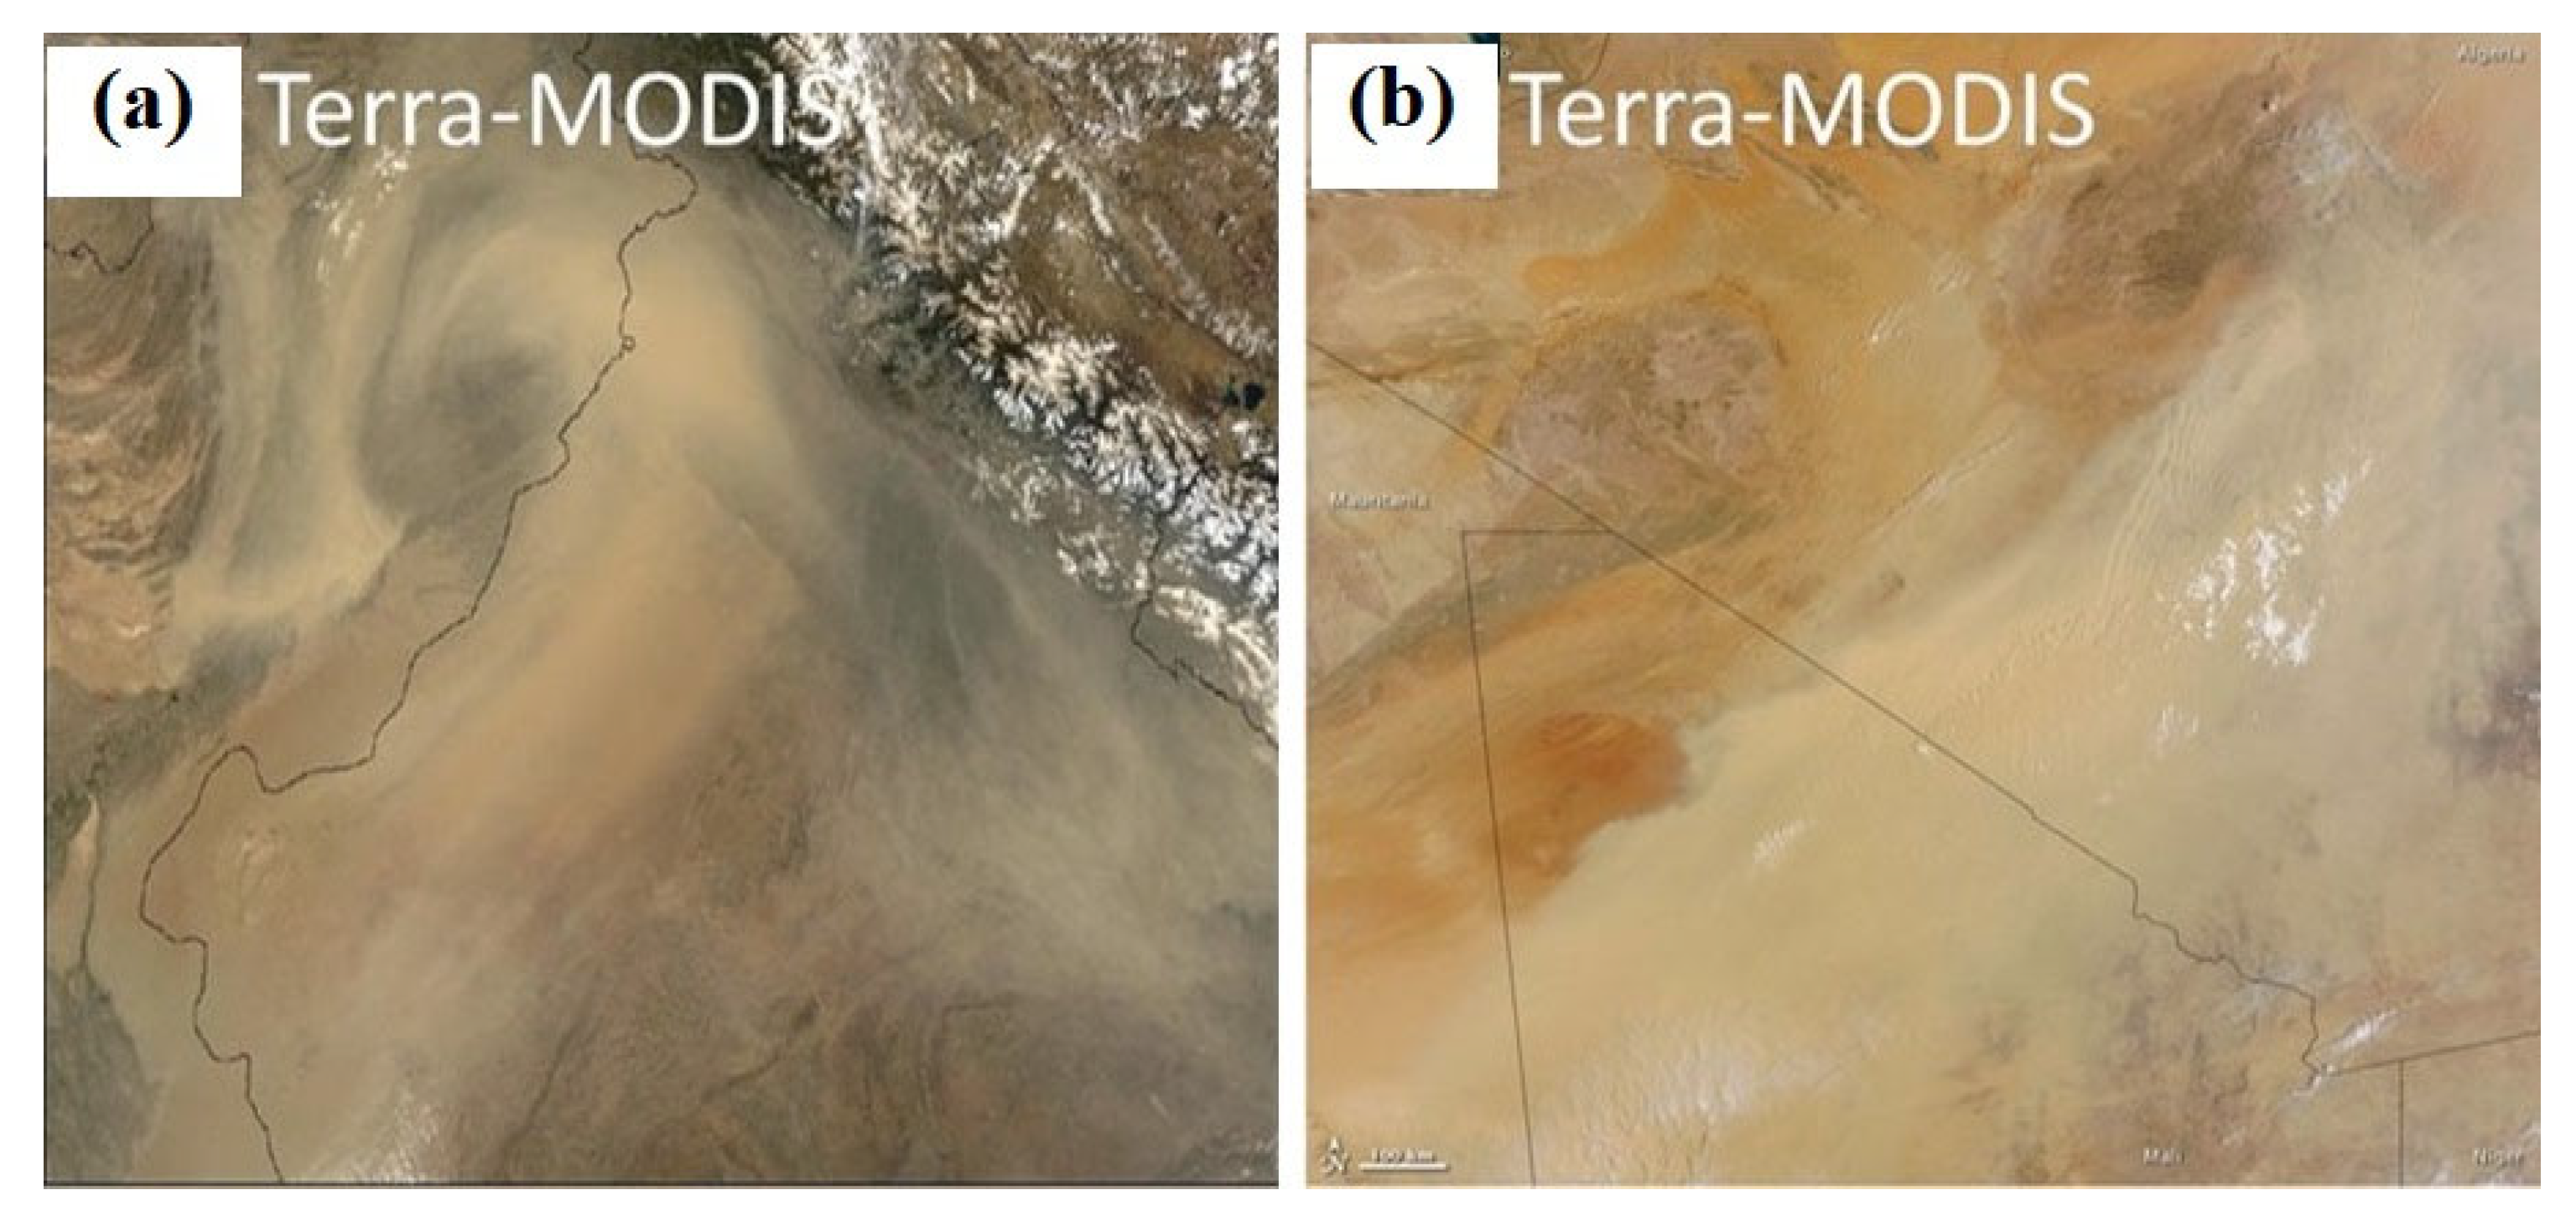
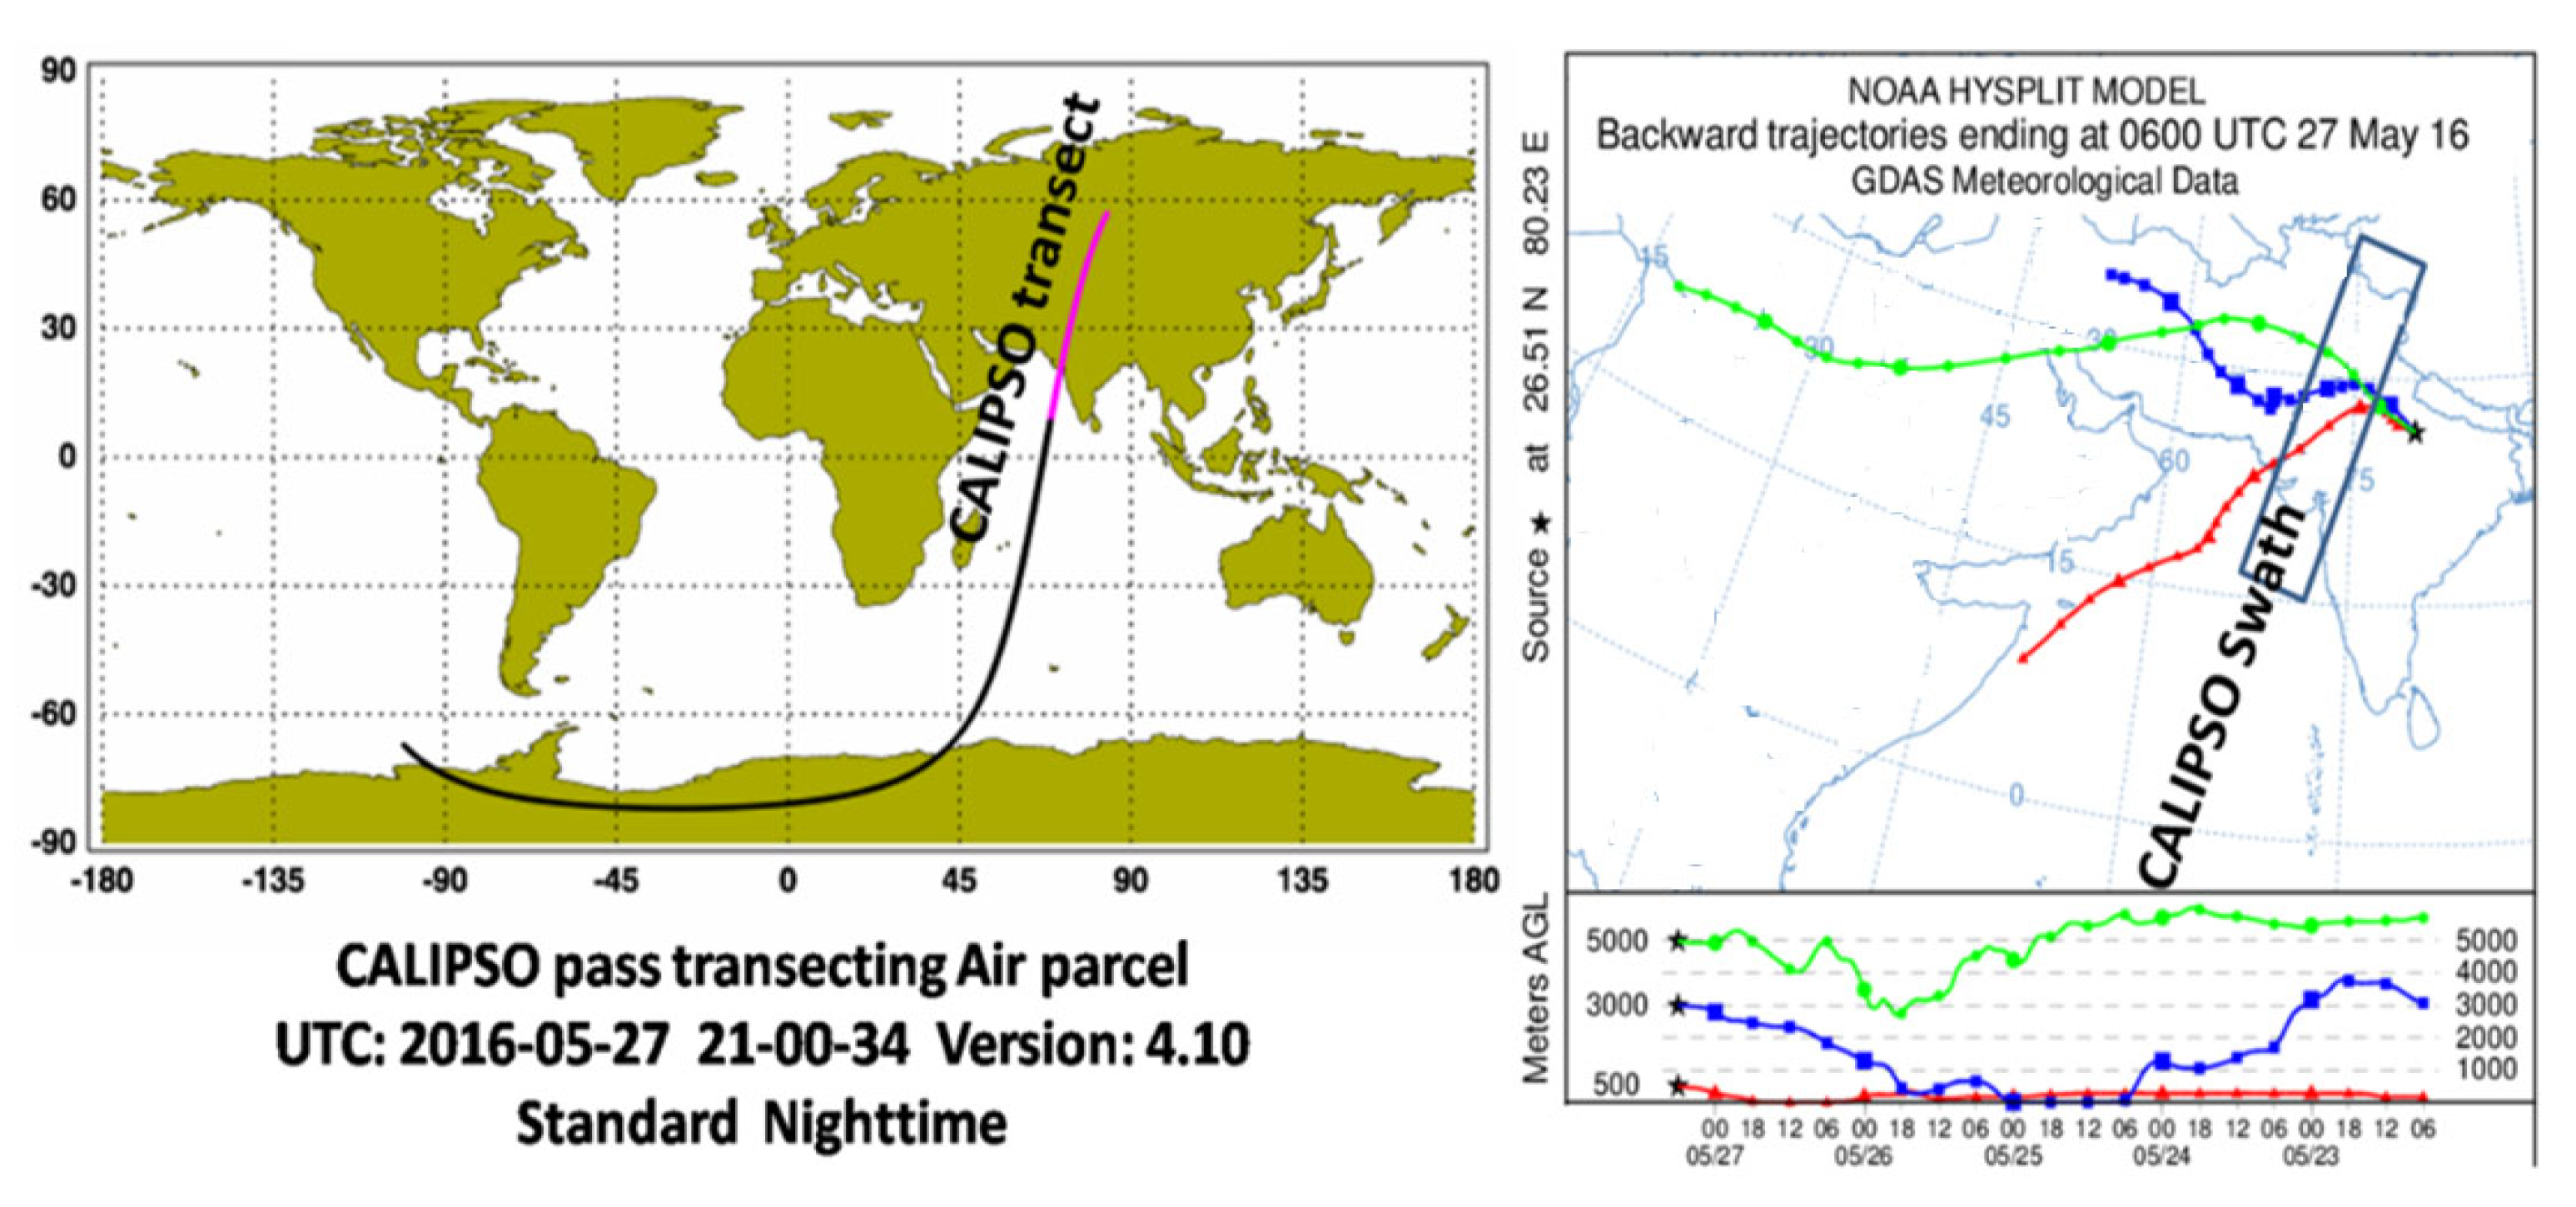
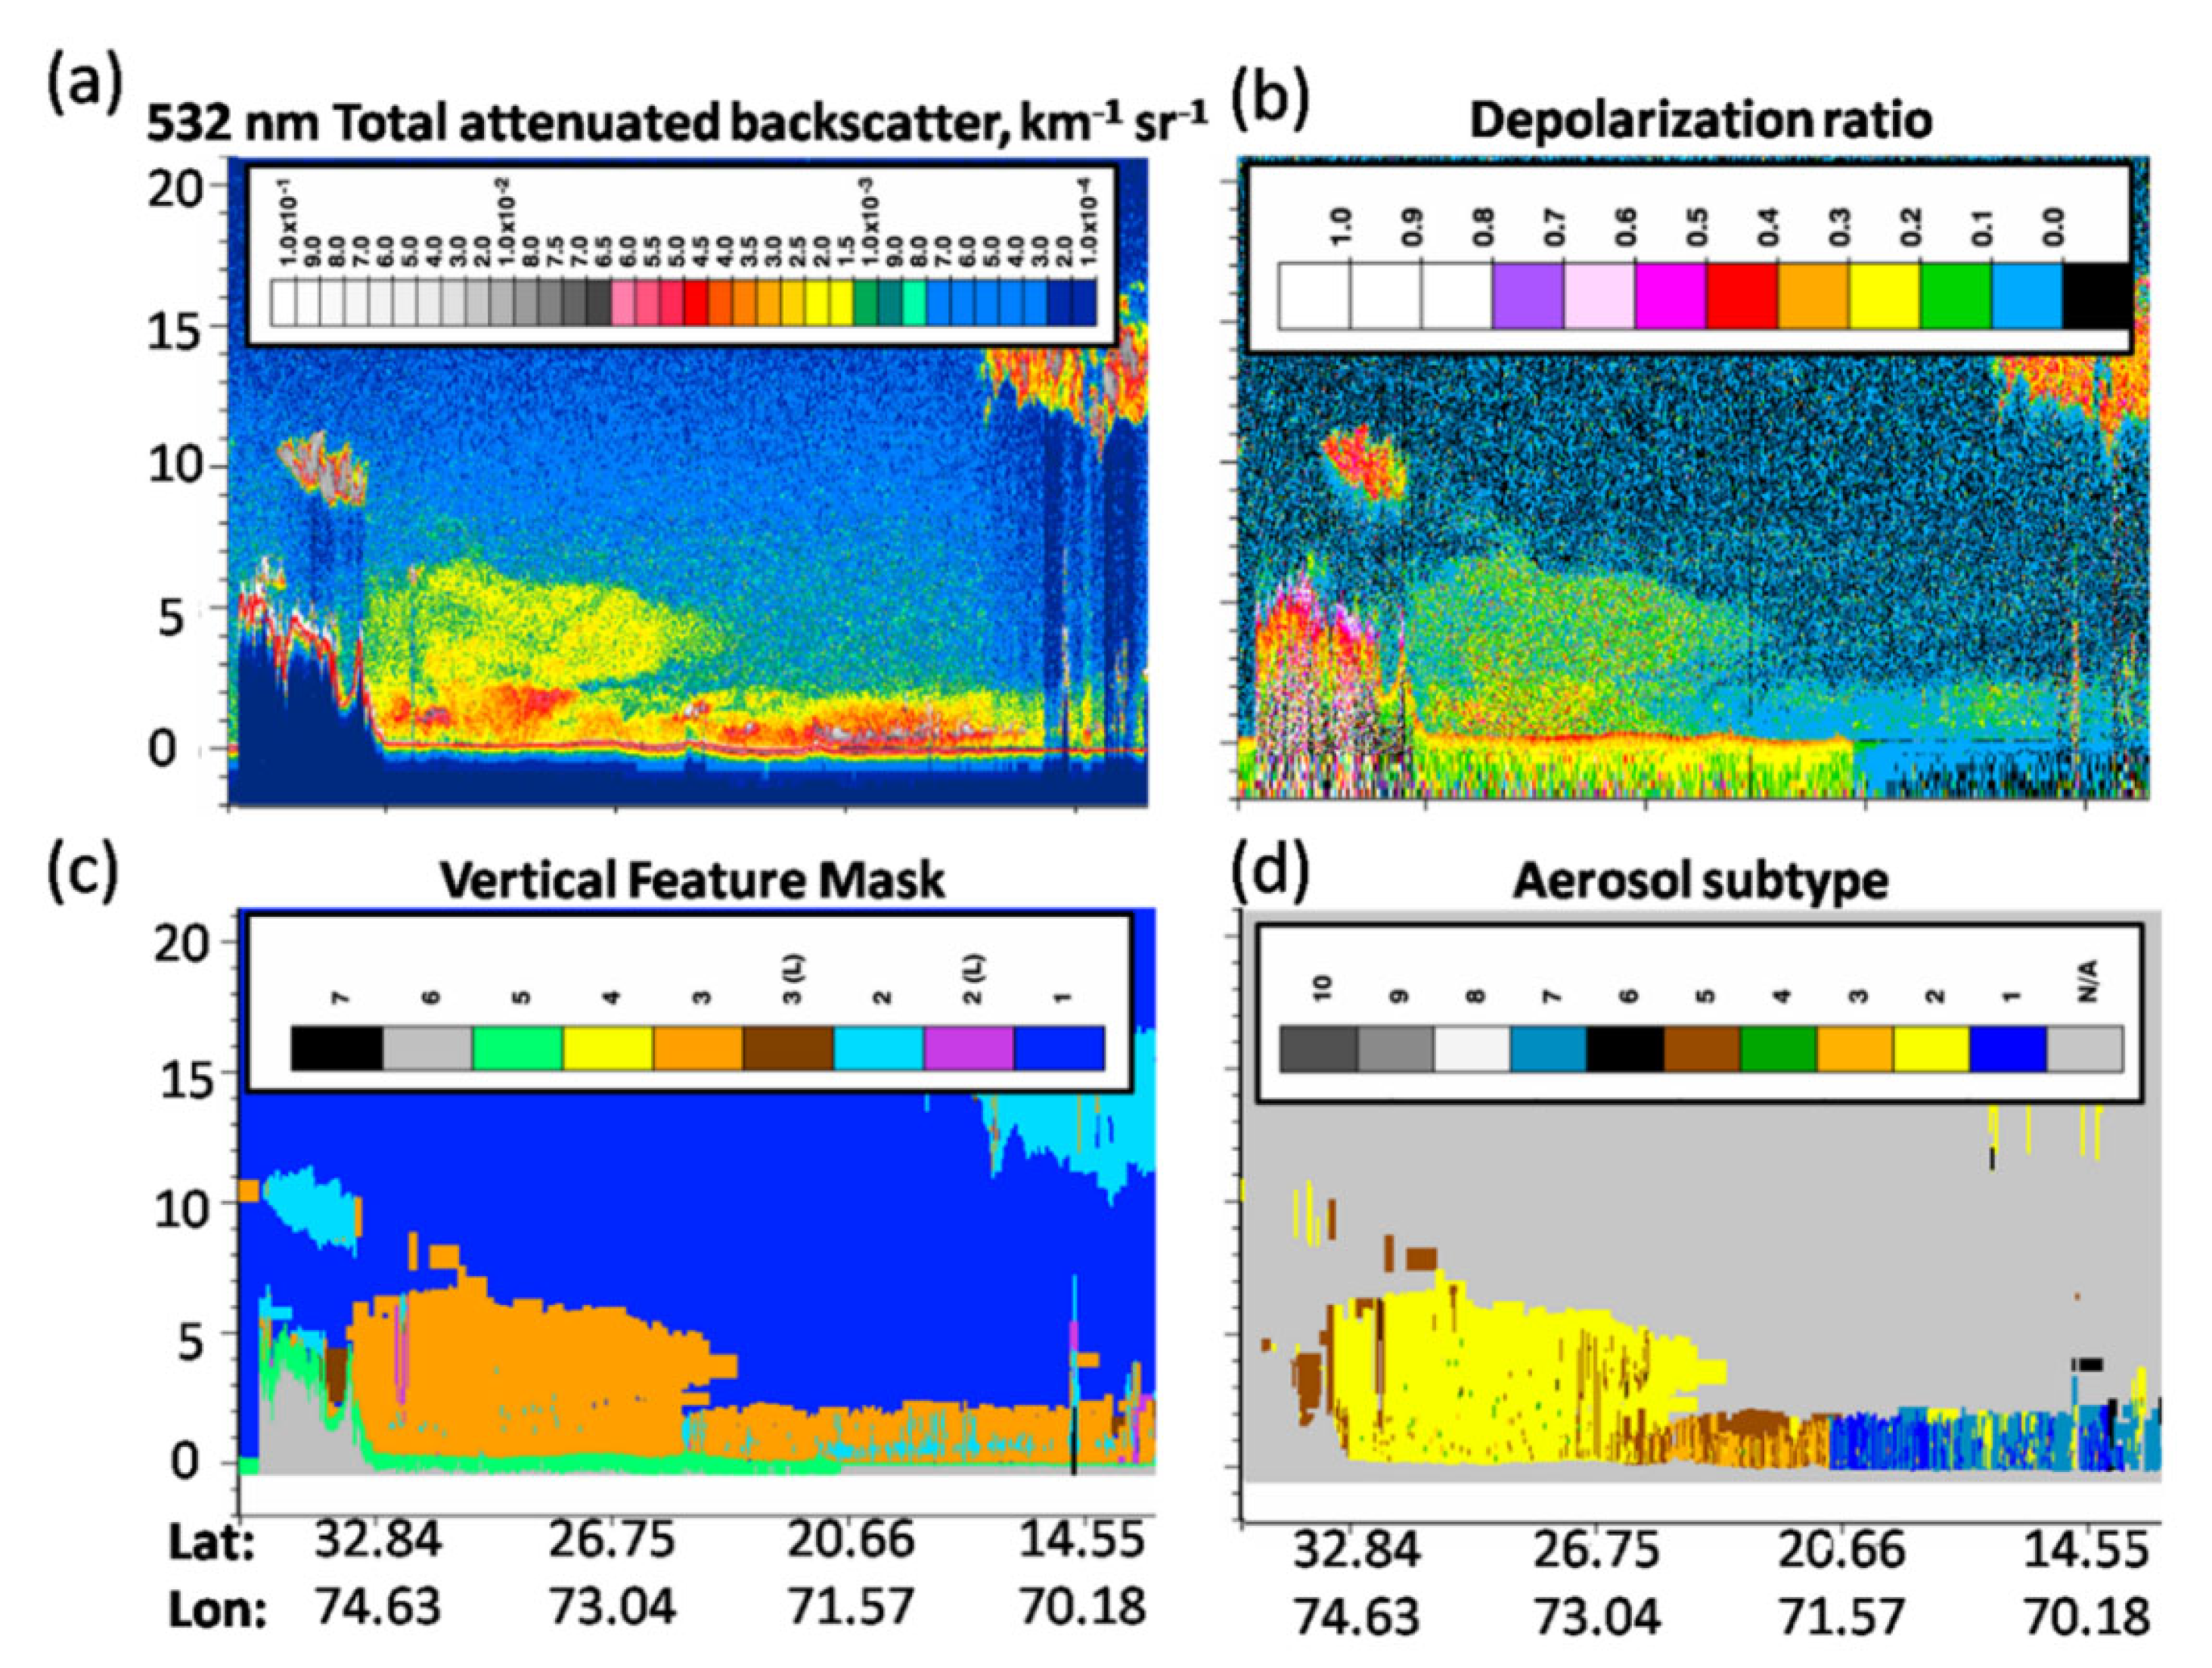
3.3. Observational Evidence of Aerosol Transport towards the Elevated Sites of the Himalaya
4. Discussion
5. Conclusions
Author Contributions
Funding
Institutional Review Board Statement
Informed Consent Statement
Data Availability Statement
Acknowledgments
Conflicts of Interest
References
- Pöschl, U. Atmospheric aerosols: Composition, transformation, climate and health effects. Angew. Chem. Int. Ed. 2005, 44, 7520–7540. [Google Scholar] [CrossRef] [PubMed]
- Pósfai, M.; Buseck, P.R. Nature and climate effects of individual tropospheric aerosol particles. Annu. Rev. Earth Planet. Sci. 2010, 38, 17–43. [Google Scholar] [CrossRef]
- Junge, C.E. Air Chemistry and Radioactivity; Academic Press: New York, NY, USA, 1963. [Google Scholar]
- Ramanathan, V.; Carmichael, G. Global and regional climate changes due to black carbon. Nat. Geos. 2008, 1, 221. [Google Scholar] [CrossRef]
- Stocker, T.; Qin, D.; Plattner, G.-K.; Tignor, M.; Allen, S.K.; Boschung, J.; Nauels, A.; Xia, Y.; Bex, V.; Midgley, P.M. (Eds.) Intergovernmental Panel on Climate Change (IPCC), Climate Change 2013: The Physical Science Basis:Working Group I Contribution to the Fifth Assessment Report of the Intergovernmental Panel on Climate Change; Cambridge University Press: New York, NY, USA, 2014; ISBN 978-1-107-05799-9. [Google Scholar]
- Bond, T.C.; Doherty, S.J.; Fahey, D.W.; Forster, P.M.; Berntsen, T.; De Angelo, B.J.; Flanner, M.G.; Ghan, S.; Kärcher, B.; Koch, D.; et al. Bounding the role of black carbon in the climate system: A scientific assessment. J. Geophys. Res. 2013, 118, 5380–5552. [Google Scholar] [CrossRef]
- Jiang, H.; Feingold, G. effect of aerosol on warm convective clouds: Aerosol-cloud-surface flux feedbacks in a new coupled large-eddy model. J. Geophys. Res. 2006, 111, D01202. [Google Scholar] [CrossRef]
- Fan, J.; Zhang, R.; Li, G.; Tao, W.-K.; Li, X. Simulations of cumulus clouds using a spectral microphysics cloud-resolving model. J. Geophys. Res. 2007, 112, D04201. [Google Scholar] [CrossRef]
- Ramanathan, V.; Chung, C.; Kim, D.; Bettge, T.; Buja, L.; Kiehl, J.T.; Washington, W.M.; Fu, Q.; Sikka, D.R.; Wild, M. Atmospheric brown clouds: Impacts on South Asian climate and hydrological cycle. Proc. Natl. Acad. Sci. USA 2005, 102, 5326–5333. [Google Scholar] [CrossRef] [Green Version]
- Vinoj, V.; Rasch, P.J.; Wang, H.; Yoon, J.H.; Ma, P.L.; Landu, K.; Singh, B. Short-term modulation of Indian summer monsoon rainfall by West Asian dust. Nat. Geosci. 2014, 7, 308–313. [Google Scholar] [CrossRef]
- Lau, K.M.; Kim, M.K.; Kim, K.M.; Lee, W.S. Enhanced surface warming and accelerated snowmelt in the Himalayas and Tibetan Plateau induced by absorbing aerosols. Environ. Res. Lett. 2010, 5, 025204. [Google Scholar] [CrossRef]
- Guleria, R.P.; Kuniyal, J.C.; Rawat, P.S.; Thakur, H.K.; Sharma, M.; Sharma, N.L.; Mahavir, S.; Chand, K.; Sharma, P.; Thakur, A.K.; et al. Aerosols optical properties in dynamic atmosphere in the northwestern part of the Indian Himalaya: A comparative study from ground and satellite-based observations. Atmos. Res. 2011, 101, 726–738. [Google Scholar] [CrossRef]
- Lau, K.M.; Kim, K.M.; Kim, M.K. Asian monsoon anomalies induced by aerosol direct forcing: The role of the Tibetan Plateau. Clim. Dyn. 2006, 26, 855–864. [Google Scholar] [CrossRef] [Green Version]
- Guleria, R.P.; Kuniyal, J.C.; Rawat, P.S.; Sharma, N.L.; Thakur, H.K.; Dhyani, P.P.; Singh, M. The assessment of aerosol optical properties over Mohal in the northwestern Indian Himalaya using satellite and ground based measurements and an influence of aerosol transport on aerosol radiative forcing. Meteorol. Atmos. Phys. 2011, 113, 1530169. [Google Scholar] [CrossRef]
- Guleria, R.P.; Kuniyal, J.C.; Rawat, P.S.; Thakur, H.K.; Sharma, M.; Sharma, N.L.; Dhyani, P.P.; Singh, M. Validation of MODIS retrieval aerosol optical depth and an investigation on aerosol transport over Mohal in the northwestern Indian Himalaya. Int. J. Remote Sens. 2012, 33, 5379–5401. [Google Scholar] [CrossRef]
- Guleria, R.P.; Kuniyal, J.C.; Dhyani, P.P. Validation of space-born Moderate Resolution Imaging Spectroradiometer remote sensors aerosol products using application of ground-based Multi-wavelength Radiometer. Adv. Space Res. 2012, 50, 1391–1404. [Google Scholar] [CrossRef]
- Guleria, R.P.; Kuniyal, J.C. Characteristics of atmospheric aerosol particles and their role in aerosol radiative forcing over northwestern Indian Himalaya in particular and over India in general. Air Qual. Atmos. Health 2015, 9, 795–808. [Google Scholar] [CrossRef]
- Sellegri, K.; Laj, P.; Venzac, H.; Boulon, J.; Picard, D.; Villani, P.; Vuillermoz, E.; Bonasoni, P.; Marinoni, A.; Cristofanelli, P. Seasonal variations of aerosol size distributions based on long-term measurements at the high altitude Himalayan site of Nepal Climate Observatory-Pyramid (5079 m), Nepal. Atmos. Chem. Phys. 2010, 10, 10679–10690. [Google Scholar] [CrossRef] [Green Version]
- Pant, P.; Hegde, P.; Dumka, U.C.; Sagar, R.; Satheesh, S.K.; Moorthy, K.K.; Saha, A.; Srivastava, M.K. Aerosol characteristics at a high- altitude location in central Himalayas: Optical properties and radiative forcing. J. Geophys. Res. 2006, 111, D17206. [Google Scholar] [CrossRef] [Green Version]
- Bianchi, F.; Kurtén, T.; Riva, M.; Mohr, C.; Rissanen, M.P.; Roldin, P.; Berndt, T.; Crounse, J.D.; Wennberg, P.O.; Mentel, T.F.; et al. Highly Oxygenated Organic Molecules (HOM) from Gas-Phase Autoxidation Involving Peroxy Radicals: A Key Contributor to Atmospheric Aerosol. Chem. Rev. 2019, 119, 3472–3509. [Google Scholar] [CrossRef] [PubMed] [Green Version]
- Yamada, T.; Shiraiwa, T.; Iida, H.; Kadota, T.; Watanabe, T.; Rana, B.; Ageta, Y.; Fushimi, H. Fluctuations of the glaciers from the 1970s to 1989 in the Khumbu, Shorong and Langtang regions, Nepal Himalayas. Bull. Glacier Res. 1992, 10, 11–19. [Google Scholar]
- Shrestha, A.B.; Wake, C.P.; Mayewski, P.A.; Dibb, J.E. Maximum temperature trends in the Himalaya and its vicinity: An analysis based on temperature records from Nepal for the period 1971–94. J. Clim. 1999, 12, 2775–2786. [Google Scholar] [CrossRef] [Green Version]
- Hasnain, S.I. Himalayan glaciers meltdown: Impact on South Asian rivers. In FRI 2002–Regional Hydrology: Bridging the Gap between Research and Practice; van Lanen, H.A.J., Demuth, S., Eds.; IAHS Publication: Wallingford, UK, 2002; Volume 274, pp. 417–423. Available online: http://hydrologie.org/redbooks/a274/iahs_274_417.pdf (accessed on 17 September 2021).
- Holben, B.N.; Eck, T.F.; Slutsker, I.; Tanre, D.; Buis, J.P.; Setzer, E.; Vermote, E.; Reagan, J.A.; Kaufman, J.A.; Nakajima, T.; et al. AERONET-a federated instrument network and data archive for aerosol characterization. Remote Sens. Environ. 1998, 66, 1–16. [Google Scholar] [CrossRef]
- Sheel, V.; Guleria, R.P.; Ramachandran, S. Global and regional evaluation of a global model simulated AODs with AERONET and MODIS observations. Int. J. Climatol. 2017, 38, 269–289. [Google Scholar] [CrossRef]
- Remer, L.A.; Kaufman, Y.J.; Tanre, D.; Tanre, D.; Mattoo, S.; Chu, D.A.; Martins, J.V.; Li, R.R.; Ichoku, C.; Levy, R.C.; et al. The MODIS aerosol algorithm, products and validation. J. Atmos. Sci. 2005, 62, 947–973. [Google Scholar] [CrossRef] [Green Version]
- Aloysius, M.; Mohan, M.; Parameswaran, K.; George, S.K.; Nair, P.R. Aerosol transport over the Gangetic basin during ISRO-GBP land campaign-II. Ann. Geophys. 2008, 26, 431–440. [Google Scholar] [CrossRef]
- Kim, S.W.; Yoon, S.C.; Jefferson, A.; John, A.; Ogren, E.G.D.; Won, J.G.; Young, S.G.; Byung, L.; Hand, J.S. Aerosol optical, chemical and physical properties at Gosan, Korea during Asian dust and pollution episodes in 2001. Atmos. Environ. 2005, 39, 39–50. [Google Scholar] [CrossRef]
- Ricchiazzi, P.; Yang, S.; Gautier, C.; Sowle, D. SBDART: A Research and Teaching software tool for plane-parallel radiative transfer in the Earth’s Atmosphere. Bull. Am. Meteorol. Soc. 1998, 79, 2101–2114. [Google Scholar] [CrossRef] [Green Version]
- Hess, M.; Koepke, P.; Schult, I. Optical properties of aerosols and clouds: The software package OPAC. Bull. Am. Meteorol. Soc. 1998, 79, 831–844. [Google Scholar] [CrossRef]
- Lau, K.M.; Kim, K.M.; Hsu, C.N.; Holben, B.N. Possible influences of air pollution, dust and sandstorms on the Indian monsoon. WMO Bull. 2009, 58, 22–30. [Google Scholar]
- Bevan, S.L.; North, P.R.J.; Grey, W.M.F.; Los, S.O.; Plummer, S.E. Impact of atmospheric aerosol from biomass burning on Amazon dry-season drought. J. Geophys. Res. 2009, 114. [Google Scholar] [CrossRef] [Green Version]
- Levinson, D.H.; Lawrimore, J.H. State of the Climate in 2007; Arguez, A., Diamond, H.J., Fetterer, F., Horvitz, A., Levy, J.M., Eds.; World Meteorological Organization, 2009; pp. 1–193. Available online: https://library.wmo.int/doc_num.php?explnum_id=9763 (accessed on 17 September 2021).
- Kaskaoutis, D.; Rashki, G.; Houssos, E.E.; Goto, D.; Nastos, P.T. Extremely high aerosol loading over Arabian Sea during June 2008: The specific role of the atmospheric dynamics and Sistan dust storms. Atmos. Environ. 2014, 94, 374–384. [Google Scholar] [CrossRef]
- Pandya, M.R.; Singh, R.P.; Dadhwal, V.K. A signal of increased vegetation activity of India from 1981 to 2001 was observed using satellite-derived fraction of absorbed photosynthetically active radiation. Curr. Sci. 2004, 87, 1122–1126. [Google Scholar]
- Venkataraman, C.; Habib, G.; Eiguen-Fernandez, A.; Miguel, A.H.; Friedlander, S.K. Residential biofuels in South Asia: Carbonaceous aerosol emissions and climate impacts. Science 2005, 307, 1454–1456. [Google Scholar] [CrossRef] [Green Version]
- Schuster, G.L.; Dubovik, O.; Holben, B.N. Ångström exponent and bimodal aerosol size distributions. J. Geophys. Res. 2006, 111. [Google Scholar] [CrossRef] [Green Version]
- Gautam, R.; Hsu, N.C.; Lau, K.M.; Kafatos, M. Aerosol and rainfall variability over the Indian monsoon region: Distributions, trends and coupling. Ann. Geophys. 2009, 27, 3691–3703. [Google Scholar] [CrossRef]
- Singh, R.P.; Dey, S.; Tripathi, S.N.; Tare, V. Variability of aerosol parameters over Kanpur, northern India. J. Geophys. Res. 2004, 109. [Google Scholar] [CrossRef]
- Dubovik, O.; King, M.D. A flexible inversion algorithm for retrieval of aerosol optical properties from Sun and Sky Radiance. J. Geophys. Res. 2000, 105, 20673–20696. [Google Scholar] [CrossRef] [Green Version]
- Dubovik, O.; Holben, B.N.; Eck, T.F.; Smirnov, A.; Kaufman, Y.J.; King, M.D.; Tanré, D.; Slutsker, I. Variability of absorption and optical properties of key aerosol types observed in worldwide locations. J. Atmos. Sci. 2002, 59, 590–608. [Google Scholar] [CrossRef]
- Dey, S.; Tripathi, S.N.; Singh, R.P.; Holben, B.N. Influence of dust storms on the aerosol optical properties over the Indo-Gangetic basin. J. Geophys. Res. 2004, 109. [Google Scholar] [CrossRef] [Green Version]
- Prasad, A.K.; Singh, S.; Chauhan, S.S.; Srivastava, M.K.; Singh, R.P.; Singh, R. Aerosol radiative forcing over the Indo-Gangetic plains during major dust storms. Atmos. Environ. 2007, 41, 6289–6301. [Google Scholar] [CrossRef]
- Kumar, R. Characterization of Aerosol Optical Properties Using Satellite and Ground-Based Solar Radiation Extinction Studies over Indian Regions; Career Point University: Kota-Rajasthan, India, 2019; pp. 1–141. [Google Scholar]


Publisher’s Note: MDPI stays neutral with regard to jurisdictional claims in published maps and institutional affiliations. |
© 2021 by the authors. Licensee MDPI, Basel, Switzerland. This article is an open access article distributed under the terms and conditions of the Creative Commons Attribution (CC BY) license (https://creativecommons.org/licenses/by/4.0/).
Share and Cite
Chand, K.; Kuniyal, J.C.; Kanga, S.; Guleria, R.P.; Meraj, G.; Kumar, P.; Farooq, M.; Singh, S.K.; Nathawat, M.S.; Sahu, N.; et al. Aerosol Characteristics and Their Impact on the Himalayan Energy Budget. Sustainability 2022, 14, 179. https://doi.org/10.3390/su14010179
Chand K, Kuniyal JC, Kanga S, Guleria RP, Meraj G, Kumar P, Farooq M, Singh SK, Nathawat MS, Sahu N, et al. Aerosol Characteristics and Their Impact on the Himalayan Energy Budget. Sustainability. 2022; 14(1):179. https://doi.org/10.3390/su14010179
Chicago/Turabian StyleChand, Kesar, Jagdish Chandra Kuniyal, Shruti Kanga, Raj Paul Guleria, Gowhar Meraj, Pankaj Kumar, Majid Farooq, Suraj Kumar Singh, Mahendra Singh Nathawat, Netrananda Sahu, and et al. 2022. "Aerosol Characteristics and Their Impact on the Himalayan Energy Budget" Sustainability 14, no. 1: 179. https://doi.org/10.3390/su14010179
APA StyleChand, K., Kuniyal, J. C., Kanga, S., Guleria, R. P., Meraj, G., Kumar, P., Farooq, M., Singh, S. K., Nathawat, M. S., Sahu, N., & Kumar, R. (2022). Aerosol Characteristics and Their Impact on the Himalayan Energy Budget. Sustainability, 14(1), 179. https://doi.org/10.3390/su14010179