Article

High-Speed Rail Network Expansion and Its Impact on Regional Economic Sustainability in the Yangtze River Delta, China, 2009–2018

1
Nanjing Institute of Geography and Limnology, Chinese Academy of Sciences, Nanjing 210008, China
2
Key Laboratory of Watershed Geographic Sciences, Chinese Academy of Sciences, Nanjing 210008, China
3
Zhejiang Development & Planning Institute, Hangzhou 310012, China
*
Author to whom correspondence should be addressed.
Sustainability 2022, 14(1), 155; https://doi.org/10.3390/su14010155
Submission received: 7 November 2021 / Revised: 22 December 2021 / Accepted: 22 December 2021 / Published: 24 December 2021
(This article belongs to the Topic Climate Change and Environmental Sustainability)

Abstract

:
The rapid expansion of high-speed rail (HSR) has significantly improved spatial accessibility and connectivity efficiency, and affected the reallocation of spatial resources and regional economic sustainability. This study examined 40 prefecture-level (or above) cities in the Yangtze River Delta (YRD) region, and explored the evolution process of the HSR service network and its impact on the sustainability of economic development. The research results show that: (1) From the perspective of intercity travel time and service connections from 2009 to 2018, the rapid development of HSR has increased the city’s rail accessibility by about 50%, leading to closer intercity connections. (2) There are obvious regional differences in the effect of HSR on urban functional levels and the intensity of inter-city connections. Compared with 2009, the central cities play a greater role as transportation hubs in 2018, creating a significant Matthew effect of accumulated advantage. (3) The distribution pattern of regional urban intensity index is uneven, and the difference in urban intensity index in 2018 is significantly greater than that in 2009. (4) The evolution of the HSR network has significantly affected regional economic development, especially the development of tertiary industry, and increased the polarization of economic development in the YRD. This research can provide a certain reference for regional sustainable development.

1. Introduction

Mass transit is an important link between regional activities and an important supporting system for urban development. It determines the degree and scope of regional interconnection. Every change in transportation technology and transit mode has profoundly affected urban spatial structure and development [1]. In the modern rail transit era, the rapid development of rail transit, such as trains and trolley buses, has provided the main driving force for urban expansion. The agglomeration and diffusion effects of rail transit have jointly shaped the evolution of urban spatial forms [2]. The innovation of transit modes is closely related to the evolution of regional spatial structure. In China, with the acceleration of urbanization, reachable distance and speed of rail transit have greatly increased, and the relationship between changes in rail networks and the evolution of urban spatial patterns and regional industrial structures has become increasingly obvious [3,4]. HSR has become an important factor in the rapid development of Chinese cities and a key driving force for major changes in the spatial pattern and industrial structure of Chinese cities and regions. The changes are expected to continue in the future [5]. The national comprehensive three-dimensional transportation network planning outline (2021–2050) proposes that by 2035, a modern and high-quality comprehensive national comprehensive three-dimensional transportation network that is convenient, smooth, cost-effective, green, intensive, intelligent, advanced, safe and reliable will be basically completed. During this period, HSR will play an important role.
HSR greatly shortens the travel time between cities, reduces the travel time cost of residents, and significantly accelerates the cross-space flow of people, logistics, capital, and information. [2,6,7]. In addition, the distance factor that people consider for travel has changed. For example, people may seek to meet their needs in other cities and are more willing to accept the different lifestyles of the cities where they live and the cities where they work, which promotes co-urbanization [8,9,10]. In addition, HSR has increased the obvious axial connection between cities, because there are relatively more connections between cities along the high-speed rail, and stronger economic ties have been established between cities [11]. However, high-speed rail has a regionally uneven temporal and spatial convergence effect, which may lead to “siphoning” and “filtering” phenomena [12,13,14,15]. Holl (2007) and Gutiérrez et al. (1996) found that the nature of HSR accessibility has produced a kind of “tunneling effect”, turning the original “loop” accessibility model into a “band” or “island” model [16,17]. Preston et al. (2006) found that relatively small cities benefitted from the HSR much less than the larger cities in those regional centers [18]. He (2011) pointed out that the benefits of HSR construction to large and small cities are more than that for medium-sized cities [19]. Therefore, the difference in “relative location” conditions has a certain influence on the reconstruction of urban and regional spatial structure [20,21]. The “time-space compression” effect of HSR changes intercity accessibility, triggers the flow and re-allocation of various resources in the region, reshapes the regional urban system, reorganizes regional industries, and integrates regional economies [22,23].
To date, many studies have analyzed the impact of mass transit accessibility on the economy [24,25,26] and population distribution [27]. Givoni (2006) found that the HSR has promoted the development of leisure and business tourism in major British cities, thereby promoting the development of social service industries [28]. Kotavaara et al. (2011) studied the relationship between land accessibility and demographic change in Finland over the past 40 years and found that the population tends to be concentrated in areas with high spatial accessibility [29]. In addition, the new HSR is expected to promote the development of urban high-tech and public-oriented construction, thereby increasing employment opportunities for local residents [30,31]. HSR is also expected to drive the rapid development of tourism along the railway and the establishment of business services near stations [30]. The area near the HSR station is usually developed into a mixed function area that promotes population and economic growth, accelerates the adjustment of land use structure, and accelerates the transformation of urban space [32,33].
China’s current national strategy in the YRD takes infrastructure and service interconnection as the starting points to promote regional integration. Improving spatial connectivity may effectively reduce economic distance and various mobility costs. It may also provide strong support for the efficient integration of regional resources and the acceleration of regional economy integration. In 2018, the YRD region has nearly 20 HSR lines, connecting 33 in the region with a networked HSR system. Its well-established HSR circle centers on Shanghai, Nanjing, Hangzhou, and Hefei, and the travel time is approximately 0.5 to 3.0 h. The capabilities of Shanghai, Nanjing, Hangzhou, and Hefei as regional gateways have been greatly enhanced by the radiation and siphon effect of the central cities that coexist in the region. To better promote the development of regional integration and optimize the HSR service network, it is necessary to comprehensively analyze the impact of HSR development on spatial development changes. To this end, we quantitatively measured the changes in the HSR network in the YRD region and t its impact on regional development and changes. Using a network analysis and improved production function models, the study aimed to ascertain the empirical support required for regional planning, HSR planning, and to support the decision-making of regional comprehensive development. The main research content of the article is as follows: (1) to analyze the impact of HSR service changes during the past 10 years on the evolution of spatial structure and the sustainability of economic development in the Yangtze River Delta (YRD) region; (2) to use the perspective of “flow space” to evaluate the empirical evidence that promotes the development of regional economic integration the YRD region; (3) to analyze the evolution of mass transit, particularly HSR, and its effect on the sustainable development of urban agglomerations.

2. Materials and Methods

2.1. Study Area

The YRD is located on the east coast of China, and its regions include Shanghai, Jiangsu, Zhejiang, and Anhui. The total area is 359,000 square kilometers and the permanent population is 220 million, including about 26% and 6% of the country, respectively. The Gross Domestic Product (GDP) is about CNY 19.5 trillion, accounting for almost a quarter of the country’s, and it is a strategically important area for China’s overall development. In 2009, the YRD had only a few HSR services, but with the rapid expansion of the HSR network in the past decade, the YRD region has now become the region with the longest operating mileage, the most lines, the densest stations, and the largest traffic volume in China. In 2018, the Yangtze River Delta’s high-speed rail operating mileage was 3678.80 km, and the annual passenger volume exceeded 600 million passengers, making it the world’s largest high-speed rail urban agglomeration. Therefore, the region has important value for studying the impact of high-speed rail services on regional economic development. It is worth noting that the geographic area of this study includes 40 cities above the prefecture level, including Shanghai and many other cities in Jiangsu, Zhejiang, and Anhui provinces. However, we exclude Zhoushan City (Zhejiang Province) because it is not yet part of the national high-speed rail network.

2.2. Data Sources

This study uses data on travel time and the number of train services between two cities to measure the intensity of the intercity connection of mass transit HSR in the YRD region. Data for 2009 were derived from the updated April 2009 train schedules of Hubei Xiangfan Sky Technology. The data for 2018 were obtained in October 2018 from Ctrip.com, China’s largest travel website. Demographic and economic data were from 2017. The demographic and economic data comes from the 2010 and 2018 statistical yearbooks of Zhejiang, Jiangsu, Anhui, and Shanghai, and some from the 2010 and 2018 statistical yearbooks of another 40 cities. Because Chaohu City (Anhui Province) was separated from the other prefecture-level cities in 2011, and the original administrative areas individually absorbed into Hefei City, Wuhu City, and Maanshan City, the 2009 Chaohu demographic and economic data were divided and merged into the data of the three cities into which they had incorporated in 2011.

2.3. Variables and Measurement

This study defines high-speed trains (G-head), multiple-unit trains (D-head), and intercity trains (C-head) as HSR. In order to determine the shortest travel time when there is a direct high-speed rail line between two given cities, the shortest travel time of all direct trains is considered to be the shortest travel time between the two cities. The total number of daily train services between two given cities is considered as train frequency. When there is no direct HSR line between two given cities, the shortest travel time between the two cities is represented by the shortest running time of the connected train provided by the website, and the number of trains is set to zero. As trains have different frequencies, and different frequency in the upstream and downstream directions, based on the high-speed rail conditions of 40 cities in the Yangtze River Delta region, a 40 × 40 shortest travel time matrix and a 40 × 40 frequency matrix (except for Zhoushan) have been established.

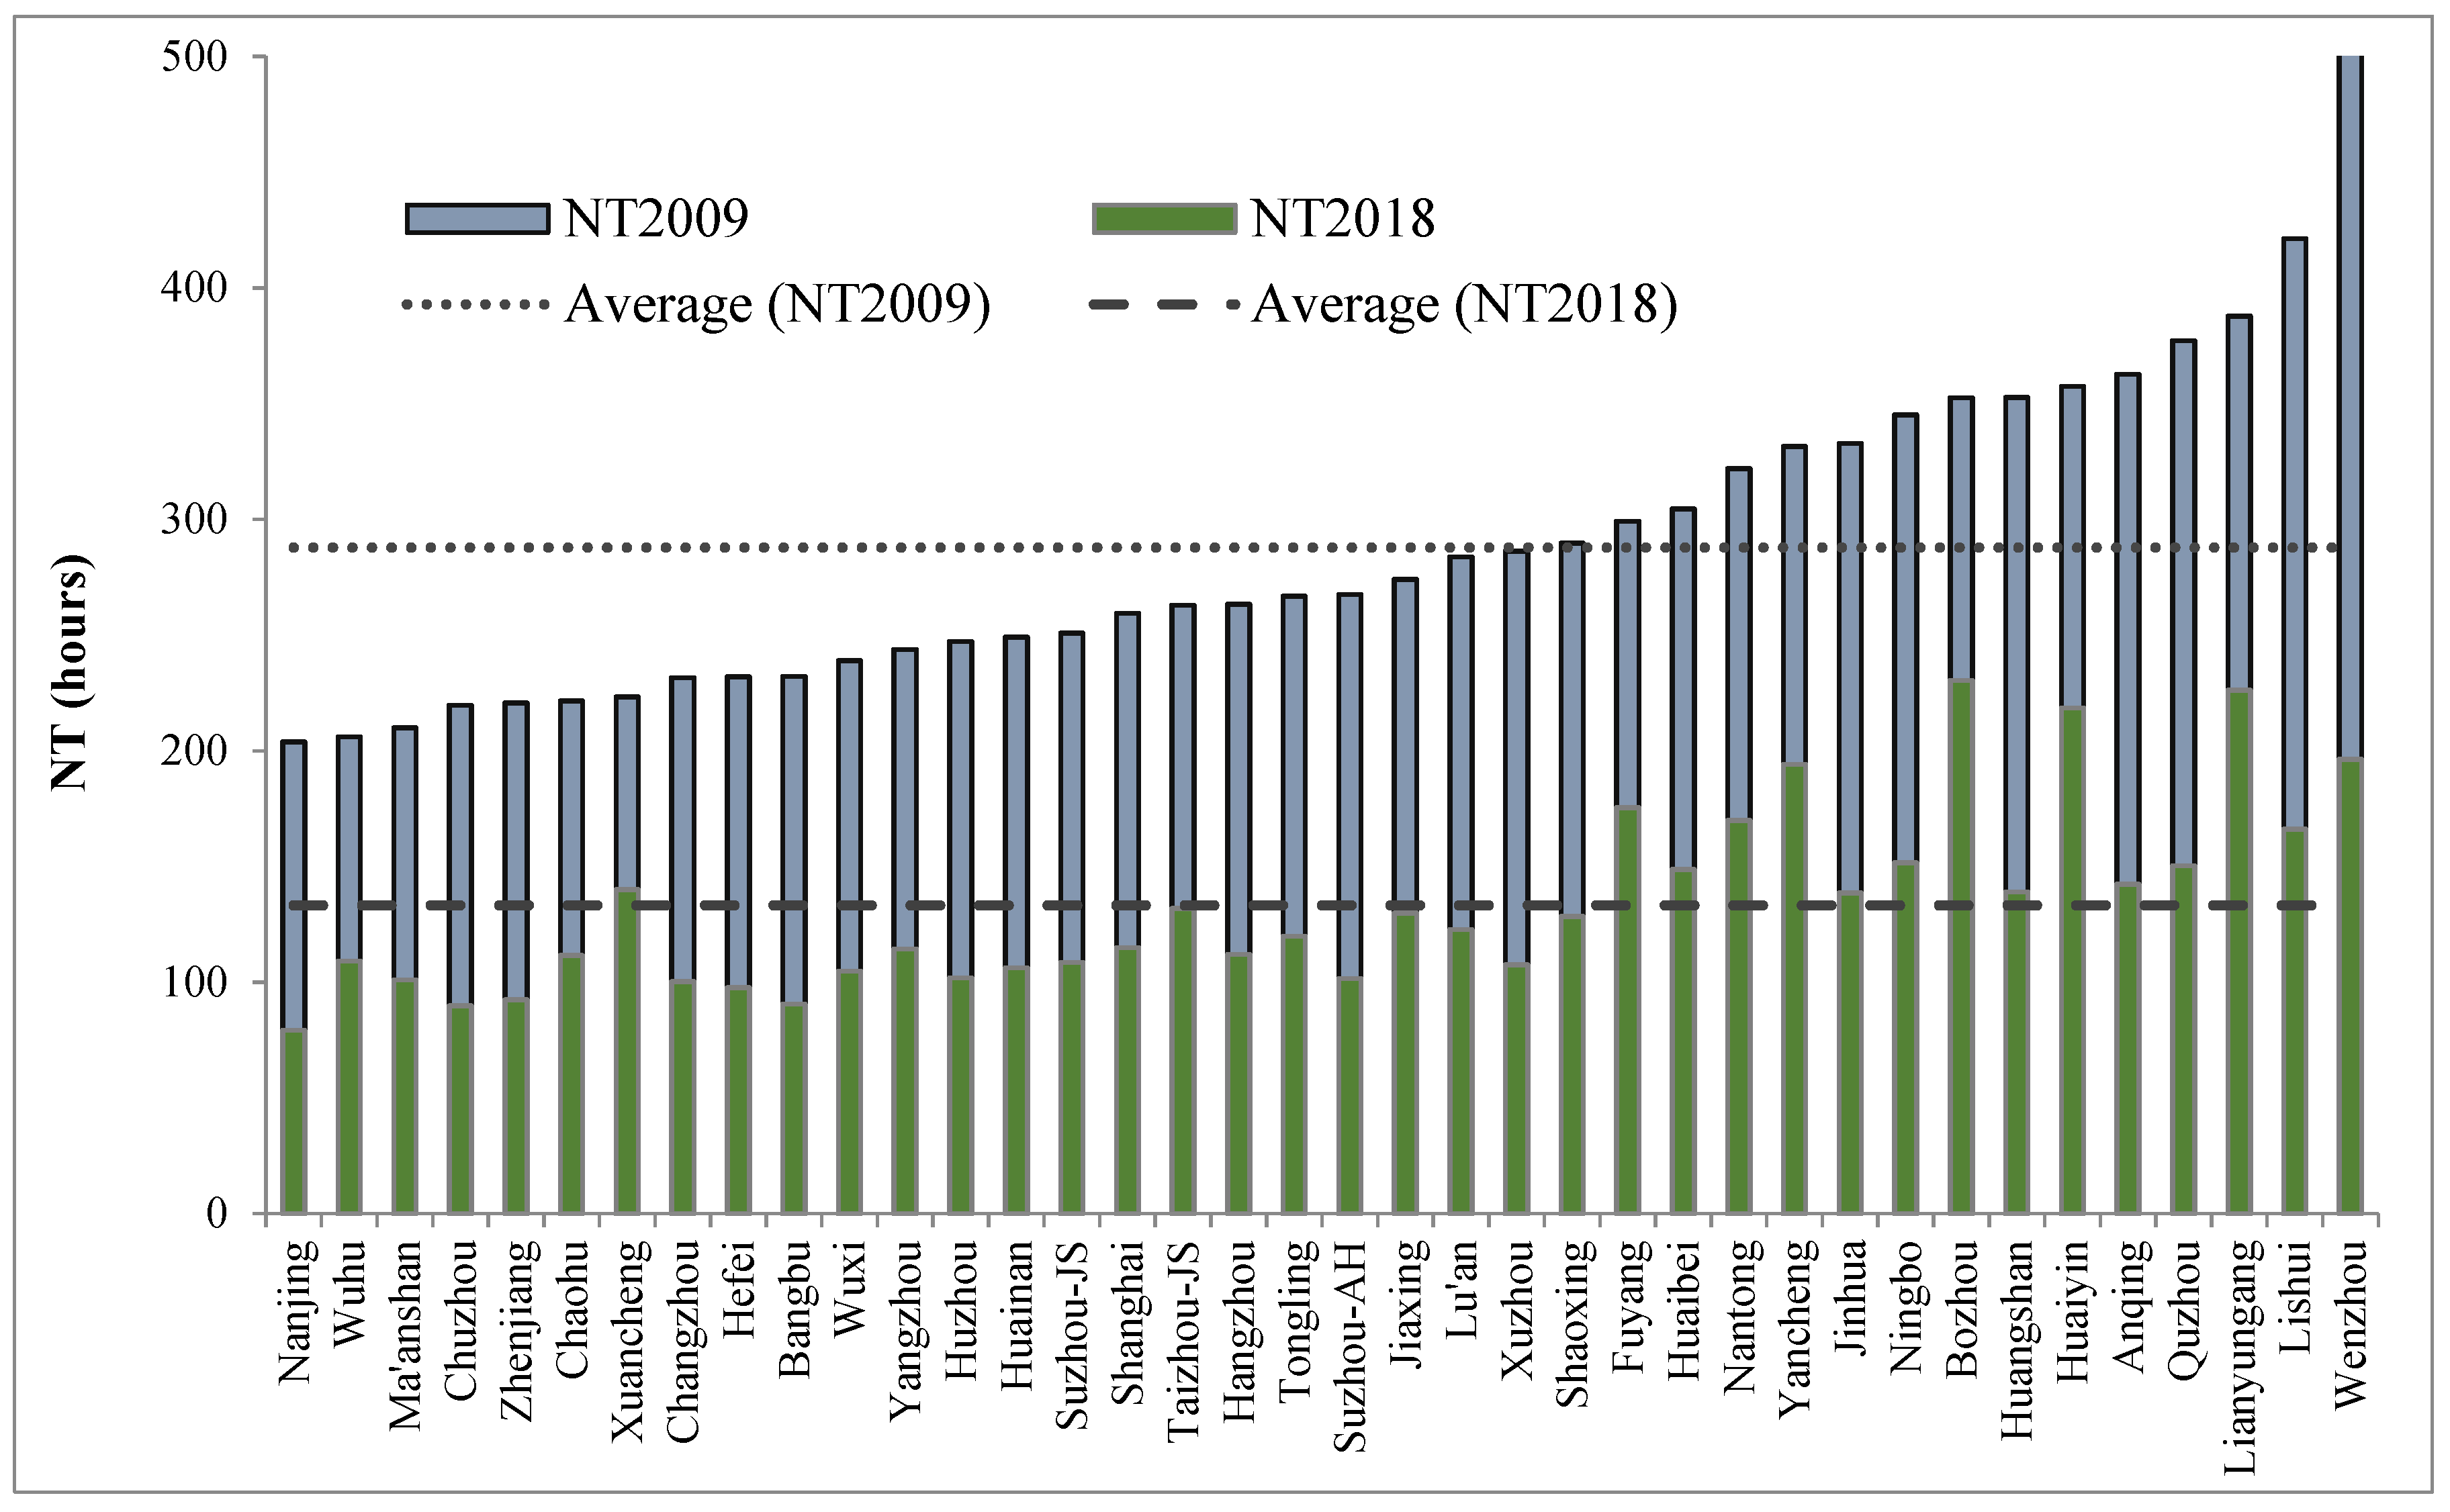
2.3.1. Network Travel Time

The accessibility of high-speed rail can be defined as the ability of an individual to reach a specific high-speed rail station in a specific time through a specific mode of transportation to enjoy high-speed rail services [19]. Traffic accessibility plays an important role in economic development and the spatial distribution of economic activities. A high level of accessibility is conducive to economic activity entities for expansion of their business abroad. There are many indexes to calculate traffic accessibility, among which a location-based accessibility measure is the most commonly used [18]. The calculation method is the ratio of the total travel time of a city to the total travel time of 40 central cities in the YRD (including Shanghai, provincial capital cities and prefecture-level cities served by HSR services). First, we calculated the average travel times ( T i j ) of HSR services between cities with direct HSR services [19,24]:
T i j = t i j / n
where tij and n represent the travel time and frequency of HSR services between city i and city j. Then, the network travel time (TTT; when there is no direct HSR, use the nearest transfer city and add 30 min) was calculated with the following formula:
N T i = m i n T i j
where j represents one of the 40 cities in the region, and NTi is the shortest total HSR travel time of city i to the other 39 cities. When there are multiple high-speed rail stations in a given city, we ignore the intra-city travel time between stations.

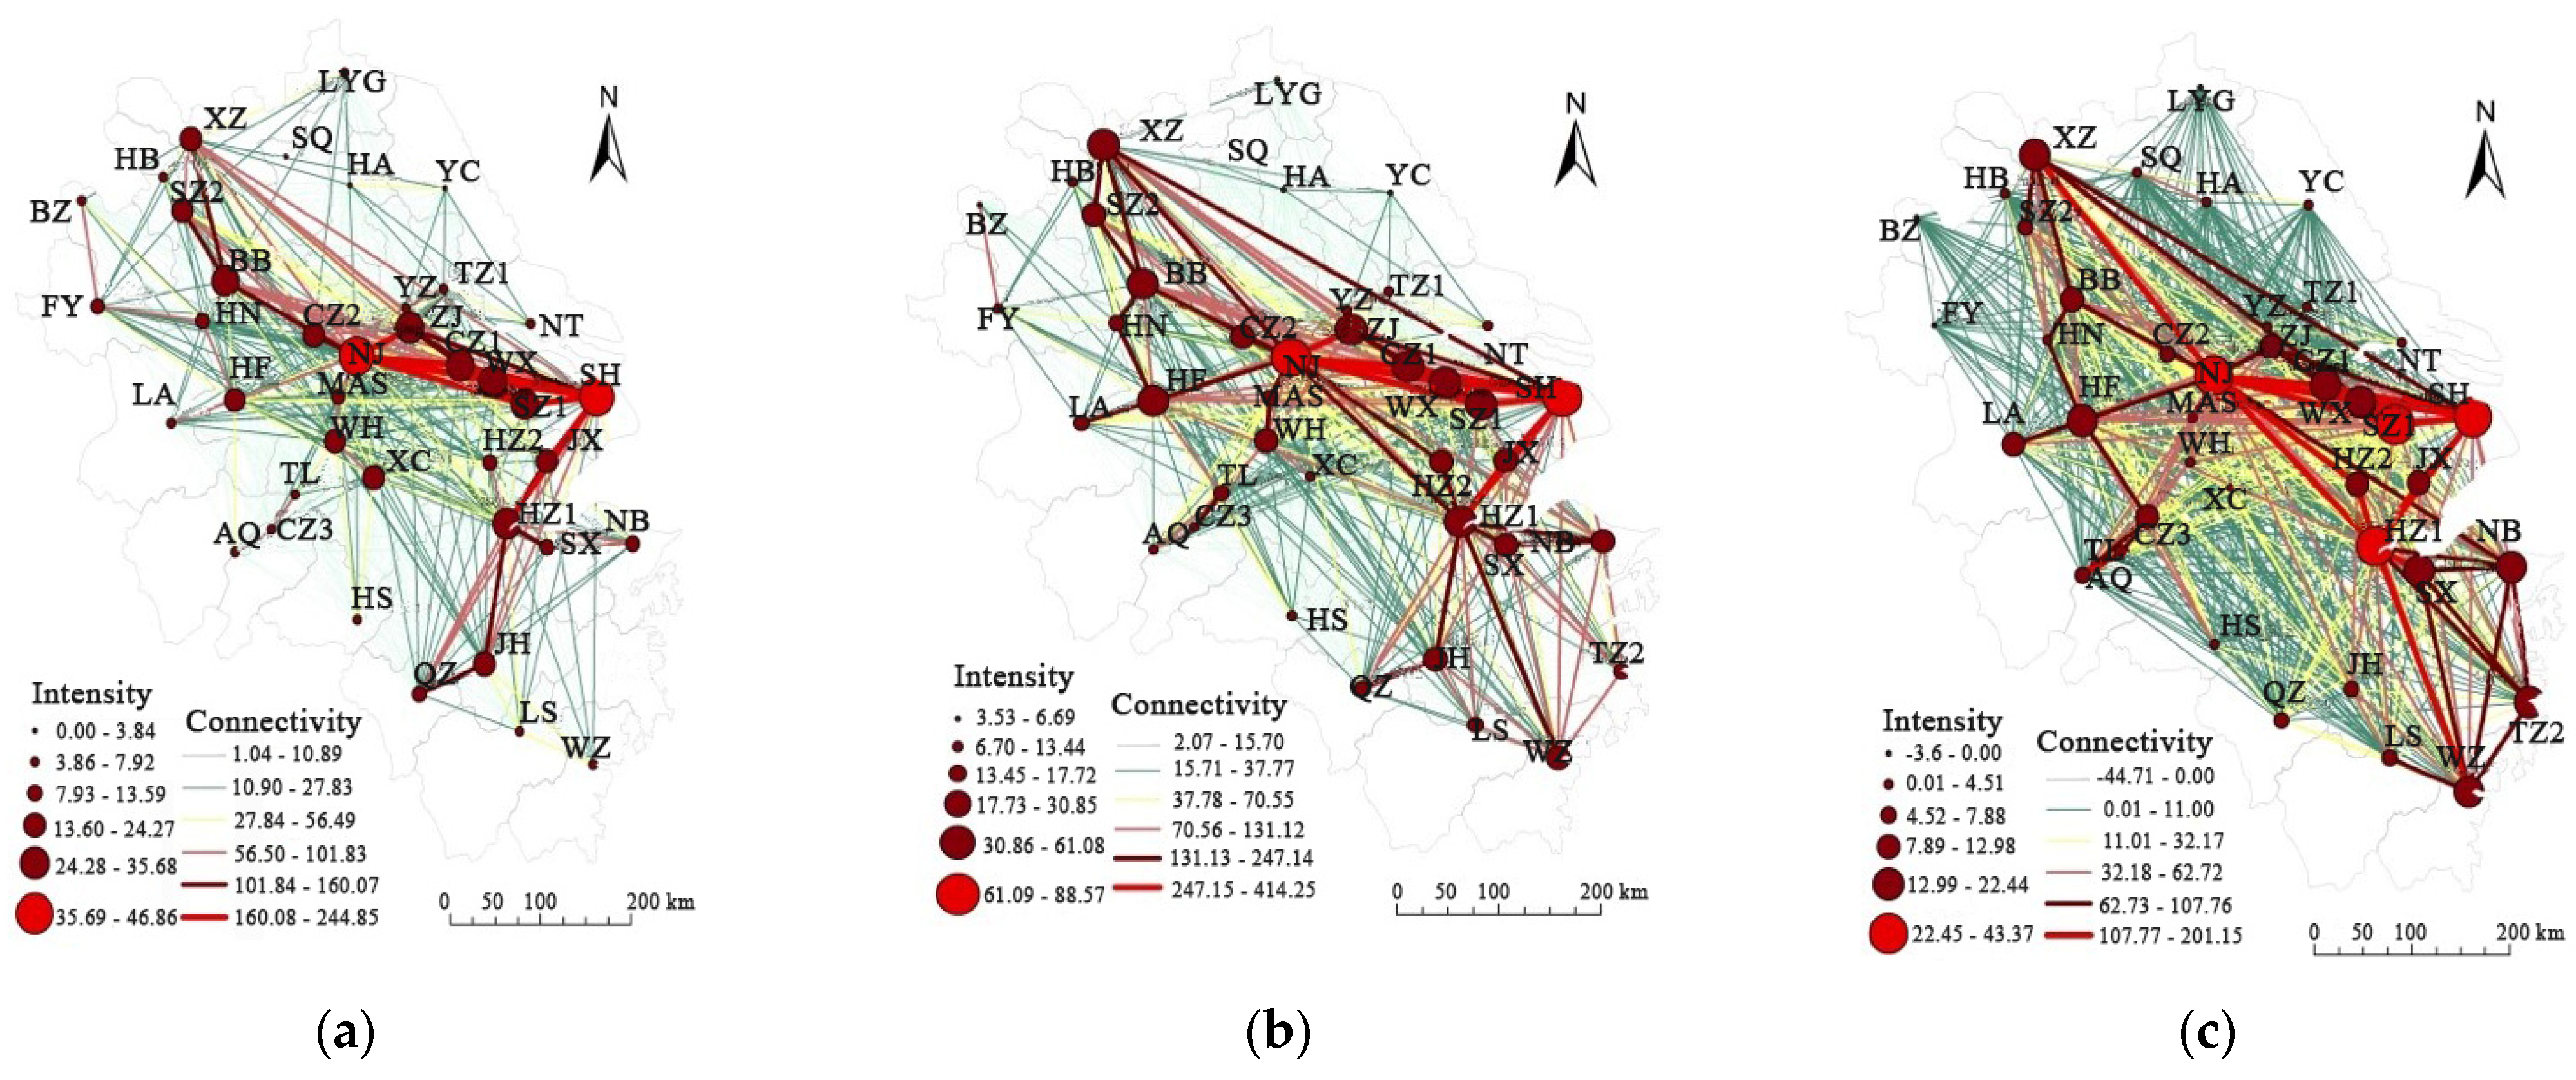
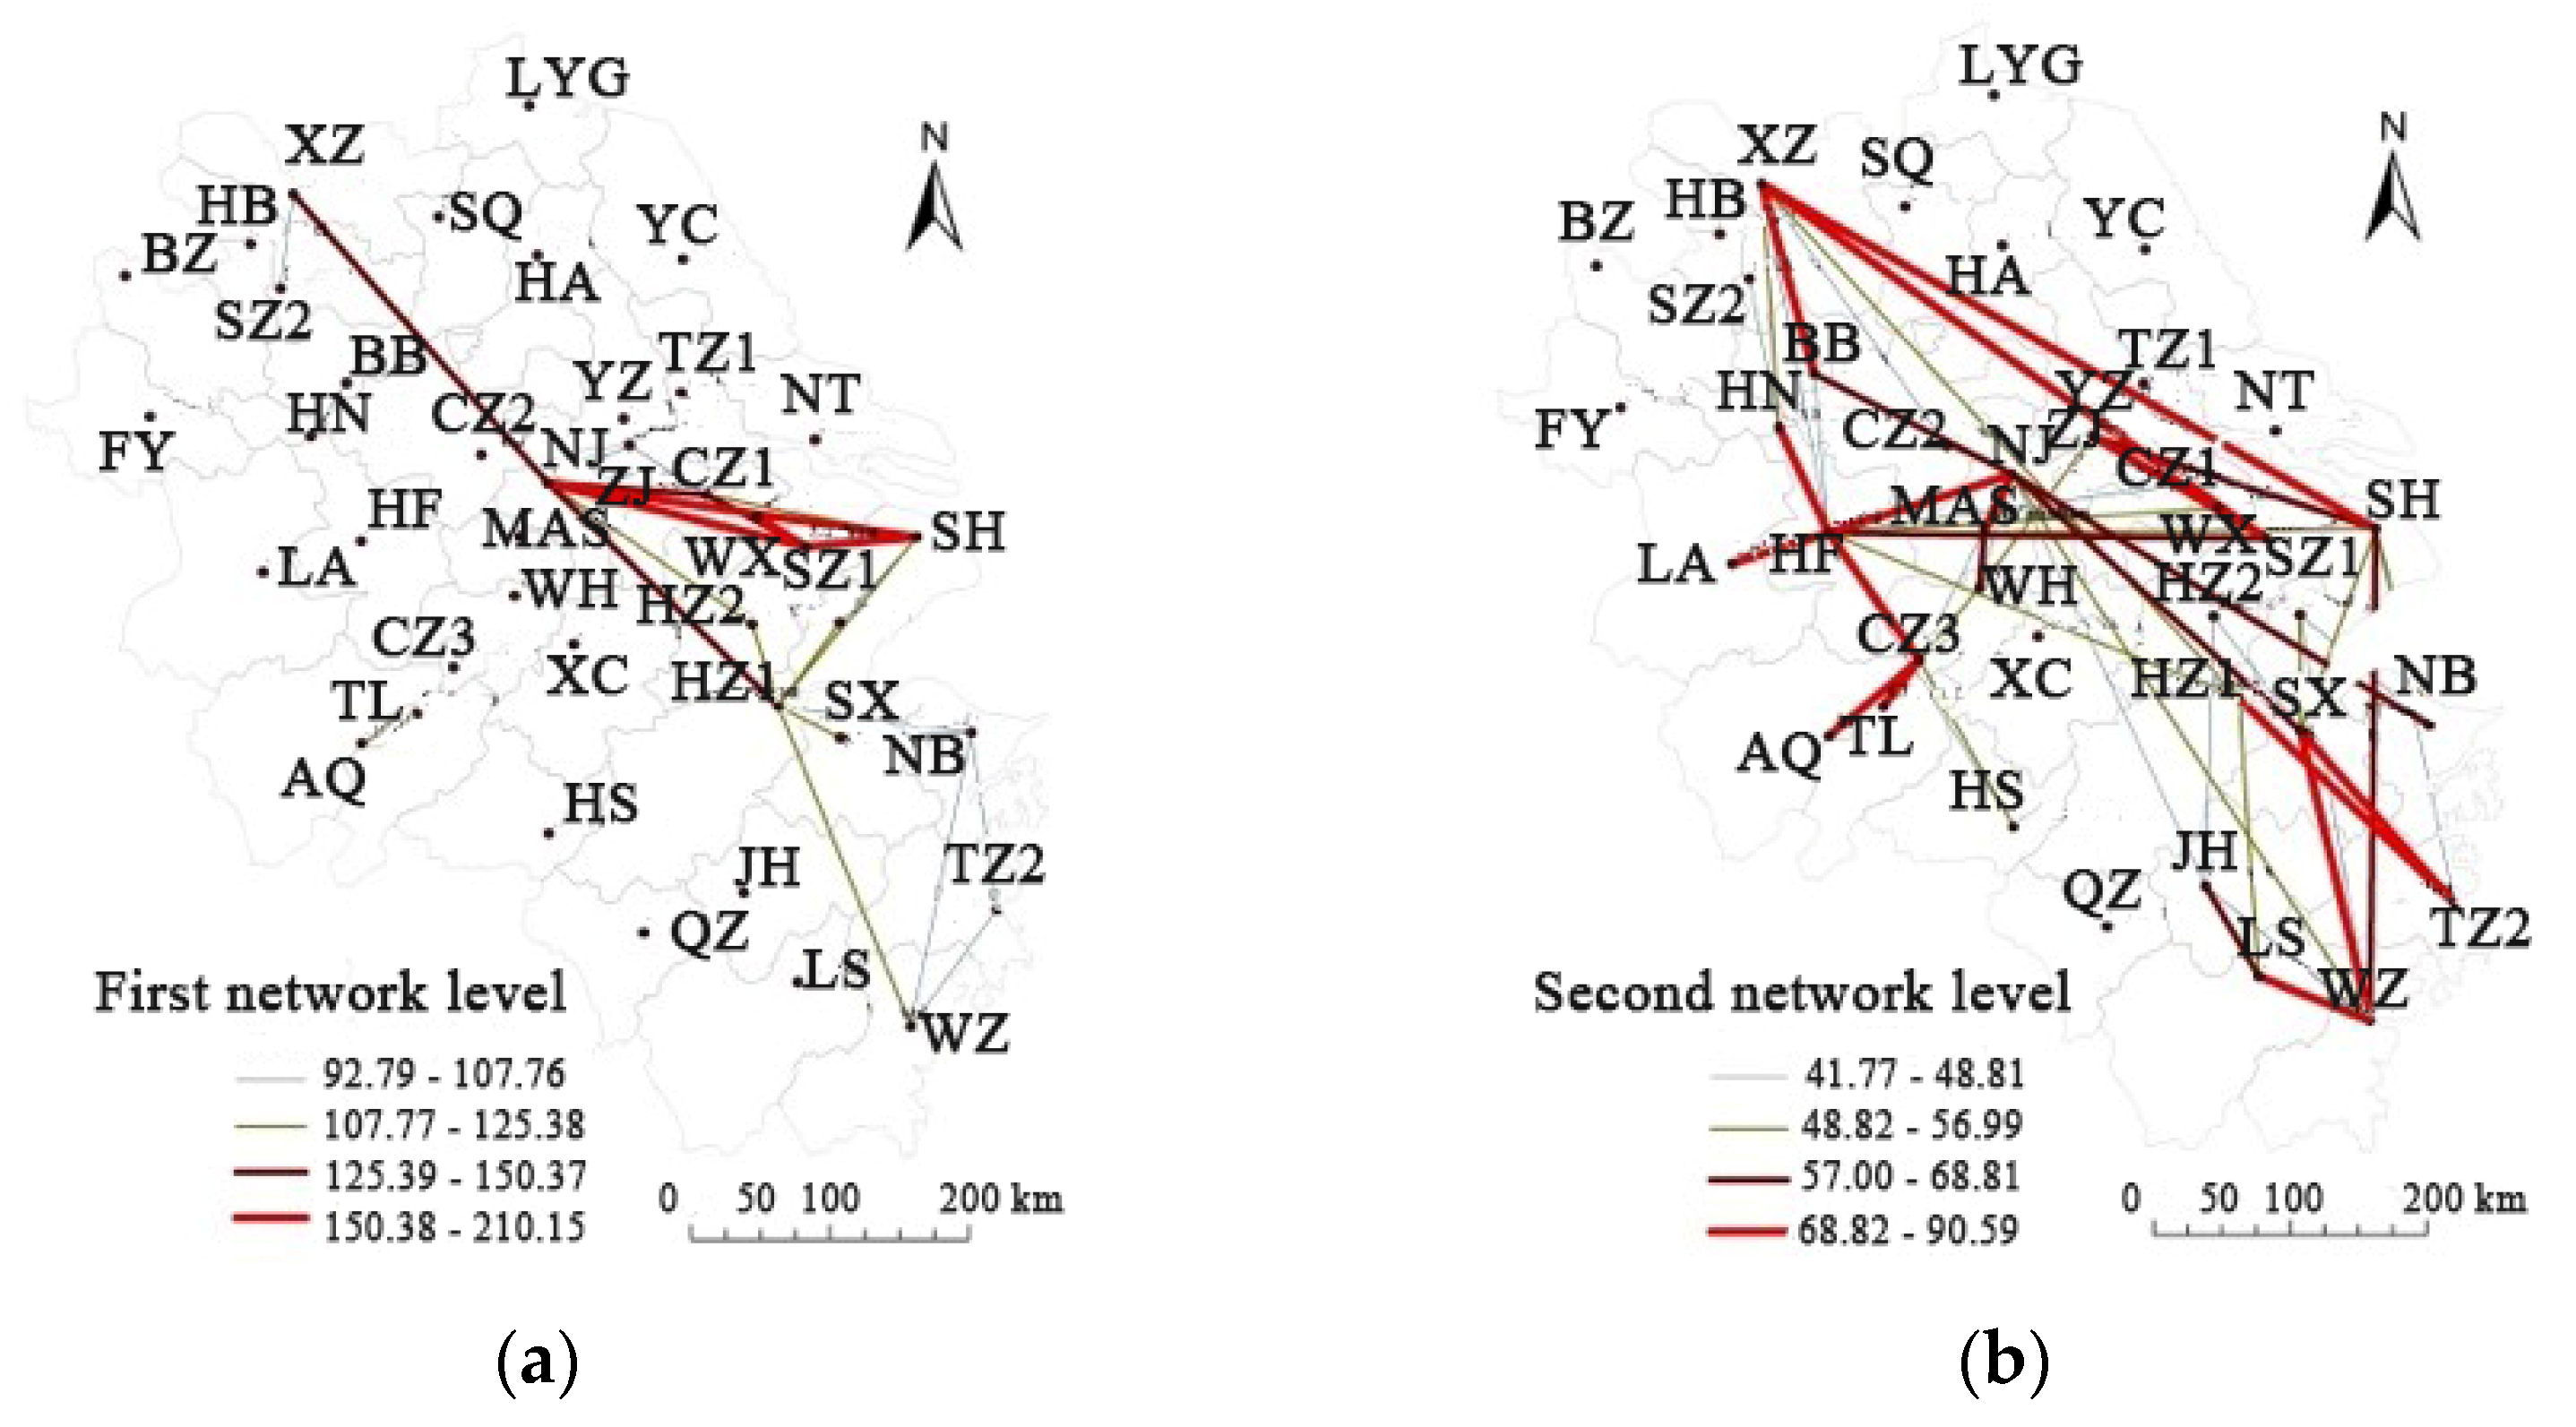
2.3.2. Network Connectivity

Compared with the traditional “static pattern” represented by the “gravity model” or “factor distribution” to describe the connections between cities, the “dynamic pattern” represented by streaming data should be more scientific and accurate, and should be closer to the nature of urban spatial relationships [34]. In the following formula, P i j represents the connection intensity between city i and city j based on HSR, T i j is the minimum travel time from city i to city j, T j i is the minimum travel time from city j to city i, S i j is the daily train number from city i to city j, and S j i is the daily train number from city j to city i. P i j reflects the intensity of the connection between cities regarding HSR. The share division of travel time and service frequency in intercity connection intensity is obtained from the expert scoring method in transportation sector. The larger the P i j , the stronger the connection between city i and city j, and vice versa:
P i j = w i × 100 ( T i j + T j i ) 2 + w j × ( S i j + S j i )
In the following formula, N T i represents the total daily train number between city i and all other cities, S i j is the daily train number between city i and city j, and S j i is the daily train number between city j and city i. S i indicates the extent to which a given city is connected with other cities; that is, the larger the value of S i , the stronger the city’s accumulated capacity within the regional HSR network:
N T i = j = 1 n 1 ( S i j + S j i )

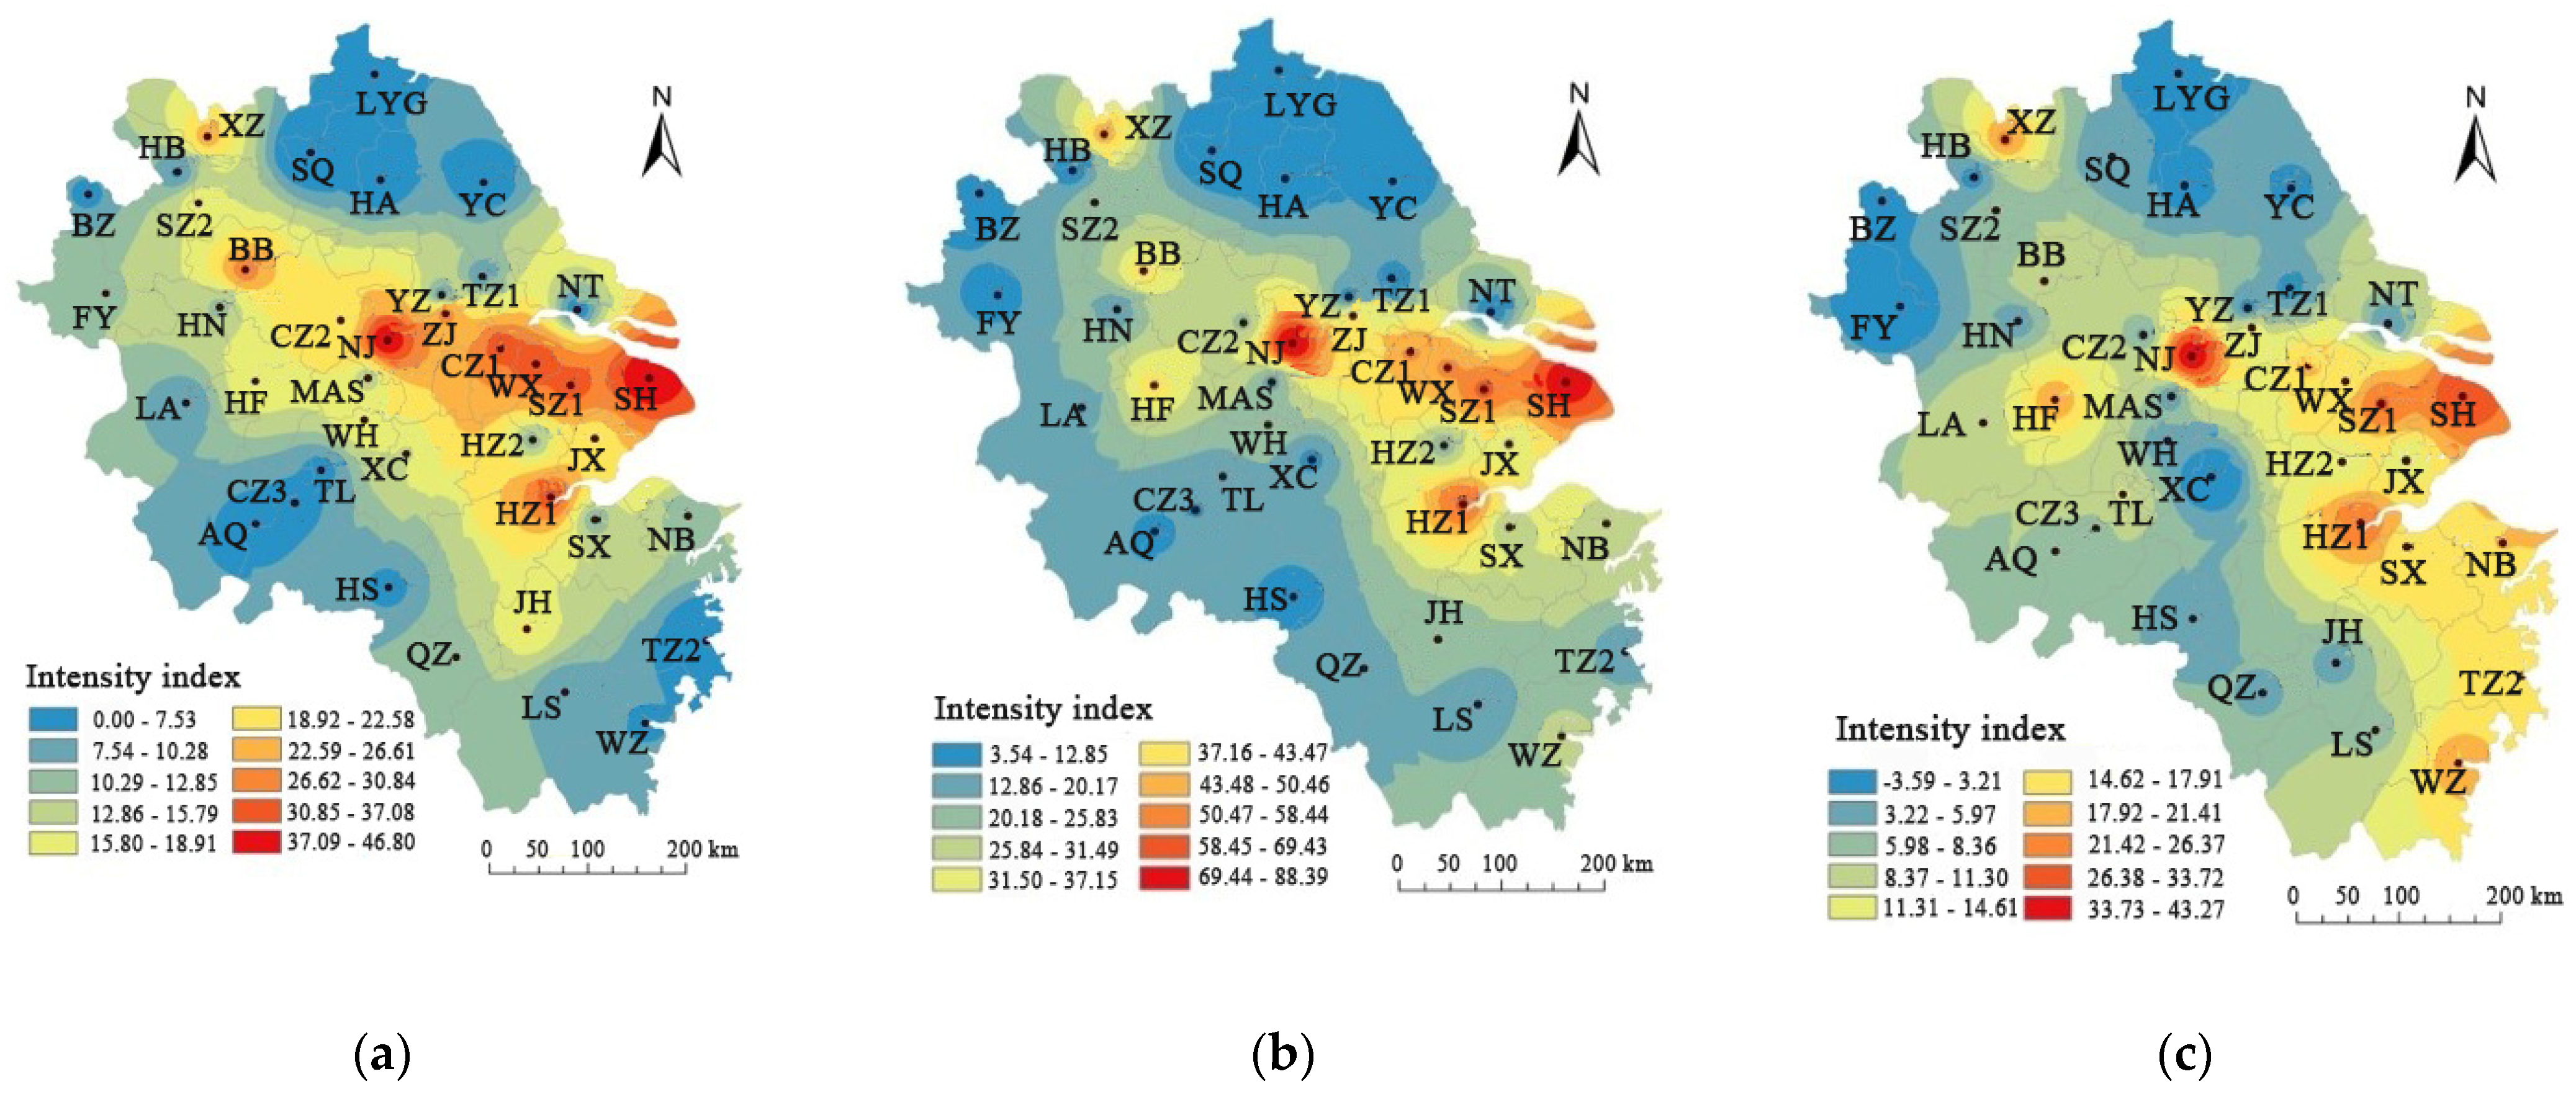
2.3.3. Urban Intensity Index of HSR Services

Previous studies usually used the total number of trains in a city to directly indicate the point intensity of the city. In this study, the accessibility measured by average minimum travel time (Ai) and the average number of trains (NTi) of city i were subjected to a similar weighted combination as the intercity connection intensity, and the resulting combined value is used as the point intensity of city i to precisely indicate each city’s rank within the regional HSR network [24]. The calculation was performed as follows:
P i = w i × 100 A i + w j × N T i n 1
In the following formula, P i denotes the point intensity of city i based on the HSR network, A i is the accessibility of average minimum travel time of city i, S i is the total daily train number between city i and all other cities, and n is the total number of cities in the region. The larger the value of P i , the greater the point intensity of city i relative to the HSR network. To enhance the comparability of the results and objectively reflect the intensity difference between the urban nodes in the area, the standardized point intensity coefficient is used to normalize the point intensity results. The point intensity coefficient is defined as the ratio of the point intensity of a city to the average point intensity of all cities in the area to eliminate the influence of the intensity of the city point. The equation used to calculate the point intensity coefficient is as follows:
  P i = P i P ¯ = P i i = 1 n P i / n
where   P i denotes the point intensity coefficient of city i in the region and P ¯ is the average point intensity of all cities in the region. When   P i is more than one, the point intensity of city i is above the regional average point intensity, and when   P i is less than one, the point intensity of city i is below the regional average. In order to objectively discover the uniformity of the urban point intensity distribution based on the high-speed rail network in 2009 and 2018, the standard deviation of the point intensity coefficient was generated, i.e., the coefficient of variation is also used in data analysis.

2.4. Regression Analysis of HSR Impacts on Economic Development Patterns

We use the classic production function to estimate the impact of accessibility and connection changes on economic development and industrial structure adjustment [30,34]. Extending the classic model by adding variables that measure energy consumption (E) and HSR development (HSR):
Y = f ( L ,   K , E ,   HSR )
We apply logarithmic processing to the equation to convert the function to linear form as follows:
Log Y = Log   f ( L ,   K , E ,   HSR )
In the production function, Y is the maximum output that can be produced, that is, the level of economic development; L is the labor force; K is the capital investment; E is the total energy consumption; HSR is the development of railway transportation. Previous studies have reported the significant heterogeneity and spatial dependency of certain socio-economic variables in the YRD region [13,19]. Therefore, we can use a spatial autoregressive (SAR) model to detect the presence of any spatial influences on the dependent variable:
Y i t = ρ W Y i t + X i t β + μ + ϵ t
where Y represents N*1 vector of dependent variables for every analytical unit; i is one cross-section; t is the time dimension; X is the N*T matrix of independent variables of labor, investment, energy consumption, HSR travel time, and centrality; and W is the vector of spatial weights of a given analytical unit to the others. W is calculated with a normalized N*N weight matrix based on the Queen Contiguity method. Thus, WY is defined as the spatial interactions among dependent variables; ϵ t is the error term; and ρ , β , and μ are coefficients to be estimated.
To measure the impact of the development of HSR, we adopted three variables to capture the changes in accessibility and connection related to the development of HSR and USI (the interaction effect between two dimensions). The final model used to estimate the HSR effect is as follows:
Log Y i t = ρ W L o g Y i t + β 1 L o g L a b o u r i t + β 2 L o g I n v e s t i t + β 3 L o g E n e r g y i t + β 4 L o g N T i t + β 5 L o g N C i t + β 5 L o g U S I i t + μ + ϵ t

3. Results

3.1. HSR Network Expansion: Travel Time and Service Frequency

3.1.1. Network Accessibility Patterns and Changes

The development of the HSR network has greatly reduced the total travel time between cities. In 2009, Nanjing was the most accessible city (network travel time of 203.89 h), followed by Wuxi (206.09 h) and Ma’anshan (210 h). Although Nanjing ranks first among the cities with the highest transportation convenience, due to the development of the high-speed rail network, the lowest-value centers have moved westward in 2018. The pattern shows that geographical location and node centrality of the HSR network determine the city’s network accessibility level. The network travel time pattern in 2018 was significantly related to 2009, with an explanatory power of 62.1%, indicating that the development of HSR network has changed 37.9% of network accessibility, because conventional rail transit did not make a significant contribution during the study period. Therefore, the development of HSR has brought uneven network accessibility changes to cities. Some cities are prosperous, and some cities are declining.
Regarding accessibility improvement, cities at the periphery of the region have the largest absolute network travel time change (Figure 1). For example, Wenzhou, Lishui, and Quzhou in southern Zhejiang and Anqing and Huangshan in southern Anhui experienced more than a 200-h reduction. Some conventional rail cities also experienced dramatic improvements in network travel time by connecting to HSR services of neighboring HSR cities, such as Lianyungang in northern Jiangsu Province, which experienced a network travel time reduction of 161.52 h. However, when we calculate the relative changes in network travel time between cities, cities with higher values in the conventional rail network in 2009 have higher relative returns. The results show that the location of cities in the traditional railway network may determine or at least help them choose HSR development. The average improvement in the YRD region is about 50%; outstanding cities included Xuzhou (62.42%), Suzhou in Anhui (62.0%), and Nanjing (61.12%). However, in general, the HSR network has increased the regional disparity in network travel time, supported by an increased coefficient of variation from 0.279 in 2009 to 0.326 in 2018.

3.1.2. Network Connectivity Patterns and Changes

In 2009, there was no HSR in Suqian and Taizhou, and there were 703 inter-city high-speed rail services in the whole district. In 2018, there were 780 rail connections between any two cities (direct or via connecting trains). Figure 2 shows that there are 47 primary and secondary connections with the largest difference in the strength of the intercity high-speed rail, so only 6% of the connections have been greatly improved. There are 188 connections at the third and fourth levels, of which 24% are intercity connections, and inter-city connections have increased significantly. In the fifth and sixth levels, there are 545 connections (about 70% of the total number of the area), and 148 (19%) of those 545 connections have negative values. The results indicate that in the past ten years, less than one-third of intercity HSR connections have significantly increased, 19% of intercity connections have weakened, slightly changed intercity connections dominate, and the overall distribution is even more uneven.
There are 29 connections at the first network level. The high-value gathering areas in 2018 were basically the same as in 2009, and both highlighted the Shanghai–Nanjing line, which means that the five cities on the Shanghai–Nanjing line not only have the most similar connections between 2009 and 2018, but also experienced the largest increase in intercity connections in the past decade. In addition, Zhejiang’s HSR was weak in 2009, but by 2018, all cities have HSR operations, and the Shanghai–Kunming and Hangzhou–Shenzhen lines run through Zhejiang. Therefore, the intensity of inter-city connectivity in Zhejiang has undergone major changes from 2009 to 2018.
There are 54 secondary connections, highlighting the intercity HSR connections of the four main lines, presenting a spatial pattern of two horizontal lines and two vertical lines, indicating that the overall connection intensity along the line has been greatly increased. Moreover, there are more intercity connections from north to south than east to south, indicating that the Beijing–Shanghai HSR has an obvious leading role in the Yangtze River Delta region due to its transit and carrying capacity.
There are 145 connection points on the third floor, which strengthen the spatial pattern of two horizontal and two vertical lines, forming a multi-center interactive pattern with most cities along the HSR as nodes. The leaping feature of rail transit greatly reduces the influence of geographic distance and improves the connection between regional surrounding cities (such as Lu’an, Anqing, Wenzhou, and Taizhou) with other cities.
There are 552 connections at the fourth network level, which is characterized by the fact that the intercity high-speed rail connection has not improved or deteriorated much since 2009. In other words, most of the changes in the strength of intercity connections are negligible. The inter-city ties in cities along the high-speed rail lines are increasingly strengthened, and the inter-city ties in remote areas are declining. The gap between these two groups is getting bigger and bigger, and the “Matthew effect” has appeared [35]. Figure 3 illustrates the changes in the strength of intercity connections between the four network levels.

3.2. Urban Intensity Index Patterns and Changes from HSR Service Network in the YRD Region

From 2009 to 2018, the intensity of about one-third of the cities rose sharply, one-third increased moderately, and the intensity of one-third did not change or declined. The central cities showed obvious polarization effects. Figure 4a shows that the two first-tier cities with the highest point intensity in 2009 and 2018 are Shanghai and Nanjing. These two cities are in an advantageous position in connecting with other cities in the region, far surpassing other cities. In 2009, there were 6 s-tier cities. In 2018, adding Xuzhou and Hefei, the number increased to eight, indicating that the rail transit development of these two cities is sufficiently fast, and the urban point density has increased by one-level. Among other cities, Ningbo, Shaoxing, and Huzhou upgraded from the fourth to the third level between 2009 and 2018, Wenzhou upgraded from the fifth to the third level, Taizhou upgraded from the sixth to the fourth level, and Lishui, Lu’an, and Tongling upgraded from the fifth to the fourth level. In total, the relative positions of 10 cities have risen. In addition, Wenzhou and Taizhou rose by two levels and experienced significant changes during the study period. There was no high-speed rail in Taizhou in 2009. By 2018, both cities were connected to high-speed rail, which greatly increased their point strength.
The four cities of Xuancheng, Fuyang, Bozhou and Lianyungang in 2018 were lower than in 2009. These cities are located on the periphery of the YRD and did not have HSR until 2018. As the point intensity of other cities increases, the overall improvement of the Yangtze River Delta’s HSR network has further marginalized these cities, resulting in worse connections with other cities. The point density of Xuancheng has dropped by two levels. In 2018, HSR has been built in surrounding cities. As HSR replaced many conventional railways in surrounding cities, Xuancheng gradually lost its location advantage. The total number of daily trains has been reduced from 560 to 358, which has a significant impact on point intensity.
As shown in Figure 3, the largest changes in point intensity are in Nanjing, Shanghai, Suzhou and Hangzhou. The strength of these four cities is relatively high, while that of Xuancheng and Fuyang is relatively weak, and the gap between cities is getting bigger and bigger. In other words, central cities are becoming more and more hubs, and the difference between the core and the periphery in this pattern is more obvious in 2018 than in 2009.

3.3. Influence of HSR Network Development on Economic Structure Efficiency in the YRD Region

The variance inflation factor (VIFs) was tested and some were less than 4. The test results show that there is no multicollinearity between the variables. Using the SAR estimator with fixed effects on economic development and industrial structure adjustment as the dependent variable for spatial regression estimation, it is found that both models are significant (with a confidence level of 99%). Table 1 presents the regression results of the effects of HSR network development in the YRD region. Except for the agricultural sector, the spatial lag of all other dependent variables has strong statistical significance in the SAR model. The results indicate that economic development and non-agricultural industrial restructuring have positive externalities. Obviously, the service sector in the region is more spatially concentrated than the industrial sector.
After controlling the impact of labor, investment, and energy in the production function, we found that the network travel time significantly and negatively predicted overall economic development and non-agricultural industrial structure. The relationship indicate that the improved accessibility brought about by the development of HSR network has had a strong impact on the development of the region’s industrial and service sector development. However, the significance level also shows that the impact of improved accessibility on the service sector is greater than the impact on the industrial sector. The influence mode of network connectivity and city intensity index on economic development and industrial structure adjustment is similar to that of network accessibility.

4. Discussion

4.1. The Polarization Effect of HSR on Regional Economic Development

Since 2009, the uniformity of urban spot intensity relative to the spatial distribution of high-speed rail has declined, and the spatial distribution of point intensity has an obvious corridor effect. As shown in the intensity change interpolation diagram (Figure 4), in general, cities with large changes in point intensity are geographically distributed on the four main HSR lines: Beijing-Shanghai, Shanghai-Wuhan, Chengdu, Shanghai-Kunming, and Hangzhou-Shenzhen. Therefore, the strength of the HSR main line node cities has increased significantly, especially in the cities at the intersection of HSR main lines such as Shanghai, Nanjing, Suzhou, and Hangzhou. Figure 4a shows a large triangle of high-strength city clusters with Shanghai, Suzhou, and Jinhua as vertices, and Figure 4b shows the high-strength clusters in a smaller triangle formed by Shanghai, Nanjing, and Hangzhou. The comparison shows that in 2009, with the exception of the outermost cities, the urban point intensity in the region did not change much, and the point intensity was more evenly distributed throughout the region. In 2018, the small triangle area was significantly better than other regions, indicating that this core area has developed extremely rapidly in the past ten years, and the gap between the strengths and weaknesses of other cities has become more and more obvious. Therefore, the spatial distribution of urban point intensity in the entire region in 2018 has become unbalanced (Figure 4c).
The analysis of the point intensity coefficient shows that the intensity distribution of urban HSR points between 2009 and 2018 is uneven (Table 2). In 2009, there were eight extreme nodes with a point intensity coefficients of <0.2 or >2.0. The total number in 2018 is also eight, indicating that the intensity distribution in the past two years is uneven. The standard deviation of the point intensity coefficient was 0.77 in 2009 and 0.79 in 2018, and the range of the point intensity coefficient was 3.05 in 2009 and 3.29 in 2018, both indicators in 2018 were higher than in 2009. In addition, the average point intensity of the 40 cities was 15.37 in 2009, which was 31.49 less than the largest point intensity of 46.86 (Shanghai) and 15.37 more than the smallest point intensity of zero (Taizhou and Suqian). The average point intensity in 2018 was 25.84, which was 62.73 less than the largest point intensity of 88.57 (Nanjing) and 22.31 more than the smallest point intensity of 3.53 (Suqian). It can be seen that the change in point intensity between cities in 2018 is greater than in 2009. In short, the standard deviation, range, and point intensity change all prove that the point intensity distribution in 2018 is more uneven than in 2009. Moreover, the total number of extreme nodes with high point intensity (>2.0) was significantly higher than the number of extreme nodes with small point intensity (<0.2) in 2009 and in 2018. Therefore, the uneven distribution of urban point intensity between 2009 and 2018 is mainly due to the existence of a large number of high-intensity extreme nodes, which further illustrates the polarization effect of the HSR on central cities during the study period.

4.2. The Driving Effect of Investment and Employment in the Development of HSR

In the production function, investment has a significant positive effect on economic development and industrial structure adjustment, indicating that the economic development of the YRD has been mainly driven by investment since 2009. Since the reform and opening policy in the late 1970s, China has always regarded investment as an important means of economic development. In contrast, the correlation between labor input and economic development and industrial structure adjustment is relatively weak. It is positively correlated in all models except per capita GDP, but it is only statistically significant in agriculture and industry. Labor is a significant negative factor for GDP per capita and not significant for GDP and for the economic development of the service industry, which may be because the model only examines the quantity of labor input and ignores the quality of labor input. When evaluating the economic transformation from industrial to service-based economy in the YRD region, the quality of labor is increasingly recognized as an important factor that needs to be highlighted [36,37]. In short, the different effects of the development of the HSR network on different economic sectors and indicators show that, since 2009, the HSR has played an effective role in promoting the economic transformation of the region.

5. Conclusions

To understand the expansion of HSR network and its impact on the sustainability of regional economic development, we analyzed and compared changes in the point intensity and intercity connection intensity of 40 cities in HSR services between 2009 and 2018, and adopted an improved production function model to control the impact of related variables to explore its impact on economic development efficiency, thereby determining the impact of the rapid development of HSR in the region over the past decade on the changes in the spatial pattern and the adjustment of the industrial structure from 2009 to 2018. Based on the research results, we draw the following conclusions.
1. The rapid development of HSR has increased the density of public transportation cities, shortened inter-city connections in the region, and promoted the development of regional integration. There are spatial differences in the increase in the density of urban points and the strength of inter-city connections, which reflects the “Matthew effect” of accumulated advantages. During the study period, with the rapid development of HSR, the point intensity of Nanjing, Shanghai, Suzhou and Hangzhou increased the most, while the point intensity of Xuancheng, Fuyang, Bozhou and Lianyungang declined. That is, the intensity of the central city has increased, and the intensity of the outer cities has weakened. The gap in 2018 was greater than in 2009. High-speed rail connections between high-speed rail node cities have increased, while non-node cities have been marginalized.
2. In 2009, the spatial distribution of urban spot strength based on HSR was uneven, and the gap was even more pronounced in 2018. In 2018, the size of high-intensity city clusters was significantly reduced compared with 2009, and the gap with surrounding low-intensity cities was even more obvious. The heterogeneity of urban point intensity may be mainly due to the large number of nodes (central cities) with extremely high point intensity.
3. The changes in accessibility, network connectivity, and urban point intensity brought about by the development of HSR have significantly affected the development of the secondary and tertiary industries. The rapid development of HSR will bring more benefits to the business and service economy of the benefiting cities, and at the same time make the regional economic development gap and the distribution of tertiary industry output value more polarized and uneven.
4. In all production functions, investment in fixed assets has a positive impact on economic development and industrial restructuring; the main driving factor for China’s economic development in the past decade has been a large amount of investment in fixed assets, and HSR construction is an important part of government investment. Therefore, the impact of the evolution of the HSR network is not limited to changes in traffic accessibility and connectivity, but also includes the increase in fixed asset investment to enhance the level of economic development.
This study investigated the impact of the development of high-speed rail networks on the sustainability of economic development in the Yangtze River Delta. Empirical analysis can also provide an important reference for future high-speed rail development planning and regional economic integration policy formulation. However, this study has some limitations. First, the changes in intra-city traffic related to the increase in the use of high-speed rail are not considered. In addition, although the relationship between high-speed rail and economic development and industrial structure adjustment is complex, relatively simple production function models are still used to evaluate the impact of the high-speed rail network. Therefore, the correlation between various related factors remains to be resolved. In future research, first, it is necessary to strengthen systematic research on the impact of high-speed rail on economic sustainability, including aspects such as the efficiency improvement of high-speed rail on economic development, industrial layout, and spatial connections between cities. Secondly, it is necessary to study whether the airport, high-speed and other transportation methods will affect the economic benefits of HSR; Finally, it is necessary to discuss in depth the complex relationship between HSR and economic development and industrial structure adjustment, as well as the complex correlation between various related factors.

Author Contributions

Writing—original draft and Formal analysis, W.S.; Writing—review & editing, C.W.; Methodology, C.L.; Writing—review & editing and Supervision, L.W. All authors have read and agreed to the published version of the manuscript.

Funding

This research was funded by the National Natural Science Foundation of China, grant number 41871119.

Informed Consent Statement

Not applicable.

Conflicts of Interest

The authors declare no conflict of interest.

References

  1. Allen, W.B. Value capture in transit. J. Transp. Res. Forum 1987, 28, 24–27. [Google Scholar]
  2. Feng, C.C.; Feng, X.B.; Liu, S.J. Effects of high speed railway network on the inter-provincial accessibilities in China. Prog. Geogr. 2013, 32, 1187–1194. [Google Scholar]
  3. Chen, Z.; Haynes, K.E. Impact of high-speed rail on regional economic disparity in China. J. Transp. Geogr. 2017, 65, 80–91. [Google Scholar] [CrossRef]
  4. Diao, M.; Fan, Y.L.; Zhang, X.L. Introduction to special issue: Rail transit development in China and beyond. J. Transp. Land Use 2019, 12, 237–239. [Google Scholar] [CrossRef] [Green Version]
  5. Chong, Z.H.; Qin, C.L.; Chen, Z.H. Estimating the economic benefits of high-speed rail in China: A new perspective from the connectivity improvement. J. Transp. Land Use 2019, 12, 287–302. [Google Scholar] [CrossRef] [Green Version]
  6. Sanuki, T. The Shinkansen and the future image of Japan. In The Shinkansen HSR Network of Japan, Proceedings of a IIASA Conference, 27–30 June 1977; Pergamon Press: Oxford, UK, 1980. [Google Scholar]
  7. Wang, C.J.; Ding, J.X.; Yang, W. Policy and spatial effect of expressway planning network in China. Acta Geogr. Sin. 2011, 66, 1076–1088. [Google Scholar]
  8. Hou, X.; Liu, S.; Zhang, W.X.; Hu, Z.D. Characteristics of commuting behaviors between Beijing and Tianjin influenced by high-speed trains. Econ. Geogr. 2011, 31, 1573–1579. [Google Scholar]
  9. Liu, J.G.; Shen, Z.Q. HSR economy: A new impetus for urban transformation. Guangdong Soc. Sci. 2011, 3, 20–26. [Google Scholar]
  10. Wu, K.; Fang, C.L.; Zhao, M.; Chen, C. The intercity space of flow influenced by high-speed rail: A case study for the rail transit passenger behavior between Beijing and Tianjin. Acta Geogr. Sin. 2013, 68, 159–174. [Google Scholar]
  11. Wang, J.E.; Jiao, J.J.; Jin, F.J. Spatial effects of HSRs on interurban economic linkages in China. Acta Geogr. Sin. 2014, 69, 1833–1846. [Google Scholar]
  12. Wang, H.; Long, H. Effect of high speed railway network on spatial structure of urban agglomeration. City Plan. Rev. 2009, 33, 41–44. [Google Scholar]
  13. Li, A.M.; Xiao, X. The influence of HSR ways on urban economical relation in the Yangtze River Delta. Mod. Urban Res. 2014, 9, 110–116. [Google Scholar]
  14. Masson, S.; Petiot, R. Can the high speed rail reinforce tourism attractiveness? The case of the high speed rail between Perpignan (France) and Barcelona (Spain). Technovation 2009, 29, 611–617. [Google Scholar] [CrossRef]
  15. Wang, D.G.; Chen, T.; Lu, L.; Wang, L.; Lew, A. Mechanism and HSR effect of spatial structure of regional tourist flow: Case study of Beijing-Shanghai HSR in China. Acta Geogr. Sin. 2015, 70, 214–233. [Google Scholar]
  16. Holl, A. Twenty years of accessibility improvements. The case of the Spanish motorway building programme. J. Transp. Geogr. 2007, 15, 286–297. [Google Scholar] [CrossRef]
  17. Gutiérrez, J.; Gonzalez, R.; Gomez, G. The European high-speed train network: Predicted effects on accessibility patterns. J. Transp. Geogr. 1996, 4, 227–238. [Google Scholar] [CrossRef]
  18. Preston, J.M.; Wall, G.T.; Larbie, A. The impact of high speed trains on socio-economic activity: The case of Ashford (Kent). In Proceedings of the 4th Annual Conference on Railroad Industry Structure, Competition, and Investment, Madrid, Spain, 19–21 October 2006. [Google Scholar]
  19. He, J.F. A study on the accessibility of HSR: A case of Yangtze River Delta. Int. Urban Plan. 2011, 26, 55–62. [Google Scholar]
  20. Wang, J.X.; Lin, C.H. High-speed rail and its impacts on the urban spatial dynamics in china: The background and analytical framework. Urban Plan. Int. 2011, 26, 16–23. [Google Scholar]
  21. Yang, J.; Yang, R.; Chen, M.H.; Su, C.H.; Zhi, Y.; Xi, J.C. Effects of rural revitalization on rural tourism. J. Hosp. Tour. Manag. 2021, 47, 35–45. [Google Scholar] [CrossRef]
  22. Chen, C.L.; Vickerman, R. Can transport infrastructure change regions’ economic fortunes? Some evidence from Europe and China. Reg. Stud. 2017, 51, 144–160. [Google Scholar] [CrossRef]
  23. Ureña, J.M.; Menerault, P.; Garmendia, M. The high-speed rail challenge for big intermediate cities: A national, regional and local perspective. Cities 2009, 26, 266–279. [Google Scholar] [CrossRef]
  24. Huang, X.Y.; Cao, X.S.; Li, T. The relationship between regional transport superiority and regional economic performance in Hainan. Geogr. Res. 2011, 30, 985–999. [Google Scholar]
  25. Zhu, B.; Zhang, X.L.; Gui, D.W.; Lei, J.; Dong, W.; Wang, B.L. The relationship between urban development and transport accessibility in Xinjiang. Prog. Geogr. 2010, 29, 1239–1248. [Google Scholar]
  26. Yang, J.; Bao, Y.; Zhang, Y.J.; Zhang, Y.Q.; Li, X.M.; Ge, Q.S. Impact of Accessibility on Housing Prices in Dalian City of China Based on a Geographically Weighted Regression Model. Chin. Geogr. Sci. 2018, 28, 505–515. [Google Scholar] [CrossRef] [Green Version]
  27. Wang, Z.B.; Xu, J.G.; Zhu, C.G.; Qi, Y.; Xu, L. The county accessibility divisions in China and its correlation with population distribution. Acta Geogr. Sin. 2010, 65, 416–426. [Google Scholar]
  28. Givoni, M. Development and impact of the modern high-speed train: A review. Transp. Rev. 2006, 26, 593–611. [Google Scholar] [CrossRef]
  29. Kotavaara, O.; Antikainen, H.; Rusanen, J. Population change and accessibility by road and rail networks: GIS and statistical approach to Finland 1970–2007. J. Transp. Geogr. 2011, 19, 926–935. [Google Scholar] [CrossRef]
  30. Wang, L.; Cao, Y.H.; Qiu, F.D. Spatial change and driving mechanism of the industry in regions of HSR stations before and after the opening: A case study of Nanjing HSR station. Sci. Geogr. Sin. 2017, 37, 19–27. [Google Scholar]
  31. Jin, S.H.; Yang, J.; Wang, E.X.; Liu, J. The influence of high-speed rail on ice–snow tourism in northeastern China—ScienceDirect. Tour. Manag. 2020, 78, 104070. [Google Scholar] [CrossRef]
  32. Hong, S.; Yao, C. High-speed rail station and urban spatial evolution: Review and introspection. Urban Plan Int. 2016, 31, 84–89. [Google Scholar]
  33. Yang, J.; Guo, A.D.; Li, X.M.; Huang, T. Study of the Impact of a High-Speed Railway Opening on China’s Accessibility Pattern and Spatial Equality. Sustainability 2018, 18, 2943. [Google Scholar] [CrossRef] [Green Version]
  34. Chen, W.; Xiu, C.L.; Ke, W.Q.; Yu, Q.Y.; Wei, Z. Hierarchical structures of China’s city network from the perspective of multiple traffic flows. Geogr. Res. 2015, 34, 2073–2083. [Google Scholar]
  35. Sun, F.; Wang, D.; Yu, N. Competition patterns of high-speed rail versus highways and aviation. Geogr. Res. 2017, 36, 171–187. [Google Scholar]
  36. Wang, L.; Yuan, F.; Duan, X.J. How high-speed rail service development influenced commercial land market dynamics: A case study of Jiangsu province, China. J. Transp. Geogr. 2018, 72, 248–257. [Google Scholar] [CrossRef]
  37. Yuan, F.; Gao, J.L.; Wang, L.; Cai, Y.Y. Co-location of manufacturing and producer services in Nanjing, China. Cities 2017, 63, 81–91. [Google Scholar] [CrossRef]
Figure 1. Changes in the network accessibility of cities in the YRD, 2009–2018.
Sustainability 14 00155 g001
Figure 2. Intercity connection intensity in the YRD Note: (a) 2009; (b) 2018; (c) change to connection intensity. Notes: NJ = Nanjing; WX = Wuxi; XZ = Xuzhou; CZ1 = Changzhou; SZ1 = Suzhou; NT = Natong; LYG = Lianyungang; HA = Huaian; YC = Yancheng; YZ = Yangzhou; ZJ = Zhenjiang; TZ1 = Taizhou; SQ = Suqian; HZ1 = Hangzhou; NB = Ningbo; WZ = Wenzhou; JX = Jiaxing; HZ = Huzhou; SX = Saoxing; JH = Jinhua; QZ = Quzhou; TZ2 = Taizhou; LS = Lishui; HF = Hefei; WH = Wuhu; BZ = Bozhou; SZ2 = Suzhou; BB = Bengbu; FY = Fuyang; HN = Huainan; CZ2 = Cuzhou; LA = Luan; MAS = Ma’anshan; HB = Huaibei; XC = Xuancheng; TL = Tongling; CZ3 = Chihzou; AQ = Anqing; HS = Huangshan.
Sustainability 14 00155 g002
Figure 3. Changes in the strength of intercity connections in the four-level network of the YRD, 2009–2018. (a) First network level; (b) Second network level; (c) Third network level; (d) Fourth network level.
Sustainability 14 00155 g003aSustainability 14 00155 g003b
Figure 4. Spatial distribution pattern of urban intensity index in the YRD region: Note: (a) 2009; (b) 2018; (c) change in intensity.
Sustainability 14 00155 g004
Table 1. Estimation results of spatial econometric model in the YRD 1.
(log)Variables(log)GDPPC(log)GDP(log)Agricultural GDP(log)Industrial GDP(log)Services GDP
Labor −0.167 *0.0410.282 *0.192 **0.025
Investments0.255 ***0.197 ***0.403 ***0.254 ***0.235 ***
Energy 0.0040.0130.0190.026 *−0.011
Network accessibility −0.346 ***−0.124 *0.012−0.315 *−0.070 ***
Network connectivity 0.058 **0.006−0.0290.073 ***0.013 ***
Urban intensity index 0.357 **0.0370.2570.425 **0.058 **
Spatial rho0.424 ***0.613 ***−0.0970.387 ***0.678 ***
R20.4090.6340.3830.7120.558
Notes: * = p < 0.10, ** = p < 0.05, *** = p < 0.01.
Table 2. Statistics of the distribution of urban intensity coefficient in 2009 and 2018.
StatisticPoint Intensity Coefficient in 2009Point Intensity Coefficient in 2018
Standard deviation0.770.79
ExtremumMaximum3.053.43
Minimum00.14
Range3.053.29
Point intensity coefficient categoryNumber of nodes with point intensity coefficients <0.223
Number of nodes with point intensity coefficients >1.01614
Number of nodes with point intensity coefficients >2.065
Total number of nodes with point intensity coefficients <0.2 or >2.088
Publisher’s Note: MDPI stays neutral with regard to jurisdictional claims in published maps and institutional affiliations.

