Article

Influence of Alkalis on Natural Carbonation of Limestone Calcined Clay Cement Pastes

Department of Civil Engineering, The University of Hong Kong, Pokfulam, Hong Kong, China
*
Author to whom correspondence should be addressed.
Sustainability 2021, 13(22), 12833; https://doi.org/10.3390/su132212833
Submission received: 27 October 2021 / Revised: 17 November 2021 / Accepted: 18 November 2021 / Published: 19 November 2021
(This article belongs to the Special Issue Sustainable Concrete Materials and Technologies)

Abstract

:
Vulnerability to atmospheric carbonation is one of the major durability concerns for limestone calcined clay cement (LC3) concrete due to its relatively low overall alkalinity. In this study, the natural carbonation behaviors of ternary ordinary Portland cement-metakaolin-limestone (OPC-MK-LS) blends containing various sulfate salts (i.e., anhydrous CaSO4, Na2SO4, and K2SO4) are studied, with the aim of revealing the influence of alkali cations (Na+, K+). Detailed analyses on the hydrated phase assemblage, composition, microstructure, and pore structure of LC3 pastes prior to and post indoor carbonation are conducted. The results show that the incorporation of sulfate salts accelerates the setting and strength gain of LC3 pastes, likely through enhancement of ettringite formation, but undermines its later age strength achievement due to the deleterious effect of alkali cations (Na+, K+) on late age OPC hydration. The carbonation resistance of LC3 systems is considerably undermined, particularly with the incorporation of Na2SO4 or K2SO4 salts, due to the simultaneous pore coarsening effect and reduced CO2-binding capacity. The carbonation-induced phase and microstructural alterations of LC3 pastes are discussed and compared with those of reference OPC pastes.

1. Introduction

Limestone calcined clay cement (LC3), manufactured by blending limestone, calcined clay, and Portland cement (including gypsum) in an approximate 1:2:3 mass ratio, is a promising low-carbon binder. As the production of calcined clay and limestone powders requires much less energy and emits less carbon dioxide than that of ordinary Portland cement (OPC), the use of LC3 can enhance the eco-efficiency of concrete construction [1,2]. Moreover, existing studies have shown that LC3 concrete has comparable mechanical performance as OPC counterparts, as well as higher resistance to chloride and sulfate attack and alkali-silica reaction [3,4,5,6]. However, LC3 concrete tends to have relatively poor carbonation resistance due to its lower overall calcium content [4,7,8], thus increasing the corrosion risk of steel reinforcement embedded in concrete [9,10,11]. There is hence a need to understand the factors influencing the carbonation behaviors of LC3 concrete, and to design new formulations with enhanced carbonation resistance.
Many previous studies have documented that alkalis have dramatic effects on the hydration kinetics and microstructural development, as well as mechanical and durability performance of hardened OPC materials [12,13]. For instance, it was reported that the alkali salt contamination in OPC accelerates carbonation, deepening the carbonation depth, and shortening the initiation time of carbonation-induced steel corrosion [14]. Moreover, alkali increases the alkalinity level of pore solution, and influences the precipitation rate of calcium carbonate [15], thus increasing the carbonation rate of concrete. However, few studies are available in the literature regarding the influence of alkali on the properties of LC3 systems [16], particularly concerning its carbonation resistance. Given the high intrinsic vulnerability of LC3 binders to carbonation, the role of alkalis on its atmospheric carbonation behaviors needs further investigation.
In LC3 concrete, the alkali cations (Na+ and K+) come from either the composition of clinker (e.g., thenardite, arcanite), clay minerals (e.g., up to 4% equivalent Na2O in some natural clays [17]), limestone, aggregate, or from the exposed alkali-bearing environments (e.g., seawater, deicer). The total reactive alkali content in LC3 systems varies depending on the chemistry of raw materials and the reactivity and alkali-releasing rates of alkali-bearing constituents. Although it may be impractical to incorporate extra alkali into LC3 to potentially enhance the dissolution and reaction of calcined clays and limestone (due to, e.g., alkali-silica reaction risk [18]), investigating the influence of alkali on properties of LC3 could advance our understanding of its reaction mechanisms. Moreover, the increased level of alkali may lift the pH of pore solution in LC3 systems and thus boost its CO2-binding capacity. Nevertheless, how the supplemented alkalis could affect the carbonation resistance of LC3 cementitious systems remains largely unknown and unexplored.
The main objective of this study is to investigate the influence of three sulfate salts (i.e., anhydrous CaSO4, Na2SO4, and K2SO4) on the setting and hardening, strength development, hydrated phase assemblage, composition, microstructure, and carbonation resistance of LC3 pastes, towards uncovering the mechanisms by which alkali cation (Na+ and K+) affects its carbonation behaviors. The consideration of using sulfate-bearing salts in this study, rather than other types of salts (e.g., NaOH, KOH), is because additional sulfate (typically from gypsum) is usually needed in Portland cement-metakaolin-limestone blends to prevent undersulfation [3]. In addition, the natural carbonation behaviors of LC3 pastes are analyzed and compared with those of reference OPC paste. This work contributes to the mixture design of low-carbon binders for reinforced concrete applications.

2. Materials and Methods

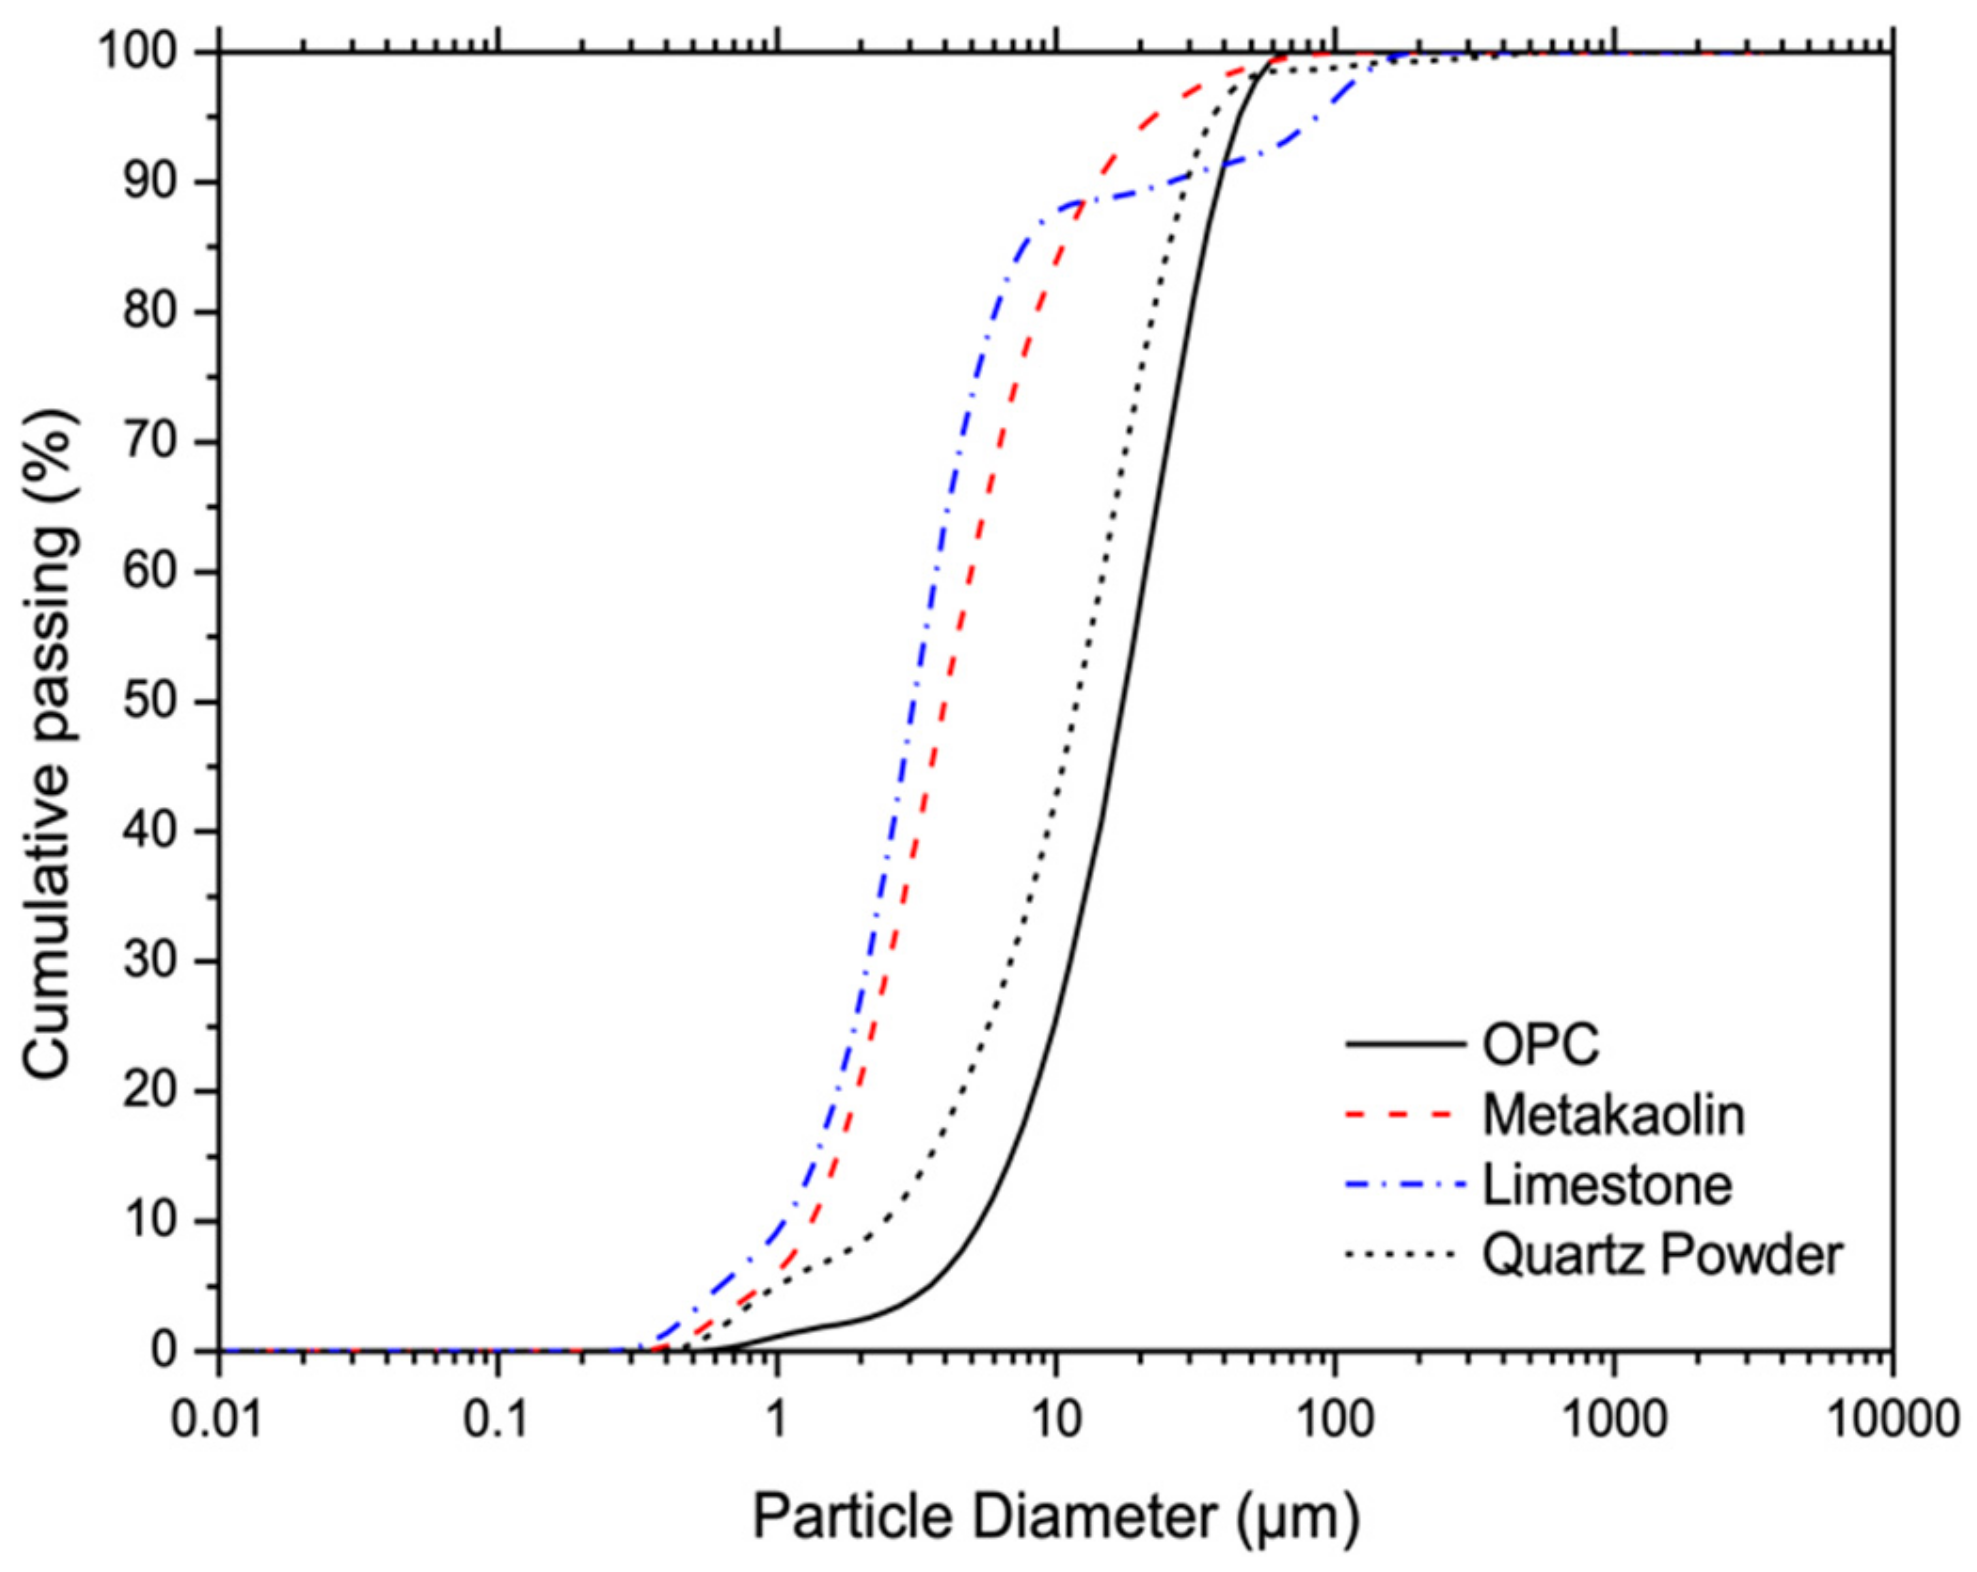
2.1. Materials and Mixture

The LC3 is formulated by blending OPC, calcined high-grade kaolinite (metakaolin, MK), and limestone (LS) powders. The oxide composition and granulometric distributions of the raw powders determined by X-ray fluorescence and X-ray laser diffraction are shown in Table 1 and Figure 1, respectively. It should be noted that the MK and LS powders are substantially finer than the OPC, which could alter its hydration kinetics via filler effects.
The mixture proportion of designed LC3 pastes is detailed in Table 2. The LC3 pastes with a constant 45% OPC substitution level by a combined MK and LS at a constant mass ratio of 2:1, and with a constant water-to-powder (w/p) ratio of 0.4, are prepared. In addition to the pure OPC paste, a control mixture with 45% quartz powder replacement (denoted as OPC_45Q) is considered, to distinguish the potential filler effects from the chemical effects of MK and LS reaction in LC3 systems. To investigate the effects of alkali incorporation on the hydration and carbonation behaviors of LC3 pastes, 2.5% OPC is replaced by anhydrous calcium sulfate (CaSO4, Cs), sodium sulfate (Na2SO4, Ns), or potassium sulfate (K2SO4, Ks) salts. The replacement level of OPC by sulfate salts were determined based on preliminary trials considering the strength development and fresh properties. It should be noted that, typically, additional sulfates are required to be supplemented to LC3 systems in order to achieve proper sulfate balance by compensating the acceleration of aluminate peak in the isothermal calorimetry tests, due to the filler effect of MK and LS [19]. All the dry solid powders including OPC, MK, LS, and sulfate salts were blended for at least 5 min in a Hobart mixer before adding mixing water. A commercial polycarboxylate-based superplasticizer was added to ensure uniformity and homogeneity of the formed paste samples. The casted samples were vibrated on a shaking table for approximately 30 s to dissipate trapped air and ensure compactness.

2.2. Vicat Setting Test

Needle penetration tests using an automatic Vicat apparatus (ELE International) were conducted following ASTM C 191 [20] to investigate the setting behaviors of paste samples. It should be noted that the pastes were prepared according to the mixture parameters in Table 2, without adjustment to the normal consistency. Fresh pastes were poured into a conical mold with a 40 mm height, 90 mm inner bottom diameter, and 80 mm inner top diameter. The penetration depth of a 1-mm Vicat needle settled into the paste samples was recorded as a function of hydration time.

2.3. Compressive Strength

The pastes were cast in 40 mm cubic molds and demolded after 23 ± 1 h, followed by curing in sealed bags stored in a closed moist cabinet until reaching designated ages for further tests. The compressive strength of hardened specimens was measured at 1, 7, and 28 days of hydration age with three replicates, using a compression machine (ELE International) at a loading speed of 3 kN/s.

2.4. Phase Analysis Prior to Carbonation

To investigate the effects of alkali incorporation on the phase assemblage and microstructure of LC3 pastes, detailed characterization on hardened paste samples at ages of 1 and 28 days was conducted using X-ray diffraction (XRD), thermogravimetric analysis (TGA), and Fourier transform infrared spectroscopy (FTIR). The pastes samples were cast and cured in sealed polypropylene vials at room temperature after mixing, to minimize any potential carbonation during curing periods. After reaching the designated ages, the samples were sliced into discs of ~2 mm in thickness using a low-speed diamond saw, and then immersed in excessive isopropyl alcohol for immediate hydration arrestment. Afterwards, the samples were vacuum dried at 40 °C for at least 72 h. The dried samples were pulverized into powders passing through a 150 μ m sieve. The same powder samples were analyzed by different characterization techniques, as will be described later.
The XRD was used to investigate the crystalline phase evolution of LC3 pastes, particularly concerning the formation of AFt and AFm phases (i.e., calcium aluminate phases). The PANalytical X’Pert PRO X-ray diffractometer in a Bragg-Brentano θ-2θ configuration with Cu Kα X-ray (λ = 0.1541 nm), under a working voltage of 40 kV and beam current of 40 mA, was used. The XRD patterns were collected across a 2θ range from 5 to 40° at a step of 0.03342°. The TGA enabled the identification of amorphous and crystalline phases, complementing XRD, as well as allowed for straightforward quantifications of mass percentages of portlandite (CH) and calcium carbonates (Cc) in samples. In this work, the decomposition temperature ranges of CH and Cc were set at 420–520 °C and 520 to 900 °C, respectively. Moreover, as bimodal peaks related to the decomposition of Cc were observed (due to varying levels of crystallization [21]) in samples, the temperature ranges at 520–720 °C and 720–900 °C were assigned to the less-crystalline Cc and more-crystalline Cc, respectively. Approximately 50 mg dry powders were loaded in the ceramic crucibles of PerkinElmer TGA 4000, and then heated from 30 to 900 °C with a heating rate of 20 °C/min and nitrogen purged at 20 mL/min. The FTIR equipped with attenuated total reflection was adopted to acquire the infrared spectra of samples from 4000 to 600 cm−1 using PerkinElmer FTIR Frontier.

2.5. Natural Carbonation

Carbonation of cementitious matrices is a reactive-transport process, involving the transport of gaseous CO2 in pore networks and its reaction with hydrated phases. To distinguish the CO2 transport effects from the chemical effects (i.e., the CO2 binding) on the overall carbonation resistance of cementitious matrices, both bulk and powder samples were prepared [22].
Powder samples: The purpose of using powder samples is to eliminate the potential differences in mass transport properties among different mixtures, hence allowing for specific investigation of carbonation-induced phase and molecular alterations. After 28 days of sealed curing at room temperature, the matured samples were pulverized, passing through a 150 μ m sieve, and subsequently exposed to an indoor environment (approximately 60% relative humidity and 20 °C on average) for natural carbonation. The powder samples were periodically stirred to facilitate uniform carbonation. The phase assemblage of carbonated samples at various time intervals up to 90 days was studied by XRD, TGA, and FTIR, using the same sample preparation procedures and instrumental parameters described before.
Bulk samples: After 28 days of sealed curing at room temperature, 40 mm cubic specimens were exposed to the same indoor carbonation environment as the powder samples. After being carbonated for 23 weeks, the specimens were split and sprayed with phenolphthalein solution for carbonation depth determination. Given that the carbonated zone was uncolored, whilst the non-carbonated core was purple-colored, the average carbonation depth was estimated via image processing (ImageJ®) of the photos of colored specimens [23]. Meanwhile, scanning electron microscopy equipped with energy-dispersive X-ray spectroscopy (SEM-EDS) was used to investigate the microstructural and compositional alterations at the skin layers of the carbonated bulk specimens using the Hitachi S3400 SEM. After being carbonated for 23 weeks, the slices covering the carbonated zone (uncolored proportion) were segmented and then vacuum-dried after being solvent-exchanged to minimize disruptions on the microstructure of samples. The samples were impregnated with epoxy resin, and polished down to 1 µm. Carbon coating and conductive silver adhesives were applied to avoid sample charging during SEM-EDS data acquisition. To accommodate for the compositional heterogeneity in the cementitious microstructure, 20–50 microanalysis points were randomly selected on the hydrated products (avoiding unreacted particles) in each sample [24].

2.6. Pore Size Distribution Analysis

The mercury intrusion porosimetry (MIP) was capable of measuring the pore size distribution of hardened pastes down to approximately 3 nm [25]. To investigate the effects of carbonation on pore structure alterations of pastes, MIP was conducted on samples without and with carbonation using the Micromeritics AutoPore IV 9500. In particular, the cubes after 23 weeks of natural carbonation after 28 days of sealed curing, as well as the uncarbonated (sealed) samples of the same ages (i.e., 27 weeks), were analyzed. Since the degree of carbonation was depth-dependent in the carbonated specimens, the skin layer uncolored by phenolphthalein solution in the LC3 pastes was sampled for MIP tests, while for the reference OPC paste, the outermost ~2 mm layer was sampled. It should be noted that due to the differences in carbonation resistance (carbonation depth) among various mixtures, the level of carbonation in the sampled layers may not be consistent. The samples were soaked in isopropyl alcohol and dried under vacuum pumping at 40 °C [25,26]. A contact angle of 130° and the maximum pressure of 414 MPa under continuous mode was employed.

3. Results and Discussion
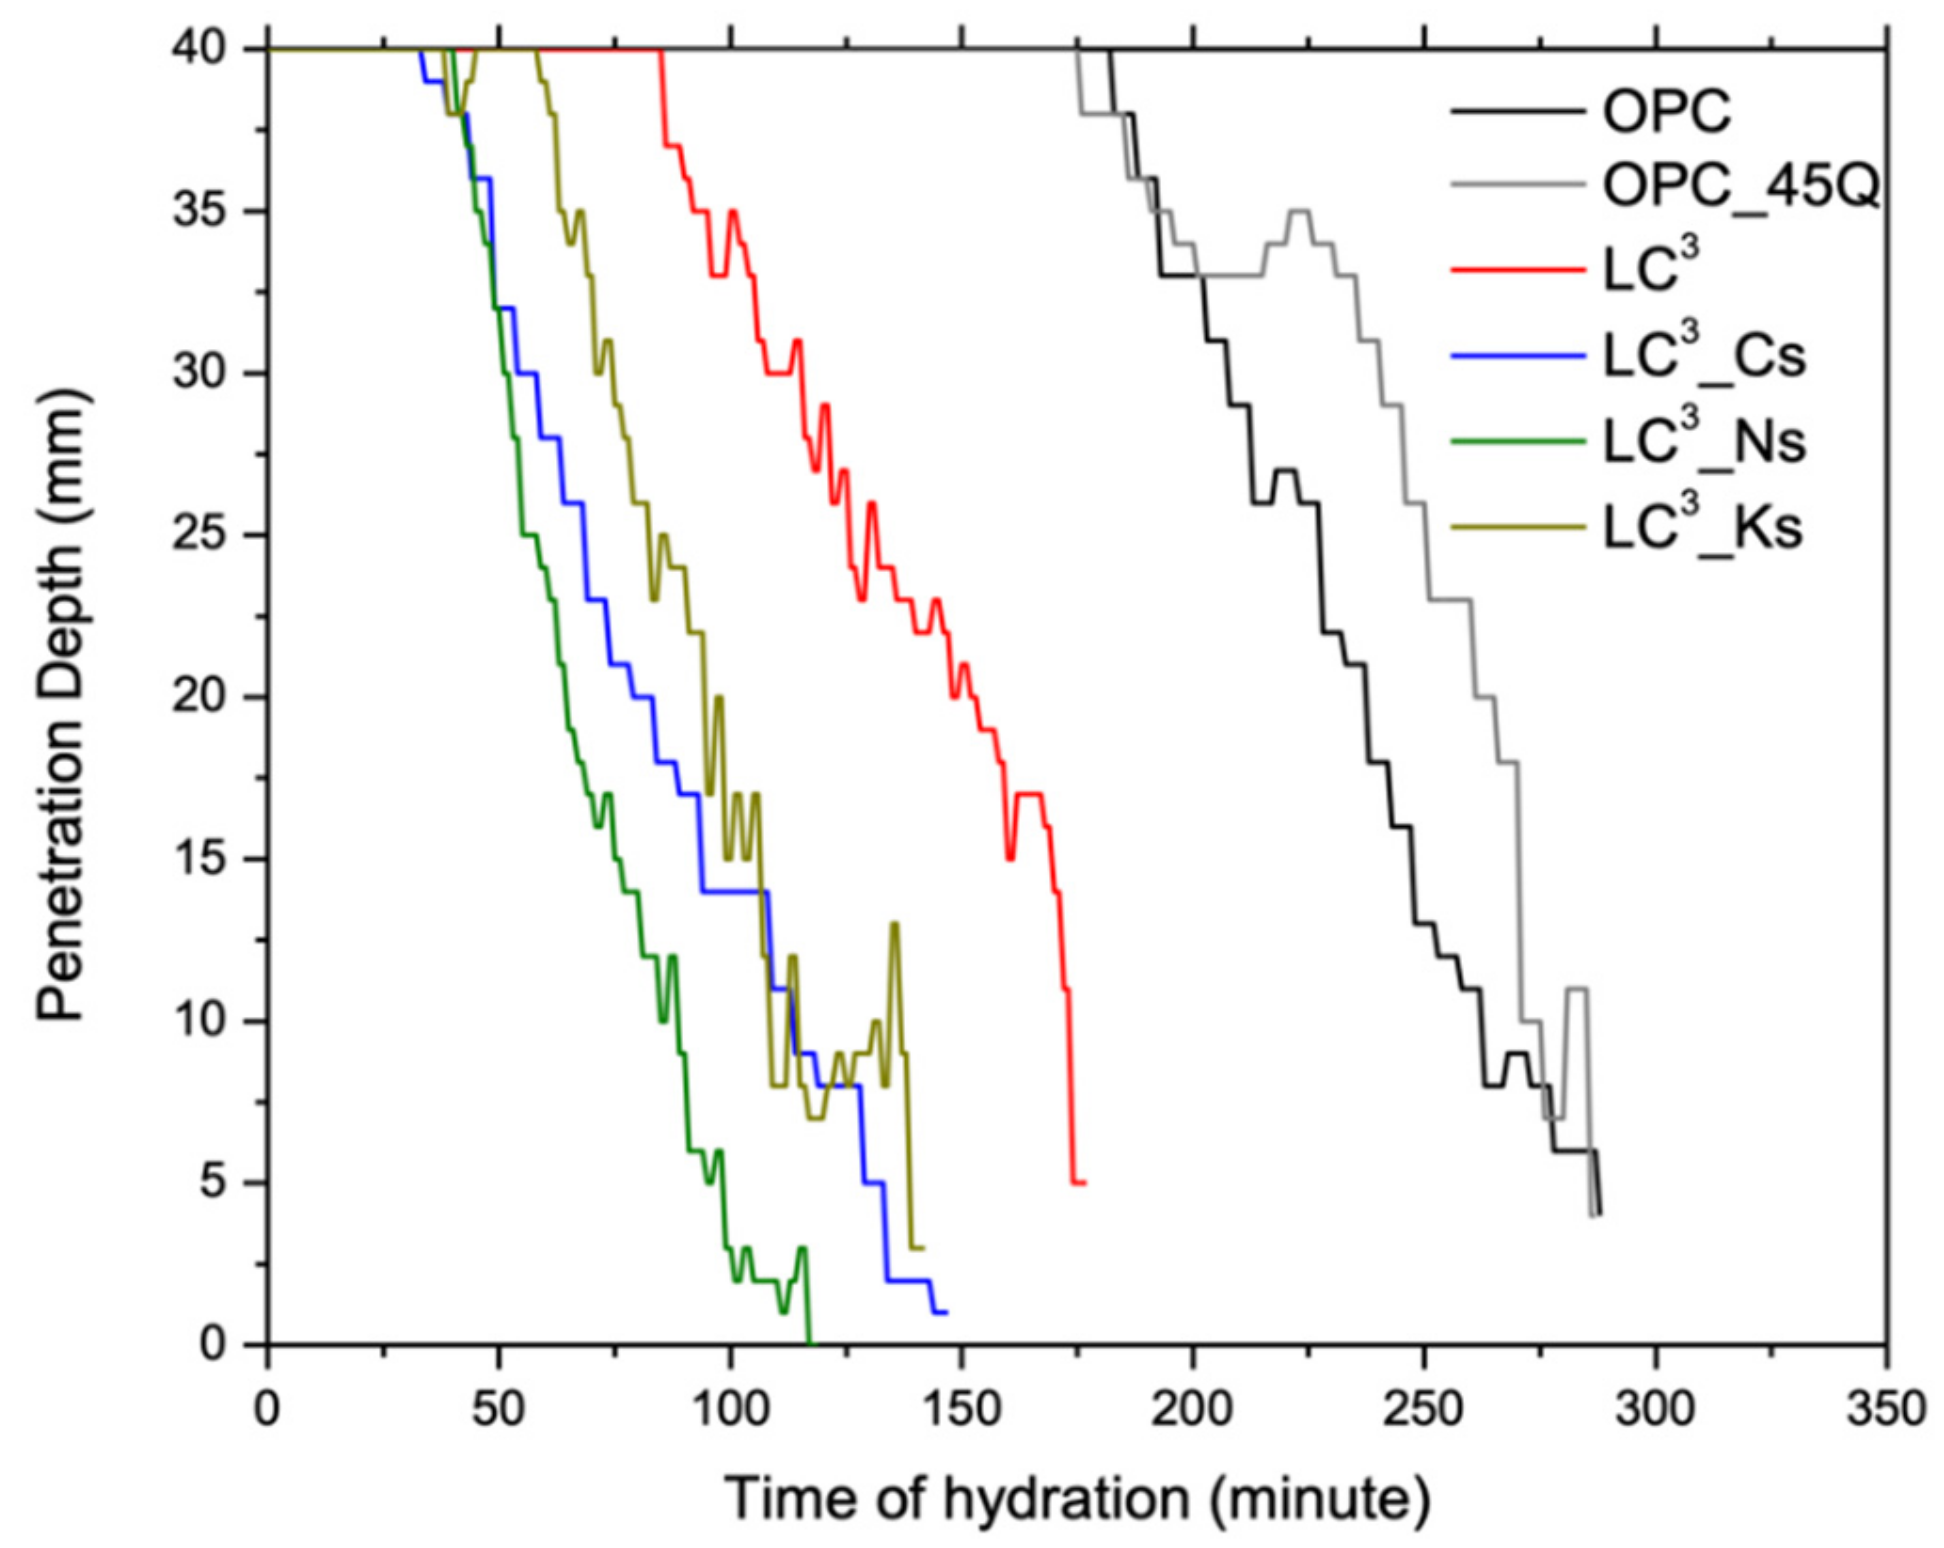
3.1. Setting Times

The time-dependent Vicat penetration depths of reference OPC and LC3 pastes are plotted in Figure 2. It can be seen that the LC3 pastes show faster setting behaviors over the OPC counterpart, likely attributed to the dominant filler effects of MK and LS powders. Similar observations were reported in the previous LC3 studies [4,27,28,29,30]. Alternatively, the high water demand of MK may reduce the amount of water available for OPC hydration, thus shortening the time to reach supersaturation with respect to the hydrated phases [28]. Moreover, the incorporation of sulfate salts, regardless of the conjugated cation type, noticeably shortens the setting time of LC3 pastes. The acceleration role of alkalis on early-age hydration of cementitious systems is also reported in pure OPC systems [12,31,32].

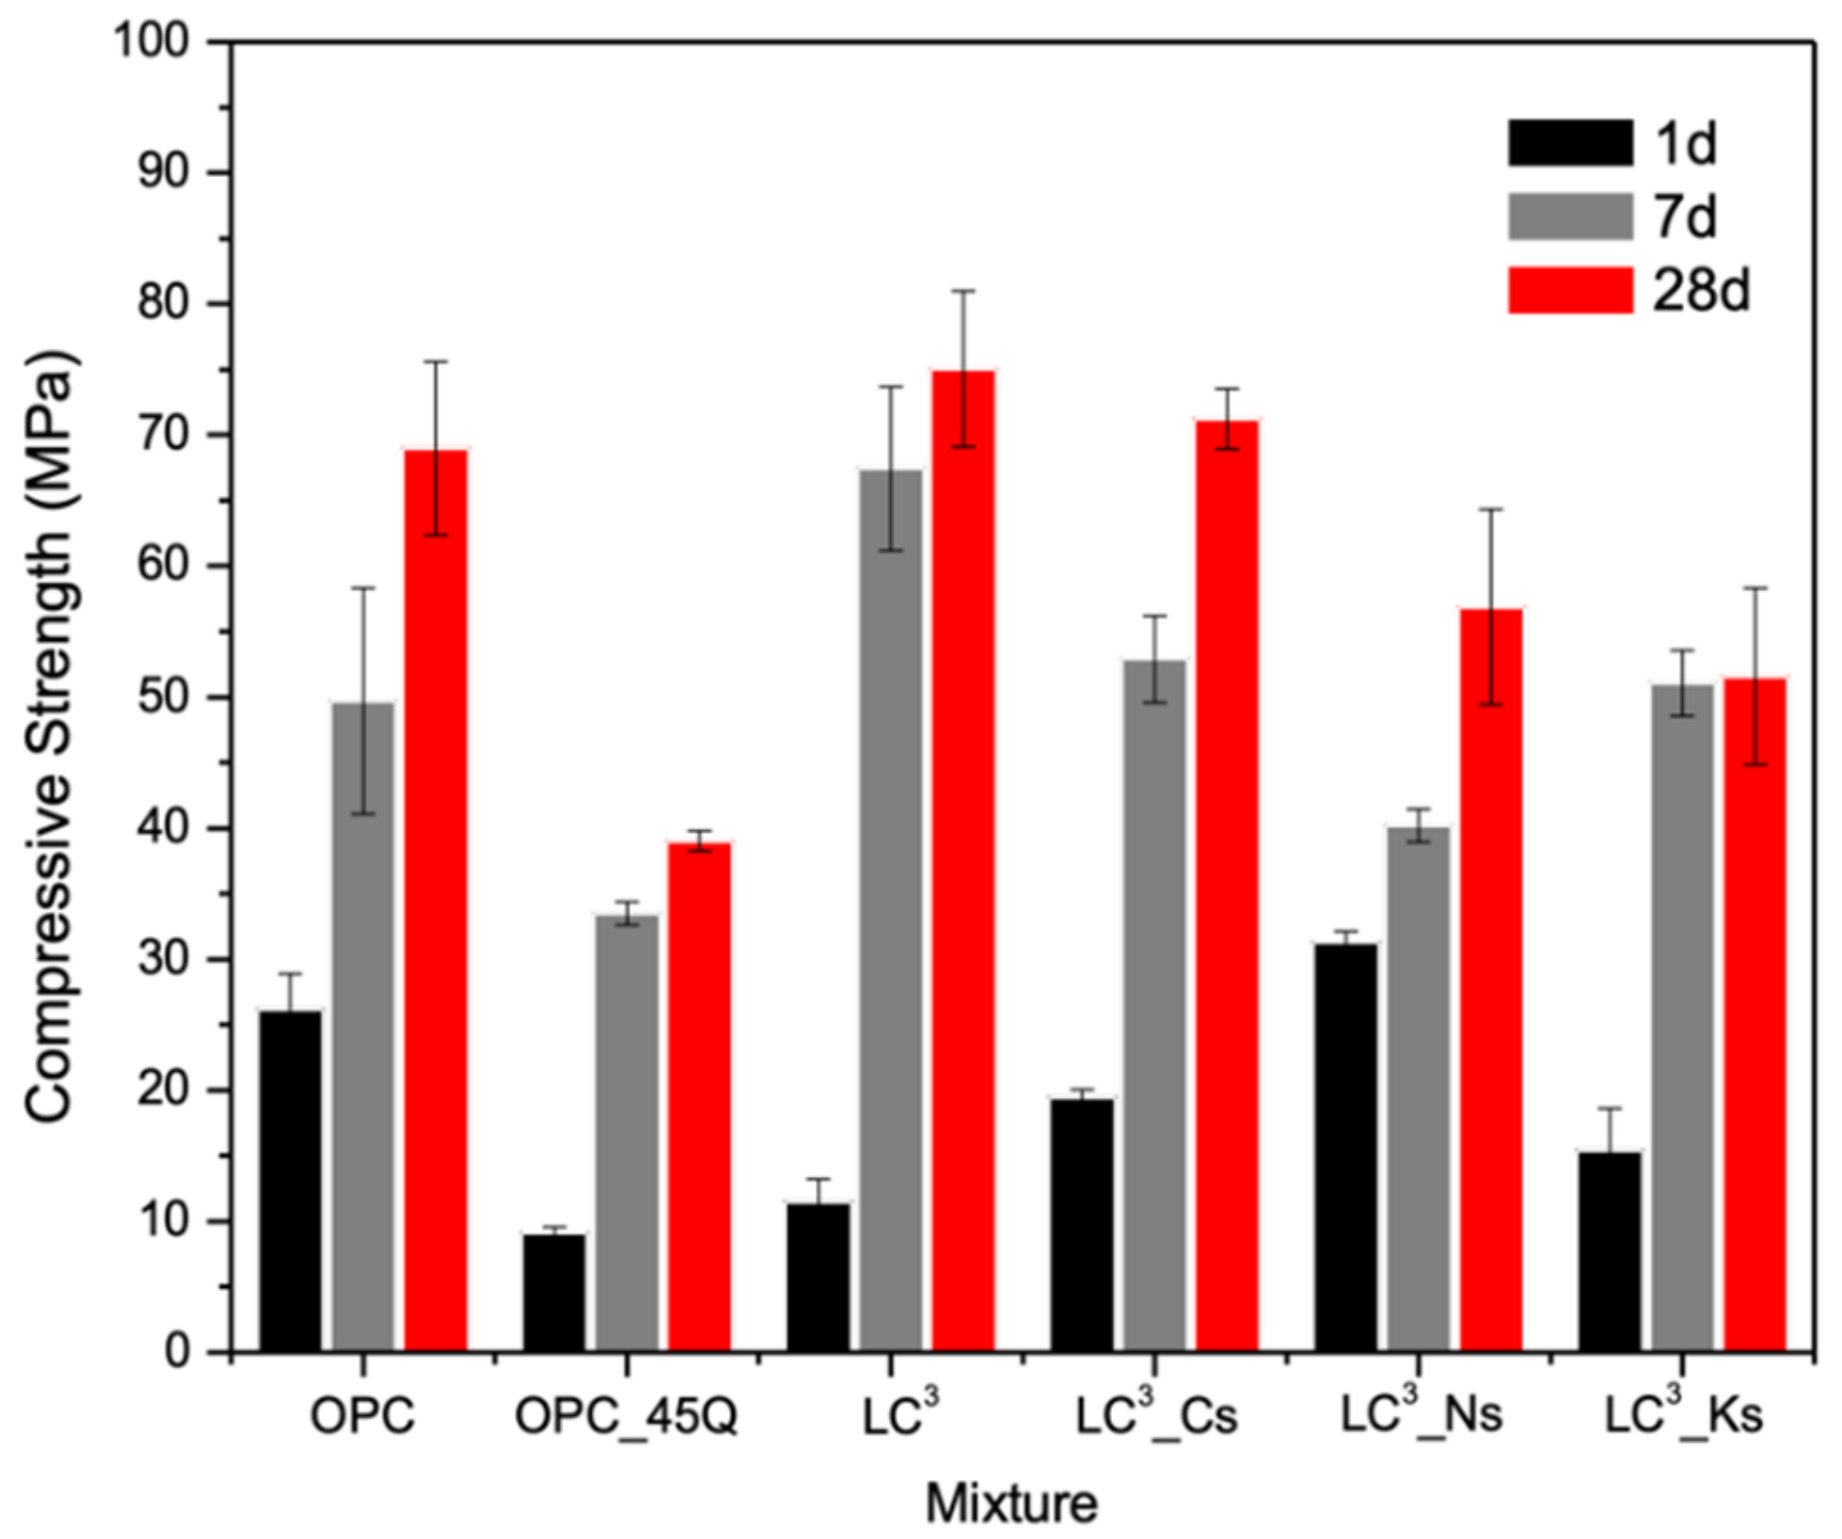
3.2. Strength Development

The compressive strength development of reference OPC and LC3 pastes as a function of age is shown in Figure 3. Consistent with the trends reported in the literature [3,33], LC3 systems show relatively low strength achievement at early ages, but then surpass that of reference OPC with the same w/p ratio at later stages, owing to continued pozzolanic reaction of MK. Moreover, consistent with the observation in the pure OPC system [31,34], the incorporation of alkali (Na or K) in LC3 systems accelerates its early-age strength gain, but shows a detrimental effect at later ages. The acceleration effect of sulfates on setting and strength achievement of LC3 systems could be related to the enhanced formation of ettringite (which will be elaborated upon later); however, the reduction in later-age strength is likely attributed to the increased porosity in cementitious matrices (which will be elaborated upon later) due to a reduced degree of hydration. In addition, in comparison to the LC3 containing CaSO4 salt, the reduction in later-age strength is more significant in the Na2SO4- or K2SO4-admixed counterparts, suggesting the potential deleterious role of alkali cation (i.e., Na+ and K+) on the diffusion-controlled hydration process. One potential reason is that the incorporation of Na+ and K+ modifies the atomic structure and density of calcium-silicate-hydrate (C-S-H) [31], and then slows down late hydration kinetics by delaying the transport of dissolved elements from the reactive OPC grains [35].

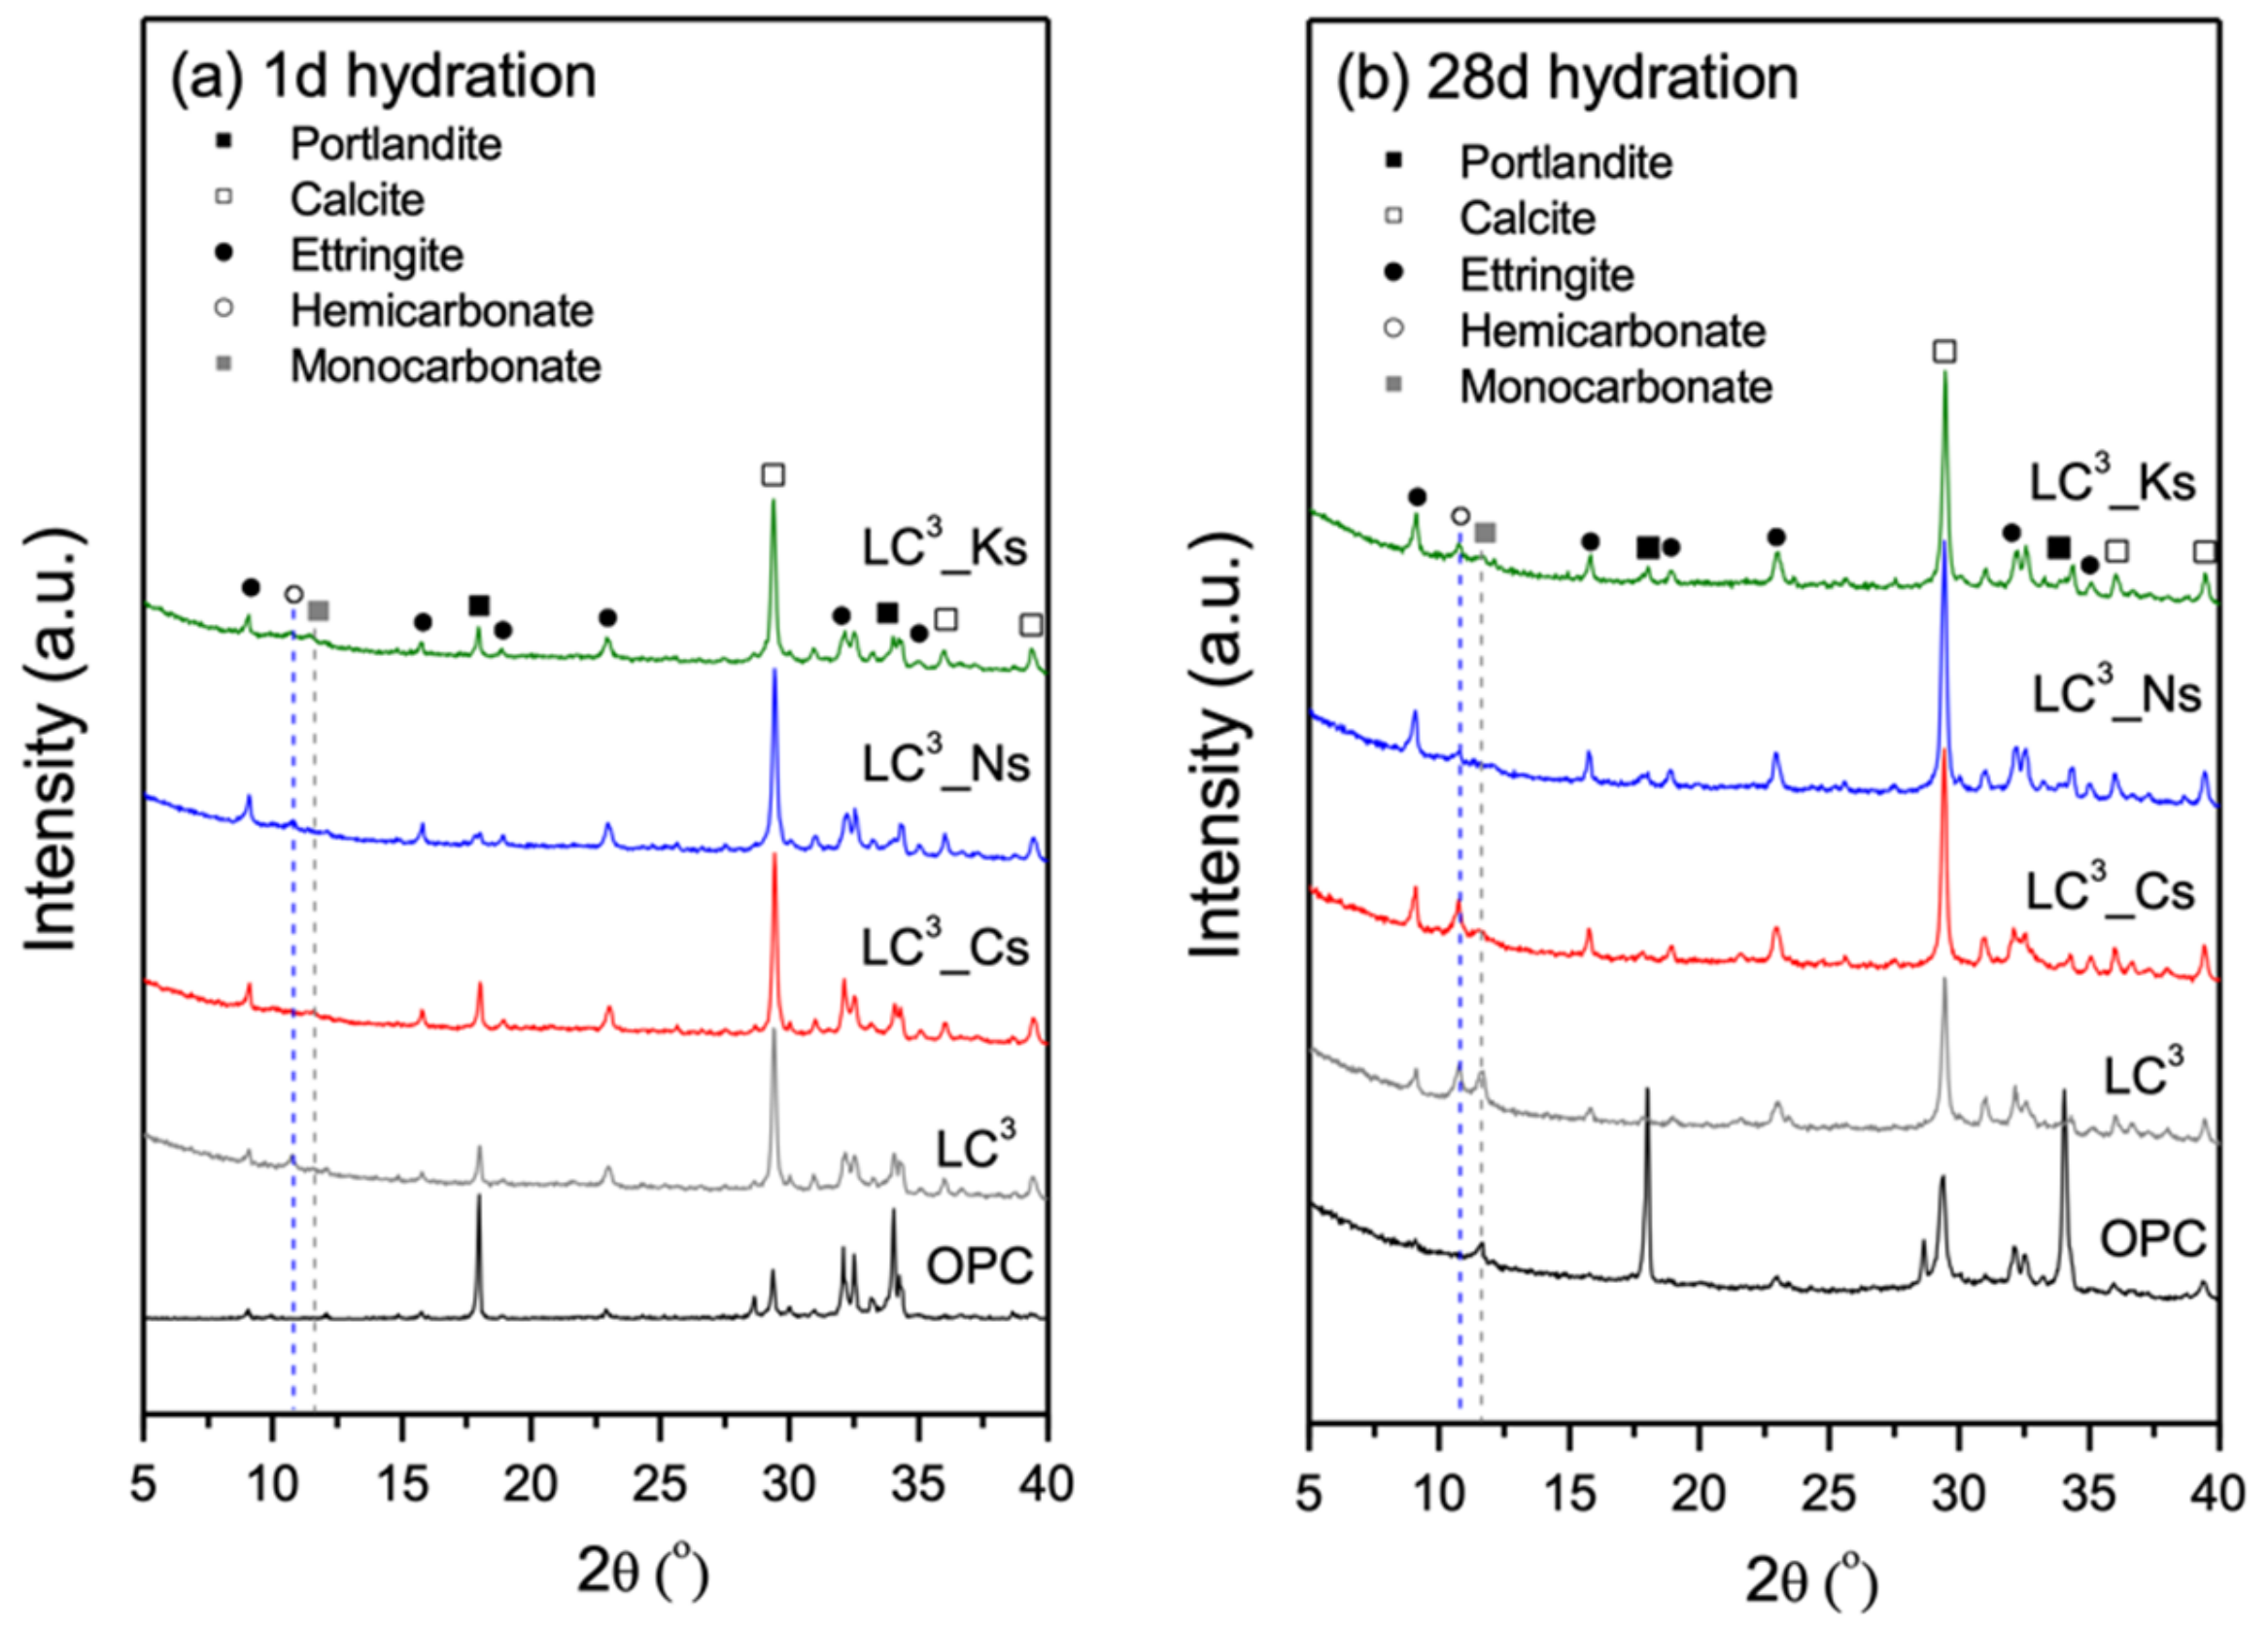
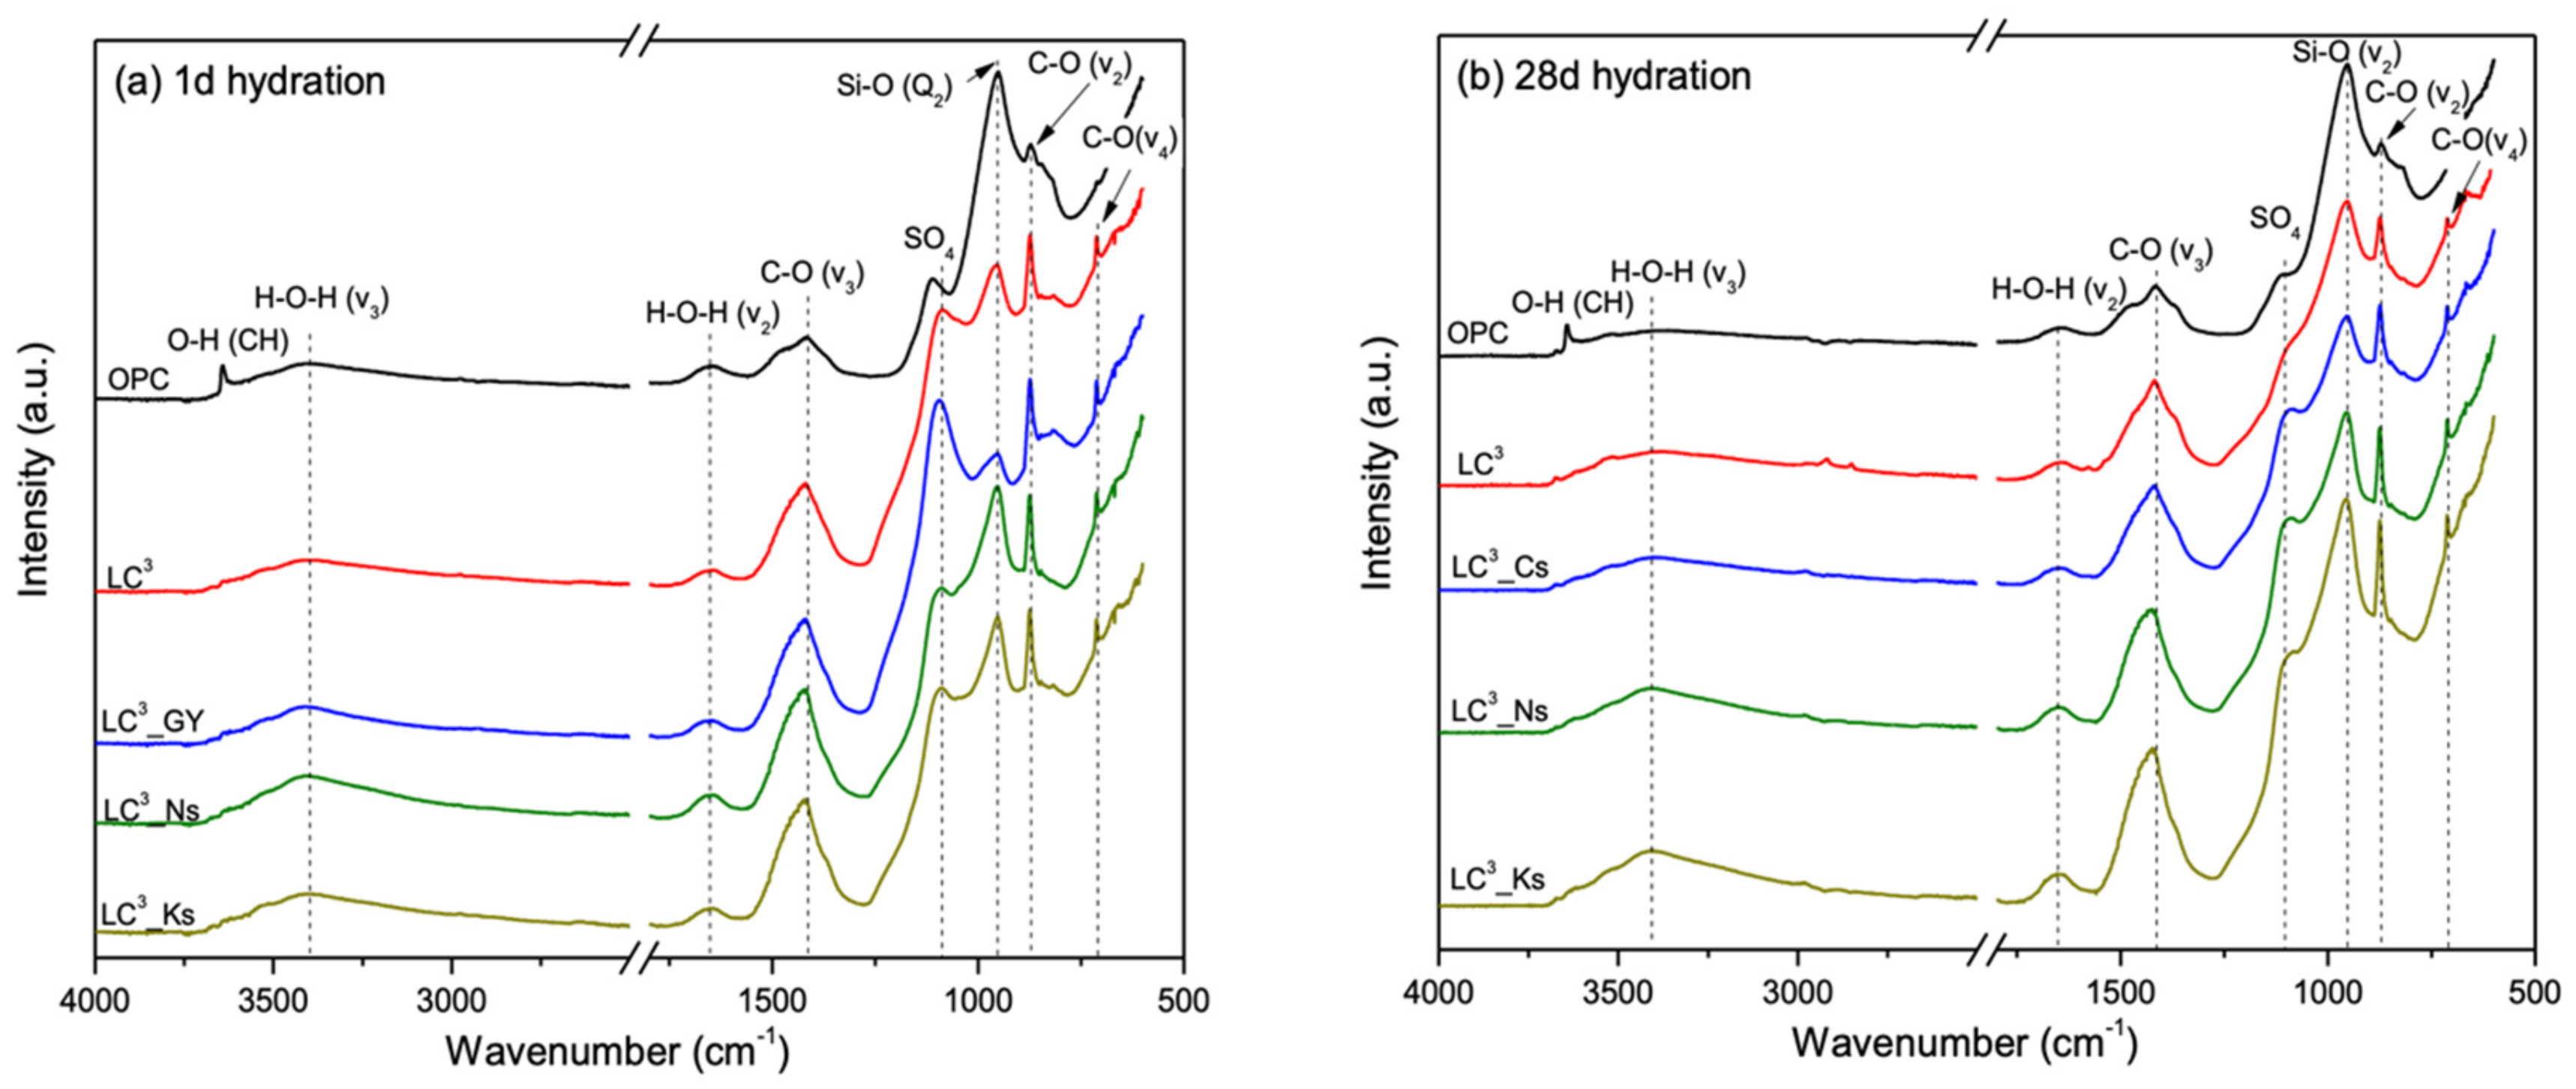
3.3. Phase Assemblage Prior to Carbonation

The XRD patterns, thermogravimetric and derivative thermogravimetric (TG-DTG) diagrams, and FTIR spectra of reference OPC and LC3 pastes at ages of 1 and 28 days are shown in Figure 4, Figure 5 and Figure 6. In comparison to the OPC paste, the LC3 pastes, regardless of the type of sulfate salts incorporated, have substantially lower amounts of portlandite (CH), but higher amounts of AFm phases, owing to the following reactions [36]:
3 CH + AS 2   ( Metakaolin ) + 6 H   C-A-S-H + C 2 A S H 8
C 3 A + 0.5 Cc + 0.5 CH + 11.5 H   C 4 A C 0.5 H 12 ( Hemicarbonate )
AS 2 + 0.5 Cc + 3.5 CH + 8.5 H   C 4 A C 0.5 H 12
At the age of 28 days, only a trace amount of CH is observed in LC3 systems, due to the high reactivity of MK adopted in this study. As evidenced in the XRD patterns, the AFm phases in plain LC3 systems are hemicarbonate (C4Ac0.5H12) and monocarbonate (C4AcH12), in comparison to the reference OPC paste, in which only monocarbonate is observed at 28 days. However, the XRD peak intensity of AFm phases formed in LC3 containing sulfate salts seems to be lower than that of plain LC3 particularly at 28 days, likely due to the preferable AFt phases (ettringite) formation. It is not surprising, as the relative proportion of AFm and AFt phases in a cementitious system is highly influenced by the ratio of reactive sulfate and aluminate [37]. With the incorporation of sulfate salts, the formation of ettringite is noticeably enhanced, as evidenced in high-intensity XRD diffraction peaks, a distinctive mass loss hump at ~70 °C in the TG-DTG diagrams, and an obvious hump assigned to S-O bands in the FTIR spectra. Meanwhile, the CH content in LC3 is reduced with the incorporation of sulfate salts, suggesting that the supplemented sulfate ions boost the ettringite precipitation in LC3 pastes via a potential reaction with CH and reactive alumina (from MK or C3A). On the other hand, the mass loss hump at around 100–150 °C assigned to aluminum-modified C-S-H (i.e., C-A-S-H) in LC3 systems shows larger intensity in those containing Na2SO4 or K2SO4 salts, indicating a modification of water-binding behavior of C-A-S-H with alkali (Na, K) incorporation.
The FTIR spectra of LC3 pastes at 1 day of hydration support the findings that the incorporation of sulfate salts accelerates the early-age hydration, as evidenced by a higher intensity of Si-O (Q2) band at around 970 cm−1 assigned to the in-plane stretching vibration of the Q2 tetrahedra in C-A-S-H products [38,39]. Moreover, it is observed that the band at 1100~1200 cm−1, as assigned to the stretching vibration of SO42− [40,41] in the ettringite phase, is the most significant at 1 day, but then overwhelmed by the Si-O (Q2) band hump at 28 days. In addition, the bands located are around 1417 cm−1 and 875~878 cm−1 are related to the vibration of C-O bonds [39], all of which are more significant for the LC3 system due to the presence of LS.

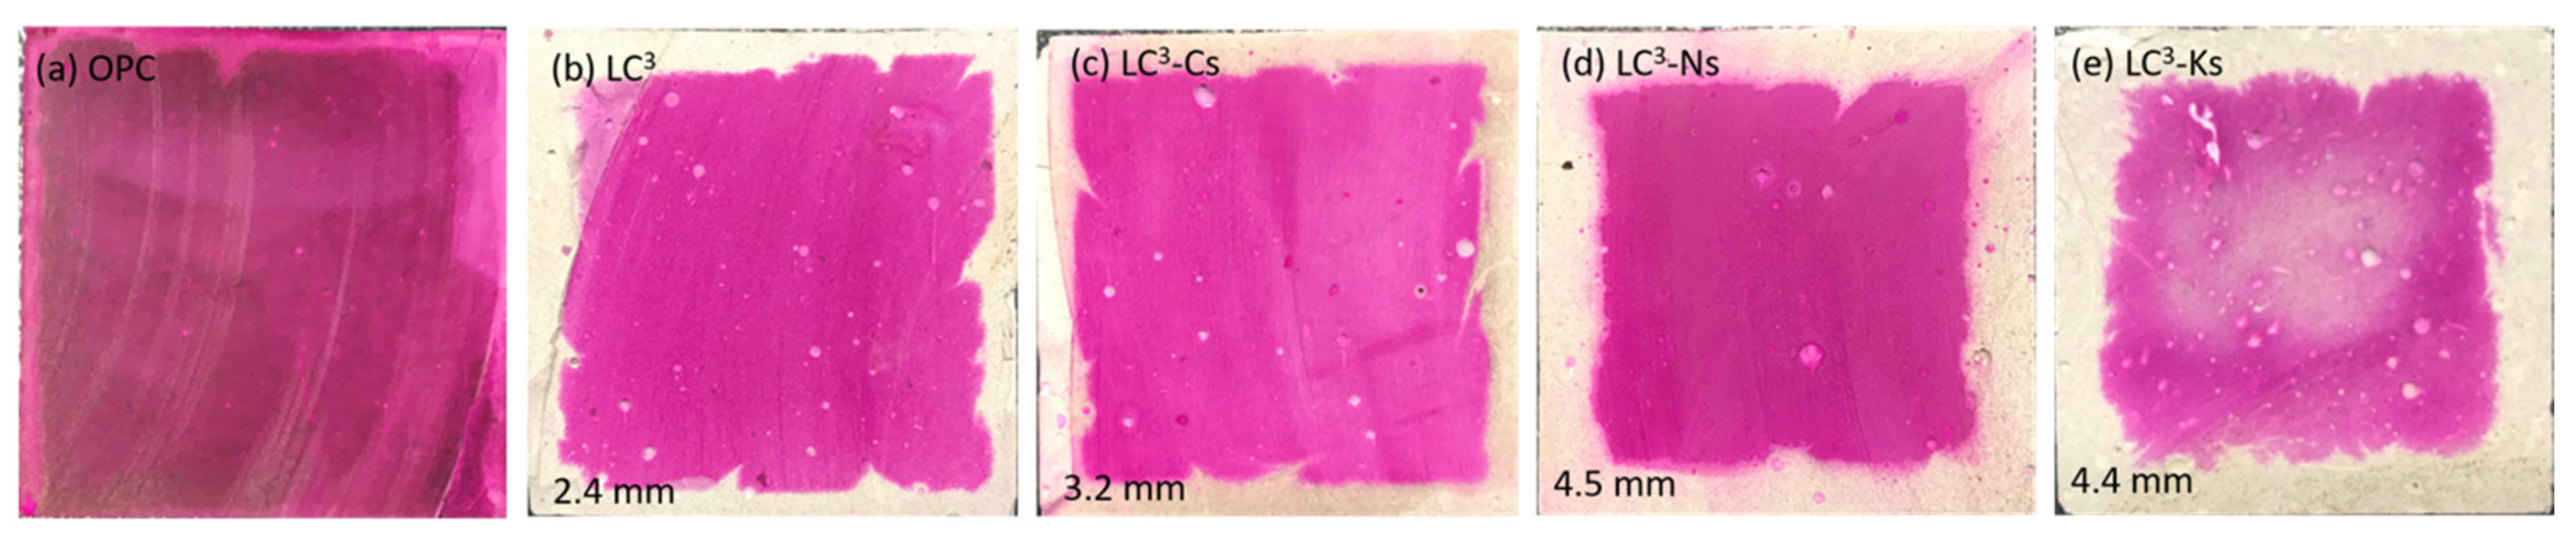
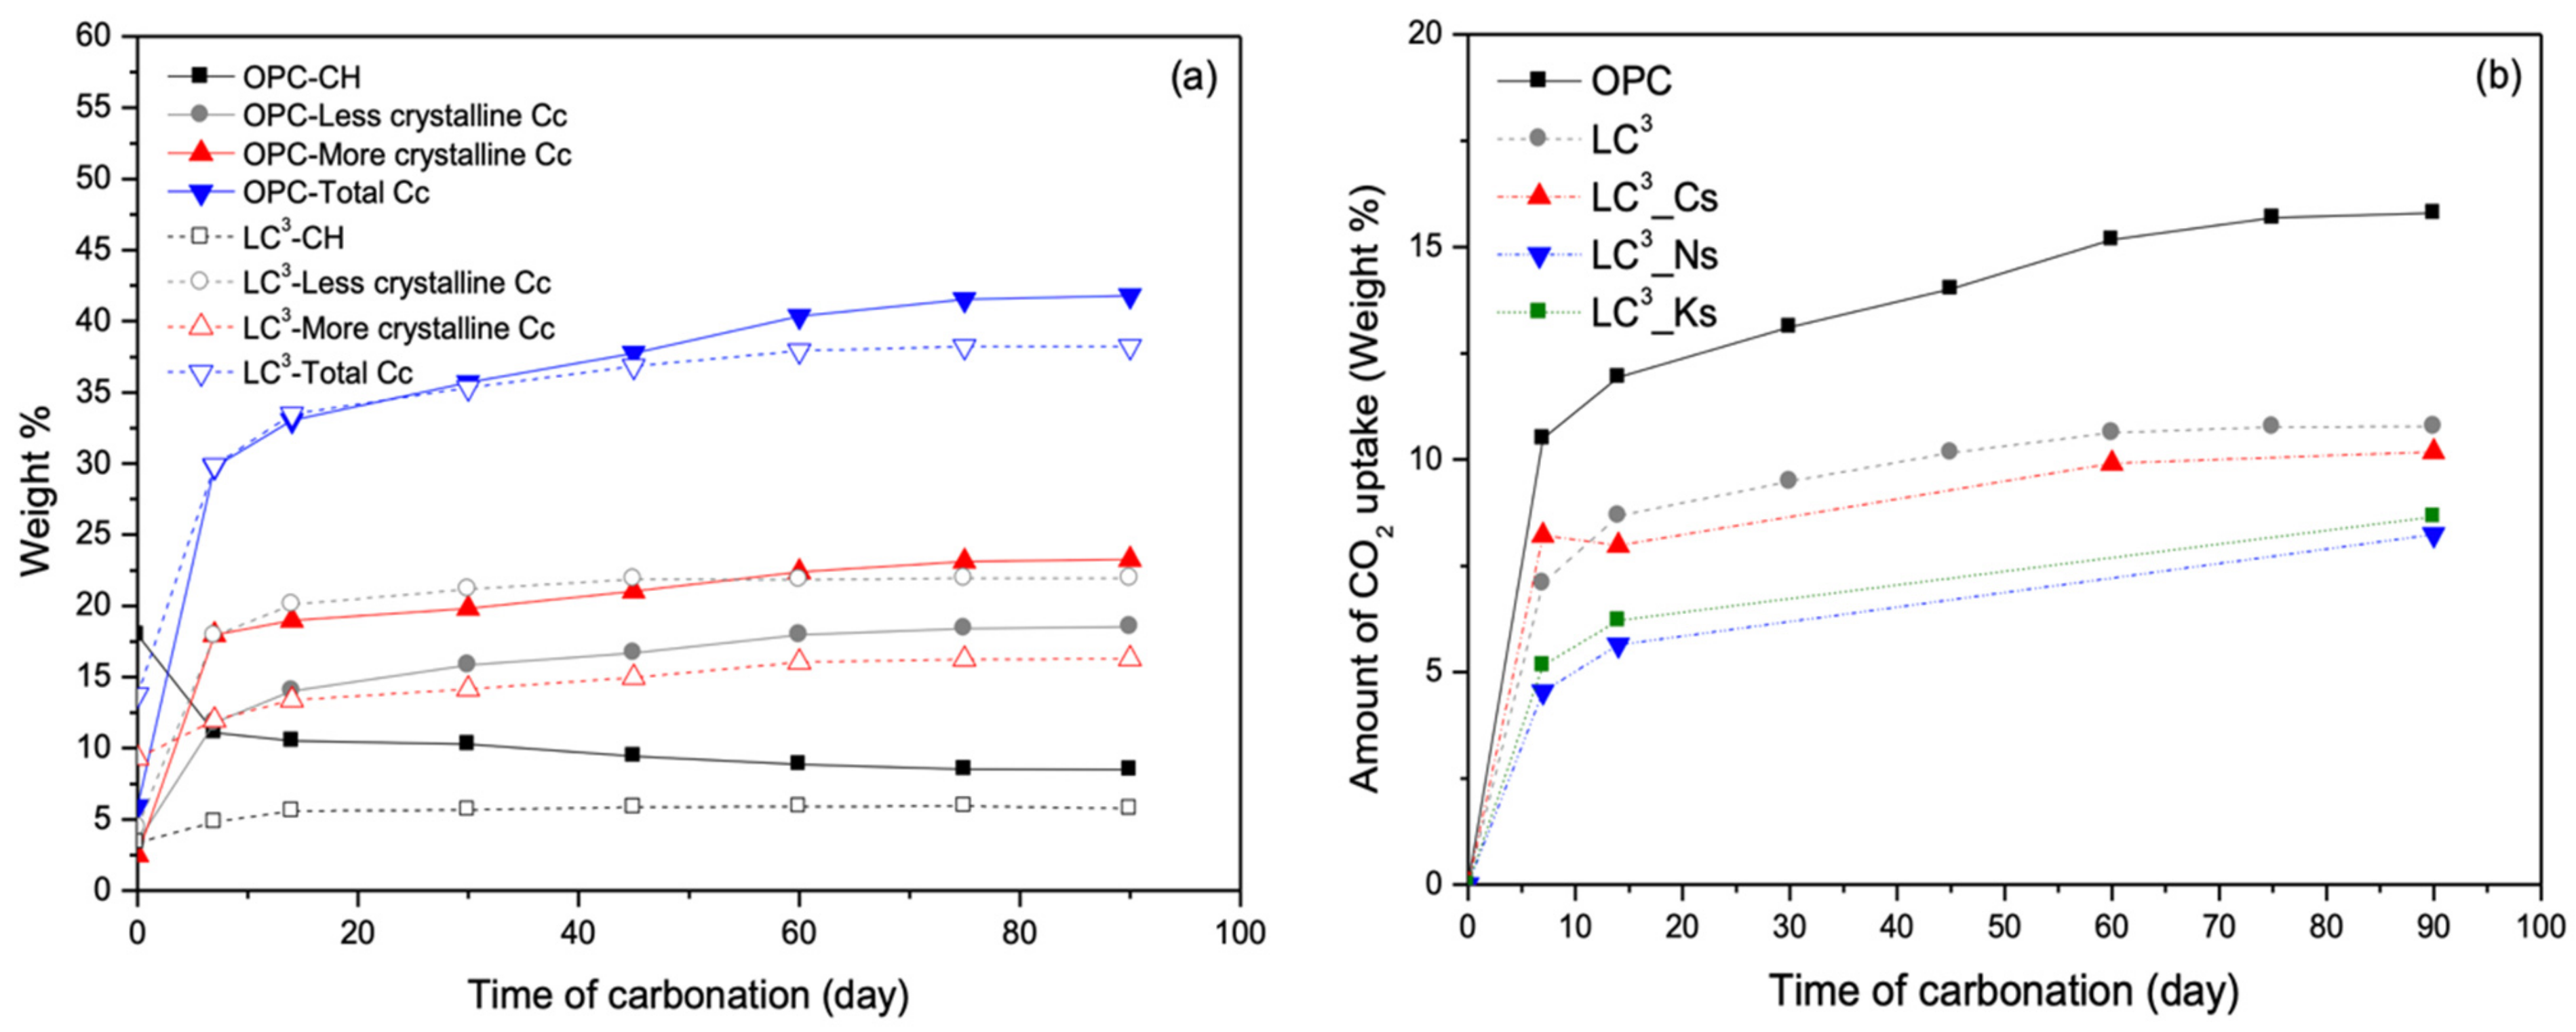
3.4. Carbonation Resistance

Figure 7 shows the photos of the sliced specimens sprayed with phenolphthalein solution and its corresponding average carbonation depths. It can be seen that LC3 pastes show considerably lower carbonation resistance than the reference OPC paste. Even under natural carbonation conditions, the average carbonation depth of LC3 pastes could reach approximately 2.4 to 4.5 mm in 23 weeks, depending on the type of conjugated cation. Moreover, it can be seen that that Na2SO4 and K2SO4 salts noticeably deepen the carbonation depth of LC3 pastes. The lowered carbonation resistance in LC3 with the incorporation of Na2SO4 or K2SO4 salts can be attributed to a reduced CO2 binding capacity and a coarsened pore structure, as will be discussed later.

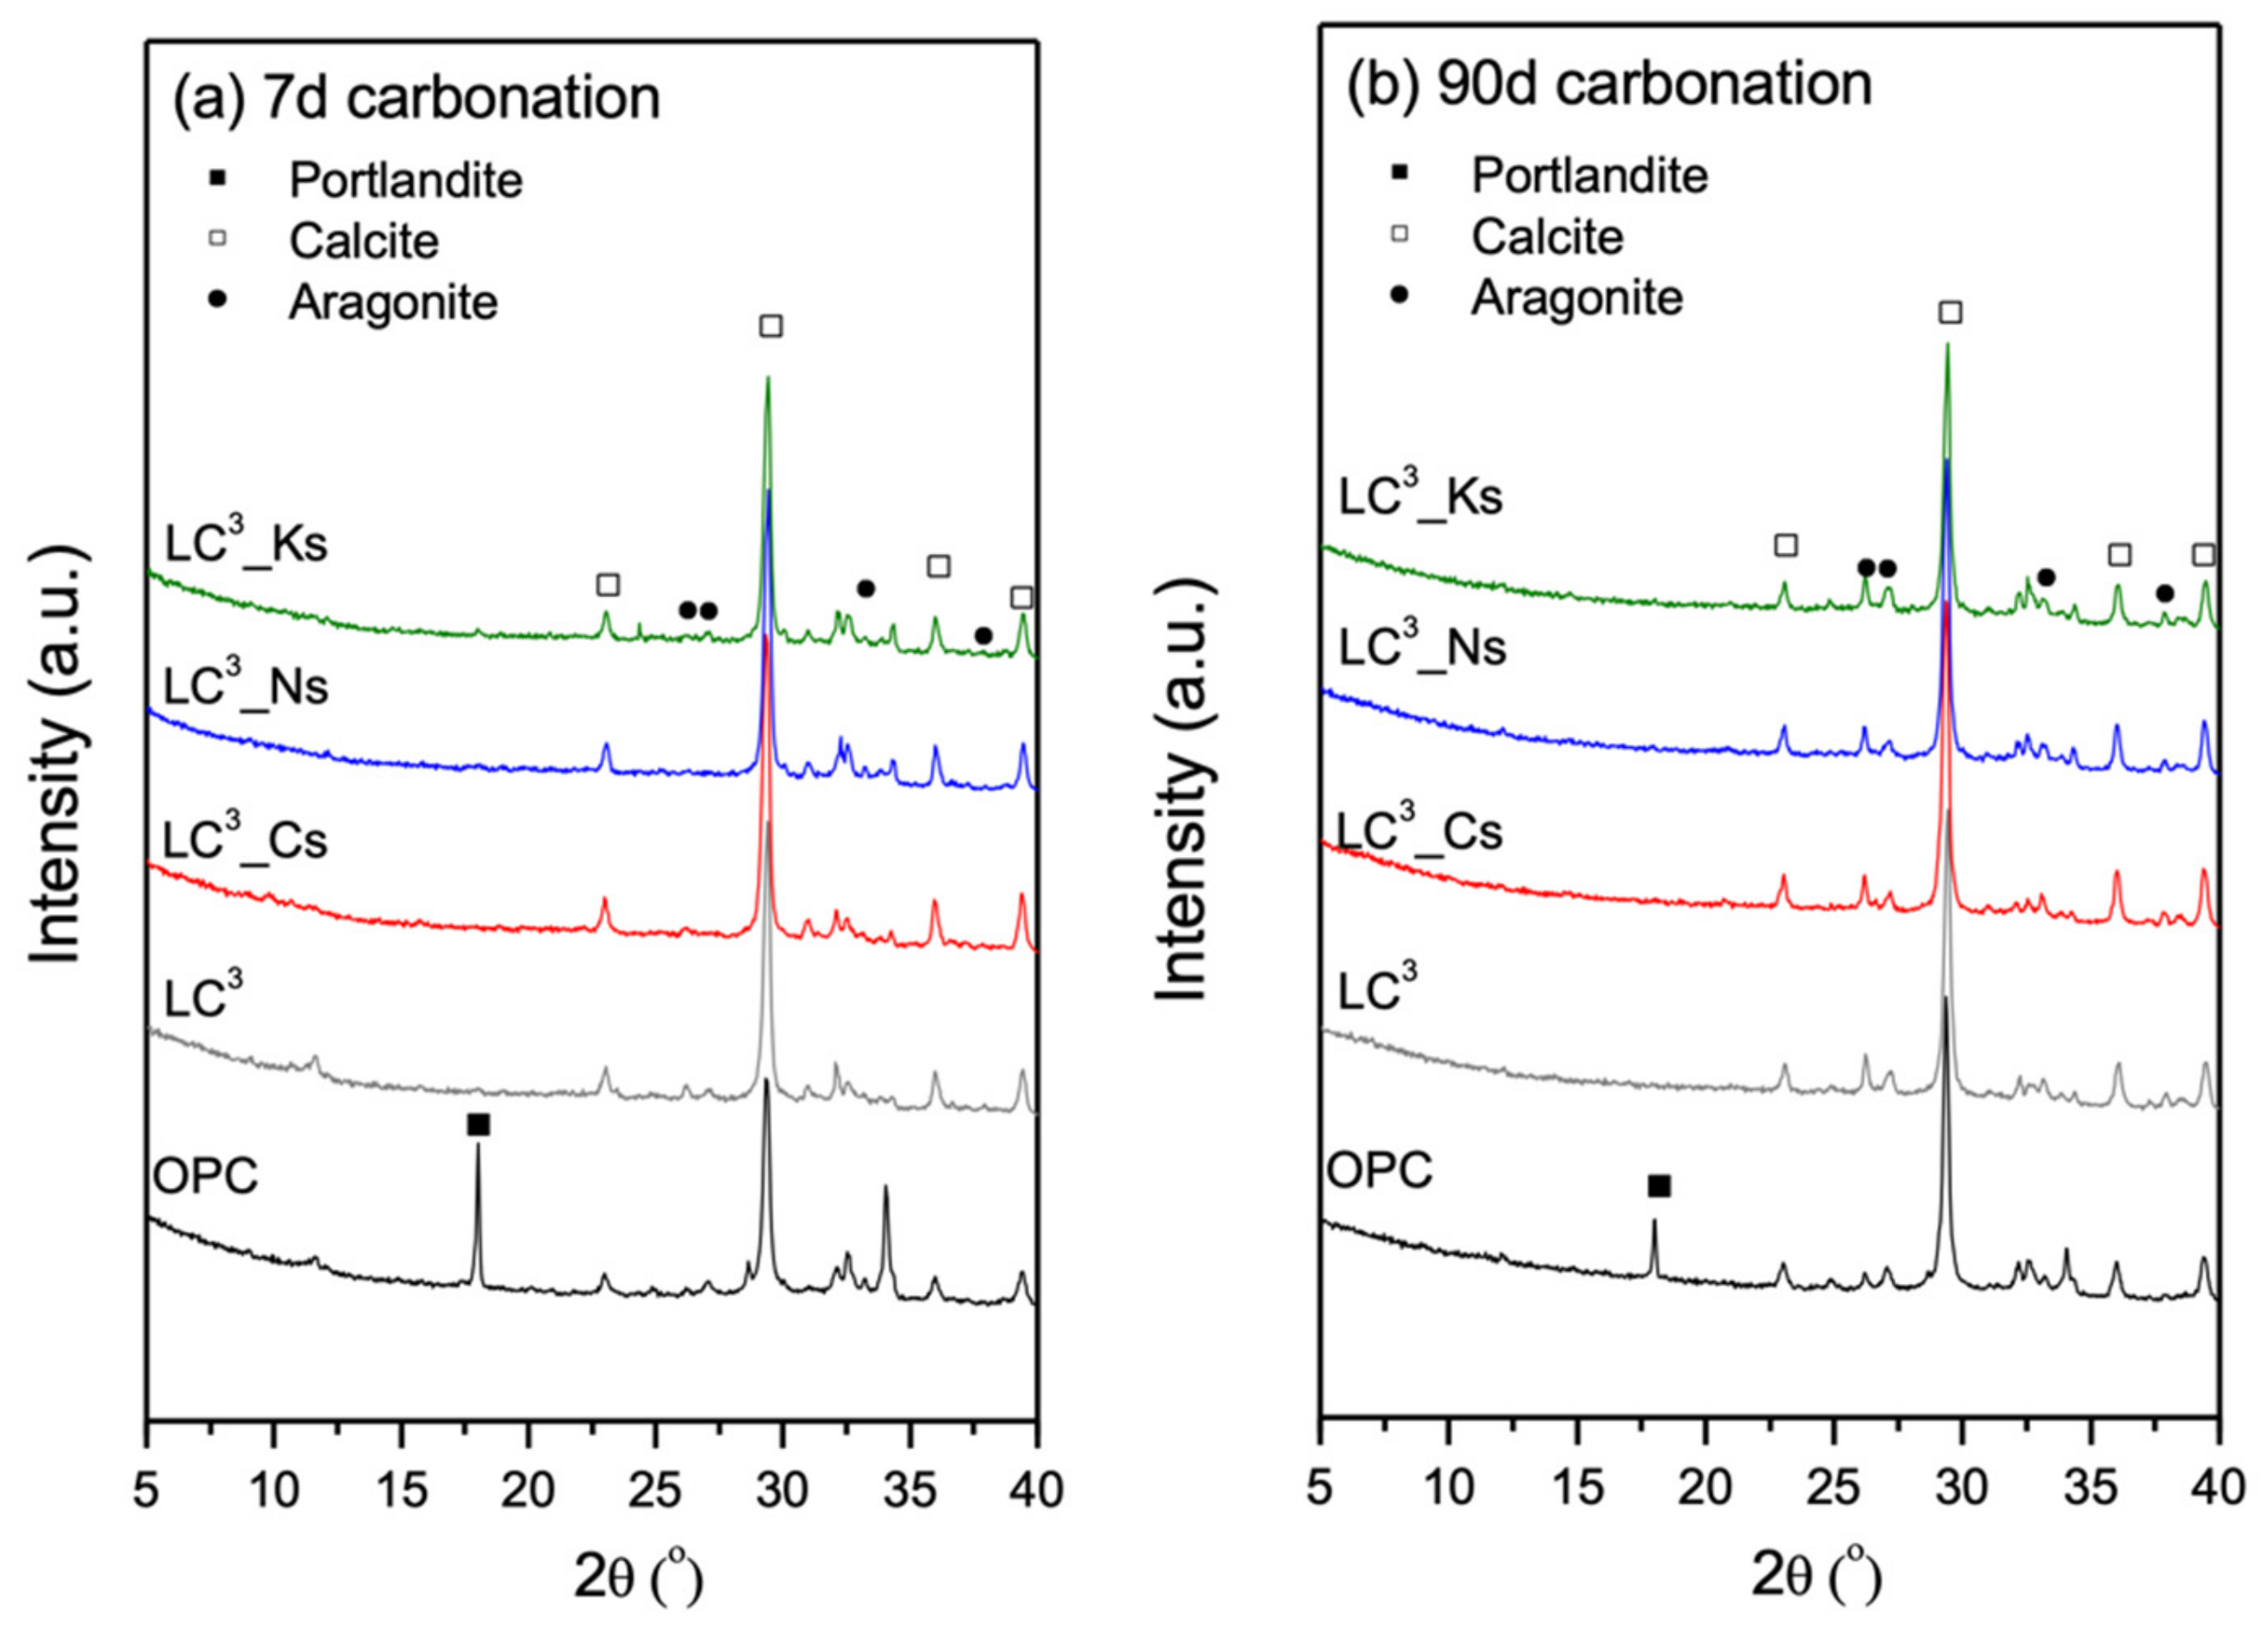
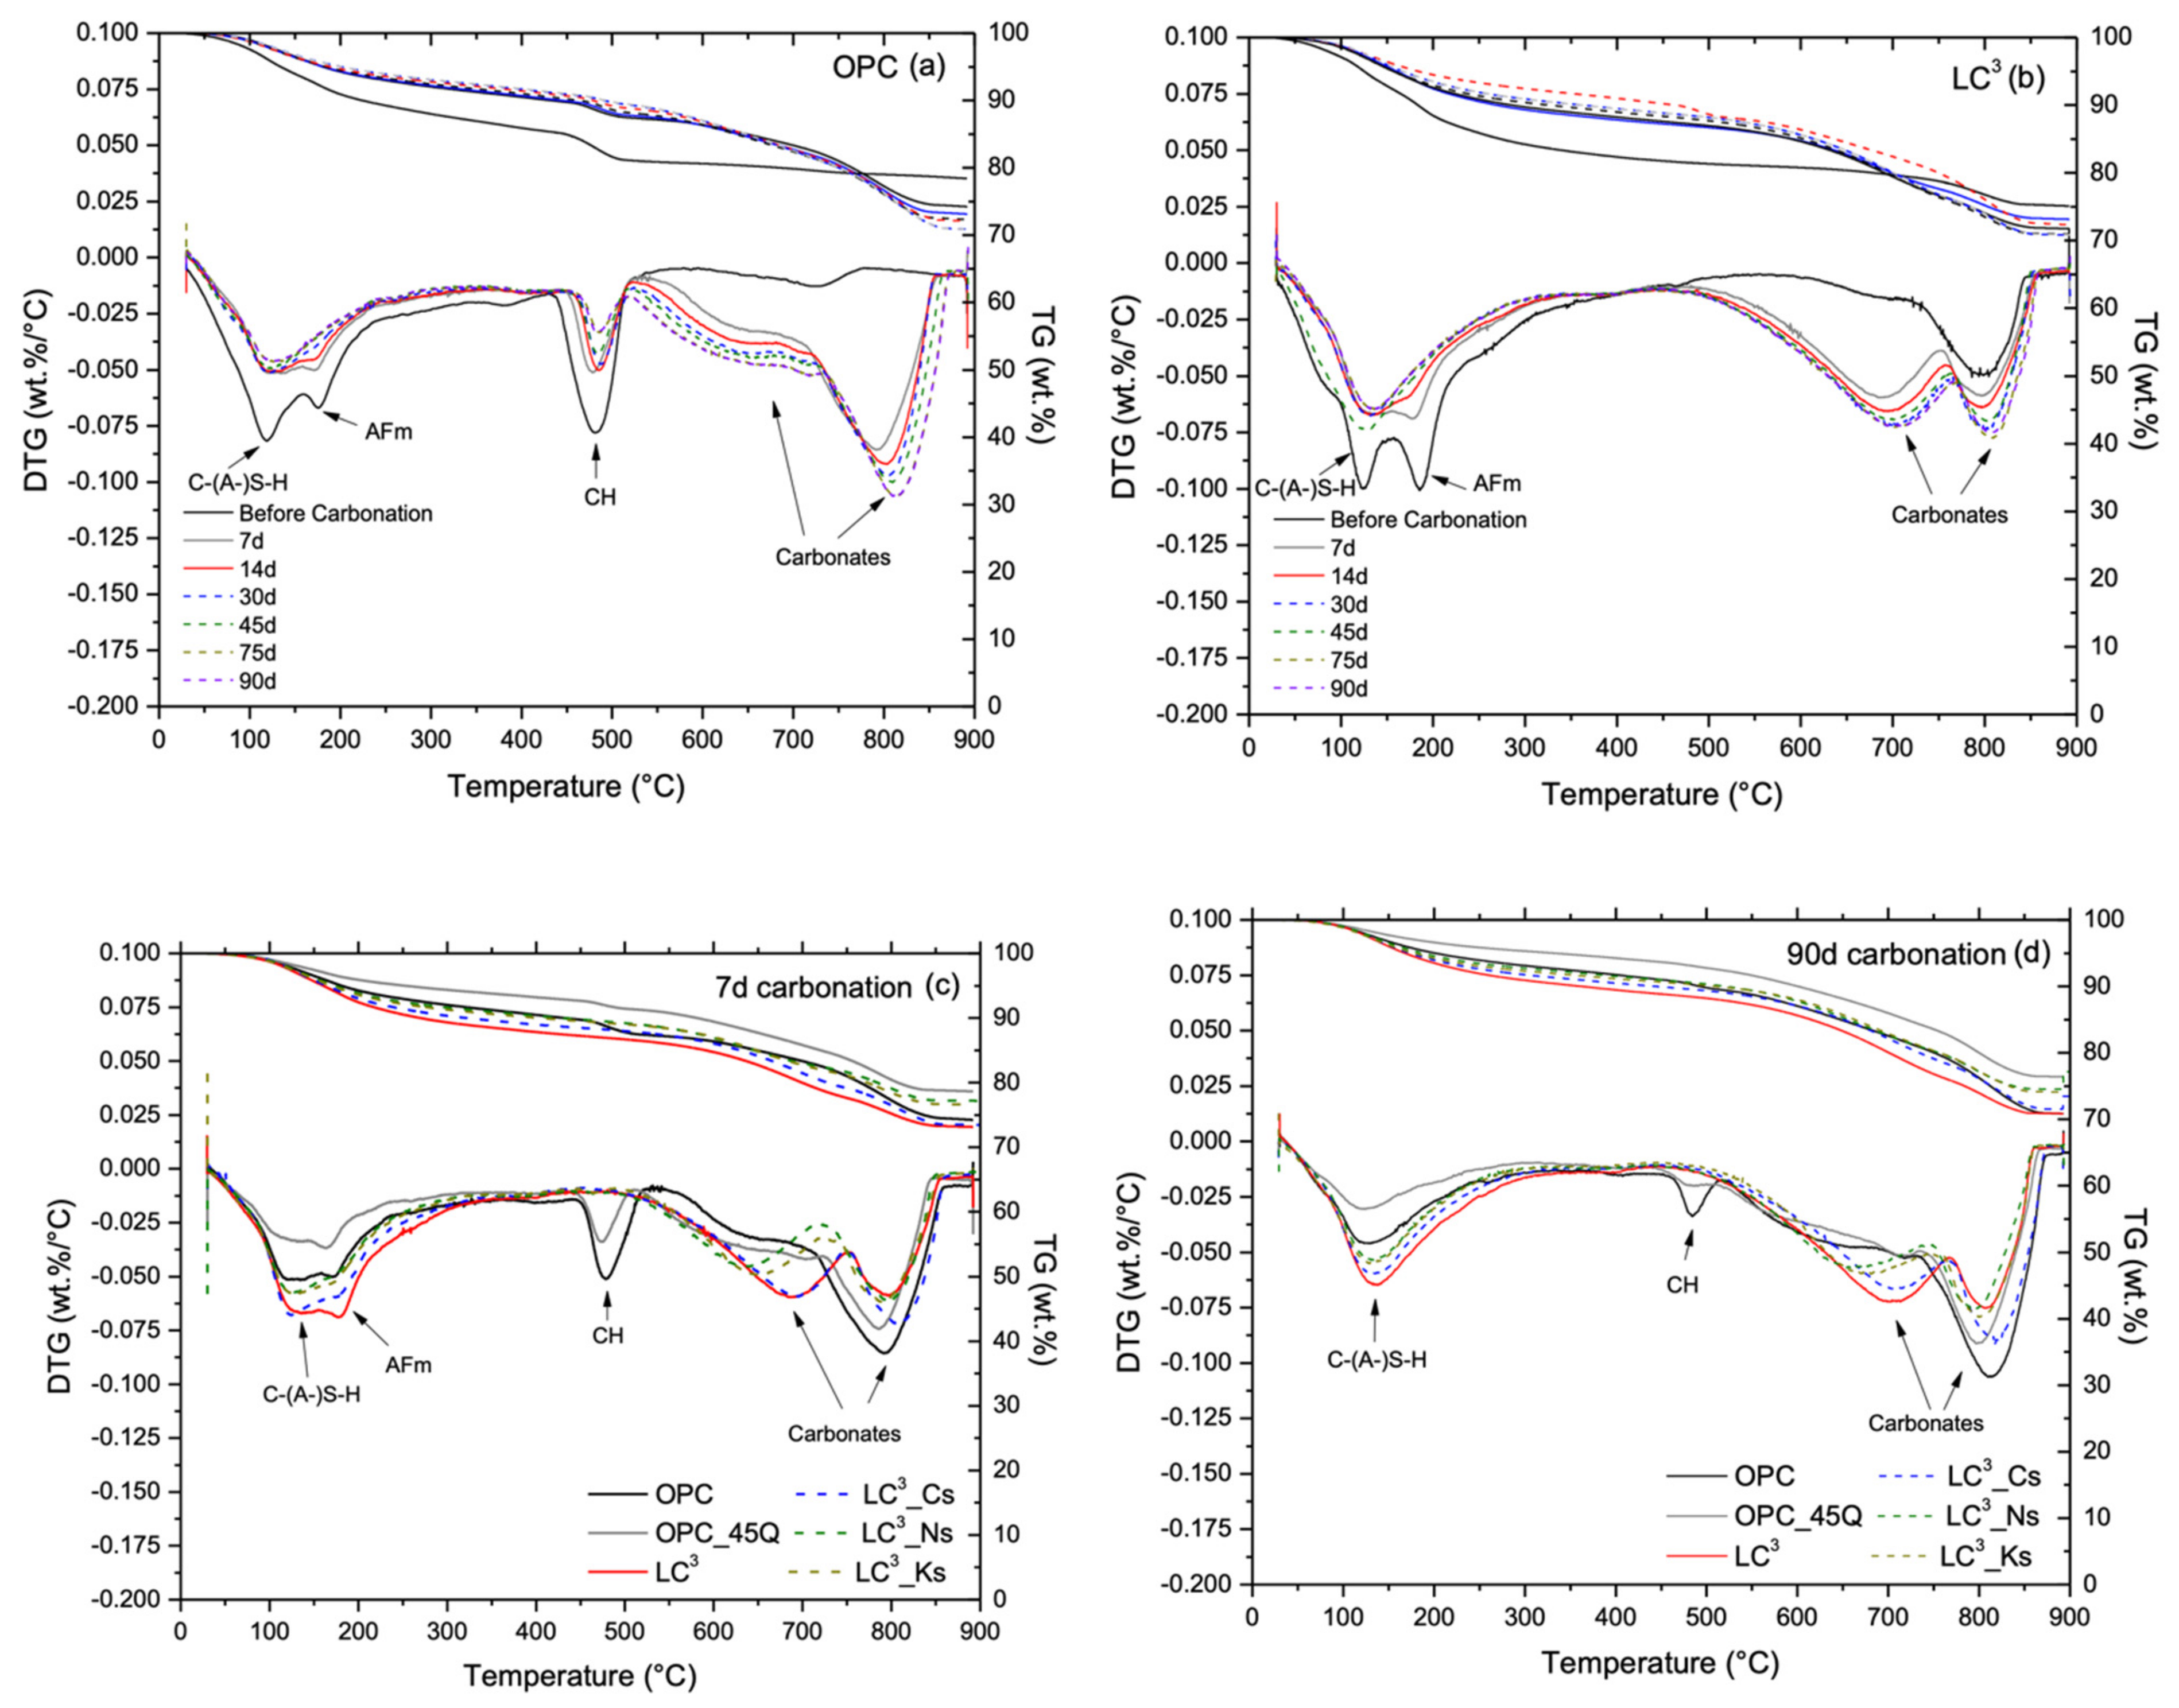
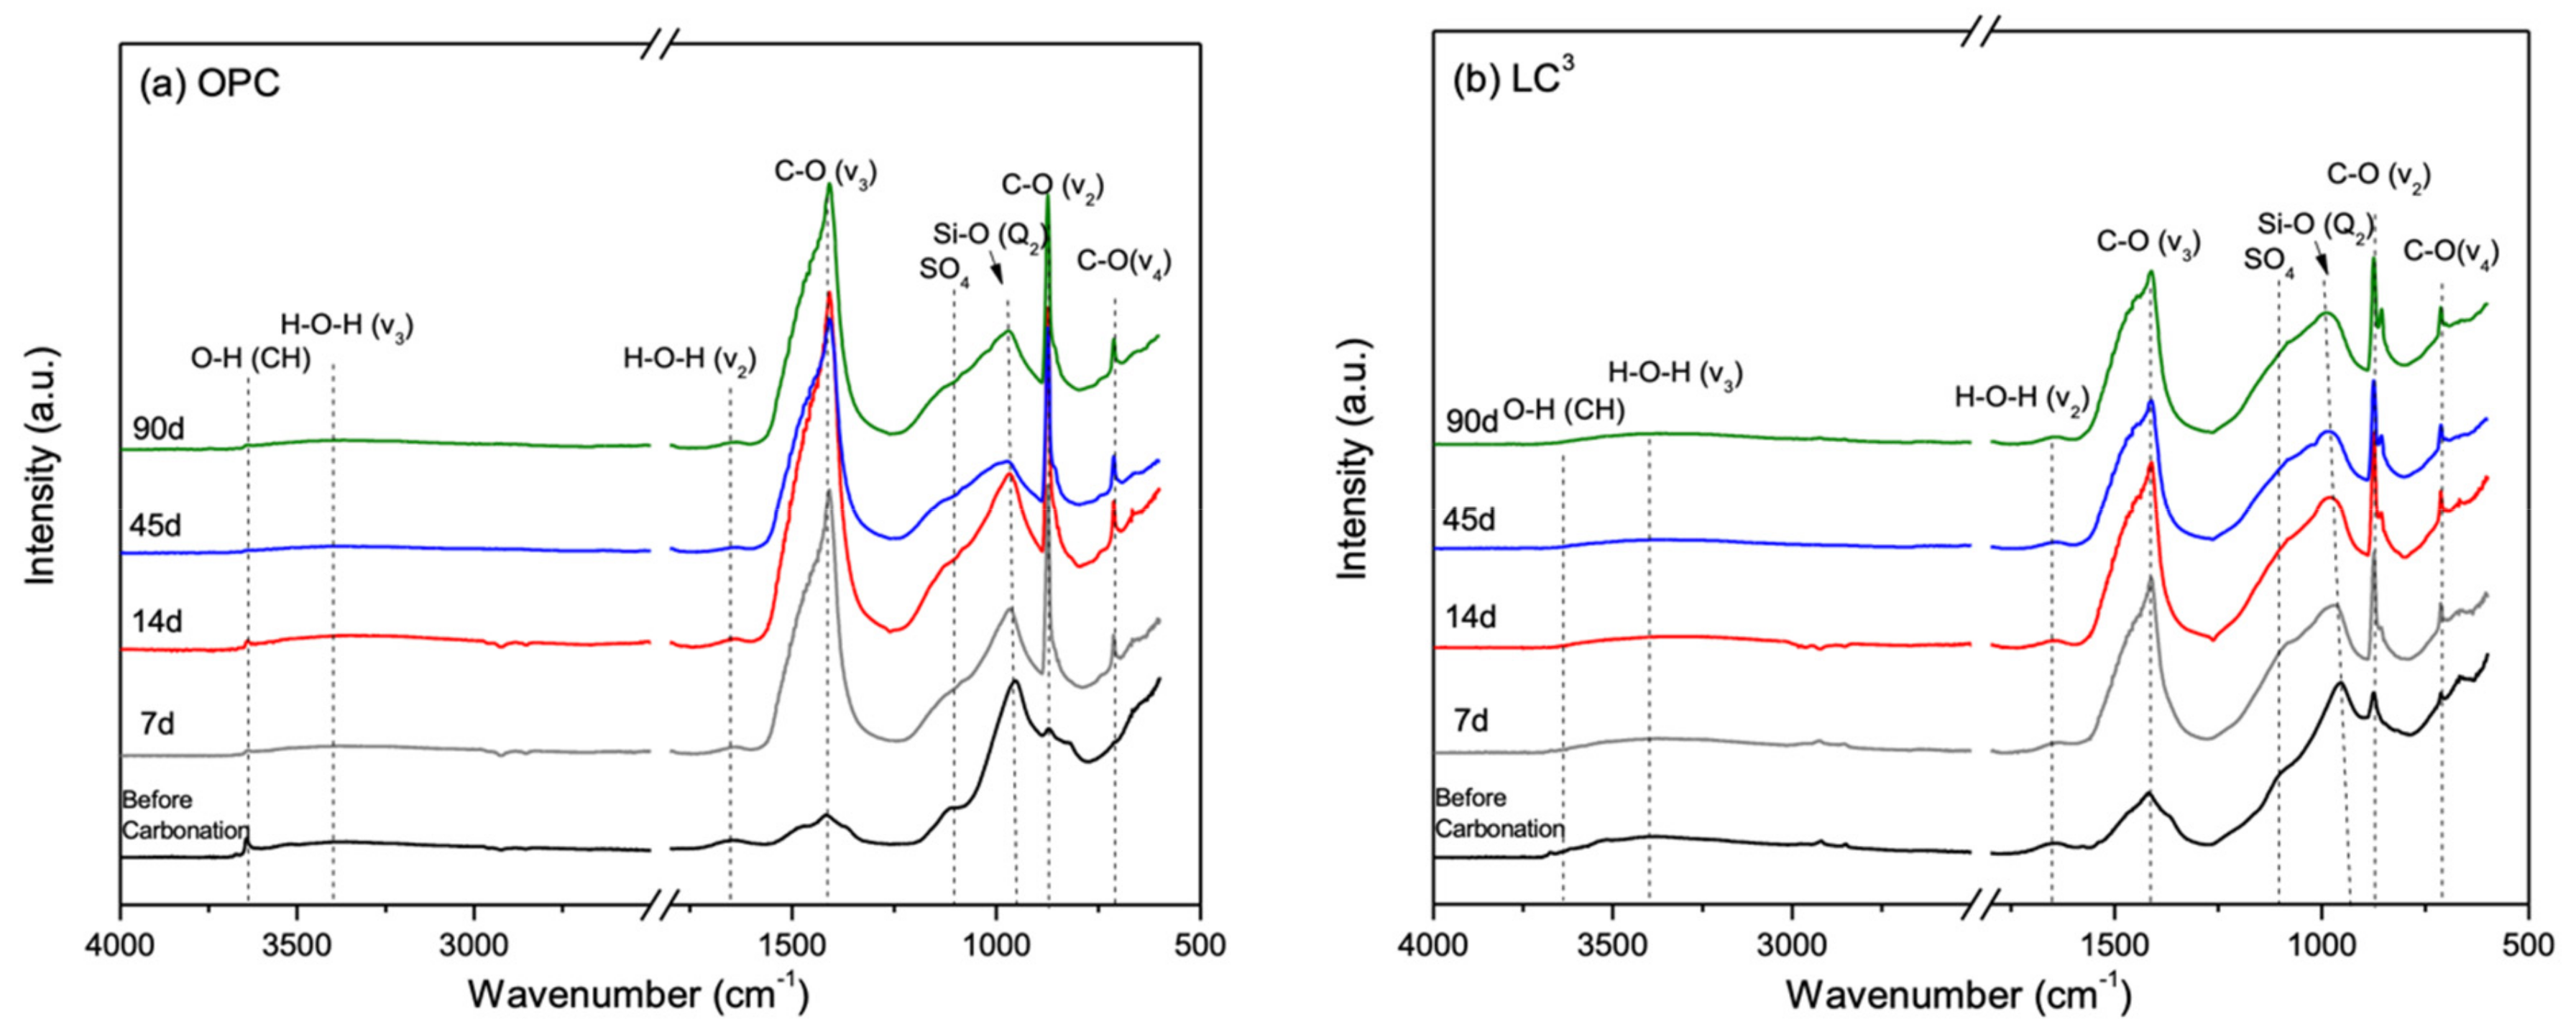
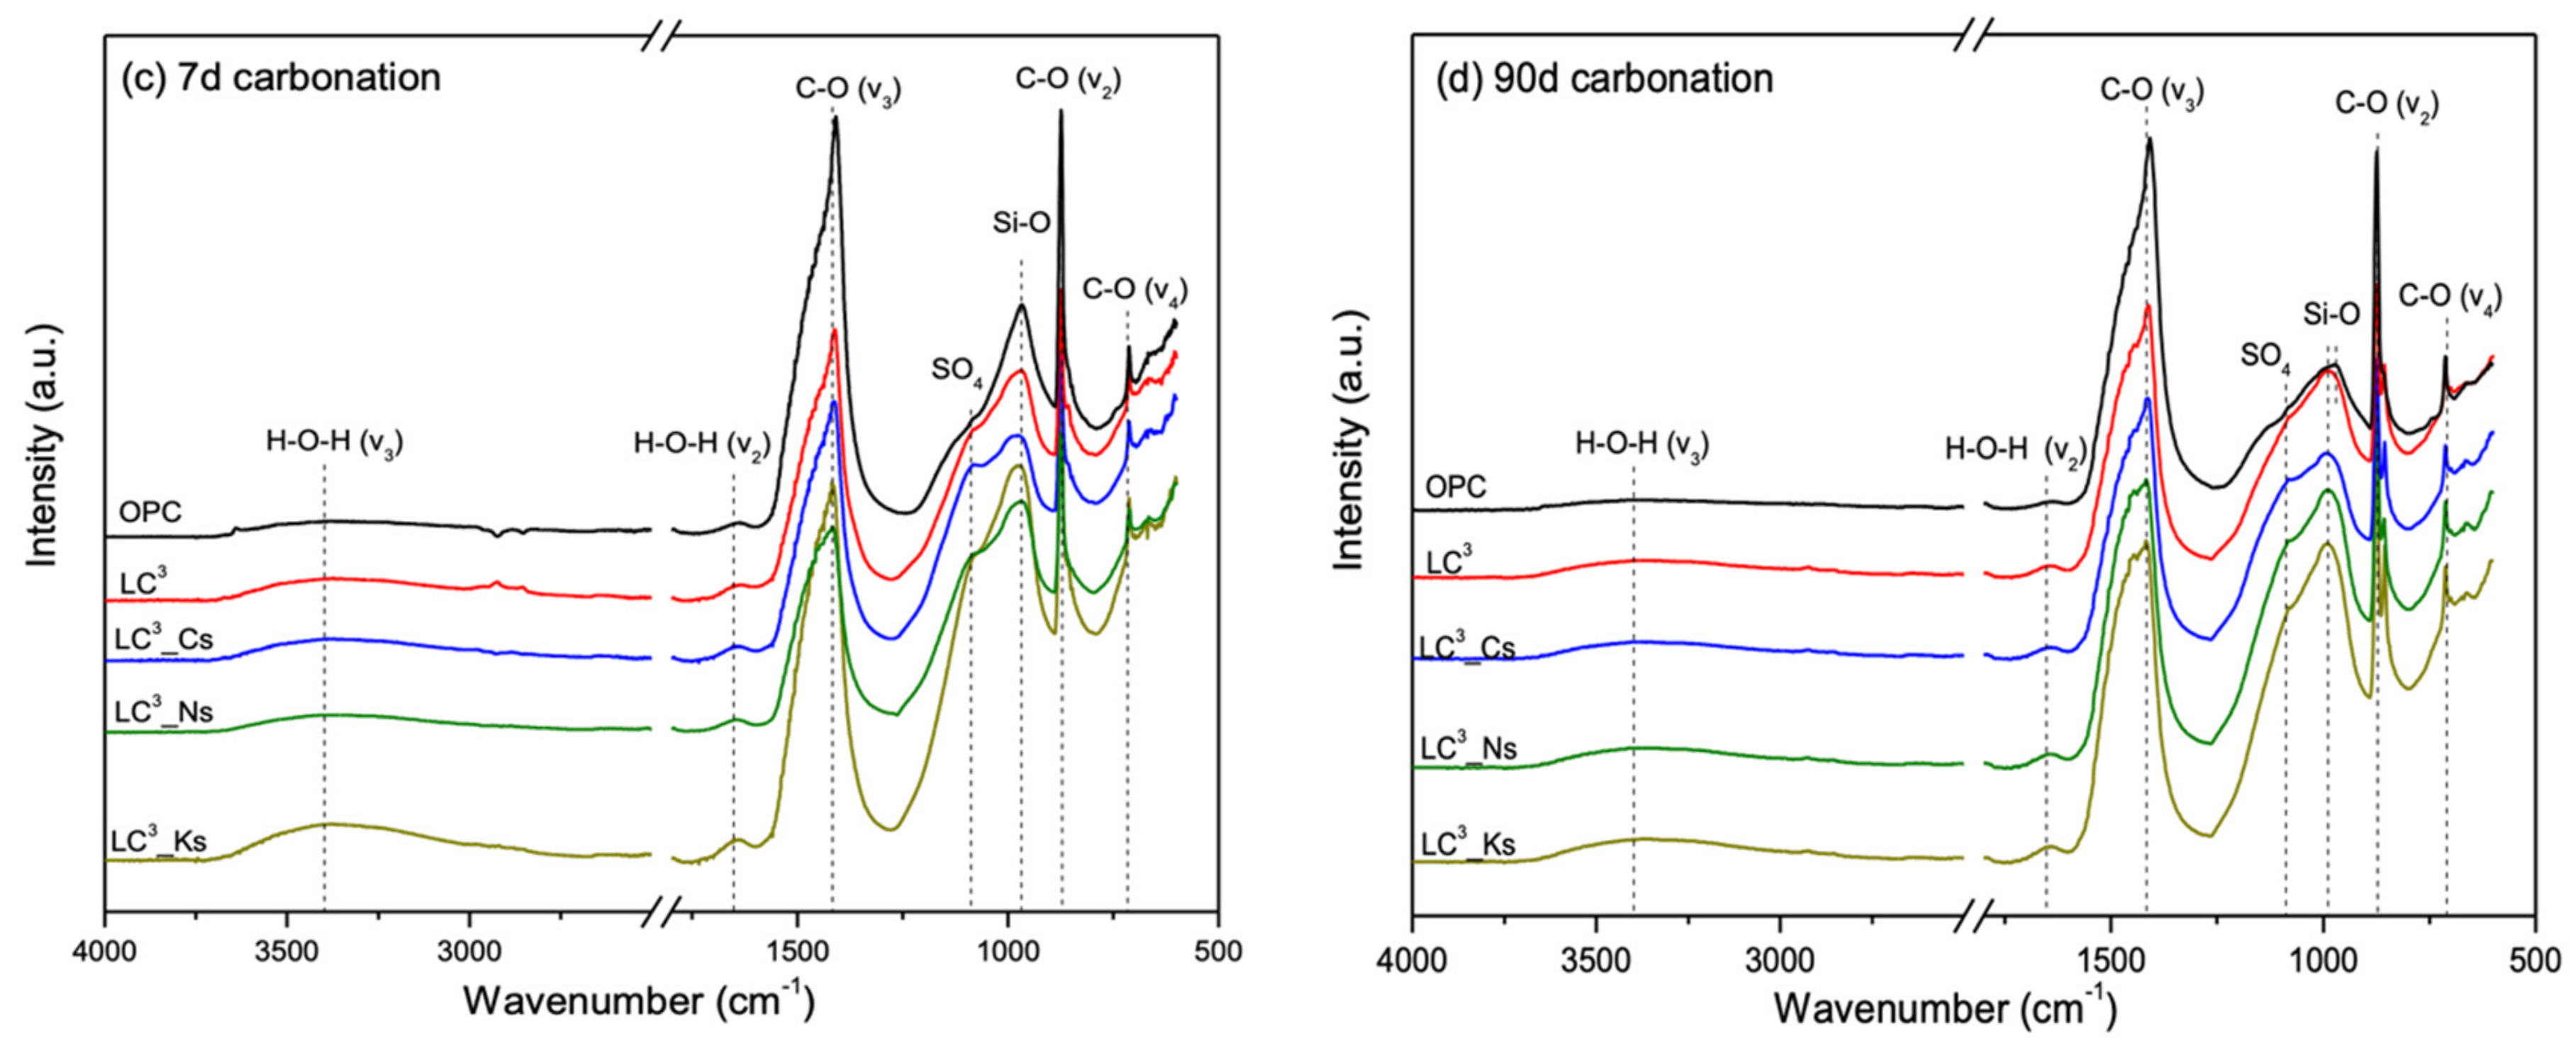
3.5. Phase Alternations Post-Carbonation

The XRD patterns, TG-DTG diagrams, and FTIR spectra of reference OPC and LC3 pastes after natural indoor carbonation are shown in Figure 8, Figure 9 and Figure 10. In the reference OPC paste, natural carbonation leads to a gradual consumption of CH and AFm phases, as accompanied by the precipitation of Cc (calcite and aragonite) [42,43]. Even after 90 days of carbonation, CH still exists while the peaks related to C-S-H gradually diminish, implying simultaneous carbonation of C-S-H and CH in OPC systems [44], while in LC3 systems, which contain little CH prior to carbonation, the peaks related to AFm and C-A-S-H are progressively reduced as carbonation advances. Moreover, two major humps associated with the carbonate pastes can be identified in the TG-DTG diagrams. As mentioned before, this is due to varying levels of crystallization of Cc in samples [21]. Figure 11a shows the time-dependent evolution of mass percentages of CH, less-crystalline Cc, more-crystalline Cc, and total Cc in the reference OPC and LC3 pastes. The carbonation of OPC leads to simultaneous growth of both less- and more-crystalline Cc, while carbonation of LC3 leads to more significant growth of less-crystalline Cc. Although further verification is needed, the more-crystalline Cc may originate from the CH carbonation, while that of less-crystalline Cc may be related to the conversion of C-S-H, C-A-S-H, and AFm phases.
To illustrate the CO2 binding capacity of LC3 pastes, the amount of CO2 uptake could be approximately estimated as:
CO2 uptake = m[CO2]post-carbonationm[CO2]prior to carbonation
in which m[CO2] is the mass loss percentage of samples from 530–900 °C in the TG-DTG diagrams. The amount of CO2 uptake as the mass percentage of the samples as a function of carbonation time is plotted in Figure 11b. It can be seen that the LC3 pastes show considerably lower CO2 binding capacity than the OPC-counterpart, due to a comparatively low amount of calcium. Moreover, the incorporation of sulfate salts noticeably lowers the CO2 binding capacity of LC3 pastes, likely attributed to a lowered amount of hydration products due to a lower degree of hydration. This finding is in alignment with the previous observations that alkali cation shows a noticeable deleterious effect on slowing down the late hydration process.
The FTIR spectra show a magnified increase of hump intensity related to C-O bonds, due to the intensive formation of carbonates in the carbonated pastes. Moreover, the hump assigned to the in-plane stretching vibration of the Q2 tetrahedra in C-A-S-H products in LC3 shifts from 970 cm−1 to 1000 cm−1 upon carbonation, in comparison to that of reference OPC paste. This shift in the wavenumber indicates an alteration of the molecular structure of C-A-S-H in LC3 pastes, due to carbonation-induced decalcification.

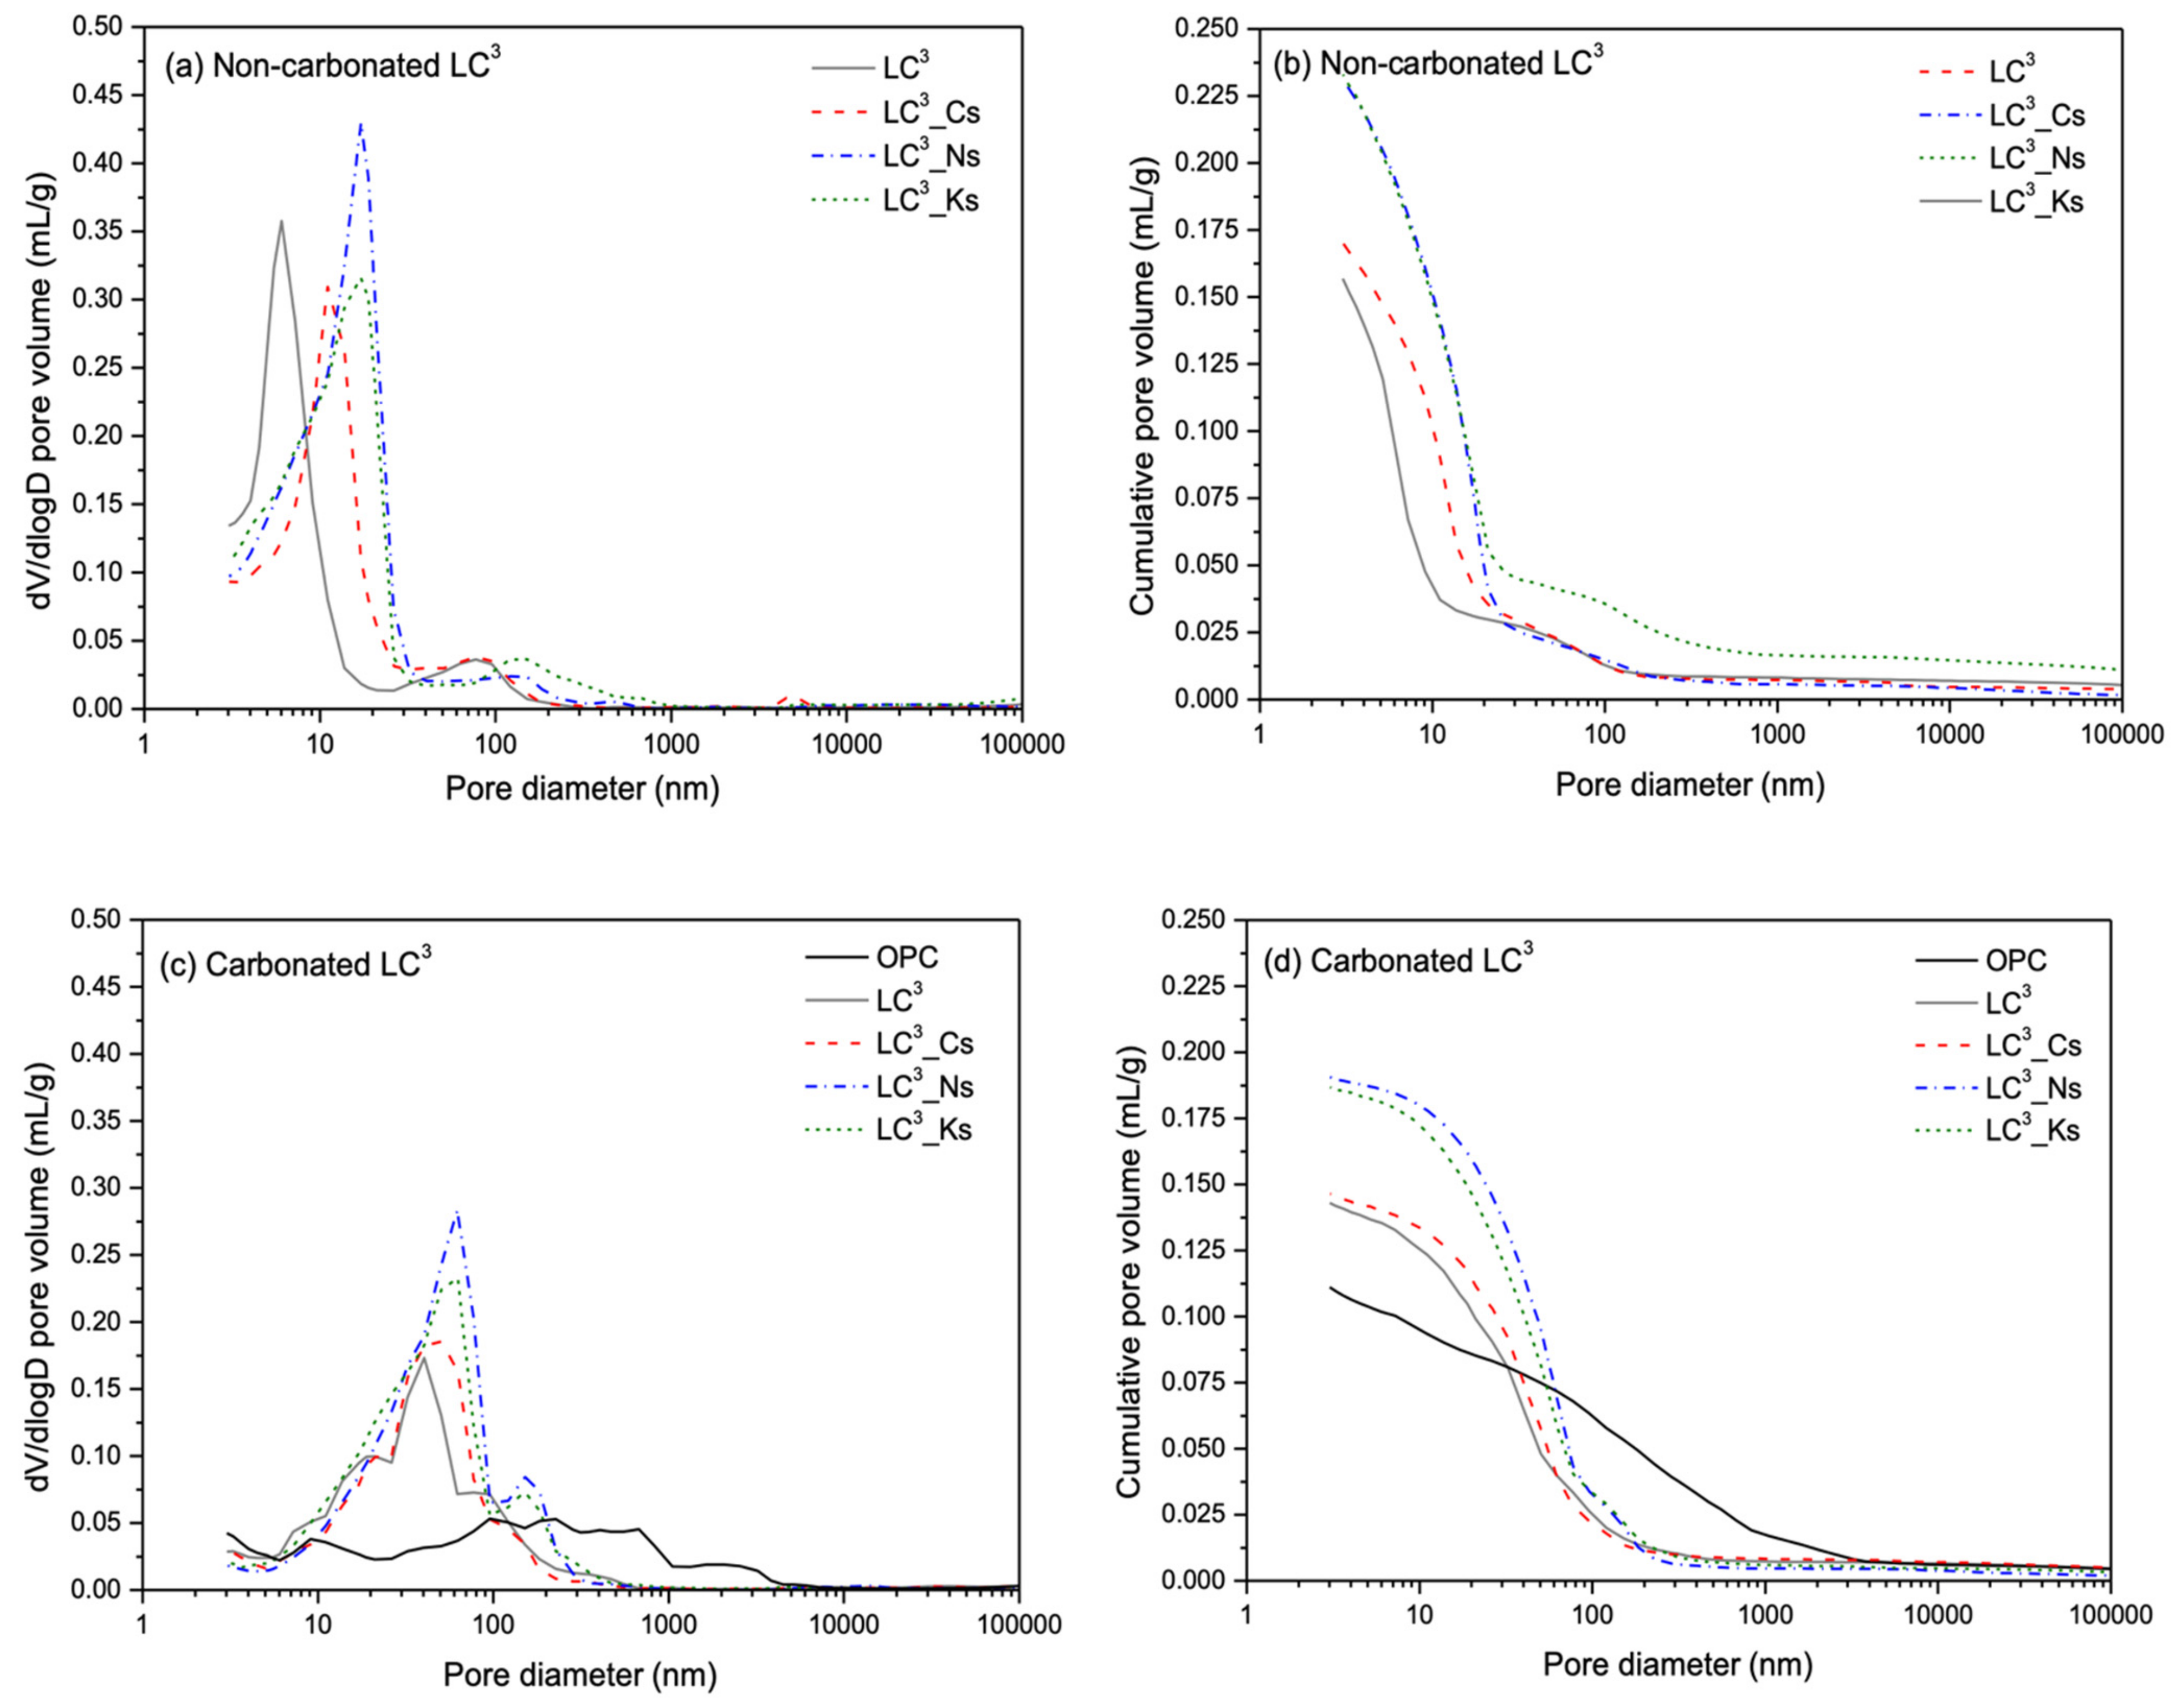
3.6. Pore Structure Alterations

The MIP pore size distributions of reference OPC and LC3 pastes without and with natural carbonation are compared in Figure 12. The comparison of pore structures of non-carbonated OPC and LC3 pastes with the same w/p ratio has been reported in the literature, suggesting that LC3 generally has a refined pore structure than OPC-counterparts at late ages, owing to the physiochemical roles of MK [3,45,46]. In non-carbonated states, the incorporation of sulfate salts noticeably enlarges the porosity and coarsens the pore structure of LC3, particularly for the Na2SO4 and K2SO4 salts. This coarsening effect on pore structure is reflected well by the lowered compressive strengths at later ages of LC3 pastes containing Na2SO4 and K2SO4 salts. Moreover, the coarsened pore structure can further undermine the carbonation resistance of LC3 pastes containing Na2SO4 and K2SO4 salts by facilitating the transport of gaseous CO2 into the interiors of exposed specimens, thus leading to a deepened carbonation depth.
Natural carbonation leads to a reduced MIP porosity and coarsened pore structure in LC3 pastes, similar to the findings for OPC pastes. The reduction in porosity may be attributed to the pore filling effects of Cc and/or alkali-doped Cc crystals; while the pore coarsening effects may be attributed to the decalcification-induced polymerization of C-S-H and C-A-S-H [44,47,48].

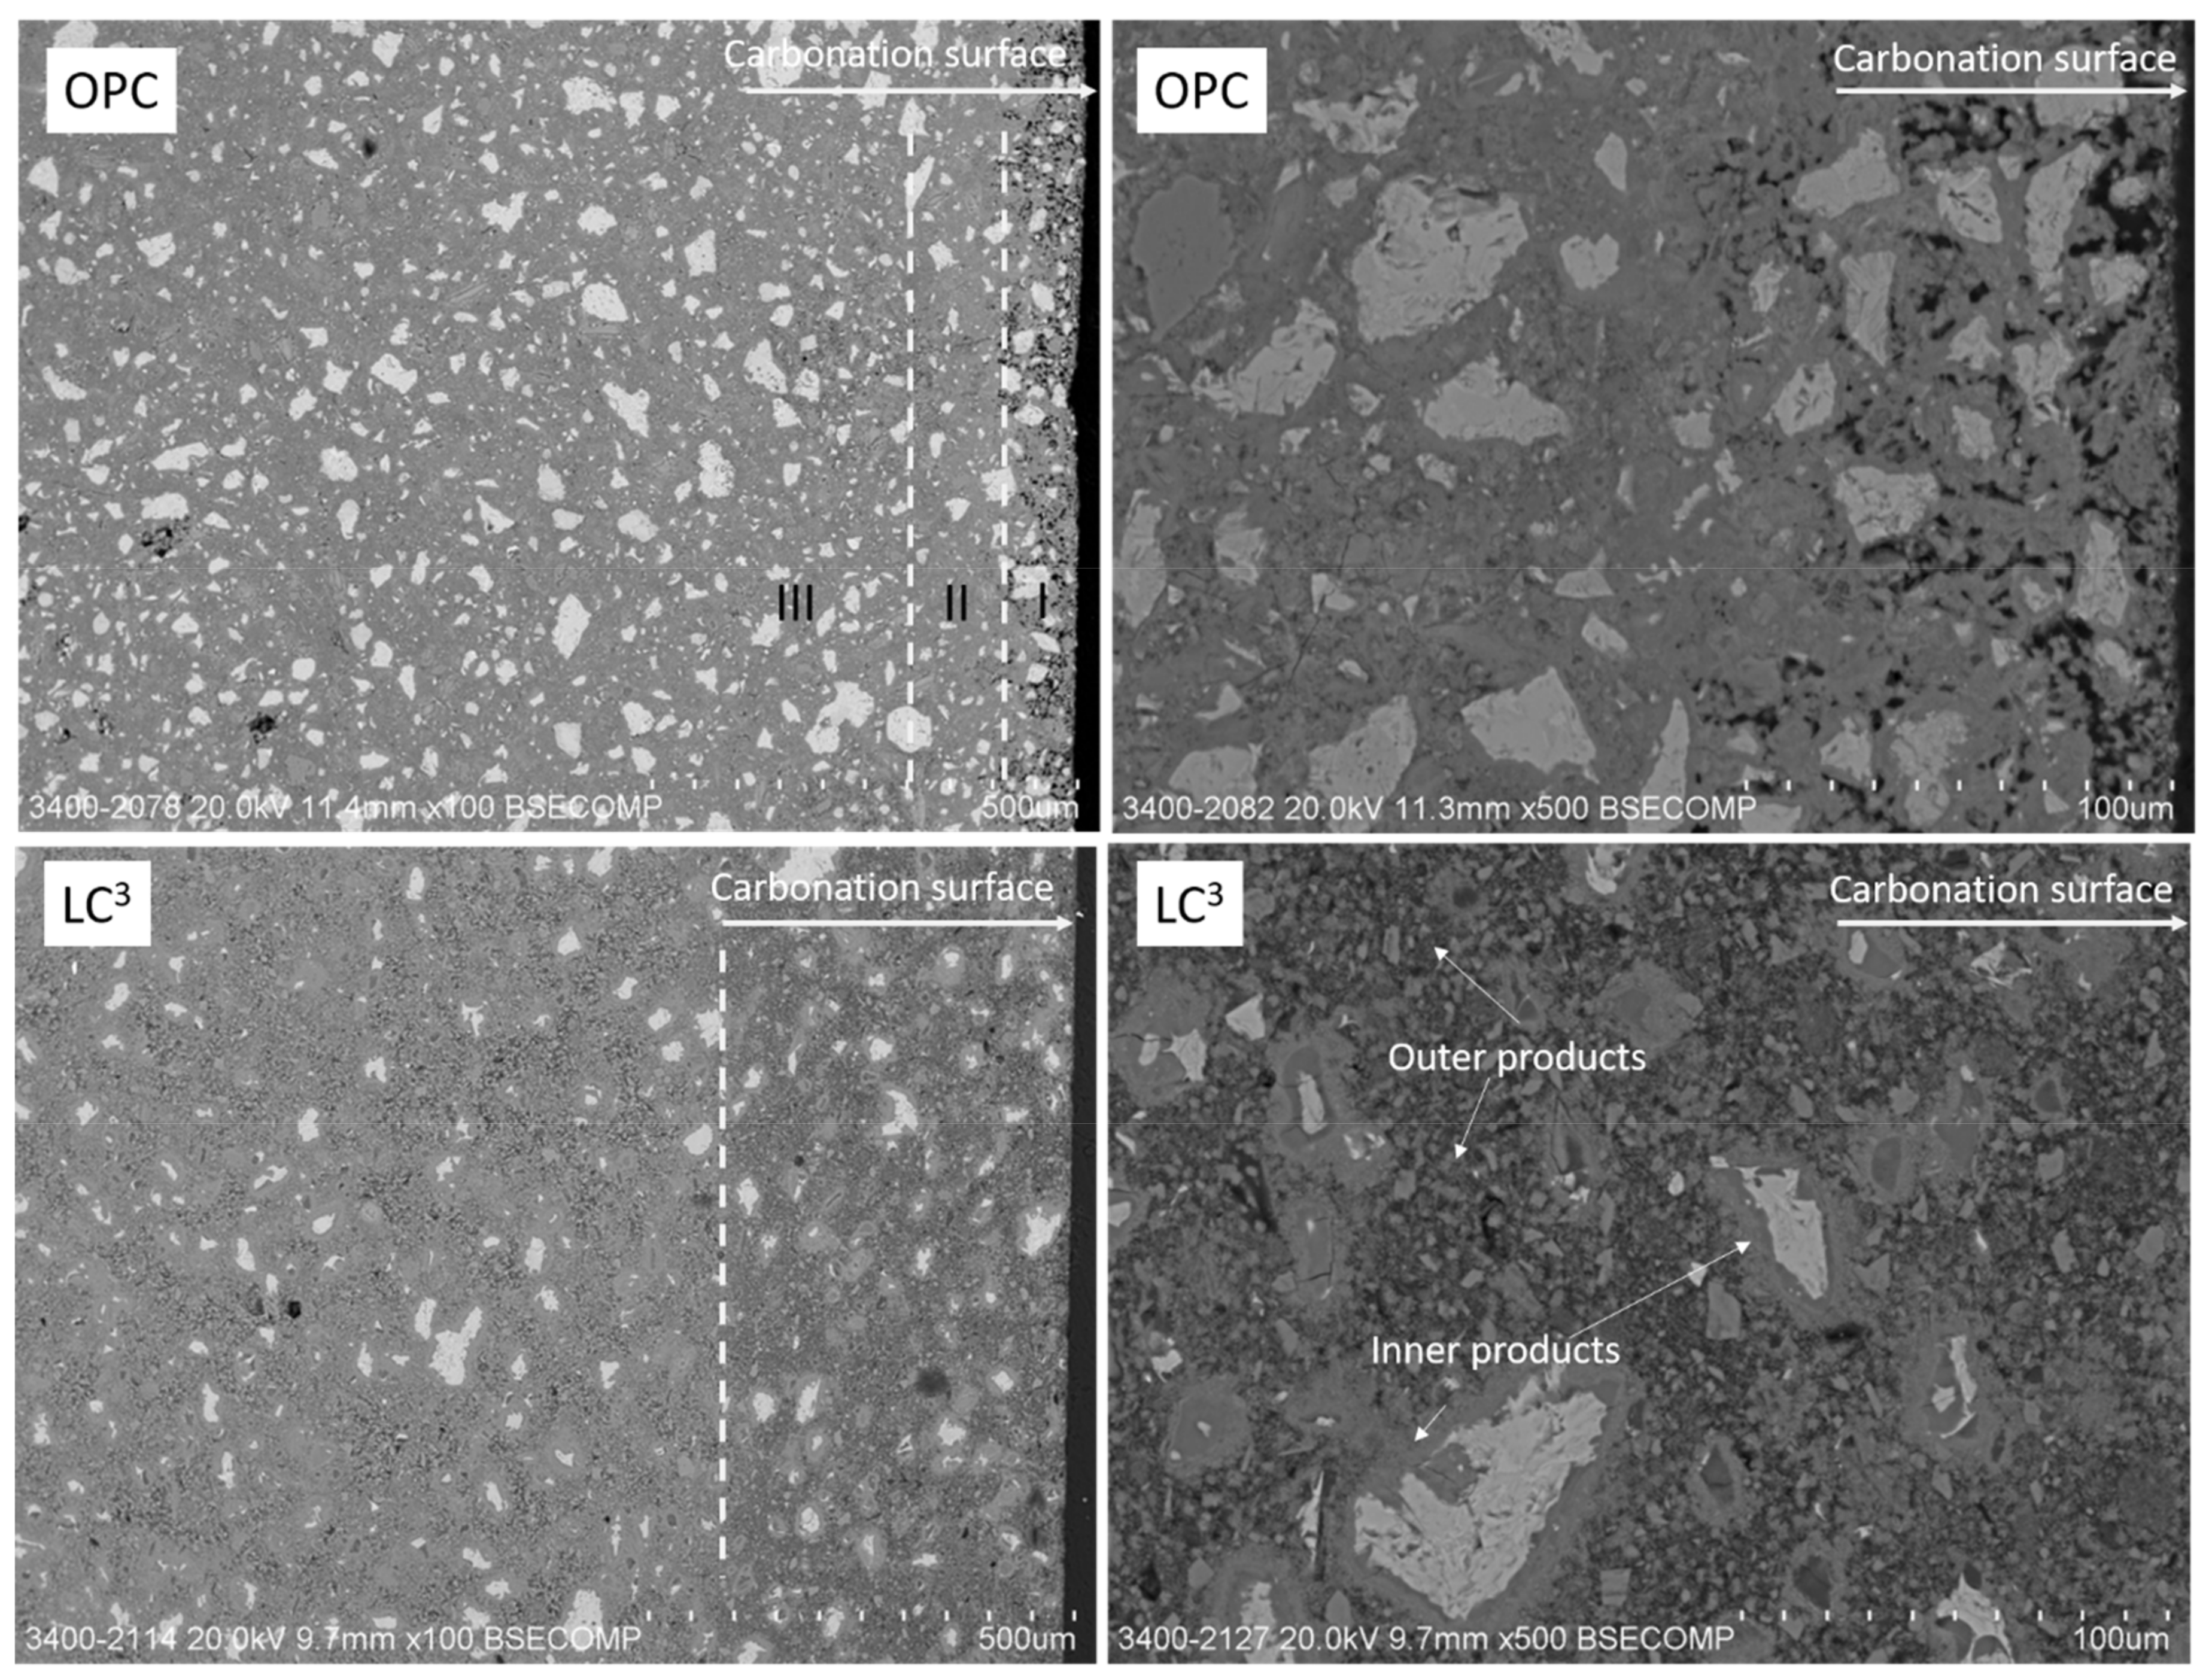
3.7. Microstructure Analyses at the Carbonation Skin

Figure 13 shows the backscattered electron (BSE) images of reference OPC and LC3 pastes after 23 weeks of natural carbonation. In the reference OPC paste, three distinctive zones with varying carbonation levels and morphologies can be identified. The outermost carbonation zone (zone I) is highly porous, due to the dissolution of CH and decalcification of C-S-H; the intermediate zone (zone II) is the densest due to precipitation of Cc filling the pores, while the innermost zone (zone III) is the most intact [43,49]. In the LC3 paste, distinctive zones with a progressively increased level of carbonation inward can also be identified. However, the zone with densified microstructure (corresponding to zone II in OPC systems) is not unequivocally observed. This is probably due to the virtual absence of CH in the LC3 systems, and thus insufficient amount of formed Cc that could fully fill the pores in microstructure. It should be noted that the intact zone for LC3 is not shown in Figure 13 due to the deep carbonation depth.
In the carbonated zone of LC3 pastes, a highly heterogeneous microstructure can be observed, in which the denser rims (inner products) surrounding the unreacted clinkers, while a porous region (outer products) with Cc precipitates manifested between cement particles. Figure 14 shows the SEM-EDS elemental mapping of carbonated LC3 pastes, in which the particles of unreacted OPC clinkers, MK, and LS can be identified. It can be seen that the inner product is mainly rich in calcium, silicon, and sulfate, while the outer product is more enriched in alumina. Such a difference in composition indicates that the hydrated phase distribution in the microstructure of LC3 pastes is highly heterogenous. This is reasonable considering the hydration mechanisms of the LC3 composite. More specifically, the hydration of OPC clinkers forms the inner products surrounding the hydrating grains, composed of mainly C-S-H, minor CH, while the outer products are mainly composed of C-A-S-H, AFm phases (mainly C2ASH8 and C4Ac0.5H12) from the reaction of MK and LS, in an alkaline condition created by hydrating OPC. Due to the almost absence of CH and relatively lower calcium content, the outer products are carbonated much faster, rendering a more porous morphology.
Figure 15 displays the Si/Ca versus Al/Ca plots of reacted products in the microstructure of non-carbonated and carbonated LC3 pastes. It should be noted that for non-carbonated LC3 specimens, no distinction is unequivocally made between the inner and outer products due to their similarity in grey levels in BSE images. A strong linear correlation between the Si/Ca versus Al/Ca is observed in the non-carbonated LC3 pastes, as well as in the outer products of carbonated pastes. The slope of the elemental plot indicating the overall Al/Si molar ratio is ~0.7, which implies the intermixing of various phases including C-A-S-H, AFm phases, and potentially unreacted MK fine particles. Upon carbonation, the inner products are comprised of probably slightly decalcified C-S-H and Cc due to carbonation of CH, while the outer product is carbonated into highly decalcified C-A-S-H and precipitates of Cc crystals. Moreover, the carbonation of outer product has little influence on the Al/Si ratio of the carbonated phases.

4. Conclusions

In this work, the influence of three sulfate salts (i.e., CaSO4, Na2SO4, and K2SO4) on the natural carbonation behaviors of LC3 systems is studied. In addition, the natural carbonation process and mechanisms of LC3 systems containing sulfate salts are discussed. The following conclusions can be drawn based on this work.
(1)
The incorporation of sulfate salts considerably accelerates setting and strength gain of LC3 systems, but undermines its later age strength. The early strength acceleration in LC3 by sulfate salts is likely due to enhanced ettringite formation with supplemented sulfate; however, the reduced later age strength is likely due to the deleterious effects of alkali ions (i.e., Na+ and K+) on the diffusion-controlled OPC hydration process.
(2)
The carbonation resistance of LC3 systems is noticeably compromised with the incorporation of sodium or potassium sulfate salts, mainly due to the pore structure coarsening effect and reduced CO2-binding capacity.
(3)
In comparison to calcium sulfate, the negative effects of Na2SO4, and K2SO4 on carbonation resistance of LC3 are more significant. As such, limiting the alkali content in LC3 systems is recommended, concerning the durability requirement against carbonation-induced materials degradations.
(4)
Carbonation of OPC and LC3 pastes containing various alkalis leads to a considerable reduction of porosity and coarsening of pore structure, as revealed by MIP results.
(5)
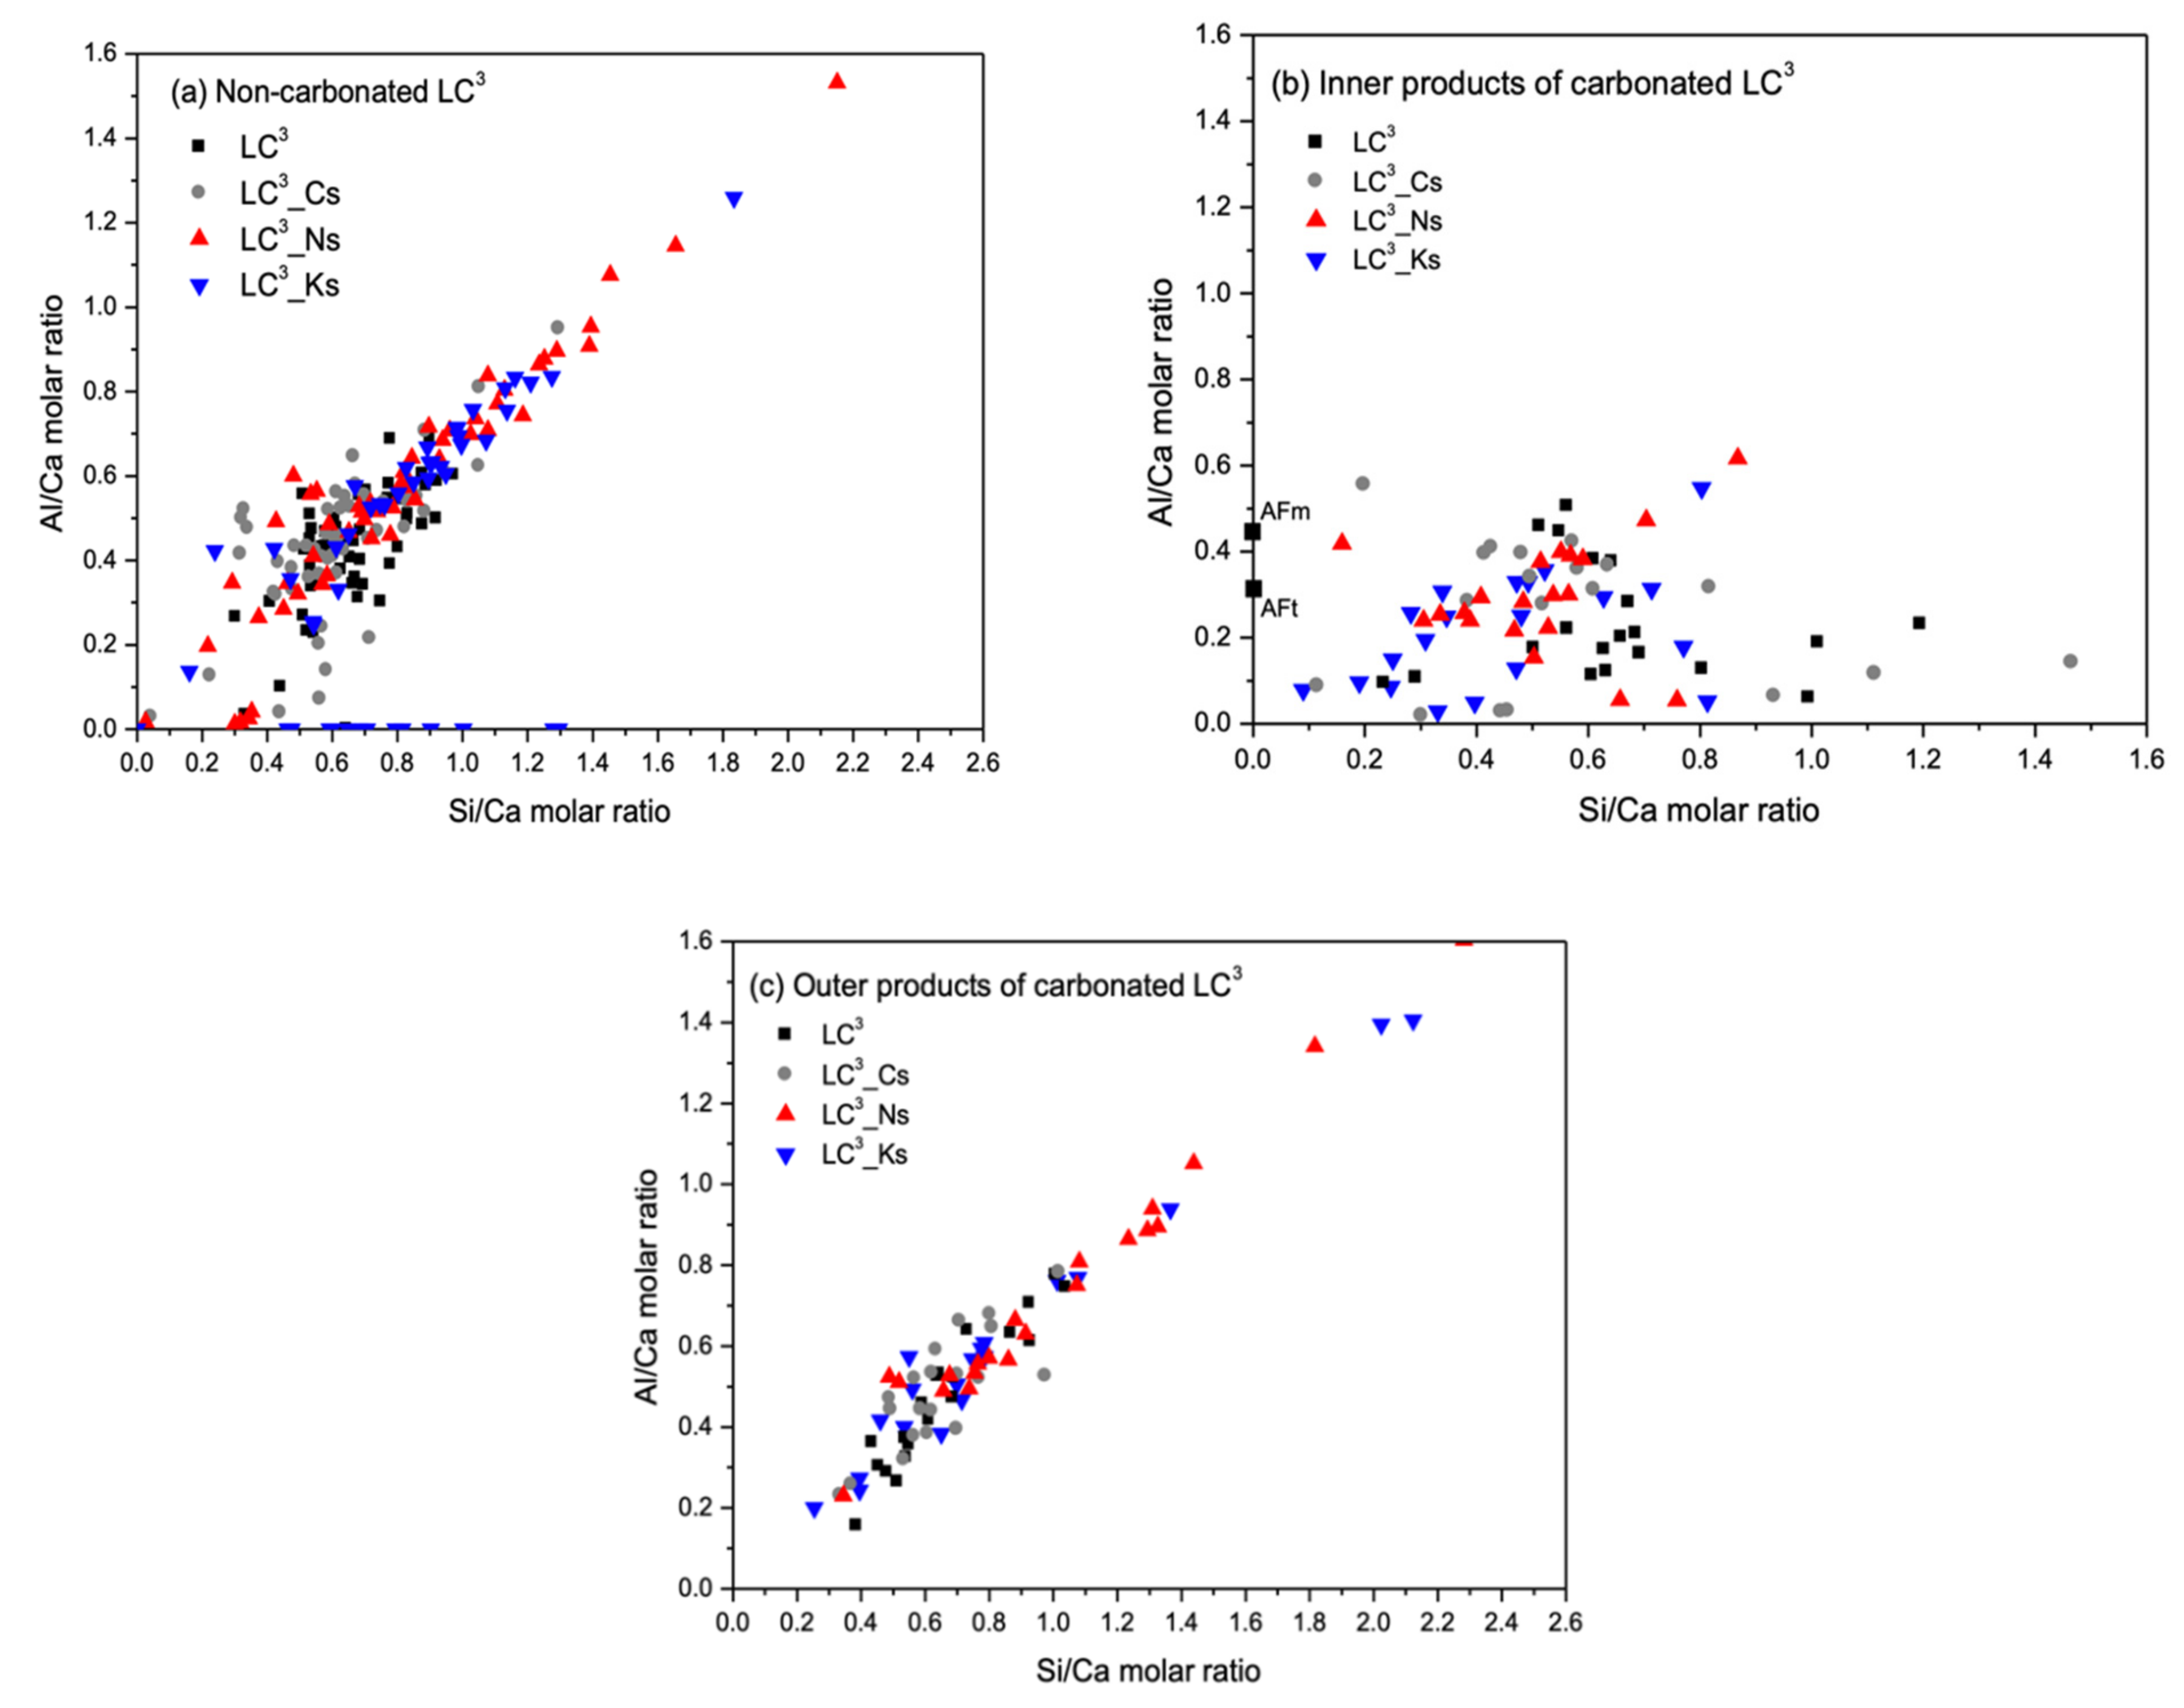
Reference OPC and LC3 pastes show different microstructure characteristics at carbonation layers. Distinctive carbonated products (inner and outer products) can be identified in the microstructure of LC3 pastes, implying a highly heterogeneous distribution of hydrates phases prior to carbonation. The inner product is mainly composed of C-S-H and CH from hydration of OPC clinkers, while the outer product is composed of C-A-S-H and AFm phases from LS and MK hydration in an alkaline condition created by hydrating OPC. The carbonation of outer product results in considerable decalcification via calcium carbonate formation, but has little influence on the Al/Si ratio of the carbonated phases.

Author Contributions

R.L.: experimentation; investigation; formal analysis; visualization; writing—original draft preparation. H.Y.: supervision; supervision; writing—review and editing. All authors have read and agreed to the published version of the manuscript.

Funding

This work was supported by The University of Hong Kong through Undergraduate Research Fellowship Programme (URFP) (Fellowship Awardee: R.L.). Any opinions, findings and conclusions or recommendations expressed in this material are those of the authors and do not necessarily reflect the views of the sponsors.

Institutional Review Board Statement

Not applicable.

Informed Consent Statement

Not applicable.

Data Availability Statement

All data, models, and code generated or used during the study appear in the submitted article.

Acknowledgments

R.L. would like to thank the supports from Undergraduate Research Fellowship Programme (URFP), The University of Hong Kong.

Conflicts of Interest

The authors declare no conflict of interest.

References

  1. Cancio Díaz, Y.; Sánchez Berriel, S.; Heierli, U.; Favier, A.R.; Sánchez Machado, I.R.; Scrivener, K.L.; Martirena Hernández, J.F.; Habert, G. Limestone calcined clay cement as a low-carbon solution to meet expanding cement demand in emerging economies. Dev. Eng. 2017, 2, 82–91. [Google Scholar] [CrossRef]
  2. Sharma, M.; Bishnoi, S.; Martirena, F.; Scrivener, K. Limestone calcined clay cement and concrete: A state-of-the-art review. Cem. Concr. Res. 2021, 149, 106564. [Google Scholar] [CrossRef]
  3. Antoni, M.; Rossen, J.; Martirena, F.; Scrivener, K. Cement substitution by a combination of metakaolin and limestone. Cem. Concr. Res. 2012, 42, 1579–1589. [Google Scholar] [CrossRef]
  4. Scrivener, K.; Martirena, F.; Bishnoi, S.; Maity, S. Calcined clay limestone cements (LC3). Cem. Concr. Res. 2018, 114, 49–56. [Google Scholar] [CrossRef]
  5. Nguyen, Q.D.; Khan, M.S.H.; Castel, A. Chloride Diffusion in Limestone Flash Calcined Clay Cement Concrete. ACI Mater. J. 2020, 117, 165–175. [Google Scholar] [CrossRef]
  6. Shi, Z.; Geiker, M.R.; De Weerdt, K.; Lothenbach, B.; Kaufmann, J.; Kunther, W.; Ferreiro, S.; Herfort, D.; Skibsted, J. Durability of Portland Cement Blends Including Calcined Clay and Limestone: Interactions with Sulfate, Chloride and Carbonate Ions. In Calcined Clays for Sustainable Concrete; Scrivener, K., Favier, A., Eds.; Springer: Singapore, 2015; pp. 133–141. [Google Scholar]
  7. Díaz, E.; González, R.; Rocha, D.; Alujas, A.; Martirena, F. Carbonation of concrete with low carbon cement LC3 exposed to dif-ferent environmental conditions. In Calcined Clays for Sustainable Concrete; Springer: Dordrecht, The Netherlands, 2018; pp. 141–146. [Google Scholar]
  8. Shi, Z.; Lothenbach, B.; Geiker, M.R.; Kaufmann, J.; Leemann, A.; Ferreiro, S.; Skibsted, J. Experimental studies and thermody-namic modeling of the carbonation of Portland cement, metakaolin and limestone mortars. Cem. Concr. Res. 2016, 88, 60–72. [Google Scholar] [CrossRef]
  9. Fu, C.; Fang, D.; Ye, H.; Huang, L.; Wang, J. Bond degradation of non-uniformly corroded steel rebars in concrete. Eng. Struct. 2021, 226, 111392. [Google Scholar] [CrossRef]
  10. Nguyen, Q.D.; Castel, A. Reinforcement corrosion in limestone flash calcined clay cement-based concrete. Cem. Concr. Res. 2020, 132, 106051. [Google Scholar] [CrossRef]
  11. Ye, H.; Jin, X.; Fu, C.; Jin, N.; Xu, Y.; Huang, T. Chloride penetration in concrete exposed to cyclic drying-wetting and carbonation. Constr. Build. Mater. 2016, 112, 457–463. [Google Scholar] [CrossRef]
  12. Ye, H.; Radlińska, A. Effect of Alkalis on Cementitious Materials:Understanding the Relationship between Composition, Structure, and Volume Change Mechanism. J. Adv. Concr. Technol. 2017, 15, 165–177. [Google Scholar] [CrossRef] [Green Version]
  13. Jawed, I.; Skalny, J. Alkalies in cement: A review: II. Effects of alkalies on hydration and performance of Portland cement. Cem. Concr. Res. 1978, 8, 37–51. [Google Scholar] [CrossRef]
  14. Maslehuddin, M.; Page, C.L. Rasheeduzzafar Effect of Temperature and Salt Contamination on Carbonation of Cements. J. Mater. Civ. Eng. 1996, 8, 63–69. [Google Scholar] [CrossRef]
  15. Dow, C.; Glasser, F. Calcium carbonate efflorescence on Portland cement and building materials. Cem. Concr. Res. 2003, 33, 147–154. [Google Scholar] [CrossRef]
  16. Krishnan, S.; Singh, A.; Bishnoi, S. Impact of Alkali Salts on the Hydration of Ordinary Portland Cement and Limestone–Calcined Clay Cement. J. Mater. Civ. Eng. 2021, 33, 04021223. [Google Scholar] [CrossRef]
  17. Schulze, S.E.; Rickert, J. Suitability of natural calcined clays as supplementary cementitious material. Cem. Concr. Compos. 2019, 95, 92–97. [Google Scholar] [CrossRef]
  18. Rajabipour, F.; Giannini, E.; Dunant, C.; Ideker, J.; Thomas, M.D. Alkali–silica reaction: Current understanding of the reaction mechanisms and the knowledge gaps. Cem. Concr. Res. 2015, 76, 130–146. [Google Scholar] [CrossRef]
  19. Zunino, F.; Scrivener, K. Factors influencing the sulfate balance in pure phase C3S/C3A systems. Cem. Concr. Res. 2020, 133, 106085. [Google Scholar] [CrossRef]
  20. ASTM Standard C191. Standard Test Method for Time of Setting of Hydraulic Cement by Vicat Needle; ASTM International: West Conshohocken, PA, USA, 2019. [Google Scholar]
  21. Hidalgo, A.; Domingo, C.; García-González, C.A.; Petit, S.; Andrade, C.; Alonso, C. Microstructural changes induced in Portland cement-based materials due to natural and supercritical carbonation. J. Mater. Sci. 2008, 43, 3101–3111. [Google Scholar] [CrossRef]
  22. Ye, H.; Cai, R.; Tian, Z. Natural carbonation-induced phase and molecular evolution of alkali-activated slag: Effect of activator composition and curing temperature. Constr. Build. Mater. 2020, 248, 118726. [Google Scholar] [CrossRef]
  23. Choi, J.-I.; Lee, Y.; Kim, Y.Y.; Lee, B.Y. Image-processing technique to detect carbonation regions of concrete sprayed with a phenolphthalein solution. Constr. Build. Mater. 2017, 154, 451–461. [Google Scholar] [CrossRef]
  24. Scrivener, K.; Snellings, R.; Lothenbach, B. A Practical Guide to Microstructural Analysis of Cementitious Materials; CRC Press: Boca Raton, FL, USA, 2018. [Google Scholar]
  25. Aligizaki, K.K. Pore Structure of Cement-Based Materials: Testing, Interpretation and Requirements; CRC Press: Boca Raton, FL, USA, 2014. [Google Scholar]
  26. Gallé, C. Effect of drying on cement-based materials pore structure as identified by mercury intrusion porosimetry: A comparative study between oven-, vacuum-, and freeze-drying. Cem. Concr. Res. 2001, 31, 1467–1477. [Google Scholar] [CrossRef]
  27. Dhandapani, Y.; Sakthivel, T.; Santhanam, M.; Gettu, R.; Pillai, R.G. Mechanical properties and durability performance of con-cretes with Limestone Calcined Clay Cement (LC3). Cem. Concr. Res. 2018, 107, 136–151. [Google Scholar] [CrossRef]
  28. Wang, L.; Rehman, N.U.; Curosu, I.; Zhu, Z.; Beigh, M.A.B.; Liebscher, M.; Chen, L.; Tsang, D.C.; Hempel, S.; Mechtcherine, V. On the use of limestone calcined clay cement (LC3) in high-strength strain-hardening cement-based composites (HS-SHCC). Cem. Concr. Res. 2021, 144, 106421. [Google Scholar] [CrossRef]
  29. Emmanuel, A.C.; Haldar, P.; Maity, S.; Bishnoi, S. Second pilot production of limestone calcined clay cement in India: The expe-rience. Indian Concr. J 2016, 90, 57–64. [Google Scholar]
  30. Ye, H. Autogenous formation and smart behaviors of nitrite- and nitrate-intercalated layered double hydroxides (LDHs) in Port-land cement-metakaolin-dolomite blends. Cem. Concr. Res. 2021, 139, 106267. [Google Scholar] [CrossRef]
  31. Mota, B.; Matschei, T.; Scrivener, K. Impact of NaOH and Na2SO4 on the kinetics and microstructural development of white cement hydration. Cem. Concr. Res. 2018, 108, 172–185. [Google Scholar] [CrossRef]
  32. Ye, H.; Radlińska, A.; Neves, J. Drying and carbonation shrinkage of cement paste containing alkalis. Mater. Struct. 2017, 50, 50. [Google Scholar] [CrossRef]
  33. Tironi, A.; Scian, A.N.; Irassar, E.F. Blended Cements with Limestone Filler and Kaolinitic Calcined Clay: Filler and Pozzolanic Effects. J. Mater. Civ. Eng. 2017, 29, 04017116. [Google Scholar] [CrossRef]
  34. Huang, L.; Yan, P. Effect of alkali content in cement on its hydration kinetics and mechanical properties. Constr. Build. Mater. 2019, 228, 116833. [Google Scholar] [CrossRef]
  35. Zajac, M.; Skocek, J.; Lothenbach, B.; Mohsen, B.H. Late hydration kinetics: Indications from thermodynamic analysis of pore solution data. Cem. Concr. Res. 2020, 129, 105975. [Google Scholar] [CrossRef]
  36. Zunino, F.; Scrivener, K. The reaction between metakaolin and limestone and its effect in porosity refinement and mechanical properties. Cem. Concr. Res. 2021, 140, 106307. [Google Scholar] [CrossRef]
  37. Matschei, T.; Lothenbach, B.; Glasser, F. The AFm phase in Portland cement. Cem. Concr. Res. 2007, 37, 118–130. [Google Scholar] [CrossRef]
  38. Lodeiro, I.G.; Macphee, D.E.; Palomo, A.; Fernández-Jiménez, A. Effect of alkalis on fresh C–S–H gels. FTIR analysis. Cem. Concr. Res. 2009, 39, 147–153. [Google Scholar] [CrossRef]
  39. Yu, P.; Kirkpatrick, R.J.; Poe, B.; McMillan, P.F.; Cong, X. Structure of calcium silicate hydrate (C-S-H): Near-, Mid-, and Far-infrared spectroscopy. J. Am. Ceram. Soc. 1999, 82, 742–748. [Google Scholar] [CrossRef]
  40. Ghosh, S.N.; Handoo, S.K. Infrared and Raman spectral studies in cement and concrete (review). Cem. Concr. Res. 1980, 10, 771–782. [Google Scholar] [CrossRef]
  41. Hughes, T.L.; Methven, C.M.; Jones, T.G.; Pelham, S.E.; Fletcher, P.; Hall, C. Determining cement composition by Fourier transform infrared spectroscopy. Adv. Cem. Based Mater. 1995, 2, 91–104. [Google Scholar] [CrossRef]
  42. Villain, G.; Thiery, M.; Platret, G. Measurement methods of carbonation profiles in concrete: Thermogravimetry, chemical analysis and gammadensimetry. Cem. Concr. Res. 2007, 37, 1182–1192. [Google Scholar] [CrossRef]
  43. Chang, C.-F.; Chen, J.-W. The experimental investigation of concrete carbonation depth. Cem. Concr. Res. 2006, 36, 1760–1767. [Google Scholar] [CrossRef]
  44. Shah, V.; Scrivener, K.; Bhattacharjee, B.; Bishnoi, S. Changes in microstructure characteristics of cement paste on carbonation. Cem. Concr. Res. 2018, 109, 184–197. [Google Scholar] [CrossRef]
  45. Dhandapani, Y.; Santhanam, M. Assessment of pore structure evolution in the limestone calcined clay cementitious system and its implications for performance. Cem. Concr. Compos. 2017, 84, 36–47. [Google Scholar] [CrossRef]
  46. Cai, R.; Tian, Z.; Ye, H.; He, Z.; Tang, S. The role of metakaolin in pore structure evolution of Portland cement pastes revealed by an impedance approach. Cem. Concr. Compos. 2021, 119, 103999. [Google Scholar] [CrossRef]
  47. Ngala, V.; Page, C. Effects of carbonation on pore structure and diffusional properties of hydrated cement pastes. Cem. Concr. Res. 1997, 27, 995–1007. [Google Scholar] [CrossRef]
  48. Chindaprasirt, P.; Rukzon, S. Pore Structure Changes of Blended Cement Pastes Containing Fly Ash, Rice Husk Ash, and Palm Oil Fuel Ash Caused by Carbonation. J. Mater. Civ. Eng. 2009, 21, 666–671. [Google Scholar] [CrossRef]
  49. Kutchko, B.G.; Strazisar, B.R.; Dzombak, D.A.; Lowry, G.V.; Thaulow, N. Degradation of Well Cement by CO2 under Geologic Sequestration Conditions. Environ. Sci. Technol. 2007, 41, 4787–4792. [Google Scholar] [CrossRef]
Figure 1. Particle size distributions of raw solid powders including OPC, metakaolin, limestone, and quartz powder.
Sustainability 13 12833 g001
Figure 2. Time-dependent Vicat penetration depths for reference OPC and LC3 pastes.
Sustainability 13 12833 g002
Figure 3. Compressive strengths of seal-cured OPC and LC3 paste specimens at 1, 7, and 28 days. The error bar represents the standard deviation of three measurements.
Sustainability 13 12833 g003
Figure 4. XRD patterns of reference OPC and LC3 pastes prior to carbonation at ages of (a) 1 day; (b) 28 days.
Sustainability 13 12833 g004
Figure 5. TG-DTG diagrams of reference OPC and LC3 pastes prior to carbonation at ages of (a) 1 day; (b) 28 days.
Sustainability 13 12833 g005
Figure 6. FTIR spectra of reference OPC and LC3 pastes prior to carbonation at ages of (a) 1 day; (b) 28 days.
Sustainability 13 12833 g006
Figure 7. Photos of the sliced specimens sprayed with phenolphthalein after natural carbonation for 23 weeks after 28 days of sealed curing. (a) OPC; (b) LC3; (c) LC3_Cs; (d) LC3_Ns; (e) LC3_Ks.
Sustainability 13 12833 g007
Figure 8. XRD patterns of reference OPC and LC3 pastes after natural carbonation for (a) 7 days; (b) 90 days.
Sustainability 13 12833 g008
Figure 9. TG-DTG diagrams of reference OPC and LC3 pastes after carbonation. (a) OPC pastes at various carbonation period up to 90 days; (b) LC3 pastes at various carbonation period up to 90 days; (c) All mixtures after 7 days carbonation; (d) All mixtures after 90 days carbonation.
Sustainability 13 12833 g009
Figure 10. FTIR spectra of reference OPC and LC3 pastes after natural carbonation for (a) 7 days; (b) 90 days; (c) All mixtures after 7 days carbonation; (d) All mixtures after 90 days carbonation.
Sustainability 13 12833 g010aSustainability 13 12833 g010b
Figure 11. (a) The carbonation-induced evolution of mass percentages of CH, less-crystalline Cc, more-crystalline Cc, and total Cc over time in reference OPC and LC3 pastes; (b) The amount of CO2 uptake in LC3 paste containing various alkalis salts as a function of carbonation time.
Sustainability 13 12833 g011
Figure 12. MIP pore size distributions of reference OPC and LC3 pastes (a,b) without carbonation (27 weeks of sealed curing); (c,d) reference OPC and LC3 pastes with natural carbonation (23 weeks of natural carbonation following 28 days of sealed curing).
Sustainability 13 12833 g012
Figure 13. Backscattered electron images of reference OPC and LC3 pastes after 23 weeks of natural carbonation with a magnification of ×100 and ×500.
Sustainability 13 12833 g013
Figure 14. Backscattered electron image and elemental mapping of LC3-Ns pastes.
Sustainability 13 12833 g014
Figure 15. SEM-EDS Si/Ca versus Al/Ca molar ratio plots of reacted products in the microstructure of LC3 pastes containing various sulfate salts. (a) Non-carbonated specimens at ages of 27 weeks; (b) Inner products of specimens after being carbonated for 23 weeks after 28 days of sealed curing; (c) Outer products of specimens after being carbonated for 23 weeks after 28 days of sealed curing.
Sustainability 13 12833 g015
Table 1. Oxide composition of raw powders.
Oxide Composition (wt.%)OPCMetakaolinLimestone
CaO66.48-54.57
SiO220.1755.31-
Al2O34.0143.550.08
MgO0.85-0.95
SO35.13-0.07
Fe2O32.770.440.03
Na2O---
K2O0.58--
MnO---
TiO2-0.7-
LOI at 900 °C1.431.1545.43
Note: The oxide composition was determined by X-ray fluorescence, and the LOI was determined by thermogravimetric analysis. ‘-’ means trace amount.
Table 2. Mixture parameters of reference OPC and LC3 pastes containing various sulfate salts.
Mixture IDOPC (%)MK (%)LS (%)QP (%)CaSO4 (%)Na2SO4 (%)K2SO4 (%)w/p a
OPC100.0------0.4
OPC_45Q55.0--45.0---
LC355.030.015.0----
LC3_Cs52.530.015.0-2.5--
LC3_Ns52.530.015.0--2.5-
LC3_Ks52.530.015.0---2.5
All percentages are mass-based. a: w/p represents water-to-powder ratio, in which powder includes OPC, MK (metakaolin), LS (limestone), QP (quartz powder), and sulfate salts.
Publisher’s Note: MDPI stays neutral with regard to jurisdictional claims in published maps and institutional affiliations.

