Article

Effect of Micronutrient and Hormone on Microalgae Growth Assessment for Biofuel Feedstock

1
Institute of Molecular Biology and Biotechnology (IMBB), Bahauddin Zakariya University, Multan 60800, Pakistan
2
Department of Chemical and Materials Engineering, King Abdulaziz University, Rabigh 21911, Saudi Arabia
3
School of Engineering, RMIT University, Melbourne, VIC 3001, Australia
4
Department of Industrial Engineering, King Abdulaziz University, Rabigh 21911, Saudi Arabia
5
Department of Environmental Science and Engineering, Government College University, Faisalabad 38000, Pakistan
6
Department of Chemistry, University of Sahiwal, Sahiwal 57000, Pakistan
*
Authors to whom correspondence should be addressed.
Sustainability 2021, 13(9), 5035; https://doi.org/10.3390/su13095035
Submission received: 3 March 2021 / Revised: 24 April 2021 / Accepted: 26 April 2021 / Published: 30 April 2021

Abstract

:
The individual and combined effects of micronutrients and hormones on freshwater-borne microalgae growth were investigated for biofuel feedstock in this experimental study. Five algal strains of Chlorella sp., Chlorococcum sp., Phormidium sp., Chlorella sp. and Cosmarium sp., AZH, AZS, ZAA1, ZAA2, and ZAA3, respectively, have been investigated. These strains were treated using different concentrations of micronutrients (iron chloride, manganese chloride, and sodium molybdenum oxide) and hormone (salicylic acid). The different treatments’ growth effects were as follows: iron chloride > sodium molybdenum oxide ˃ manganese chloride > salicylic acid. The order of the increases in the number of microalgal strain cells achieved by the application of the micronutrients and hormone was AZH > AZS > ZAA3 > ZAA2 > ZAA1. The combined treatments produced higher growth rates than the individual treatments, with the order of their effects being micronutrients + hormone > all three micronutrients > hormone alone. The increase in the number of microalgal strain cells under combined treatment was ZAA3 > AZH > AZS > ZAA2 and assessed using one-way ANOVA.

1. Introduction

Currently, global society faces significant challenges due to the depletion of crude oil reserves, increasing energy consumption, growing population, and natural crises such as greenhouse gas emissions, global warming, and atmospheric pollution. Researchers have been investigating sustainable and environmentally friendly alternative energy sources for decades to resolve this issue for decades [1]. In this regard, third generation biofuel sources such as microalgae are a field of research gaining increasing attention due to their potential for efficiently reducing carbon dioxide emissions. Microalgae can be used for bioremediation, animal feed production, biosynthesis of nutraceuticals, and renewable liquid fuels development. Third-generation photosynthetic fuel microorganisms absorb atmospheric CO2 in the presence of sunlight to synthesize chemical energy [2,3]. Microalgae used for biofuel purposes do not demand rigorous regulation. They can easily be nourished under the harsh conditions of impoverished water quality such as wastewater, saline water, and freshwater [4]. Different algal species are proficient absorbers of atmospheric CO2. According to a literature review, there are about 50,000 algal species in existence, and only 30,000 of them have been thoroughly described and analyzed [5]. Algal biomass can be harvested year-round owing to its short cultivation periods. They absorb sunlight and are characterized by high lipid saturation [6]. They have a short generation time, high growth rate (the cell division time of some species is as short as 3.5 h), and occupy less space than terrestrial plants. Algae effectively absorb phosphate and nitrates from brackish water and remove dangerous materials from wastewater [7]. They also have the potential for use in the production of biofuel. Algae debris and ashes have been used as biochar for animal feed and soil fertilizer [8].
The quantity of lipids has been altered by optimizing significant factors such as available macro-and micro-nutrients, temperature, pH, and light intensity [9]. Phosphorous, sulfur, nitrogen, and magnesium are critical influencing micro-elements [10]. The main trace minerals in culture media are iron, manganese, cobalt, copper, and molybdenum. The commercialization of biofuels requires large-scale algal cultivation with improved lipid contents [11]. A focus of ongoing studies in the field is lipid enrichment by altering the nutrients in the cultivation medium. The organisms’ cellular composition varies with the light intensity, which affects the CO2 conversion into organic components [12]. The metabolism of microalgae also varies with pH. Besides, the amounts of available minerals and hormones affect the size, growth rate, and biochemical composition of algal cells [13].
Fuel production from microorganisms depends on the microbial lipid content and their culture growth, and different studies have been conducted to increase the growth rate and lipid content. Micronutrients such as iron, manganese, and sodium molybdenum oxide play essential roles in green algae’s nitrogen and carbon metabolism processes. Culture under iron toxicity and limitation has revealed physiological responses that indicate the significance of iron to energy distribution, detoxification of reactive oxygen species (ROS), electron transport chain, photosynthesis pathway, molybdenum iron nitrogen fixation, and nitrate reduction. The amount of light-harvesting pigment such as chlorophyll A decreases with increasing iron deficiency. A study on the green algae Dunaliella tertiolecta demonstrated that iron is a crucial micronutrient for good lipid accumulation [14]. The addition of iron to Dunaliella salina culture also induced the production of β-carotene [15]. Additionally, manganese was used to facilitate algal culture to remove toxic superoxide radicals and enhance algal photosynthesis through catalyzed protein synthesis. It increased the accumulation of inorganic minerals in Spirulina platensis [16].
One recent research [17] cultivated the Cosmarium sp. specie and subsequently found that it represented a suitable biofuel feedstock. This study examined a microalgae culture that can be potentially employed for the production of biofuels. The cultures were obtained via a process of catalytic deoxygenation of hydrocarbons in the C12–C18 range from a renewable source. Cosmarium sp. species was chosen due to their greater palmitic acid content compared to the alternative forms of microalgae species that have previously been assessed for producing hydrocarbons. In another study [18] Cosmarium sp. was cultivated in a bold basal medium under controlled conditions and the biochemical characterizations were investigated in terms of their suitability for the production of biodiesel and ethanol. After the microalgae had progressed to the required growth stage, the total lipids were assessed and used to produce biodiesel via a process of transesterification with a calcium oxide (0.66%) catalyst. The bioethanol was produced by combining the Cosmarium sp. fatty residues with Saccharomyces cerevisiae (10%). The results indicated that the Cosmarium sp. specie is suitable within the production of biodiesel and bioethanol. Various studies have sought to assess the suitability of the Chlorella sp. microalgae strain within biofuel production [19,20,21]. In [22], researchers assessed the extent to which green alga Chlorella sp. was suitable for high biomass and lipid production within the development of biodiesels. First, the lipid content, lipid yield, optical density, fatty acid composition, and dry cell weight of the tested strain were analyzed as part of a growth profile study that spanned 0 to 20 days with the underlying objective of identifying the optimal time at which to harvest the biomass. The results revealed that Chlorella sp. yielded the maximum cell density (2.0 optical density) and the maximum biomass (1.1 g/L) on day 16 of cultivation. Furthermore, the Chlorella sp. was bioprospected and the results revealed that the lipid content was 11.5% on the 16th day of cultivation in standard medium in the absence of any mechanical stirring or carbon dioxide. In addition, cells that were collected from stationary and log growth had the same percentage of lipid content while those harvested during the lag phase had a slightly lower percentage of lipid content at 10.5%. The lipid yield of the Chlorella sp. test strain grown under stationary and log phases was also determined. The tested strain was also subjected to fatty acid profile analysis and the results revealed that major fatty acids were present including oleic, linolenic, palmitic, and palmitoleic acids. In light of the outcomes of this study, it was concluded that Chlorella sp. represents a suitable potential feedstock for the production of biodiesel production.
Comparable research has been performed on Chlorococcum sp and Phormidium sp. In recent times, studies [23,24] have focused on Phormidium sp microalgae. This study found that the lipids that accumulated during two of four fast-growing, filamentous cyanobacterial strains were Phormidium sp. The research used biomass density, lipid content, and fatty acid as selection markers to support an assessment of the extent to which fast-growing cyanobacterial strains of Phormidium sp. are suitable for the production of biodiesel. The production of biomass, growth, lipids, and carbohydrates in Phormidium sp. were considered. Scenedesmus sp. and Chlorococcum sp. [25] grown in 1/3N BG-11 medium and secondary-treated municipal wastewater, respectively, were chosen to convert lipids via a one- and two-step transesterification procedure. The one-step process used sodium hydroxide and sulfuric acid were separately, while the two-stage process used a basic catalyst followed by an acidic catalyst. The biodiesel’s quality was directly impacted by the catalyst employed. A further study [26] was performed to assess the environment required to optimize the build-up of starch and lipids in Chlorococcum sp. for the purposes of producing biofuel. Chlorococcum sp. was grown on BG-11 medium under enhanced light concentration. The use of nitrogen limitation (NL) served to enhance the growth of both lipids and starch and generated 34.02% in sugars in comparison to the 22.57% yielded on nitrogen supplemented (NS) media. The outcomes of the various research studies described above reveal that Chlorella sp., Cosmarium sp., Chlorococcum sp., and Phormidium sp. microalgae strains represent suitable feedstock for biofuel production.
The present study emphasized the isolation of microalgae strains from a different location and the best strains of the screening method. Growth parameters such as the culturing media, temperature, pH, and light intensity are optimized to maximize the growth rate. The effects of iron chloride, sodium molybdenum oxide, magnesium chloride, and salicylic acid on the growth were subsequently examined. Therefore, this present experimental study aimed to develop a suitable microalgae cultivation condition in photobioreactor and analyze the effects of micronutrients and hormone to determine their optimal concentrations for maximizing the production of the considered algal strains. The effects of the micronutrients and hormone on algal cell growth and the chlorophyll content were also investigated.

2. Materials and Methods

2.1. Isolation and Identification of Specific Strains of Microalgae

The local microalgae samples were collected from different locations within Punjab Province, Pakistan, including the Chenab River, the Cantt Lake, and the lawn and bio-park Bahauddin Zakariya University. The main habitats of the microalgae were rock, soil, lake, pond, ocean, and river. During sample collection, pH and water conditions at the locations were noted. The microalgae samples included algae floating on water (pH 6.2), algae in flowing water (pH 6.5), freely moving algae (pH 6.00), algae in grubby water (pH 6.3), and algae in sluggish grimy water (pH 6.4). The two traditional algal isolation techniques used in this study were cell dilution in liquid media and culturing and sub-culturing solid media. In applying the cell dilution method, five to seven 50 mL media bottles were filled with 100 µL of inoculums prepared from the collected algal samples. The growth was slow and algal cells appeared after four to five weeks in some bottles at 23 to 27 °C with photoperiods of 15 h light:9 h dark, light intensity 10 to 12 Watt/m2. Fifty µL of each culture in which algal cell growth was observed was transferred into a new glass bottle containing modified BG11 media for cultivation. The growth in the new bottles was also slow. In the third step, 25 µL of each light green culture was again transferred into a new glass bottle and observed under a microscope. An XSZ-107BN compound microscope with ×40 magnification was employed. This procedure was repeated several times until a pure culture was obtained [27].
The culturing and sub-culturing were performed in a Petri dish using modified BG11 media. The media were prepared in 1000-mL Erlenmeyer flasks and autoclaved. Each flask was used to prepare 1 L of the liquid medium from four stock solutions, with 1.5 g of Na2NO3 and 0.02 g of Na2CO3 added. The first stock solution contained 0.1 g of EDTANa2, 0.6 g of citric acid and NH4Cl2, and 3.6 g of CaCl2. The second and third stock solutions had only 7.5 g of MgSO4 and 3.05 g of K2HPO4, respectively. The fourth stock solution contained micronutrients, namely, 0.222 g of ZnSO4, 0.05 g of CoSO4, 2.89 g of H3BO3, 0.391 g of sodium molybdenum oxide, and 1.81 g of manganese chloride. The streak method was used for plate formation [28]. The plates were placed under control conditions in an incubator, and growth was observed after 6 to 8 days. The plates were also used for further sub-culturing. The growth pattern of each strain was observed to differ between the Petri plates. The culture growths were phenotypically observed through 12-day experiments, and sub-culturing was performed based on the observed growth patterns. A low-magnification power microscope was used to identify the morphology of the colony [29].

2.2. Experimental Setup and Growth Strategy

2.2.1. Separate Effects of Micronutrients and Hormone (First Set of Experiments)

The five green microalgae strains, namely, ZAA1, ZAA2, ZAA3, AZH, and AZS, were passed through three different concentrations of three other micronutrients (sodium molybdenum oxide 0.40 µM, 0.60 µM, and 0.80 µM, iron chloride 0.20 µM, 0.40 µM, 0.60 µM, and manganese chloride 0.50 µM, 0.70 µM, 0.90 µM) and hormone (salicylic acid10−2 M, 10−4 M, 10−6 M) during the first set of experiments.

2.2.2. Combined Effects of Micronutrients and Hormone (Second Set of Experiments)

The growth condition for each algal strain was different based on different concentrations of microelements and hormones. The best concentrations of micronutrients and hormones observed in the first set of experiments were variously combined in the second set of experiments. The five strains were placed in 20 glass bottles containing modified BG11 media for culturing. The algal strains in five bottle sets were used as control, treatment with a combination of hormone and micronutrients, treatment with a combination of all the microelements, and the treatment with the only hormone. The ZAA1 strain was not considered in the second set of experiments owing to its low growth rate. The considered concentrations of micronutrients and hormones are detailed in Table 1.

2.3. Photobioreactor Setup and Microalgal Growth Analyses

The microalgal strains were cultivated in a photobioreactor chamber fabricated in-house. The chamber consisted of 20 individual glass jars, each of diameter 4 cm and length 10 cm, as shown in Figure 1. The glass jars were used for the photobioreactor (PBR) construction because of their low cost, higher yield, high resistance to temperature fluctuation, and low thermal expansion [30]. Three 18-W fluorescent lights were positioned between the horizontal plates. An air pump was used to aerate the system, with the flowrate maintained at 300 to 450 mL/min. A cylinder containing CO2 was used for the indoor supply of the gas to the microalgae culture.
The three different concentrations of nutrients (sodium molybdenum oxide, manganese chloride, and iron chloride) were used to examine the effects of micronutrients on algal growth. The pH was adjusted at the beginning of the culture and continuously varied. As the biomass grows, the concentration of inorganic carbon decreases, and the pH increases, so carbon deficiency is directly related to pH variations. The pH was maintained in the optimal range by Injecting diluted HCl and NaOH. The optimal production of hydrocarbons and biomass has been observed at 6.3 to 7.5 pH. The same effect of pH on biomass and hydrocarbon was observed during the culturing of green microalgae Botryococcus braunii [31]. The growth rate of freshwater microalgae also vary with temperature. In one study, Monoraphidium sp. SB2 would flourish well under 25 to 35 °C, but the highest biomass growth of 650 mg L−1 was achieved at 30 °C [32]. Additionally, González-Fernández et al. [33] found that microalgae’s growth occurred at a temperature of 7 to 35 °C. The temperature required for the microalgal species’ optimal growth (22–28 °C) was maintained under the different micronutrient and hormone concentrations. The growth rate was determined using a Neubauer chamber [34]. The formula employed one of the studies [35], which was used to calculate the number of cells for all the strains except ZAA1. The dry weight method was used for the ZAA1 strain because of its singular structure.

2.4. Dry Weight (for ZAA1)

The centrifugation method was used to determine the dry weight. For this purpose, 10 mL of the sample was placed in a Falcon tube and centrifuged at 4816 rpm for 5 min. The supernatant was discarded, and the pellet was washed two times with distilled water. The washed pellet was suspended in 10 mL of deionized water. The pellet was subsequently transferred into a pre-weighed aluminum-wrapped bowl, and the sample was dried. The sample was weighed after cooling for 15 min in a desiccator [36]. The glass filter fiber method was used for the dry weighing [37].

2.5. DNA Extraction, Polymerase Chain Reaction (PCR) Amplification, and Sequencing

Five 15-mL falcons were used for DNA extraction. Here, 10 mL of microalgae culture was placed in each falcon and then centrifuged at 25 °C and 4000 rpm for 20 min. The supernatant was discarded to remove contamination. The biomass was then washed three times with distilled water. The CTAB (cetyltrimethylammonium bromide) method was subsequently used for the DNA extraction [38]. To confirm the DNA, a 0.8% agarose gel electrophoresis was employed [39].
Genome sequencing was performed by PCR reaction after isolation of a monoculture. The 16S rDNA region was sequenced and analyzed using a primer pair (106F + 781R(a)). The PCR reaction was implemented using 20 ng of genomic DNA. The genomic DNA was used as a template DNA and EF-taq (SolGent, Korea) in 30 µL of the reaction mixture. The activation of the taq-polymerase enzyme and the template DNA’s denaturation was executed at 95 °C for 2 min. The annealing temperature of the reaction was 55 °C, and the process lasted for 1 min. The extension was performed at 72 °C for 10 min over up to 35 cycles. This process was followed by finishing at 4 °C for 10 min. The amplified products were subsequently purified using a multi-screen filter paper. A PRISM BigDye Terminator v3.1 sequencing kit was used for the sequencing reaction. Hi-Di formamide was added to the amplified products, and the reaction mixture was incubated at 95 °C for 5 min. Then, the samples were placed on ice for 5 min [40] and then analyzed using a DNA analyzer (ABI PRISM 3730XL).

2.6. Determination of Chlorophyll and Carotenoid Contents

The chlorophyll content was measured using a spectrophotometer. A 5-mL aliquot of the culture biomass was centrifuged at 8000 rpm for 5 min at 20 °C. The supernatant was then discarded, and a pellet of the residue was suspended in 5 mL of 95% ethanol and placed on a rotary shaker operated at 100 rpm. Extraction method proceeded for 24 h in the dark. The resultant mixture was centrifuged at 8000 rpm and 20 °C for 5 min. The supernatant absorbance was measured at wavelengths of 750, 663, 652, 645, and 470 nm. The chlorophyll and carotenoid contents were determined by using the equations (Equation (1) to Equation (3)) [41]. The total chlorophyll and total carotenoids were determined to be 0.1 mg per gram of the sample’s fresh weight.
Chl.a mg/g (F.W) = [12.7(OD663) − 2.69 (OD645)] × V/(100 × W),
Chl.b mg/g (F.W) = [22.91 g (OD645) − 4.68(OD663)] × V/(100 × W),
Carotenoid mg/g (F.W) = OD480 + 0.114 (OD663) − 0.638(OD645) × 1000/EM,
where V denotes the volume (mL) of the extract and the biomass weight is in mg.

2.7. Phylogenetic Tree Construction

The five considered microalgae strains with the 16S rDNA sequence were aligned using the Basic Local Alignment Search Tool (BLAST) at the National Center for Biotechnology Information (NCBI). The scored h3030omology percentage was determined by aligning the microalgae sequence with relevant, known, different, and available sequences in the databases. The neighbor-joining method (Clustal Omega online server) was used to construct the phylogenetic tree [42,43].

Statistical Analysis

The algal strains’ chlorophyll contents were determined by one-way analysis of variance (ANOVA) with multiple comparisons using the GraphPad Prism 7.04 software. The standard deviation was calculation with the error bar for the biomass growth, and chlorophyll data was performed using Microsoft Excel. The significance level was set to p ≤ 0.05. A Brown-Forsythe test was used to check the normality of all the data.

3. Results and Discussions

3.1. Isolation and Identification of Microalgae

The five monocultures were successfully separated after culturing and sub-culturing. The morphological analyses of the isolated strains were performed using microscopic slides. The cell’s morphology was matched with those of the Phormidium, Chlorella, Cosmarium, and Chlorococcum species, as shown in Table 2. Due to difficulties with observing the microalgae morphology, DNA extraction was adopted. The extracted DNA was subjected to 0.8% agarose gel electrophoresis to evaluate the DNA quantity and quality in the PCR products. A sequencing process followed this experiment.

3.2. PCR Amplification and Sequencing

The employed pair of primers (106F + 781R(a)) were used to sequence and analyze the 16S rDNA region. The DNA regions of ZAA1, ZAA2, ZAA3, AZH, and AZS were successfully amplified in the microalgal cultures. Phylogenetic trees showing the relationships among the 16S ribosomal RNA genes and the partial sequences of the isolated ZAA1, ZAA2, ZAA3, AZH, and AZS strains, are presented in Figure 2.

3.3. Growth Rate of Microalgal Strains under Separate Hormone and Micronutrient Treatments (First Set of Experiments)

The microalgae required both macro and micronutrients, and the optimization of the nutrients is essential for maximum biomass production. The micronutrients play an essential role in the regulation of nitrogen assimilation and impact the photosynthesis pathway. Different concentrations of three micronutrients (iron chloride, sodium molybdenum oxide, and manganese chloride) were considered in the present experiments. The three different concentrations of the three different micronutrients that were applied were based on the work of Song [34], as depicted in Table 1. All of the five algal strains that were examined responded well to iron chloride treatment [44]. The culture in iron toxicity and limitations have shown a physiological response that suggests iron to be critical in energy distribution, detoxification of reactive oxygen species (ROS), Electron Transport Chain (ETC), and photosynthesis pathway. Molybdenum with iron is both involved in nitrogen fixation and nitrate reduction. Light-harvesting pigment such as chlorophyll ‘a’ content decrease in the case of iron deficiency [45]. The green algae Dunaliella tertiolecta species showed that iron is a key micronutrient to increase lipid accumulation [14]. The Dunalilla salina culture produced β-carotene due to iron in the culture medium [15]. Under the concentration of 10−4 M salicylic acid, the growth rate of Chlorococcum spp. (AZS) and Phormidium spp. (ZAA1) species increased, while a 10−3 M concentration of the hormone increased the number of cells of the Cosmarium (ZAA3) and Chlorella (AZS and AZH) species, as shown in Figure 3a–e. Compared with other studies, the results have revealed that the metabolism of microalgae responds differently under various doses of Salicylic acid [46,47]. The latest Salicylic acid treatment investigation shows that the protein content increased species and the dose-specific manner in Rhodella sp. APOT_15, Kirchneriella aperta DMGFW_21, and Brachiomonas submarina APSW_11 [48].

3.3.1. Growth Analysis of ZAA1 and ZAA2 Strains

The growth of the ZAA1 strain was affected by the different treatments and concentrations. Among the considered sodium molybdenum oxide concentrations, 0.8 µM produced the best result, and 0.4 µM the worst. Further, among the three concentrations of manganese chloride considered, 0.9 µM had the optimal growth rate, with 0.7 and 0.5 µM producing poor results. This finding is also supported by Mohammed Battah et al. where 12 μM manganese chloride raised biomass of Chlorella Vulgaris. Simultaneously, Mn2+ deficiency caused growth hindrance; the concentrations of heavy metal manganese chloride bring changes in the growth and lipid content of C. vulgaris [49].
Furthermore, Pirson and Bergmann [50] wrote down that Mn2+-deprived cultures reduced biomass culturing up to 50%. The enhancement in growth at a high concentration of Mn2+ might be described through the role of manganese as a crucial component of various vitamins, metalloenzymes, and proteins that perform an essential function in the metabolism of algae [51,52,53]. Although the deficiency of manganese in algae culture hamper the proper functioning of the chloroplast structure, electron transport of photosystem II causes chlorosis [54]. Regarding the high level of manganese, chloride causes an increase in lipid content. Our results agree with Pirson et al., who observed that Mn2+ has an inhibitory effect on the photosynthesis algae and hence restore the storage of lipids in favor of carbohydrates [55]. In the iron chloride treatment, the growth rate of ZAA1 was slow over the first four days and slightly increased, as depicted in Figure 3a. The maximum level was attained over the 9th and 10th days, after which there was a decrease in the number of cells. The optimal growth rate was observed for an iron chloride concentration of 0.6 µM.
Regarding the three considered iron chloride concentrations (0.2, 0.4, and 0.6 µM), 0.6 µM optimized the growth. The same sodium molybdenum oxide concentration produced the best results among the three considered concentrations (0.4, 0.6, and 0.8 µM). Another experimental study made a similar observation. The long-term treatment of SA to algae stimulates algae culturing, nucleic acid, and protein content. However, the effect of SA or the effect of SA with the interaction of other micronutrients on the transcription and translation processes required further detailed studies [47]. The ZAA2 strain exhibited a low growth rate at the beginning. When the salicylic acid treatment was applied, the number of cells gradually increased. By the 9th day of the experiment, the growth rate was high, and this was maintained until the 13th day, with the number of cells subsequently decreasing slowly on the 14th day. The optimal biomass culturing was obtained for a salicylic acid concentration of 10−4 M [44].
With undertreatment using sodium molybdenum oxide, the response of the ZAA2 strain also varied with the concentration of the micronutrient, as shown in Figure 3b. The highest growth rate was achieved for a sodium concentration of 0.6 µM. The increase in the number of cells was slow over the first three days, after which there was a gradual growth acceleration, until the ninth day. A slight decrease followed this approach in the number of cells. The trends were similar for the iron chloride treatment, with the best result obtained for a concentration of 0.6 µM. In the early days, the growth rate was slow, and this was followed by a gradual growth acceleration until the ninth day, after which there was a slight decrease in the number of cells.

3.3.2. Growth Analysis of ZAA3 and AZH Strains

The growth of the ZAA3 strain was affected by the different micronutrient treatments and their different concentrations. The 0.4 µM solution of iron and sodium chloride produced the best result for the ZAA3 strain, which also responded best to the 10−4 M salicylic acid solution, as shown in Figure 3c. This salicylic acid concentration produced a higher growth rate in the initial days of the experiment, with the rate gradually increasing and the optimal level being attained on the ninth day.
Sodium had a more negligible effect on the algae culture compared with iron. Among the three different sodium molybdenum oxide dehydrate solutions (0.4, 0.6, and 0.8 µM, supplemented with 250 mL of BG11 medium) to treat the ZAA3 strain, 0.6 µM produced the highest growth rate. In the case of the manganese chloride treatment [56], among the three considered concentrations (0.5, 0.7, and 0.9 µM), 0.9 µM produced the highest growth rate of the ZAA3 strain. Regarding iron chloride treatment, the same strain exhibited the highest growth rate under the 0.4 µM solution. During the first four days, the growth was slow, but there was a subsequent gradual increase until the ninth day, followed by a decrease in the number of cells. The AZH strains responded differently to different treatments.
The micronutrient manganese chloride and the salicylic acid hormone had more comparable effects, although iron chloride induced the highest growth rate. Sodium molybdenum oxide produced the second-highest growth rate. The growth rate of the AZH strain was slow in the 10−2 M salicylic acid, while the 10−3 M salicylic acid induced a higher growth rate, as presented in Figure 3d. The growth rate of the algae strain was prolonged over the first three days for all the treatments and then accelerated up to the sixth day. At that time, a rapid decrease set in. There was a gradual increase in the growth rate up to the ninth day of the experiment, followed by decrement. Under 0.6 µM sodium molybdenum oxide, the AZH strain exhibited faster growth compared with the other concentrations. Under manganese chloride treatment, the growth rate of the AZH strain was slow during the first four days of the experiment. This process was unexpectedly followed by accelerated growth and a subsequent decrease in increase. When using 0.7 µM manganese chloride, the maximum growth rate was attained on the ninth day of the experiment, after which the number of cells slowly decreased until the last day of the experiment. This micronutrient produced the highest growth rate for all the considered microalgae strains. However, the positive effect was only observed for a concentration of 0.4 µM, with the growth rate increasing rapidly and maximizing on the 9th day, after which it slowly decreased.

3.3.3. AZS Strain

The AZS strain responded to all the micronutrients and hormone concentrations, with a higher treatment effect for iron chloride. The salicylic acid had little effect on the culturing of this microalgae strain, and the difference between the responses to the three concentrations applied was also low. The maximum growth rate under 10−4 M salicylic acid treatment occurred on the 9th day, after which there was a gradual decrease in the number of cells. The AZS strain response to sodium molybdenum oxide was different, with 0.6 µM of the micronutrient being the most effective of the three considered concentrations. The growth rate under treatment with this micronutrient was slow during the initial day. It gradually increased over the following days, with the maximum biomass obtained on the 9th day, as shown in Figure 3e. A slight decrease followed this in the number of cells. The growth rates for all the considered micronutrient concentrations were the same over the first three days. The optimal growth rate was attained on the 9th day, and a slow decrease followed this in the number of cells. In treating manganese chloride, the highest growth rate of the AZS strain was achieved for a concentration of 0.9 µM of the nutrient in a BG11 medium. The trends of the growth rate of the AZS strain under iron chloride treatment were similar for the three applied concentrations of the micronutrient. However, the highest rate was achieved for a concentration of 0.5 µM. There was a gradual increase in the growth rate over the earlier days, with the maximum level attained on the 9th day.

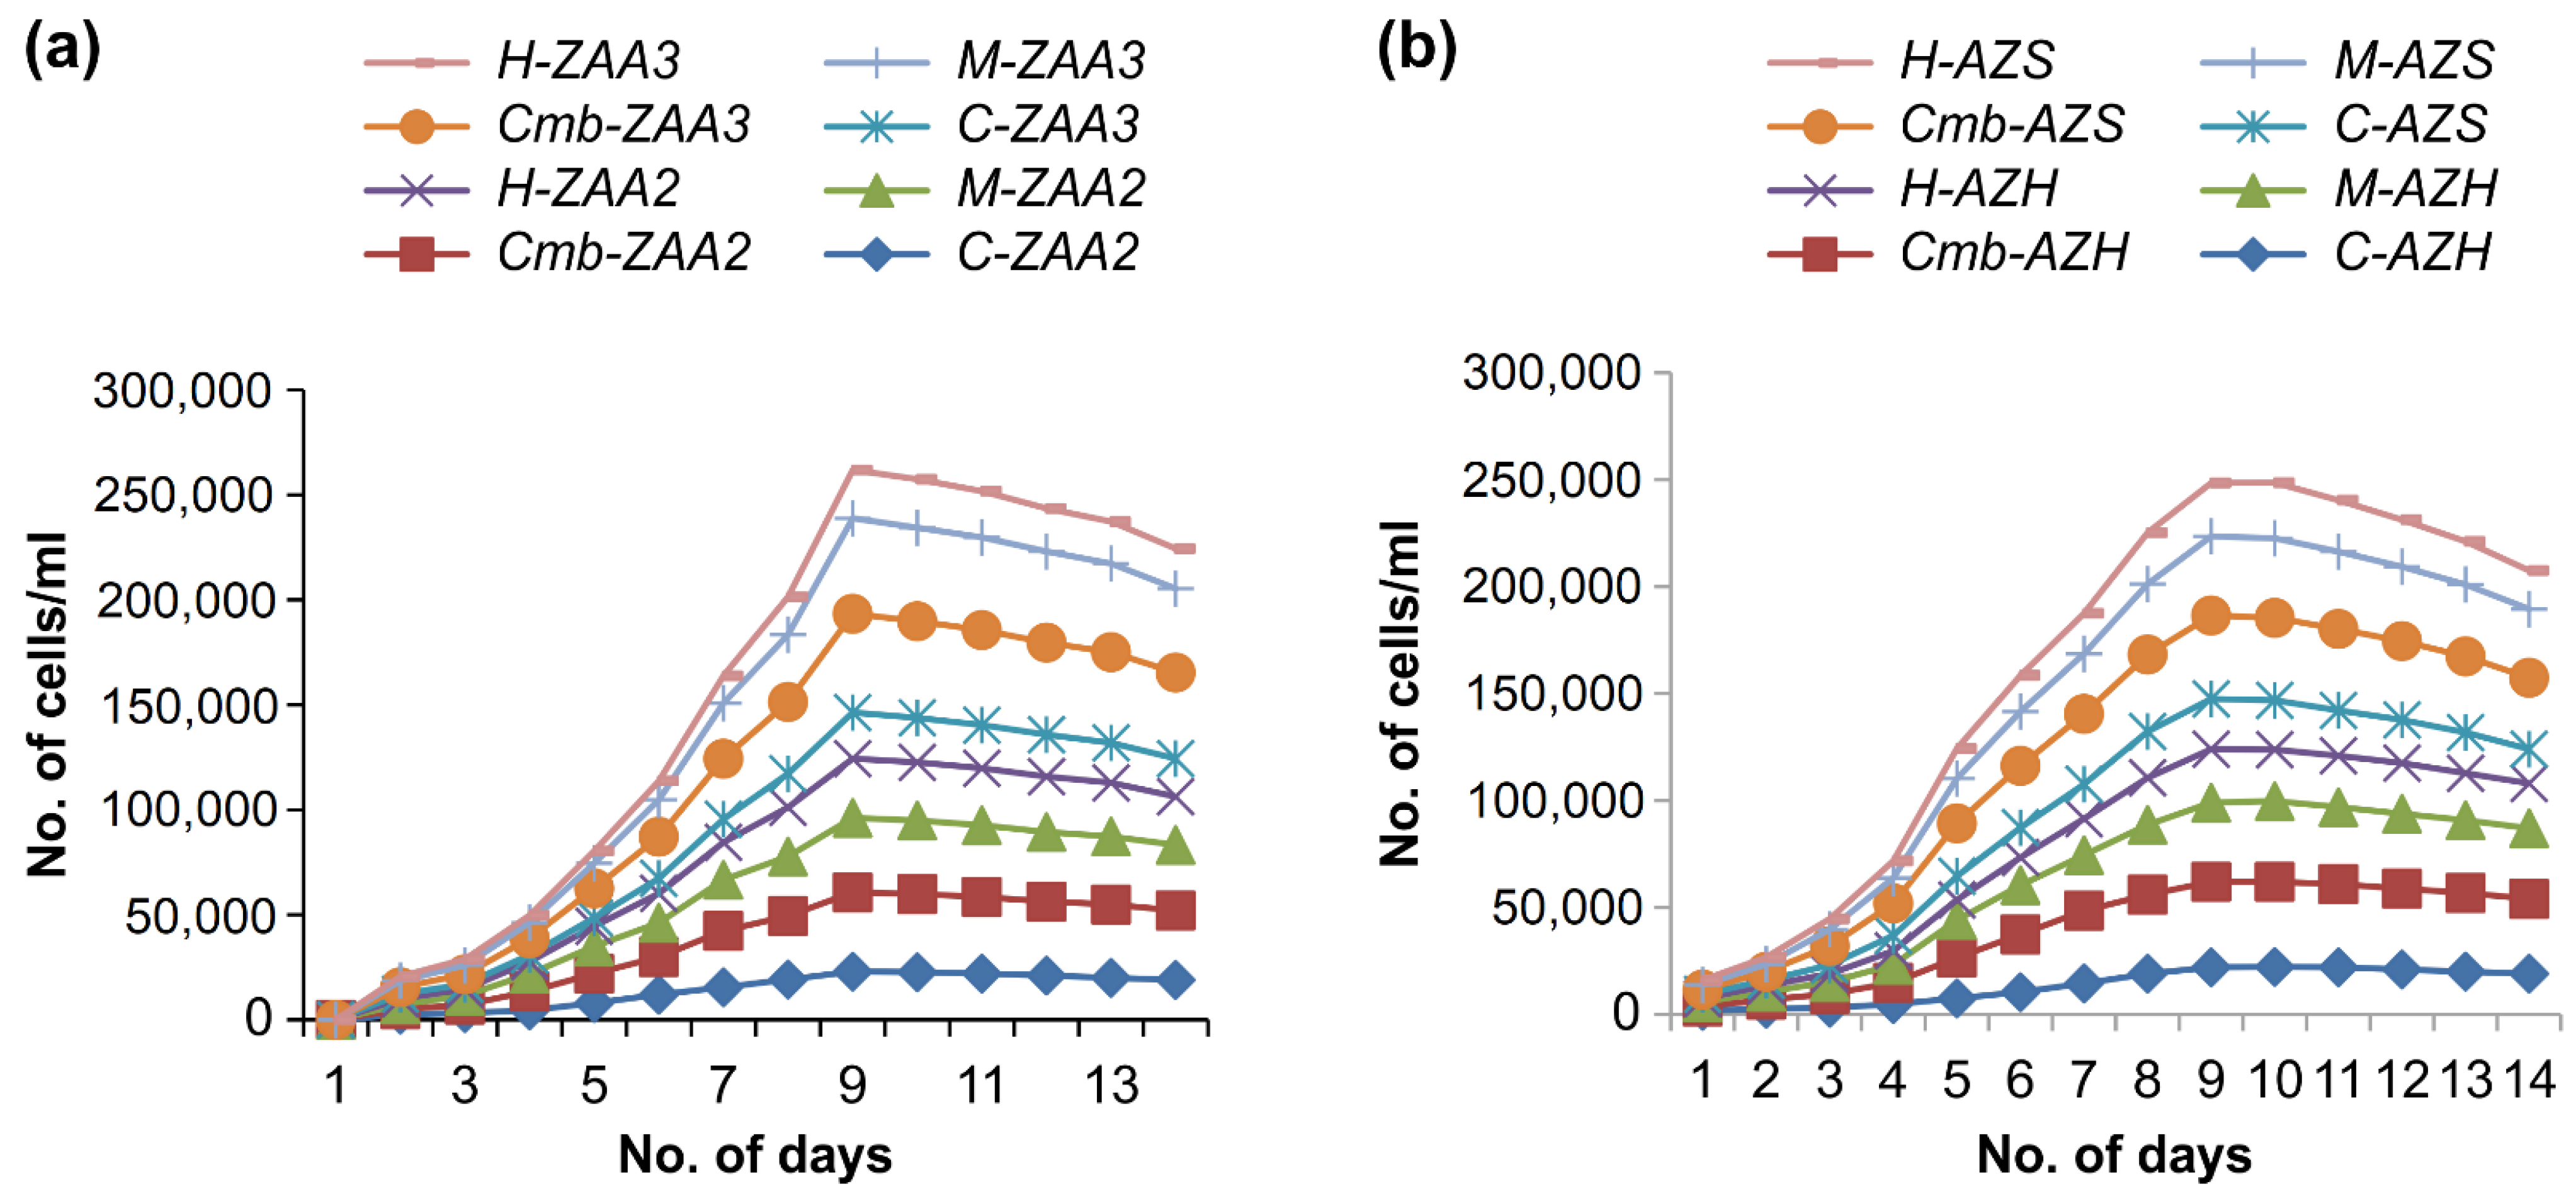
3.4. The Combined Effect of Hormone and Micronutrients (Second Set of Experiments)

In the second set of experiments, the combined effect of micronutrients and hormone and a mixture of all trace metals was analyzed. The optimal concentration from all treatments in terms of growth rate was obtained during the first set of experiments followed by the second set of experiments. Figure 4 displays the growth pattern for the four strains ZAA3, AZS, ZAA2, and AZH during the second set of treatments. The growth rate for the ZAA2 strain was observed during four different treatments; the highest growth rate was seen in response to the combined treatment (hormones and all micronutrients). In contrast, the treatment of all micronutrients resulted only in the second-best growth rate. Finally, the third treatment consisted of the only hormone, which had a low effect on growth rate. The ZAA2 strain gave a maximum number of 33,100 cells per ml during the combined treatment, 31,200 cells per ml in the third dilution obtained during the micronutrient treatment, and the hormone treatment gave 23,000 cells per ml in the third dilution. In contrast, the control strain had a slow rate of growth relative to all treatments. The same trend in biomass production was observed when the other three strains (i.e., AZS, AZH, and ZAA3) passed through these four treatments: the control strain and hormone-treated strains had a low effect on growth, while the mixture of microelements and hormone treatment presented the best growth in all strains, and the treatment of all micronutrients showed the second-highest growth rate for all monocultures.
The ZAA3 strain provided the highest number of cells for all strains during the combined treatments; for all strains, the order of increase in the number of cells was ZAA3 > AZH > AZS > ZAA2. The same trend in the production of biomass for all strains was observed during the micronutrient treatment.
In the second set of experiments, the combined effect of micronutrients and Figure 4b also display the growth behavior of the AZS strain. During the initial days, growth was slow, after which the number of cells gradually increased until the 7th day, on which the number of cells decreased. The decrease in growth indicated lipid accumulation in the cells; additionally, the biomass decline was due to the cells moving toward maturity, after which the cells grew smoothly. On the 9th day, maximum biomass production was attained, after which the number of cells slowly decreased. Furthermore, Figure 4 shows the strains that had a growth pattern similar to that of the AZS strain over the 14 days of the experiment. As shown in Figure 4b, the ZAA3 strain exhibited considerable growth. Although the growth rate for ZAA3 was slow during the first three days of the experiment, the number of cells increased directly with the number of days until the 9th day. No abrupt changes in growth rate were observed during this phase of the experiment, similar to results obtained for the AZS, AZH, and ZAA2 strains. The ZAA3 strain achieved maximum biomass production by the 9th day of the experiment, after which the number of cells decreased slowly.

3.5. Effects of Individual Treatments with Micronutrients and Hormone on Photosynthetic Pigments

The photosynthetic pigments chlorophyll A, chlorophyll B, and carotenoids are present in Chlorella sp., Phormidium sp., Chlorococcum sp. and Cosmarium sp. They show a stimulating effect in response to salicylic acid treatment.

3.5.1. Chlorophyll A

The native microalgal strains were collected from different water resources in Multan City. The physical screening and characterization of the strains were conducted using a microscope, as shown in Table 2. The results of the chemical and phylogenetic examination of the strains are also presented in Table 2. The growth of the algal strains was examined under different micronutrient and hormone concentrations, and chlorophyll A content was measured using Equations (1) and (2). The AZH strain remained a major species under all the treatments. An increase of the concentration of the iron chloride micronutrient from 0.2 to 0.4 µM significantly increased the amount of chlorophyll A in the strain from 0.4577 ± 0.0219 mg to 0.5794 ± 0.0173 mg/g, as shown in Figure 5. Conversely, 0.6 µM sodium molybdenum oxide and 0.7 µM manganese chloride had a smaller but statistically significant effect on the production of chlorophyll A, which amounted to 0.5034 ± 0.01735 and 0.4025 ± 0.00918 mg/g under these two treatments, respectively. The salicylic acid hormone produced the least amount of chlorophyll a, namely, 0.2361 ± 0.01838 mg/g (according to repeated measures of one-way ANOVA, n = 39, p < 0.0001, t = 0.6001, F = 128.9). The increases in chlorophyll a in the AZS strain under the different micronutrient and hormone treatments were in the following increasing order: 10−4 µM salicylic acid <0.7 µM manganese chloride <0.6 µM sodium molybdenum oxide < 0.4 µM iron chloride, with the specific amounts being 0.2984 ± 0.0102, 0.3865 ± 0.0201, 0.4859 ± 0.0133, and 0.5074 ± 0.0460 mg/g, respectively (see Figure 5a based on repeated measures of one-way ANOVA, n = 39: p < 0.0001, t = 0.385, F = 60.96). When the same treatments were applied to the cultures of the ZAA1 and ZAA2 strains, they produced significant results but with little variations. The lowest chlorophyll contents for these strains were observed under 10−4 M salicylic acid treatment, being 0.1757 ± 0.01867 mg for ZAA1 and 0.2113 ± 0.0217 mg/g for ZAA2. The highest ZAA1 chlorophyll A contents of 0.551 ± 0.0203 and 0.3875 ± 0.0214 mg/g were respectively observed under iron chloride and sodium molybdenum oxide treatments (n = 39, repeated measures of one-way ANOVA, p < 0.0001, t = 0.7012, F = 85.87), as presented in Figure 5b. The chlorophyll A contents of ZAA2 under 0.5 µM sodium molybdenum oxide and 0.4 µM iron chloride were 0.3993 ± 0.02398 and 0.4433 ± 0.0107 mg/g, respectively (n = 39, repeated measures of one-way ANOVA, p < 0.0001, t = 0. 3582, F = 81.03). The present results indicate that the amount of chlorophyll a is highest for 0.4 µM iron chloride (0.5394 ± 0.0199 mg/g) and lowest for 10−2 M salicylic acid (0.1627 ± 0.0204 mg/g), with the intermediate values being 0.4067 ± 0.016 and 0.2624 ± 0.0140 mg/g for 0.5 µM sodium molybdenum oxide and manganese chloride, respectively (n = 39, repeated measures of one-way ANOVA, p < 0.0001, t = 0.523, F = 154.9), as shown in Figure 5a.

3.5.2. Chlorophyll B
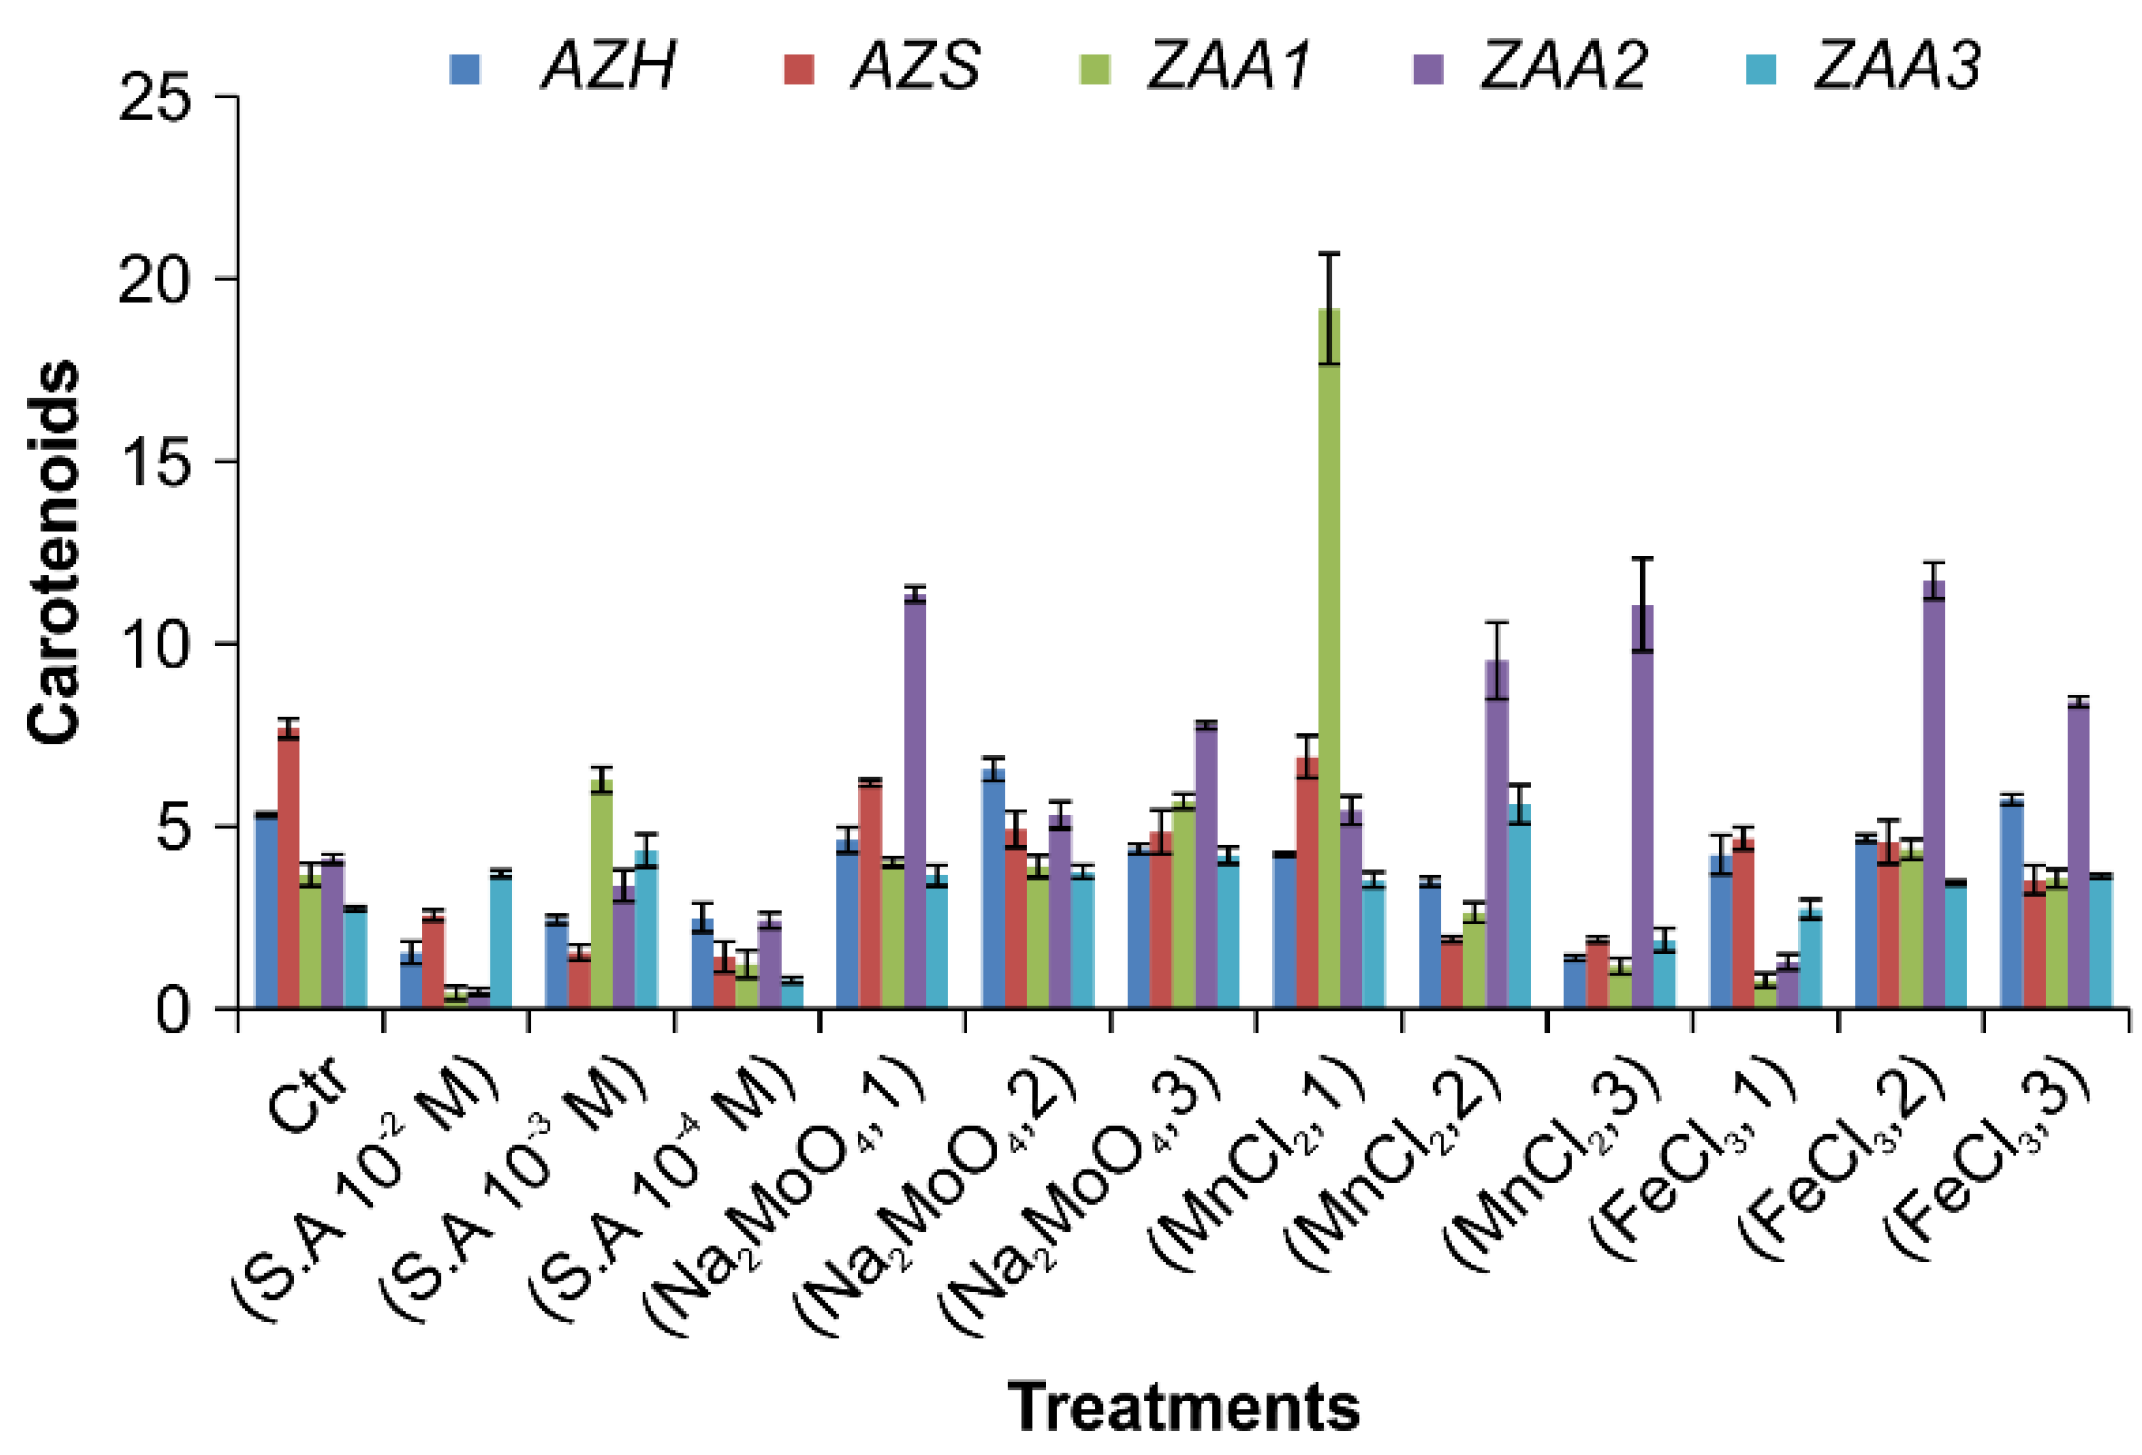
The amount of chlorophyll B in all the algal strains was observed to fluctuate between the different treatments. A high value of 0.7748 ± 0.0211 mg/g was observed in the AZH strain under 10−2 M salicylic acid, while it was 0.7108 ± 0.0142 mg/g under 0.5 µM manganese chloride. Sodium molybdenum oxide and iron chloride produced less amounts of 0.4731 ± 0.0497 and 0.5974 ± 0.0164 mg/g, respectively, as shown in Figure 5b (n = 39, repeated measures of one-way ANOVA, p < 0.0001, t = 1.311, F = 73.72). In the AZS strain, the amount of chlorophyll b was high at 0.77913 ± 0.0787 and 0.5487 ± 0.0246 mg/g under 0.2 µM iron chloride and 10−3 M salicylic acid, respectively. It was, however, very low at 0.4831 ± 0.0257 and 0.3022 ± 0.0261 mg/g under manganese chloride and NaMoO4, respectively, as shown in Figure 5b (n = 39, repeated measures of one-way ANOVA, p < 0.0001, t = 0.8656, F = 53.16). When the same treatments were applied to the ZAA1 strain, the results were significant and with little variations. The highest chlorophyll B contents for this strain were observed under 0.2 µM iron chloride (0.8736 ± 0.0236 mg/g) and 0.6 µM NaMoO4 (0.8048 ± 0.0152 mg/g), with the values under 0.9 µM manganese chloride and 10−4 M SA being 0.6579 ± 0.0438 and 0.3157 ± 0.0232 mg/g, respectively, as shown in Figure 5b (n = 39, repeated measures of one-way ANOVA, p < 0.0001, t = 2.951, F = 242.7). The chlorophyll B contents of the ZAA2 strain under 0.5 µM manganese chloride and 0.6 µM NaMoO4 were also high at 0.5114 ± 0.0392 and 0.4634 ± 0.0264 mg/g, respectively (n = 39, repeated measures of one-way ANOVA, p < 0.0001, t = 1.746, F = 175). The values were, however, low under 0.6 µM iron chloride (0.2574±0.0239 mg/g) and 10−3 SA (0.1865 ± 0.0190 mg/g). In the case of the ZAA3 strain, 10−4 M SA and 0.9 µM manganese chloride produced high chlorophyll B contents of 0.8425 ± 0.0485 and 0.8365 ± 0.0289 mg/g, respectively, while 0.4 µM iron chloride and 0.6 µM NaMoO4 produced lower but significant values of 0.7887 ± 0.038 and 0.7178 ± 0.0210 mg/g, respectively (n = 39, repeated measures of one-way ANOVA, p < 0.0001, t = 1.927, F = 119.4), as shown in Figure 5b. The chlorophyll contents of the different algal strains produced under different micronutrients and hormone concentrations are summarized in Table 3.

3.5.3. Carotenoids

Carotenoids play an important role in algae, providing protection against photo damages and assisting photosynthesis. Carotenoid content was measured according to Equation (3). In the case of the AZH strain, 0.6 µM sodium molybdenum oxide produced the largest amount of carotenoids (6.5676 ± 0.3102 mg/g), and 10−4 salicylic acid the smallest (2.447 ± 0.1214 mg/g); 0.6 µM sodium molybdenum oxide and 0.5 µM manganese chloride also produced significant amounts (6.5676 ± 0.3102 and 4.2335 ± 0.0565 mg/g, respectively) (n = 39, repeated measures of one-way ANOVA, p < 0.0001, t = 91.97, F = 116.3) as depicted in Figure 6. The results for the AZS strain were similar with small variations; 6.9167 ± 0.5791 mg/g of carotenoids was produced under 0.5 µM manganese chloride, 4.6763 ± 0.3102 mg/g under 0.2 µM iron chloride, and 6.1891 ± 0.0905 mg/g under 0.4 µM sodium molybdenum oxide (n = 39, repeated measures of one-way ANOVA, p < 0.0001, t = 162.2, F = 91.81). Regarding the ZAA1 strain, varying amounts of carotenoids were obtained under the different treatments, with 0.5 µM manganese chloride producing the largest amount of 19.1798 ± 1.5078 mg/g; only a small amount of 4.3771 ± 0.2732 mg/g was produced under 0.4 µM iron chloride, while 10−3 M salicylic acid and 0.6 µM sodium molybdenum oxide, respectively, produced 6.2796 ± 0.3422 mg/g and 5.6848 ± 0.2053 (n = 39, repeated measures of one-way ANOVA, p < 0.0001, t = 838.62, F = 288.8). The ZAA2 strain produced the highest amounts of carotenoids, with treatments with 0.4 µM iron chloride, 0.9 µM manganese chloride, and 0.4 µM sodium molybdenum oxide producing 11.7333 ± 0.5008, 11.0765 ± 1.2724, and 11.3628 ± 0.2072 mg/g of the material, respectively. However, salicylic acid treatment of the strain produced a relatively small amount of carotenoids, specifically 3.3808 ± 0.4284 mg/g (repeated measures of one-way ANOVA, n = 39, p < 0.0001, t = 559.2, F = 164.5). The ZAA3 strain did not produce the highest amounts of carotenoids with any of the treatments; however, except with treatment of SA 10−2 M, and also the treatment with 10−3 M salicylic acid and 0.7 µM manganese chloride induced the production of 4.3447 ± 0.4494 and 5.6077 ± 0.5314 mg/g of carotenoids. In contrast, treatment with 0.80 µM sodium molybdenum oxide and 0.60 µM iron chloride produced 4.2092 ± 0.2309 and 3.64747 ± 0.0603 mg/g of carotenoids, respectively (repeated measures of one-way ANOVA, n = 39, p < 0.0001, t = 51.92, F = 60.2), as presented in Figure 6. Carotenoid contents for each algal strain after each treatment are summarized in Table 3 and Figure 6.

4. Conclusions

The optimal concentrations of micronutrients and hormones required for the growth of green microalgae were investigated. The order of the increases in growth rate produced by different treatments was iron chloride > sodium molybdenum oxide > manganese chloride > salicylic acid. The order of the increases in biomass of the considered microalgal strains was AZH > AZS > ZAA3 > ZAA2 > ZAA1. More significant increases in growth rate were observed under combined micronutrient and hormone treatments, with the order of the effects being micronutrients + hormone ˃ all three micronutrients > hormone alone.

Author Contributions

Writing—Original draft preparation, methodology, A.A.; data curation, formal analysis, S.R.; writing—review and editing, funding acquisition, A.B.; formal analysis, writing—review and editing, funding acquisition, N.H.; investigation, M.S.; software, S.H.; validation, L.R.; conceptualization, supervision, H.M. All authors have read and agreed to the published version of the manuscript.

Funding

This research did not receive any specific grant from funding agencies in the public, commercial, or not-for-profit sectors.

Institutional Review Board Statement

Not applicable.

Informed Consent Statement

Not applicable.

Data Availability Statement

Not applicable.

Conflicts of Interest

The authors declare no conflict of interests.

References

  1. Williams, P.J.; Laurens, L.M.L. Microalgae as biodiesel & biomass feedstocks: Review & analysis of the biochemistry, energetics & economics. Energy Environ. Sci. 2010, 3, 554–590. [Google Scholar]
  2. Fargione, J.; Hill, J.; Tilman, D.; Polasky, S.; Hawthorne, P. Land Clearing and the Biofuel Carbon Debt. Science 2008, 319, 1235–1238. [Google Scholar] [CrossRef] [PubMed] [Green Version]
  3. Melillo, J.M.; Reilly, J.M.; Kicklighter, D.W.; Gurgel, A.C.; Cronin, T.W.; Paltsev, S.; Felzer, B.S.; Wang, X.; Sokolov, A.P.; Schlosser, C.A. Indirect emissions from biofuels: How important? Science 2009, 326, 1397–1399. [Google Scholar] [CrossRef] [PubMed] [Green Version]
  4. Chisti, Y. Biodiesel from microalgae. Biotechnol. Adv. 2007, 25, 294–306. [Google Scholar] [CrossRef] [PubMed]
  5. Richmond, A.; Hu, Q. Handbook of Microalgal Culture; John Wiley & Sons, Inc.: Hoboken, NJ, USA, 2013. [Google Scholar]
  6. Graham, L.; Graham, J.; Wilcox, L. Algae, 2nd ed.; Benjamin Cummings: San Francisco, CA, USA, 2009. [Google Scholar]
  7. Lee, R.A.; Lavoie, J.-M. From first- to third-generation biofuels: Challenges of producing a commodity from a biomass of increasing complexity. Anim. Front. 2013, 3, 6–11. [Google Scholar] [CrossRef]
  8. Mata, T.M.; Martins, A.A.; Caetano, N.S. Microalgae for biodiesel production and other applications: A review. Renew. Sustain. Energy Rev. 2010, 14, 217–232. [Google Scholar] [CrossRef] [Green Version]
  9. Song, M.; Pei, H.; Hu, W.; Ma, G. Evaluation of the potential of 10 microalgal strains for biodiesel production. Bioresour. Technol. 2013, 141, 245–251. [Google Scholar] [CrossRef] [PubMed]
  10. Michelon, W.; Da Silva, M.L.B.; Mezzari, M.P.; Pirolli, M.; Prandini, J.M.; Soares, H.M. Effects of Nitrogen and Phosphorus on Biochemical Composition of Microalgae Polyculture Harvested from Phycoremediation of Piggery Wastewater Digestate. Appl. Biochem. Biotechnol. 2016, 178, 1407–1419. [Google Scholar] [CrossRef] [PubMed]
  11. Jazzar, S.; Berrejeb, N.; Messaoud, C.; Marzouki, M.N.; Smaali, I. Growth Parameters, Photosynthetic Performance, and Biochemical Characterization of Newly Isolated Green Microalgae in Response to Culture Condition Variations. Appl. Biochem. Biotechnol. 2016, 179, 1290–1308. [Google Scholar] [CrossRef]
  12. Huesemann, M.; Crowe, B.; Waller, P.; Chavis, A.; Hobbs, S.; Edmundson, S.; Wigmosta, M. A validated model to predict microalgae growth in outdoor pond cultures subjected to fluctuating light intensities and water temperatures. Algal Res. 2016, 13, 195–206. [Google Scholar] [CrossRef] [Green Version]
  13. Juneja, A.; Ceballos, R.M.; Murthy, G.S. Effects of Environmental Factors and Nutrient Availability on the Biochemical Composition of Algae for Biofuels Production: A Review. Energies 2013, 6, 4607–4638. [Google Scholar] [CrossRef] [Green Version]
  14. Chen, M.; Tang, H.; Ma, H.; Holland, T.C.; Ng, K.S.; Salley, S.O. Effect of nutrients on growth and lipid accumulation in the green algae Dunaliella tertiolecta. Bioresour. Technol. 2011, 102, 1649–1655. [Google Scholar] [CrossRef] [PubMed]
  15. Mojaat, M.; Pruvost, J.; Foucault, A.; Legrand, J. Effect of organic carbon sources and Fe2+ ions on growth and β-carotene accumulation by Dunaliella salina. Biochem. Eng. J. 2008, 39, 177–184. [Google Scholar] [CrossRef] [Green Version]
  16. Chernikova, A.A.; Tsoglin, L.N.; Markelova, A.G.; Zorin, S.N.; Mazo, V.K.; Pronina, N.A. Capacity of Spirulina platensis to accumulate manganese and its distribution in cell. Russ. J. Plant Physiol. 2006, 53, 800–806. [Google Scholar] [CrossRef]
  17. Araújo, P.H.M.; Santana, J.K.S.; Sassi, R.; da Costa, D.C.; Filho, N.R.A.; Cordeiro, A.M.T.M.; Gondim, A.D.; Santos, N.A. Renewable source hydrocarbons obtaining from microalgae by catalytic deoxygenation. Biomass Convers. Biorefinery 2021, 1–8. [Google Scholar] [CrossRef]
  18. Manoj, B.S.; Ahlawat, S.; Chavan, M.; Karosiya, A. Successive production of biodiesel and bioethanol feedstock from the Cosmarium sp. Int. J. Chem. Stud. 2018, 6, 550–554. [Google Scholar] [CrossRef] [Green Version]
  19. Chi, N.T.L.; Duc, P.A.; Mathimani, T.; Pugazhendhi, A. Evaluating the potential of green alga Chlorella sp. for high biomass and lipid production in biodiesel viewpoint. Biocatal. Agric. Biotechnol. 2019, 17, 184–188. [Google Scholar] [CrossRef]
  20. Kim, H.S.; Park, W.-K.; Lee, B.; Seon, G.; Suh, W.I.; Moon, M.; Chang, Y.K. Optimization of heterotrophic cultivation of Chlorella sp. HS2 using screening, statistical assessment, and validation. Sci. Rep. 2019, 9, 1–13. [Google Scholar] [CrossRef] [Green Version]
  21. Vo, H.-N.-P.; Bui, X.-T.; Nguyen, T.-T.; Nguyen, D.D.; Dao, T.-S.; Cao, N.-D.-T.; Vo, T.-K.-Q. Effects of nutrient ratios and carbon dioxide bio-sequestration on biomass growth of Chlorella sp. in bubble column photobioreactor. J. Environ. Manag. 2018, 219, 1–8. [Google Scholar] [CrossRef] [PubMed]
  22. Alishah Aratboni, H.; Rafiei, N.; Garcia-Granados, R.; Alemzadeh, A.; Morones-Ramírez, J.R. Biomass and lipid induction strategies in microalgae for biofuel production and other applications. Microb. Cell Factories 2019, 18, 1–17. [Google Scholar] [CrossRef] [PubMed] [Green Version]
  23. Yadav, G.; Sekar, M.; Kim, S.-H.; Geo, V.E.; Bhatia, S.K.; Sabir, J.S.; Chi, N.T.L.; Brindhadevi, K.; Pugazhendhi, A. Lipid content, biomass density, fatty acid as selection markers for evaluating the suitability of four fast growing cyanobacterial strains for biodiesel production. Bioresour. Technol. 2021, 325, 124654. [Google Scholar] [CrossRef] [PubMed]
  24. Patel, V.K.; Sundaram, S.; Patel, A.K.; Kalra, A. Characterization of Seven Species of Cyanobacteria for High-Quality Biomass Production. Arab. J. Sci. Eng. 2017, 43, 109–121. [Google Scholar] [CrossRef]
  25. Tsavatopoulou, V.D.; Aravantinou, A.F.; Manariotis, I.D. Biofuel conversion of Chlorococcum sp. and Scenedesmus sp. biomass by one-and two-step transesterification. Biomass Convers. Biorefinery 2019, 1–9. [Google Scholar] [CrossRef]
  26. Rehman, Z.U.; Anal, A.K. Enhanced lipid and starch productivity of microalga (Chlorococcum sp. TISTR 8583) with nitrogen limitation following effective pretreatments for biofuel production. Biotechnol. Rep. 2019, 21, e00298. [Google Scholar] [CrossRef] [PubMed]
  27. Ruangsomboon, S. Effect of light, nutrient, cultivation time and salinity on lipid production of newly isolated strain of the green microalga, Botryococcus braunii KMITL 2. Bioresour. Technol. 2012, 109, 261–265. [Google Scholar] [CrossRef] [PubMed]
  28. Andersen, R.A. Algal Culturing Techniques; Elsevier: Amsterdam, The Netherlands, 2005. [Google Scholar]
  29. Chaichalerm, S.; Pokethitiyook, P.; Yuan, W.; Meetam, M.; Sritong, K.; PugKaew, W.; Kungvansaichol, K.; Kruatrachue, M.; Damrongphol, P. Culture of microalgal strains isolated from natural habitats in Thailand in various enriched media. Appl. Energy 2012, 89, 296–302. [Google Scholar] [CrossRef]
  30. Hai, T.; Ahlers, H.; Gorenflo, V.; Steinbüchel, A. Axenic cultivation of anoxygenic phototrophic bacteria, cyanobacteria, and microalgae in a new closed tubular glass photobioreactor. Appl. Microbiol. Biotechnol. 2000, 53, 383–389. [Google Scholar] [CrossRef] [PubMed]
  31. Jin, J.; Dupré, C.; Legrand, J.; Grizeau, D. Extracellular hydrocarbon and intracellular lipid accumulation are related to nutrient-sufficient conditions in pH-controlled chemostat cultures of the microalga Botryococcus braunii SAG 30.81. Algal Res. 2016, 17, 244–252. [Google Scholar] [CrossRef]
  32. Wu, L.F.; Chen, P.C.; Lee, C.M. The effects of nitrogen sources and temperature on cell growth and lipid accumulation of microalgae. Int. Biodeterior. Biodegrad. 2013, 85, 506–510. [Google Scholar] [CrossRef]
  33. González-Fernández, C.; Mahdy, A.; Ballesteros, I.; Ballesteros, M. Impact of temperature and photoperiod on anaerobic biodegradability of microalgae grown in urban wastewater. Int. Biodeterior. Biodegrad. 2016, 106, 16–23. [Google Scholar] [CrossRef]
  34. Halim, R.; Harun, R.; Danquah, M.K.; Webley, P.A. Microalgal cell disruption for biofuel development. Appl. Energy 2012, 91, 116–121. [Google Scholar] [CrossRef]
  35. Agostoni, M.; Lucker, B.F.; Smith, M.A.; Kanazawa, A.; Blanchard, G.J.; Kramer, D.M.; Montgomery, B.L. Competition-based phenotyping reveals a fitness cost for maintaining phycobilisomes under fluctuating light in the cyanobacterium Fremyella diplosiphon. Algal Res. 2016, 15, 110–119. [Google Scholar] [CrossRef] [Green Version]
  36. Bergmann, P.; Trösch, W. Repeated fed-batch cultivation of Thermosynechococcus elongatus BP-1 in flat-panel airlift photobioreactors with static mixers for improved light utilization: Influence of nitrate, carbon supply and photobioreactor design. Algal Res. 2016, 17, 79–86. [Google Scholar] [CrossRef]
  37. Blank, C.E.; Hinman, N.W. Cyanobacterial and algal growth on chitin as a source of nitrogen; ecological, evolutionary, and biotechnological implications. Algal Res. 2016, 15, 152–163. [Google Scholar] [CrossRef]
  38. Coyer, J.A.; Robertson, D.L.; Alberte, R.S. Genetic variability within a population and between diploid/haploid tissue macrocystis pyrifera. J. Phycol. 1994, 30, 545–552. [Google Scholar] [CrossRef]
  39. Sapp, M.; Schwaderer, A.S.; Wiltshire, K.H.; Hoppe, H.-G.; Gerdts, G.; Wichels, A. Species-Specific Bacterial Communities in the Phycosphere of Microalgae? Microb. Ecol. 2007, 53, 683–699. [Google Scholar] [CrossRef] [PubMed]
  40. Burja, A.M.; Tamagnini, P.; Bustard, M.T.; Wright, P.C. Identification of the green alga, Chlorella vulgaris (SDC1) using cyanobacteria derived 16S rDNA primers: Targeting the chloroplast. FEMS Microbiol. Lett. 2001, 202, 195–203. [Google Scholar] [CrossRef] [PubMed]
  41. Lichtenthaler, H.K.; Wellburn, A.R. Determinations of total carotenoids and chlorophylls a and b of leaf extracts in different solvents. Biochem. Soc. Trans. 1983, 11, 591–592. [Google Scholar] [CrossRef] [Green Version]
  42. Li, L.; Cui, J.; Liu, Q.; Ding, Y.; Liu, J. Screening and phylogenetic analysis of lipid-rich microalgae. Algal Res. 2015, 11, 381–386. [Google Scholar] [CrossRef]
  43. Feng, D.-F.; Doolittle, R.F. Progressive alignment and phylogenetic tree construction of protein sequences. Methods Enzymol. 1990, 183, 375–387. [Google Scholar]
  44. Song, L.; Qin, J.G.; Su, S.; Xu, J.; Clarke, S.; Shan, Y. Micronutrient Requirements for Growth and Hydrocarbon Production in the Oil Producing Green Alga Botryococcus braunii (Chlorophyta). PLoS ONE 2012, 7, e41459. [Google Scholar] [CrossRef] [PubMed] [Green Version]
  45. Volland, S.; Bayer, E.; Baumgartner, V.; Andosch, A.; Lütz, C.; Sima, E.; Lütz-Meindl, U. Rescue of heavy metal effects on cell physiology of the algal model system Micrasterias by divalent ions. J. Plant Physiol. 2014, 171, 154–163. [Google Scholar] [CrossRef] [PubMed] [Green Version]
  46. Ahmed, F.; Fanning, K.; Netzel, M.; Schenk, P.M. Induced carotenoid accumulation in Dunaliella salina and Tetraselmis suecica by plant hormones and UV-C radiation. Appl. Microbiol. Biotechnol. 2015, 99, 9407–9416. [Google Scholar] [CrossRef] [PubMed]
  47. Czerpak, R.; Bajguz, A.; Gromek, M.; Kozłowska, G.; Nowak, I. Activity of salicylic acid on the growth and biochemism of Chlorella vulgaris Beijerinck. Acta Physiol. Plant. 2002, 24, 45–52. [Google Scholar] [CrossRef]
  48. Mc Gee, D.; Archer, L.; Fleming, G.T.; Gillespie, E.; Touzet, N. The effect of nutrient and phytohormone supplementation on the growth, pigment yields and biochemical composition of newly isolated microalgae. Process. Biochem. 2020, 92, 61–68. [Google Scholar] [CrossRef]
  49. Battah, M.; El-Ayoty, Y.; Abomohra, A.E.-F.; El-Ghany, S.A.; Esmael, A. Effect of Mn2+, Co2+ and H2O2 on biomass and lipids of the green microalga Chlorella vulgaris as a potential candidate for biodiesel production. Ann. Microbiol. 2014, 65, 155–162. [Google Scholar] [CrossRef]
  50. Pirson, A.; Bergmann, L. Manganese requirement and carbon source in Chlorella. Nature 1955, 176, 209–210. [Google Scholar] [CrossRef]
  51. Bruce, M. Organo-Transition Metal Chemistry-A Guide to the Literature 1950–1970. In Advances in Organometallic Chemistry; Elsevier: Amsterdam, The Netherlands, 1972; Volume 10, pp. 273–346. [Google Scholar]
  52. Clarkson, D.T.; Hanson, J.B. The Mineral Nutrition of Higher Plants. Annu. Rev. Plant Physiol. 1980, 31, 239–298. [Google Scholar] [CrossRef]
  53. Campbell, L.C.; Nable, R.O. Physiological Functions of Manganese in Plants; Springer: New York, NY, USA, 1988; pp. 139–154. [Google Scholar]
  54. Rains, D. Mineral metabolism. In Plant Biochemistry; Bonner, J., Varner, J.E., Eds.; Academic Press: New York, NY, USA, 1976. [Google Scholar]
  55. Pirson, A.; Tichy, C.; Wilhelmi, G. Stoffwechsel und mineralsalzernährung Einzelliger Grünalgen. Planta 1951, 40, 199–253. [Google Scholar] [CrossRef]
  56. Garnham, G.W.; Codd, G.A.; Gadd, G.M. Effect of nutritional regime on accumulation of cobalt, manganese and zinc by green microalgae. FEMS Microbiol. Lett. 1992, 98, 45–50. [Google Scholar] [CrossRef]
Figure 1. Photobioreactor for algae growth.
Sustainability 13 05035 g001
Figure 2. Phylogenetic trees showing the relationships among the 16S ribosomal RNA genes, the partial sequences of the isolated ZAA1(Phormidium sp.), ZAA2 (Chlorella sp.), ZAA3 (Cosmarium sp.), AZH (Chlorella sp.), and AZS (Chlorococcum sp.) strains, and the most similar sequences retrieved from the NCBI databases.
Sustainability 13 05035 g002
Figure 3. (ae) Growth rates of the (a) ZAA1(Phormidium sp.), (b) ZAA2 (Chlorella sp.), (c) ZAA3 (Cosmarium sp.), (d) AZH (Chlorella sp.), and (e) AZS (Chlorococcum sp.) strains concerning the micronutrient and hormone concentrations.
Sustainability 13 05035 g003
Figure 4. Growth rates of the four algae strain concerning the treatment condition, where C denotes control condition (no treatment), Cmb denotes treatment with a combination of hormone and all the micronutrients, M denotes treatment with a combination of all the microelements, and H denotes treatment with the only hormone. (a) Two strains, ZAA3 and ZAA2, were subjected to three different treatments, including hormone treatment, combined treatment of all micronutrients and hormone, and combined treatment of all three micronutrients, and the results were compared to the control strain. (b) The results of two strains, AZS and AZH, were compared to the control strain after they were subjected to three different treatments, including hormone treatment, combined treatment of all micronutrients and hormone, and combined treatment of all three micronutrients.
Sustainability 13 05035 g004
Figure 5. Chlorophyll A (a) and Chlorophyll B (b) contents of the AZH, AZS, ZAA1, ZAA2, and ZAA3 algal strains concerning the hormone and micronutrient treatment. The statistical differences between the treatment results were determined by one-way ANOVA analysis with a significance p ≤ 0.05.
Sustainability 13 05035 g005
Figure 6. Carotenoid contents of AZH, AZS, ZAA1, ZAA2, and ZAA3 algae strains under different hormone and micronutrient treatments. One-way ANOVA obtained the statistical differences between the treatment results with a significance p ≤ 0.05.
Sustainability 13 05035 g006
Table 1. Different concentrations of micronutrients and hormone employed in this study.
Treatment Methods ChemicalsConcentrations
HormoneSalicylic acid (S.A)10−2 M10−4 M10−6 M
MicronutrientSodium molybdenum oxide
(Na2MoO4)
0.40 µM0.60 µM0.80 µM
Manganese chloride
(MnCl2)
0.50 µM0.70 µM0.90 µM
Iron chloride
(FeCl3)
0.20 µM0.40 µM0.60 µM
Table 2. Detail of isolated algal strains.
Sampling Site and ConditionsName of SpeciesMorphological CharacteristicsAccession NumberClose RelativesSimilarity IndexMicroscopic Image
University lawn (Uni-L), pH 6.8, temperature 24 °C(AZH) Chlorella sp.Unicellular, bilateral oval shape, pyronide presentMF114595JN559374.188% Sustainability 13 05035 i001
Bio-park (Bp), pH 6.3, temperature 24 °C(AZS) Chlorococcum sp.Unicellular, circular shape, cup-shaped chloroplast MF114593JX221788.192% Sustainability 13 05035 i002
Institute of Management Science (IMS), pH 6.9, temperature 24 °C(ZAA1) Phormidium sp.Fiber-like structure grows with a long spindle form, unicellularMF140241MF140241.1100% Sustainability 13 05035 i003
Rice field (Rf), pH 8.1, temperature 28 °C(ZAA3) Cosmarium sp.Tetrachotomous branching,
perpendicular to the surface of colony, unicellular
MF114594KJ877699.186% Sustainability 13 05035 i004
Old Shujabad (OS), pH 7.4, temperature 30 °C(ZAA2) Chlorella sp.Unicellular, exists in colony, cup-shaped chloroplastMF114592GU291326.184% Sustainability 13 05035 i005
Table 3. Chlorophyll contents of the different algae strains under different micronutrient and hormone concentrations.
MeasurementsStrainsSA 10−2
M
S.A 10−4
M
SA 10−6
M
NaMo4
0.4 µM
NaMoO4
0.6 µM
NaMoO4
0.8 µM
MnCl2
0.5 µM
MnCl2
0.7 µM
MnCl2
0.9 µM
FeCl3
0.2 µM
FeCl3
0.4 µM
FeCl3
0.6 µM
Chlorophyll A
(mg/g)
ZAA10.1171
±
0.0201
0.1272
±
0.017
0.1757
±
0.0186
0.2477
±
0.0214
0.3236
±
0.0281
0.3875
±
0.0124
0.1412
±
0.0228
0.1817
±
0.0194
0.1817
±
0.0194
0.249
±
0.0257
0.4447
±
0.0244
0.551
±
0.0203
ZAA20.1413
±
0.0202
0.1914
±
0.0153
0.211
±
0.0217
0.3352
±
0.0222
0.3993
±
0.0239
0.323
±
0.0115
0.2392
±
0.0159
0.1796
±
0.0153
0.2065
±
0.0158
0.3737
±
0.0103
0.4433
±
0.0107
0.3389
±
0.0281
ZAA30.1627
±
0.0204
0.25
±
0.0122
0.2091
±
0.0197
0.3584
±
0.0145
0.4067
±
0.0167
0.2978
±
0.0181
0.2624
±
0.014
0.198
±
0.0213
0.1835
±
0.0113
0.2041
±
0.0102
0.5394
±
0.0199
0.4787
±
0.016
AZH0.1851
±
0.01
0.2088
±
0.033
0.2361
±
0.0183
0.3459
±
0.0086
0.503
±
0.0173
0.4655
±
0.0168
0.2989
±
0.0125
0.4025
±
0.00918
0.334
±
0.012
0.4577
±
0.0219
0.5794
±
0.0173
0.4707
±
0.017
AZS0.2088
±
0.0111
0.2429
±
0.0139
0.298
±
0.0102
0.4025
±
0.0121
0.4859
±
0.0133
0.4486
±
0.0265
0.284
±
0.022
0.3367
±
0.0228
0.3865
±
0.0201
0.4576
±
0.0291
0.5074
±
0.046
0.3252
±
0.0207
Chlorophyll B
(mg/g)
ZAA10.09375
±
0.01037
0.09935
±
0.024181
0.315719
±
0.023256
0.73211
±
0.05258
0.804814
±
0.015297
0.3677
±
0.03404
0.13488
±
0.03303
0.20505
±
0.04236
0.65798
±
0.0438
0.57058
±
0.02651
0.87368
±
0.02367
0.61523
±
0.0308
ZAA20.08485
±
0.02028
0.186017
±
0.01902
0.091736
±
0.025541
0.05354
±
0.01917
0.463006
±
0.026463
0.22385
±
0.02105
0.51141
±
0.03922
0.10287
±
0.03134
0.12946
±
0.01461
0.08683
±
0.01698
0.13385
±
0.03812
0.25741
±
0.02391
ZAA30.79518
±
0.03918
0.664446
±
0.02389
0.842581
±
0.048591
0.63124
±
0.02654
0.717881
±
0.021089
0.616131
±
0.06543
0.20564
±
0.04097
0.18543
±
0.03821
0.83656
±
0.02893
0.41679
±
0.01686
0.78801
±
0.03884
0.64316
±
0.02728
AZH0.77487
±
0.02113
0.471821
±
0.021832
0.6489
±
0.103712
0.47316
±
0.04979
0.33621
±
0.03459
0.35468
±
0.02349
0.66925
±
0.00989
0.27505
±
0.0216
0.71086
±
0.01428
0.57291
±
0.03043
0.38467
±
0.02769
0.59745
±
0.01642
AZS0.48207
±
0.01944
0.548749
±
0.024679
0.427653
±
0.022751
0.18158
±
0.02913
0.328115
±
0.019466
0.30226
±
0.02619
0.30246
±
0.03064
0.48315
±
0.02577
0.471
±
0.03469
0.47072
±
0.06262
0.58966
±
0.03006
0.77913
±
0.07585
Carotenoids
(mg/g)
ZAA10.4376
±
0.18961
6.279645
±
0.342229
1.231069
±
0.382523
4.0227
±
0.11885
3.910981
±
0.304809
5.68487
±
0.2053
19.1798
±
1.50787
2.64593
±
0.2769
1.1772
±
0.22342
0.78878
±
0.19189
4.37719
±
0.27326
3.57572
±
0.24983
ZAA20.48769
±
0.09245
3.380871
±
0.428483
2.431123
±
0.219307
11.3628
±
0.36715
5.309117
±
0.367158
7.76896
±
0.09943
5.43946
±
0.39154
9.54366
±
1.05015
11.0765
±
1.27241
1.29222
±
0.20923
11.733
±
0.50088
8.41567
±
0.14368
ZAA33.70892
±
0.0974
4.344771
±
0.449426
0.795548
±
0.085358
3.65585
±
0.28242
3.761879
±
0.180967
4.20928
±
0.23091
3.54076
±
0.21322
5.60778
±
0.53143
1.8951
±
0.32474
2.73708
±
0.26823
3.45322
±
0.0565
3.64747
±
0.06035
AZH1.54641
±
0.30667
2.447025
±
0.121471
2.505814
±
0.392535
4.63407
±
0.34712
6.567664
±
0.310251
4.38534
±
0.14101
4.23357
±
0.05658
3.4905
±
0.1282
1.40034
±
0.07346
4.22837
±
0.53237
4.67849
±
0.1003
5.73855
±
0.14241
AZS2.57232
±
0.14578
1.550937
±
0.212485
1.430827
±
0.416397
6.18919
±
0.09059
4.925682
±
0.497577
4.84973
±
0.61001
6.91673
±
0.57915
1.91282
±
0.07618
1.90541
±
0.07665
4.67638
±
0.31029
4.57829
±
0.31029
3.54275
±
0.39245
Publisher’s Note: MDPI stays neutral with regard to jurisdictional claims in published maps and institutional affiliations.

