Article

The Combined Effect of Alcohols and Calophyllum inophyllum Biodiesel Using Response Surface Methodology Optimization

1
Department of Mechanical Engineering, P. A. College of Engineering, Mangaluru, 574153, India
2
Department of Mechanical Engineering, College of Engineering, King Khalid University, P.O. Box 394, Abha 61421, Saudi Arabia
3
Department of Mechanical Engineering, Glocal University, Delhi-Yamunotri Marg SH-57, Mirzapur Pole, Saharanpur District, Uttar Pradesh 247121, India
4
School of Engineering, RMIT University, Melbourne, VIC 3001, Australia
5
Gokaraju Rangaraju Institute of Engineering & Technology, Hyderabad 500090, India
6
Mechanical Engineering Department, King Abdulaziz University, P.O. Box 80204, Jeddah 21589, Saudi Arabia
*
Authors to whom correspondence should be addressed.
Sustainability 2021, 13(13), 7345; https://doi.org/10.3390/su13137345
Submission received: 27 April 2021 / Revised: 31 May 2021 / Accepted: 24 June 2021 / Published: 30 June 2021

Abstract

:
In this experimental study, the performance of the diesel engine was analyzed for biodiesel derived from Calophyllum inophyllum. The impact of the addition of additives such as N-octanol and N-butanol with Calophyllum inophyllum biodiesel has been assessed. Impact of the application of hybrid N-octanol and N-butanol with biodiesel on emission profile used for the engine performance has also been demonstrated. Response surface analysis of alcohol additives-biodiesel blend was performed separately in this study for the engine efficiency and emission profile. A combination of N-octanol and N-butanol presented the highest brake thermal efficiency (BTE) and lowest carbon monoxide (CO) emission among the ternary blends of octanol. N-butanol-biodiesel blend presented the lowest hydrocarbon (HC) emission among the blends of N-butanol. N-octanol with 5 and 10% addition with biodiesel showed the lowest HC emissions among the blends of octanol. The response surface methodology (RSM) optimization revealed that the optimized thermal efficiency and emission were obtained at full load and minimum load, respectively. The addition of N-octanol hindered the emission at all loads, while N-butanol reduced it at higher loads. A strong correlation between the load and alcohol additives on the engine performance and emission profile has been obtained using the RSM optimization approach. The R-squared value obtained from the RSM was 0.92 and emission profile has been characterized.

1. Introduction

Diesel engines have become the primary transport source, in this technologically advanced era. Diesel fuel is used in a wide range of applications, from industry to automobiles. Diesel fuel is well known for improving engine performance and reducing emissions in vehicles. However, this valuable resource has been exhausted due to the rapid and excessive use of diesel and other fossil fuels. Additionally, the heavy use of fossil fuels increased greenhouse gas (GHG) emissions that consequently increased the global temperature contributing to the depletion of the ozone layer, thereby allowing UV rays to penetrate the planet. In addition, due to the emissions of various noxious pollutants such as sulfur oxides (SOx), hydrocarbons (HC), carbon mono-oxides (CO), nitrogen oxides (NOx), particulate matter (PM) and smoke, excessive use of fossil fuels has caused biohazards [1,2]. In addition, excessive use of fossil fuel has increased crude oil demand and market price on the global market. In addition, strict government regulation and emission standards have resulted in increased demand from non-conventional energy sources [3,4,5]. Biodiesel is one of the renowned renewable energy sources and this biofuel is synthesized from edible and non-edible oils [6]. India has a vast forest area and numerous oil-bearing plants and trees cover the vegetation. The well-known non-edible feedstocks in India are Honge, cottonseed, mahua, Jatropha, neem, Calophyllum inophyllum, castor, etc. [7,8,9,10]. In this study, Calophyllum inophyllum is examined for its potential as a biodiesel feedstock. Many prior works in the literature have stated that Calophyllum inophyllum oil has comparable diesel properties. Still, the density and viscosity of Calophyllum inophyllum are higher than diesel fuel, which often causes fuel filter blockage, fuel clogging and cold starting problems [11,12]. Hence, the authors successfully applied different alcohols which have been implemented as biodiesel additives in this study to reduce the viscosity of Calophyllum inophyllum biodiesel. Thus, the base fuel’s viscosity and density have been reduced, which made the fuel leaner and resulted in rapid combustion.
A comprehensive review of the literature on the impact of biodiesel and alcohols on diesel engines is presented, considering the following articles. Nanthagopal et al. [13] investigated the effect of ternary blend of Calophyllum inophyllum biodiesel, decanol and diesel on four-stroke single-cylinder diesel engines. Decanol content was varied in the percentages by volume, that is, 10%, 15%, 20%, 30% and 40%. D50B10DE40 was found to be the optimal blend, having 40% decanol by volume. Brake-specific fuel consumption was found to be the lowest for this blend and HC, CO emissions and smoke opacity were found to be lowest for the 40% decanol blend; NOx showed an increase for this blend. In-cylinder pressure was found to increase for the decanol blend. The ignition delay period was reduced due to the use of decanol because of the presence of inherent oxygen. Brake thermal efficiency (BET) was found to increase with the increase in hexanol content. Ashok et al. [14] studied the effect of hexanol and decanol as a ternary blend of Calophyllum inophyllum biodiesel and diesel. Totals of 30, 40 and 50% proportion of hexanol and decanol were used in a ternary blend and compared with diesel, 100% biodiesel and 50% binary biodiesel blends. Specific fuel consumption was found to decrease with an increase in alcohol content; hydrocarbon, smoke and carbon monoxide emissions decreased with the addition of alcohols compared to a binary blend of biodiesel and diesel and NOx emission was also reduced. Due to lower viscosity and higher calorific value of ternary blends has increased the brake thermal efficiency. Specific fuel consumption was lower for decanol blend compared to hexanol blend because of higher carbon content. The heat release rate was higher for decanol blend than hexanol but lower than diesel. A total of 40% decanol was found to be optimum. Nanthagopal et al. [15] investigated the effect of N-pentanol and N-octanol with Calophyllum inophyllum biodiesel as a blend for proportions by volume of 10, 20 and 30%. N-pentanol addition decreased the calorific value and kinematic viscosity. A binary blend of 30% octanol with biodiesel and 10% pentanol with biodiesel showed higher brake thermal efficiency when compared with the B100 blend; there was a decrease in HC, NOx and an increase in CO and smoke emissions. Tamilvanan et al. [16] investigated the effect of diethyl ether and ethanol, along with Calophyllum inophyllum biodiesel. Ternary blends were studied using biodiesel, diesel, diethyl ether and biodiesel, diesel and ethanol. These blends showed an increase in thermal efficiency and decrease in specific fuel consumption compared to binary blends of biodiesel and diesel. The ethanol blend showed lower NOx compared to the diethyl ether blend. The BET of the diethyl ether blend was found to be highest compared to other blends. Exergy efficiency was found to be higher for the diethyl ether blend. Tiwari et al. [17] studied the effect of Calophyllum inophyllum and Jojoba oil methyl ester with a N-pentanol as an additive on the turbocharged diesel engine. Following the engine, conditions were kept constant and the compression ratio was kept at 17.5:1, injection timing of 21° bTDC, injection pressure of 220 bar and speed of 1500 rpm. A ternary blend of 20% N-pentanol and 20% Calophyllum inophyllum biodiesel showed lower specific fuel consumption and lower HC, CO and NOx emissions. Wang et al. [18] investigated the effect of orange oil methyl ester (OME), ethanol and diethyl ether on a single-cylinder diesel engine. Ethanol and diethyl ether were used in volume 10% in the blends. Diethyl ether blend showed better brake thermal efficiency compared to ethanol blend. Additive blends showed higher CO compared to blend without additives. The slight reduction in NOx was found at higher loads for ethanol blends. The smoke reduction was found due to the use of additives. Yesilyurt et al. [19] investigated the performance and emission of four-stroke single-cylinder diesel engine for the blends of diesel–biodiesel (80–20%), diesel–biodiesel safflower vegetable oil (70–20–10%) and diesel–safflower biodiesel safflower vegetable oil-alcohol (60–20–10–10%) blends at different engine loads and a constant speed of 3000 rpm. The addition of pentanol showed an increase in in-cylinder pressure and a decrease in heat release rate. Quaternary fuel blends showed lower brake thermal efficiency. The addition of ethanol and iso-pentanol reduced the HC and NOx emissions. The heat release rate and ignition delay were reduced due to the addition of alcohols. N-butanol and iso-pentanol showed better performance overall. Razzaq et al. [5] studied the viscosity and density of ethanol–biodiesel blends and developed a model for model them for various biodiesels. Viscosity was found to decrease with the addition of ethanol to the biodiesel blends. Using these models’ viscosity, the density of the ternary blends can be found for the temperature range of 15 °C to 75 °C; the accuracy of the models decreased beyond 78 °C due to the evaporation of ethanol. Rangabashiam et al. [20] investigated the effect of neem DMC (Dimethyl carbonate) and Pentanol on a diesel-neem biodiesel blend. The NBD50D50, P10NBD45D45 and DMC10NBD45D45 blends were tested on the diesel engine. Pentanol and DMC blends containing 10% each by volume showed higher brake thermal efficiency and lower specific fuel consumption than a binary blend of biodiesel–diesel. The use of pentanol and DMC in neem oil biodiesel blend lowered the viscosity of the blend. The peak pressure showed an increase with the use of additives. Yesilyurt et al. [21] studied the effect of 1-heptanol on peanut oil biodiesel blends. Longer ignition delay due to lower cetane number was observed. Higher engine cylinder pressure and brake thermal efficiency was observed. Higher HC emissions were observed due to lower cetane number and poorer ignition characteristics. An increase in the specific fuel consumption and lower exhaust gas temperature were observed. Bawane et al. [22] investigated the effect of Calophyllum inophyllum biodiesel for different binary blends. Blends with biodiesel percentages of 25, 50 and 75 were studied for different compression ratios. The 25% biodiesel blend showed performance closer to diesel fuel at a compression ratio 16:1.
Thus, it is clear from the above literature review that the effects of different alcohols on the performance of diesel engines fueled with Calophyllum inophyllum are scarcely reported. Therefore, this experimental study describes the preparation and application of alcohol-blended biodiesel and emission analysis of this blended biodiesel. Moreover, comprehensive RSM optimization approach provides complete variation of the engine performance and the emission due to the variations in load and N-iso octanol and N-butanol as additives with different Percentages.

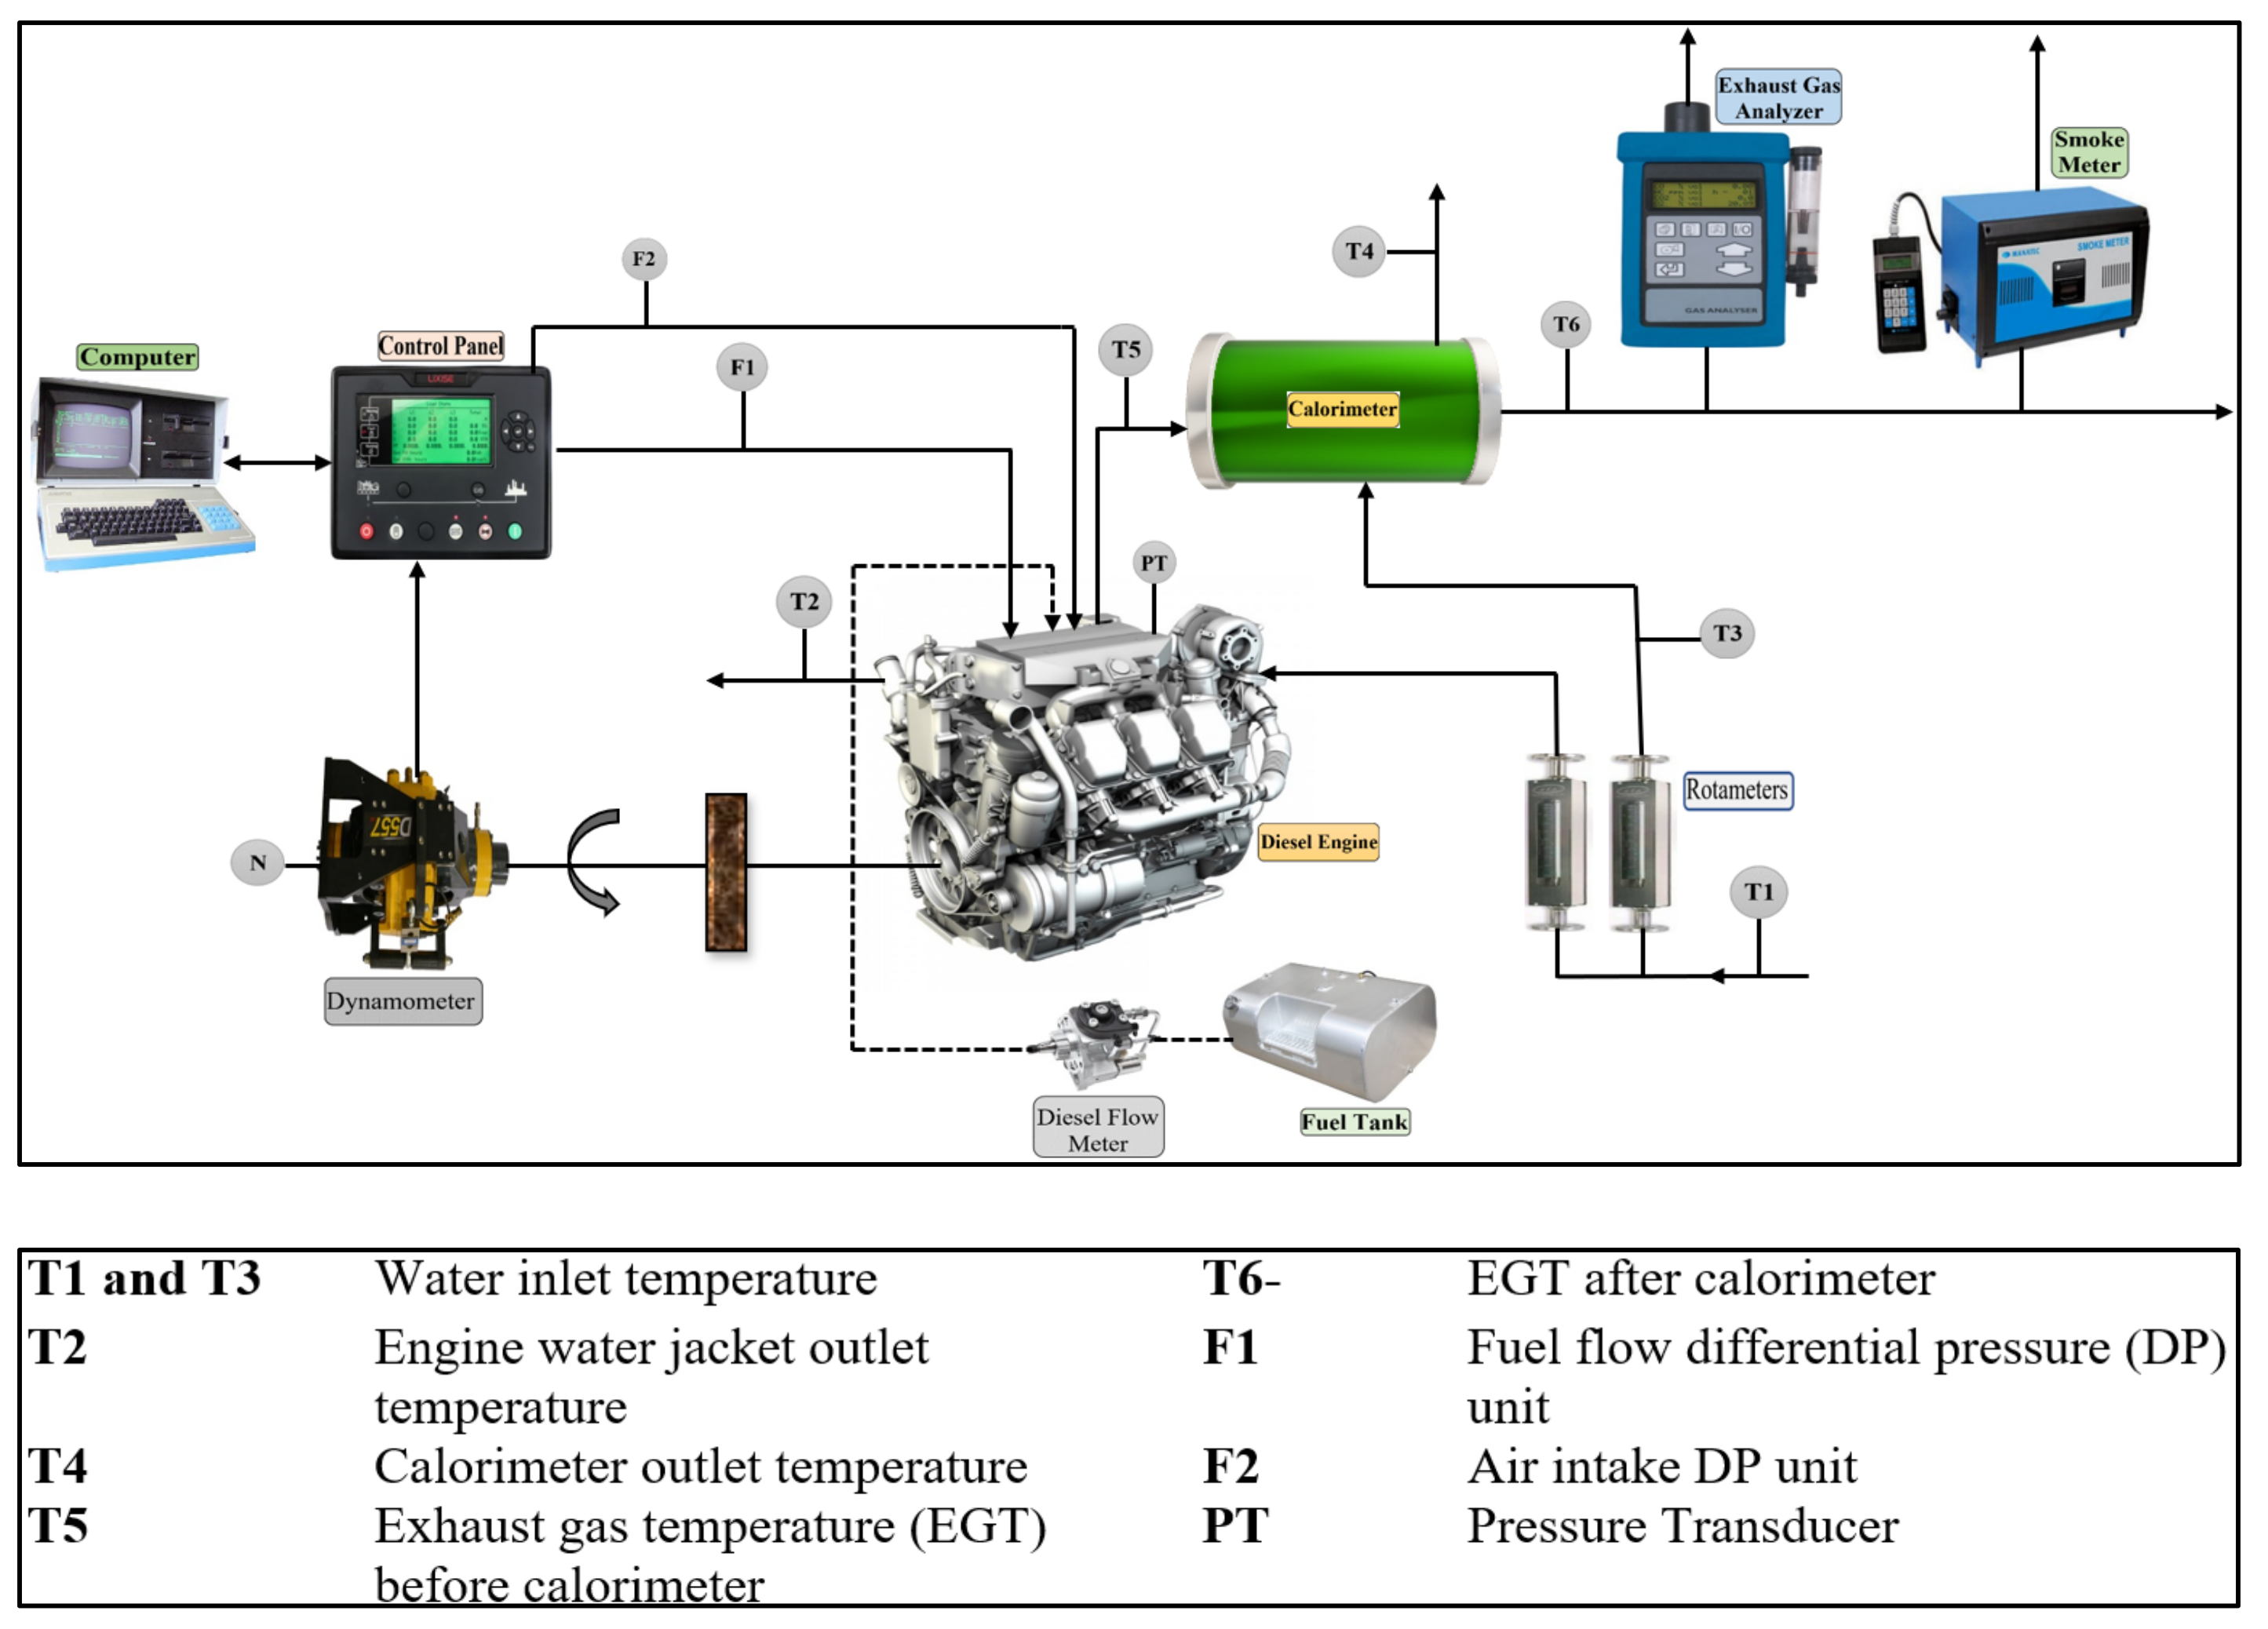
2. Materials and Methods

Calophyllum inophyllum biodiesel was purchased from Biofuel center, Hassan. The Biofuel center was established by the Karnataka government for promoting the use of alternative fuels and making rural area energy independent and their dependence on fossil fuels. This institute made biofuels a part of the agricultural center. Butanol and Octanol was purchased from chemical laboratories in Mangalore. Blending was conducted by using a mechanical stirrer in the first stage. Biodiesel, diesel and alcohols in the particular ratios were taken in a plastic cup. Then, a mechanical stirrer was placed in the plastic cup and then the mechanical stirrer. Continuous stirring was carried out for 10–15 min to obtain homogeneity of the blends. Blending of biodiesel, diesel and alcohols were carried out using a magnetic stirrer in the second stage. Magnetic stirrer of a 2000 mL capacity from the sunshine manufacturer was used. Magnetic stirring was used to maintain the homogeneity of blends and to avoid phase separation. Biodiesel, diesel and alcohol were taken in a 2000 mL flask in the required quantities and then a magnetic stirrer mixer stir bar was placed inside the flask. Using the knob of the magnetic stirrer, the rpm of the bar set inside the flask was controlled; it was adjusted to give a regular stirring. For 15 to 20 min, stirring was performed by using a magnetic stirrer.
The 20BD (biodiesel)+80D (diesel) binary blend was prepared by mixing 20% Calophyllum inophyllum methyl ester and 80% diesel (v/v). 20BD+5A+75D ternary blend was prepared by mixing 20% Calophyllum inophyllum methyl ester, 5% Butanol and 75% diesel (v/v). The 20BD+10A+70D ternary blend was prepared by mixing 20% Calophyllum inophyllum methyl ester, 10% Butanol and 70% diesel (v/v). 20BD+5O+75D ternary blend was prepared by mixing 20% Calophyllum inophyllum methyl ester, 5% octanol and 75% diesel (v/v). 20BD+10O+75D ternary blend was prepared by mixing 20% Calophyllum inophyllum methyl ester, 10% octanol and 75% diesel (v/v). All the above blends were prepared by volume ratios.
Engine performance and emission testing were done by using a single-cylinder, four-stroke water-cooled diesel engine. Table 1 shows engine specifications; it is a computerized engine with a data acquisition system for collecting data from the sensors in the machine. A water-cooled Eddy current dynamometer was used for applying and measuring the load on the engine. An air tank with orifice plates is used to measure the actual volume of air drawn into the cylinder. The crank angle sensor of Kubler-Germany was used to measure the crank angle position and 1° is the resolution of the sensor. To avoid cycle-to-cycle variations while measuring combustion parameters, average data of 10 cycles was used. For all combustion parameters, standard procedures using the sensors and actuators readings are captured.
Thermocouples used were of k- type for the measurement of temperature. The solenoid valve controls the amount of fuel injection in the injector. Open ECU is used to control the various parameters of the engine. NIRA i7r was the ECU used for the research work. For measuring in-cylinder pressure, a PCB piezotronics pressure sensor was used. To measure the speed of the engine, a rotary encoder was used and a digital indicator was used to this speed in rpm. Engine speed is 1500 rpm as it is a constant speed engine. All the parameters have been varied at this constant speed. Readings in the engine are taken after the lubricating oil and water for cooling reach a steady temperature. Stopwatch and burette are used to measure the amount of fuel consumption by the engine. The fuel tank is connected to the burette. The computer connected to the engine is switched on and then the cooling water knob of the engine and calorimeter is set to a flow rate of 150 LPM and 75 LPM. Before starting the engine, the load should be placed to no-load conditions. After starting, the engine rpm of the engine is observed and it kept running at no-load conditions for 20 min and rpm will reach 1500 rpm. The air–fuel ratio is calculated based on a small experimental procedure followed in the energy engineering laboratory. The airflow measurement setup consists of an airbox and manometer. The manometer head difference is taken for each load condition and then the airflow rate is calculated. Fuel flow rate is measured by using stopwatch and burette. The air to fuel ratio is then calculated using air flow rate and fuel flow rate for various load conditions. A stopwatch is used to measure time for 20 cc fuel consumption. For each load, 6 readings are taken and the average of these values is taken. Then, the load is increased to 3 kg, 6 kg, 9 kg and 12 kg and reading is taken. Figure 1 illustrates the schematic diagram of a diesel engine.
In Table 2, the engine load applied for the analysis is shown. The equivalent torque and brake power are also mentioned for reference. The load mentioned in the graphs corresponds to the torque and brake power developed by the engine for an Eddy current dynamometer. Readers are encouraged to refer to Table 1 to find the variations of engine characteristics concerning torque or brake power.

2.1. Chemical Properties of Calophyllum inophyllum

In Table 3, the properties of Calophyllum inophyllum oil can be observed. The properties are not suitable for direct use in diesel until it is converted into biodiesel by the transesterification process. Flash and fire point, density and kinematic viscosity of Calophyllum inophyllum are very high. The calorific value is lower compared to diesel.

2.2. N-octanol

In Table 4, N-octanol having higher carbon content in its molecules compared to iso-butanol can be observed. N-octanol has higher density and molecular weight compared to N-butanol. It is a colorless liquid. It has a low boiling point.

2.3. N-butanol

From Table 5, it can be observed that N-butanol has less carbon content than N-octanol but higher carbon content than methanol and ethanol. The density of butanol is less. The viscosity of N-butanol is high. The biodiesel blend composition mixed with alcohols is mentioned in Table 6 for the sake of clarity. In Table 7, the properties of blends prepared are mentioned. An increase in the percentage of N-butanol and N-octanol has increased the kinematic viscosity of the blend. There is a decrease in calorific value and an increase in flash point and fire point of blend with the increase in N-butanol and N-octanol content in the blend [24]. BD20D80 has the highest calorific value among the blends. BD20A10N10D60 has got the lowest calorific value among the blends because of both N-butanol and iso-octanol, which includes 20% of the blend as their calorific values are low. Hence, it reduced the overall calorific value of the blend. BD20A10N10D60 was found to have the highest viscosity amount of the blends used. BD20D80 has the lowest viscosity among the blends used. The addition of iso-octanol caused a more significant increase in viscosity of the blend compared to the addition N-butanol. The decrease in calorific value of the blend due to the addition of iso-octanol was less than the addition of N-butanol. Nanthagopal K et al. [20] illustrated that use of N-pentanol addition decreased the calorific value and kinematic viscosity of Calophyllum inophyllum biodiesel when the biodiesel blend was increased from 10, 20 and 30%. Similarly, in this work, the calorific value reduced with alcohol the viscosity increased.

2.4. Uncertainty Analysis+

Uncertainties arise due to the errors during taking readings at different temperatures, humidity, wind, inaccurate calibration of devices and several operating conditions [25,26]. It is a difference between the observed value and actual value. Uncertainty is a variable value and an error may take over a range for uncertainty. It gives a histogram of values over a wide range. It will peak at a point and decrease at other ends. To examine an experimental procedure and find the potential source of errors and improve the instruments and procedures. To find areas in the procedure where specific improvement is required and accuracy at a low cost, uncertainty is needed for determining the accuracy of the instrument. Table 8 illustrates the uncertainty and accuracy levels of performance and emission parameters.

3. Results

3.1. Performance Test Results for Diesel & Different Biodiesel Blends

Standard Error
S . E . = s = 1 m i = 1 n y i s 2 ( n y 1 )   n y
where
  • s = series number
  • i = number in series s
  • m = points y in the chart
  • n = point number in each series
  • yis = numbers value of series ‘s’ and the ith point
  • ny = Actual number of data values in all series

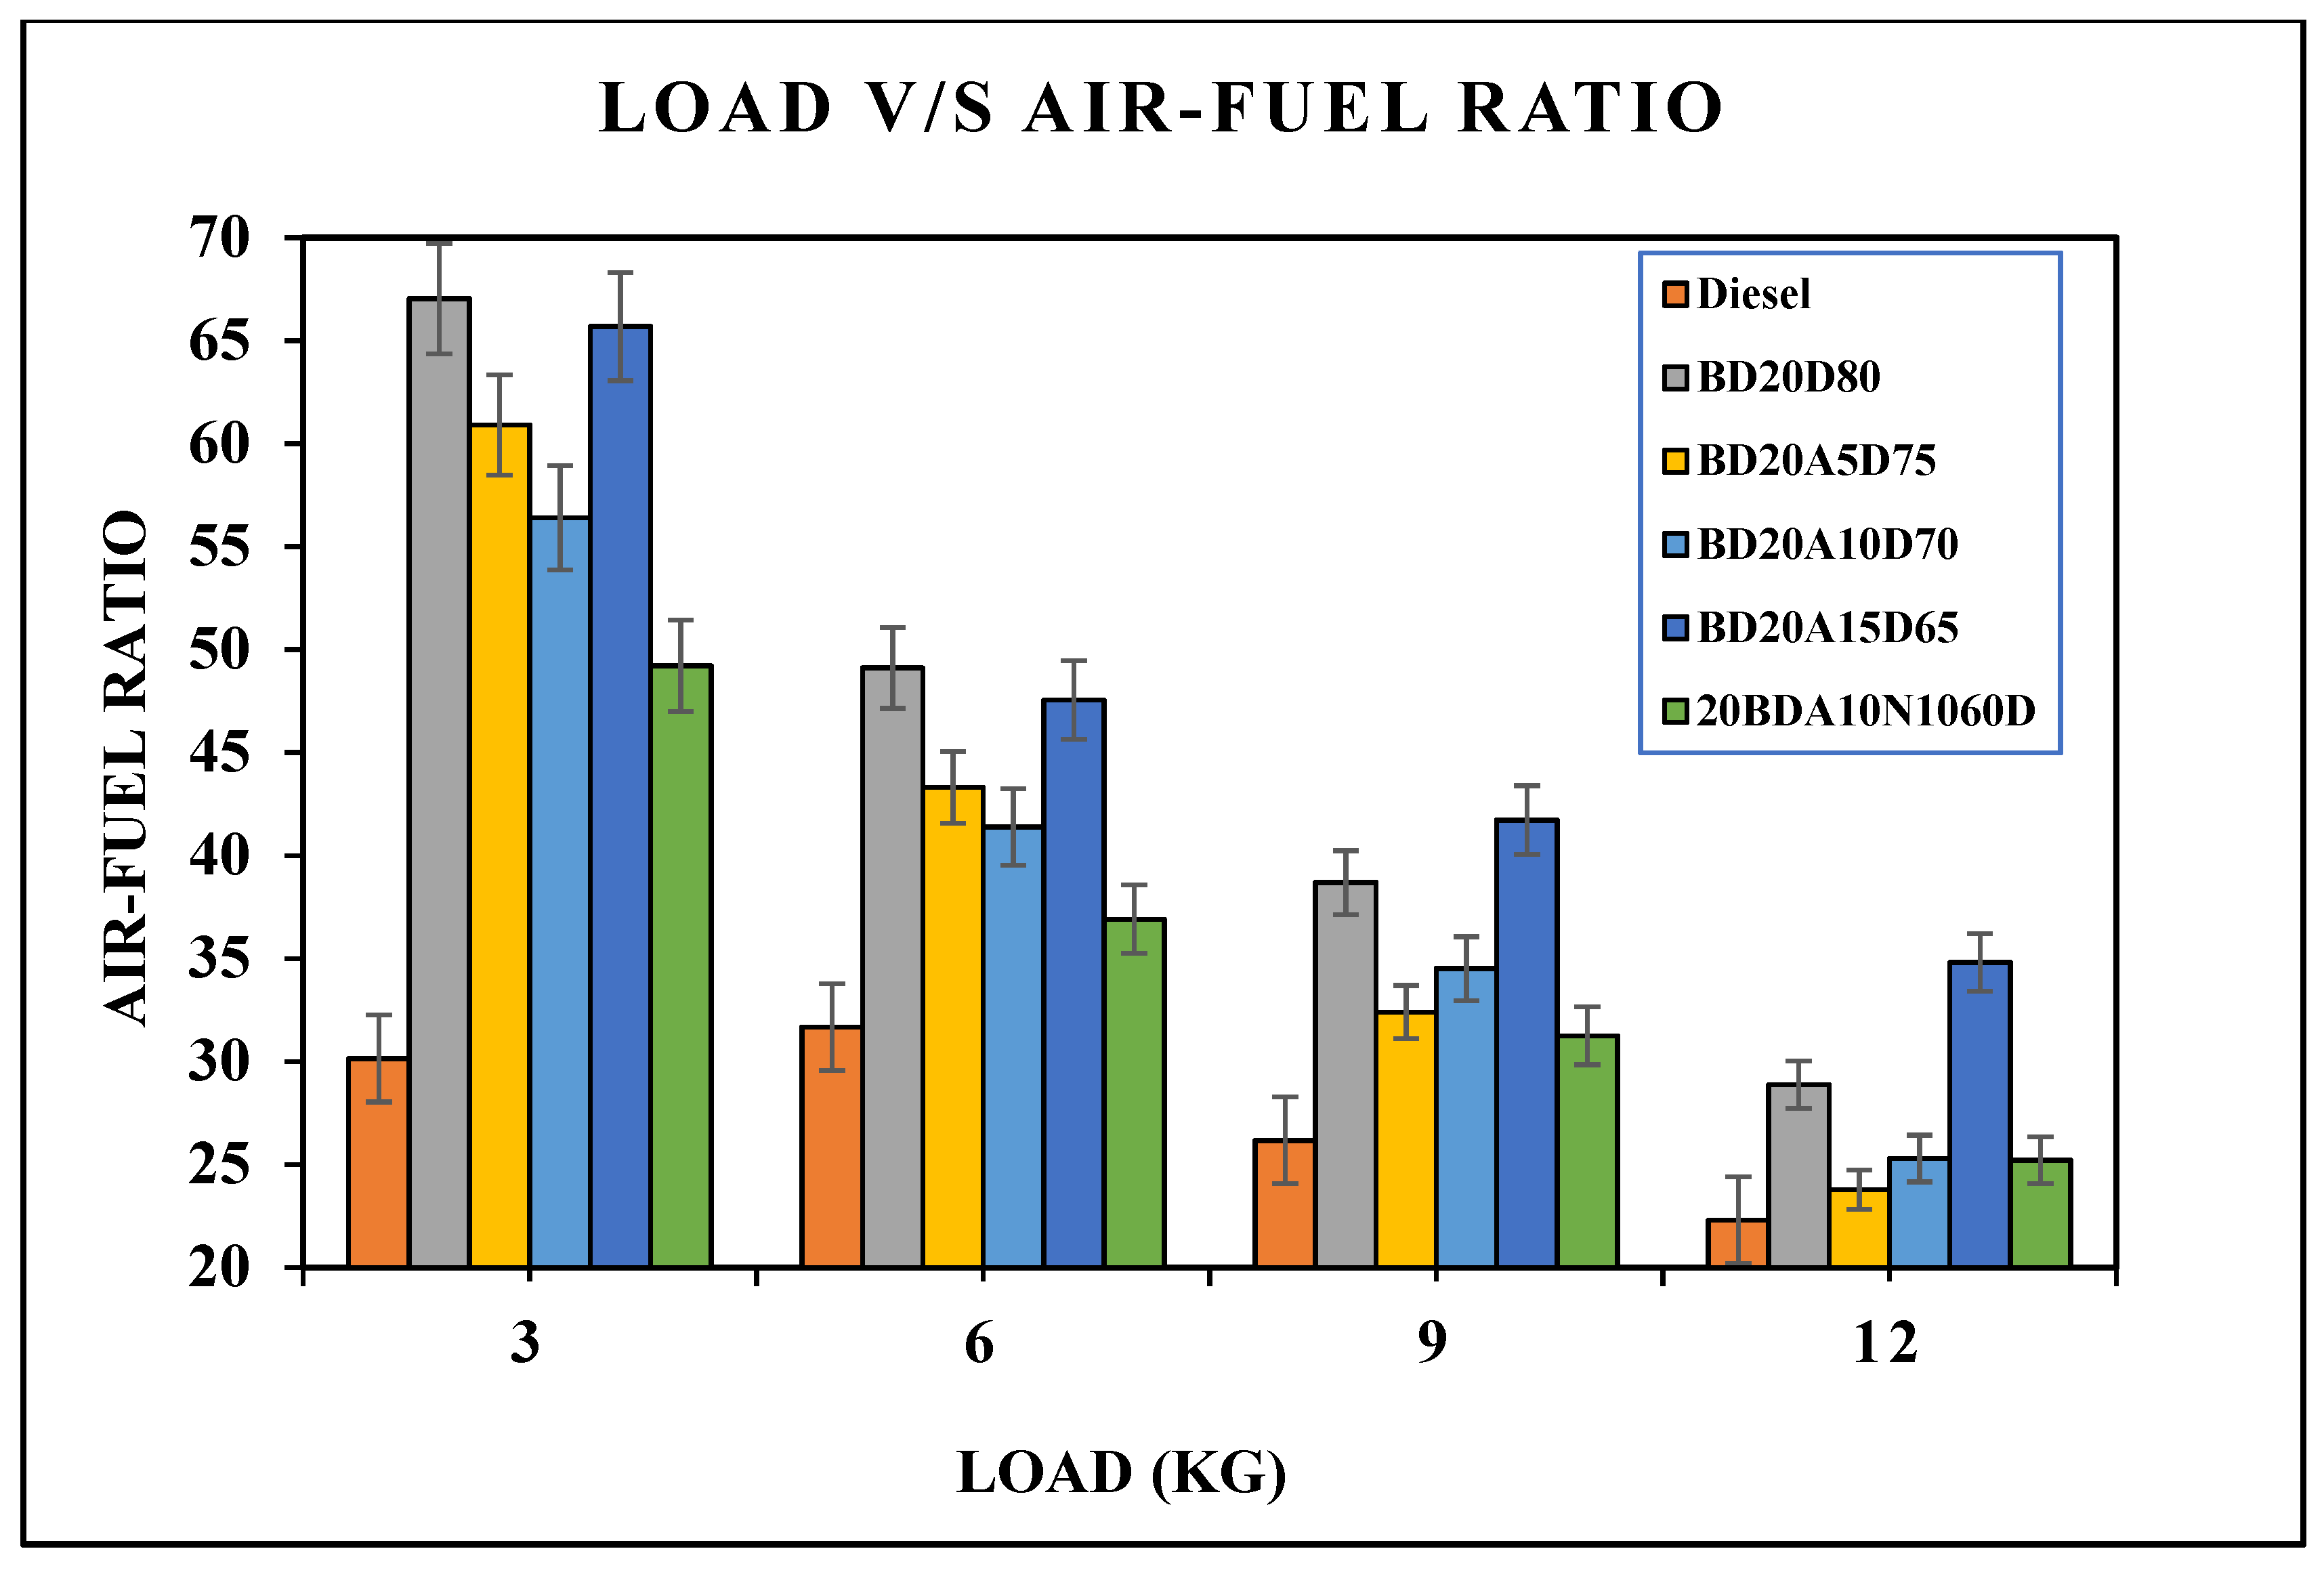
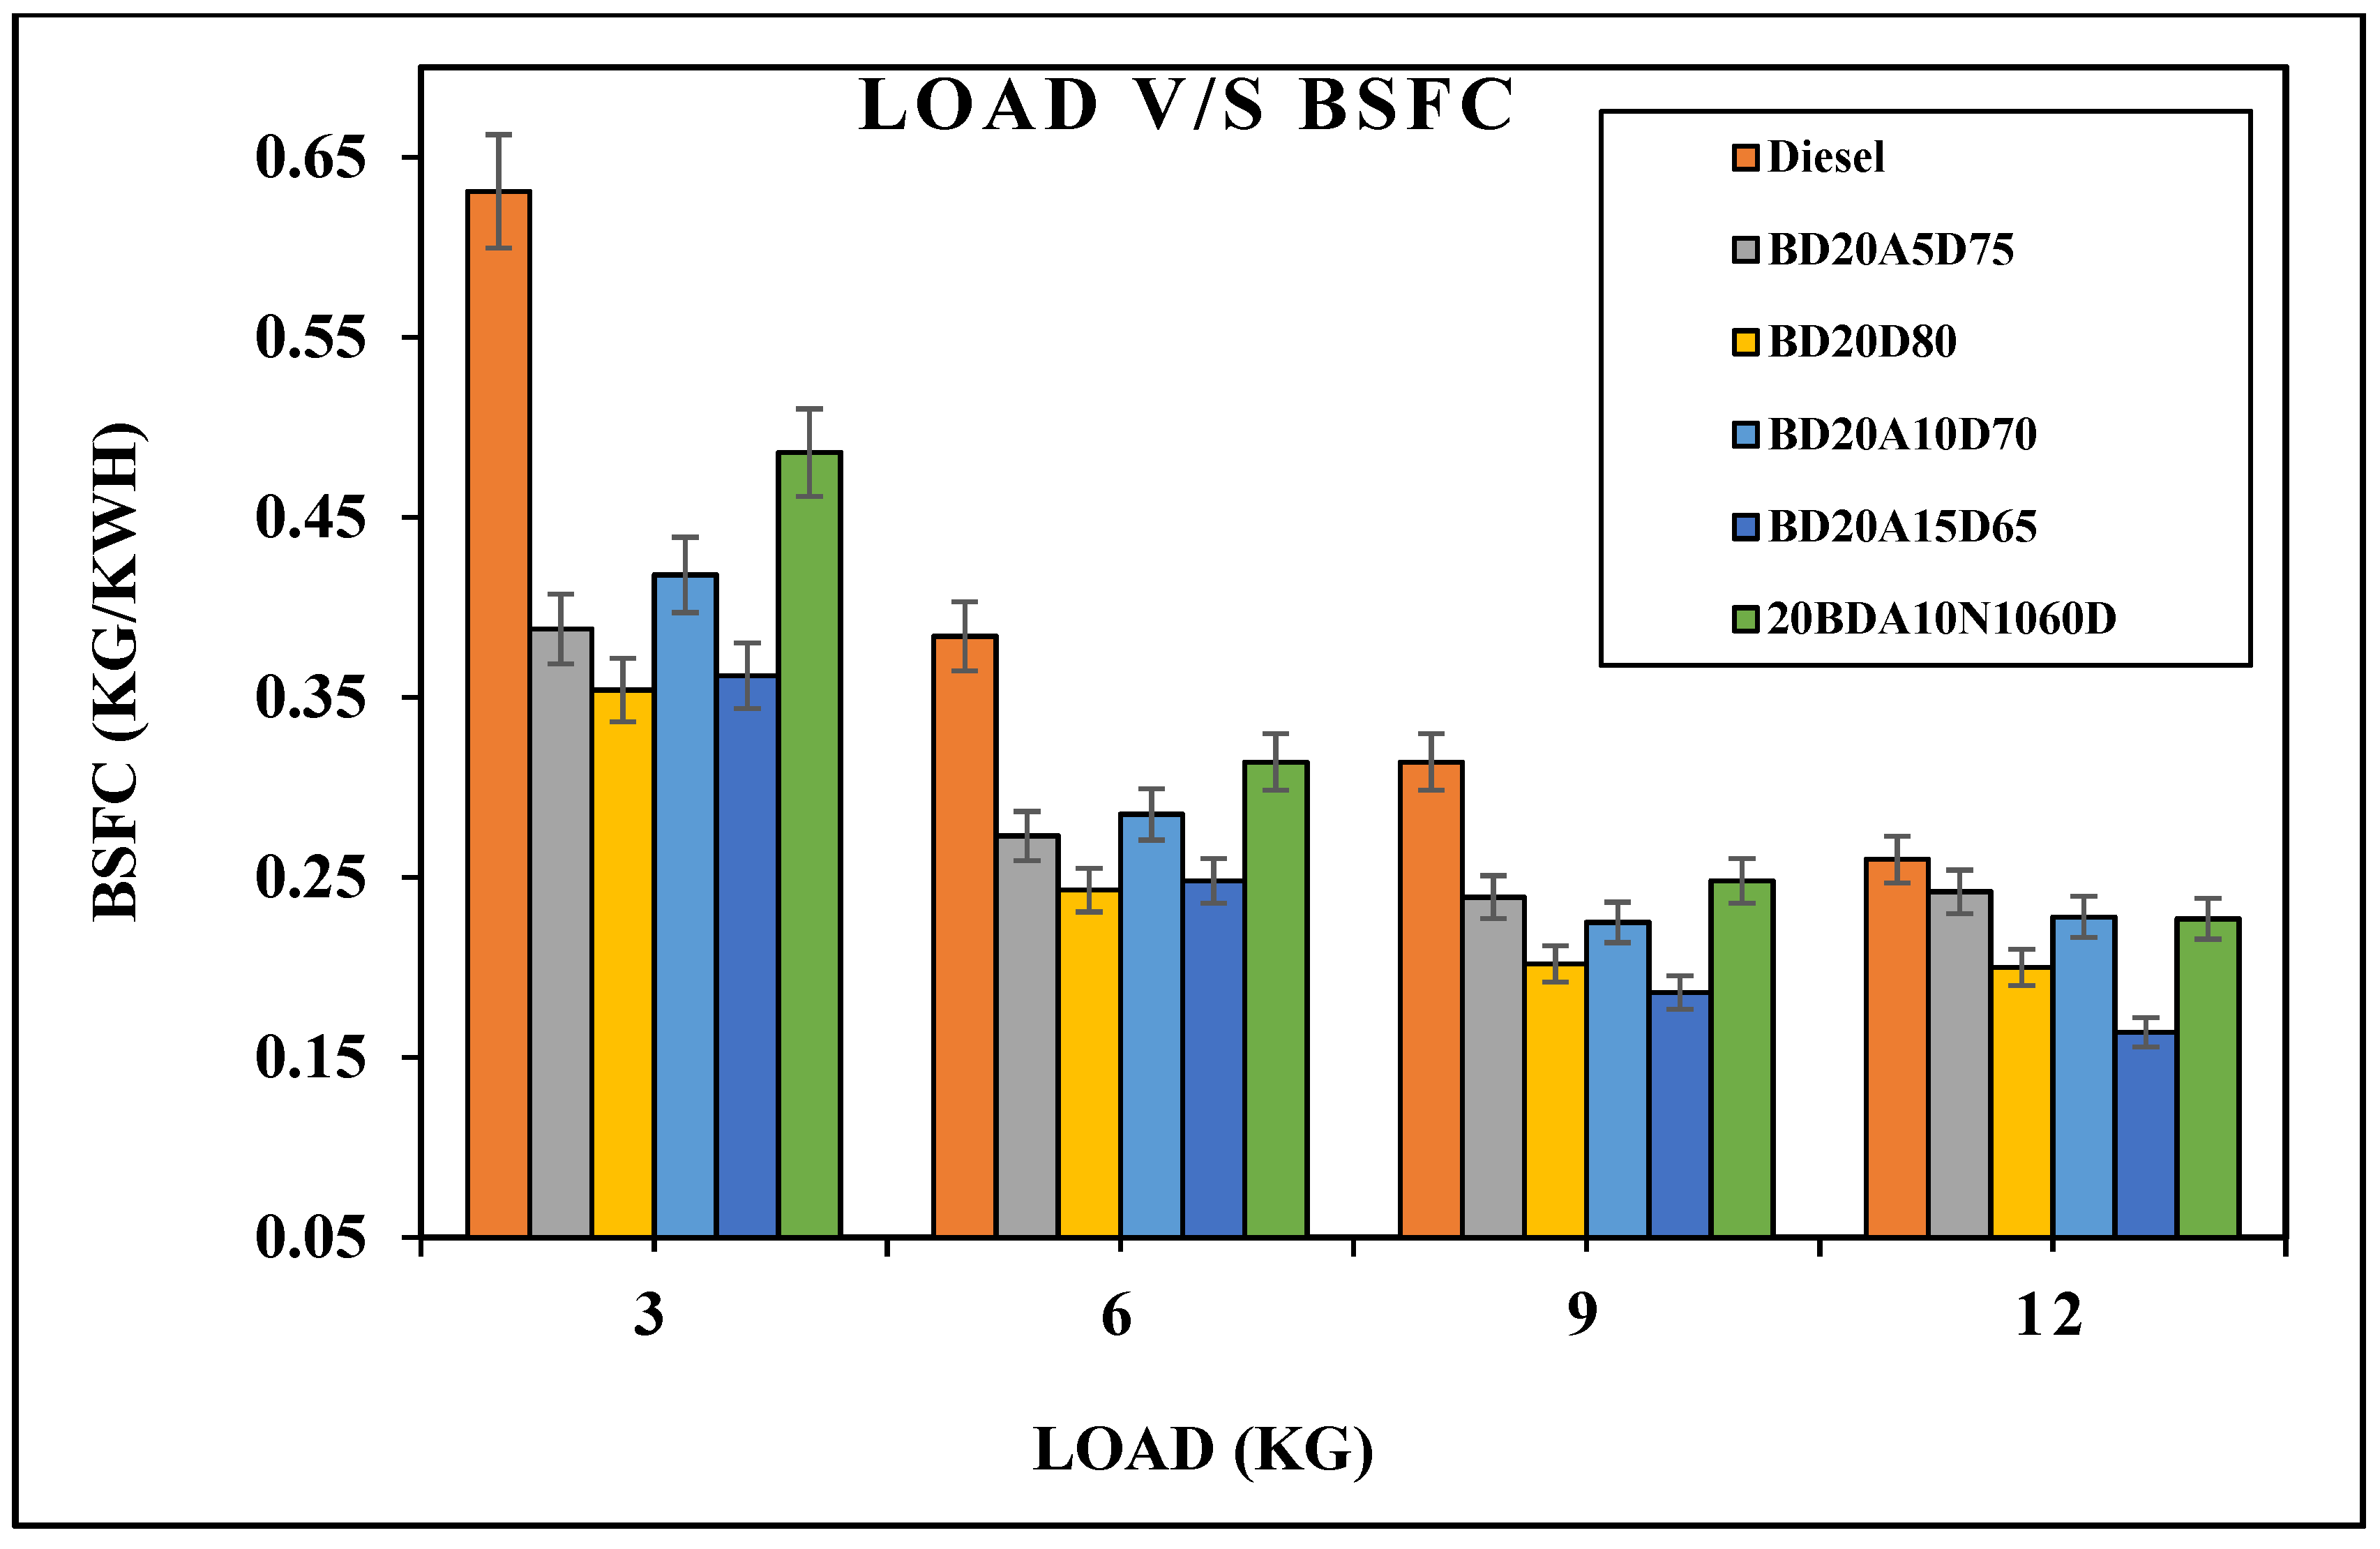
3.1.1. N-octanol Blends

All the results were obtained for different fuel blends by maintaining the engine speed at 1500 rpm, injection pressure at 500 bar and the main injection angle of 23° bTDC. In Figure 2, it can be seen that there is a decrease in air–fuel ratio with an increase in load. Diesel used less air–fuel ratio while BD20 blend required a higher air–fuel ratio. An increase in the octanol content increased the air–fuel ratio because of the cooling effect of the octanol that increased the volumetric efficiency, which led to the induction a larger quantity of air compared to other blends without octanol. Latent heat of vaporization of octanol decreases the combustion chamber temperature further, increasing the amount of air induction; this can be observed clearly at higher load conditions [5,24,25]. The blend with a mixture of 10 percent octanol and butanol each showed the lowest air–fuel ratio. BD20A15D65 showed the highest air–fuel ratio. BD20D80 showed a similar air–fuel ratio as BD20A15D65, only at higher loads BD20D80 showed the second-highest air–fuel ratio. BD20A5D75 showed the third-highest air–fuel ratio among the blends at lower load conditions, but was found to be lowest among the blends at higher loads. BD20A10D70 showed the fourth highest air–fuel ratio at lower load conditions, but at higher load conditions, its air–fuel ratio increased to become the third-highest among the blends. BD20A10N10D60 showed the lowest air–fuel ratio among the blends at lower load conditions, but it was found to have the third-highest air–fuel ratio at higher load conditions.
From Figure 3, it was observed that an increase in load decreases the brake-specific fuel consumption. BD20 blend without any additive showed the lowest brake specific fuel consumption (BSFC) because of its higher calorific value and lower viscosity than others. BD20 blend without additives has lower viscosity than other blends, which causes better atomization and efficient combustion in the combustion chamber [27]. BD20A10N10D60 showed the highest BSFC among the blends because of its lowest calorific value and also due to its higher viscosity. Due to the high viscosity of BD20A10N10D60, the fuel atomization is not proper; combustion of fuel in the combustion chamber is incomplete. Hence, more fuel is required for developing per kW of power. Diesel showed the highest BSFC [14,27]. Because of the presence of alcohols which are oxygenated fuels, the specific fuel consumption of blends was lower compared to diesel fuel, which is the sign of complete combustion [28].
BD20A10N10D60 showed the first highest BSFC among the blends because of its lower calorific value and higher viscosity which causes inefficient combustion of fuel. BD20A10D70 showed the second-highest BSFC among the blends compared because of its lower calorific value. BD20A5D75 showed the third-highest calorific value at lower loads and the trend was similar to BD20A10D70 at higher load conditions. BD20A15D65 and BD20D80 showed a similar trend at lower load conditions but at higher load conditions. BD20A15D65 showed the lowest BSFC among the blends because of its higher viscosity.
Belagur et al. [8], the use of octanol of 5%,10% and 15% along with carbon nanotubes as additives in B20, B40, B60 and B100 blends of cottonseed oil bio-diesel is available. B20 with octanol showed lower brake-specific fuel consumption. Here, the BD20 with blend 10% N-octanol has also demonstrated a lower brake-specific fuel consumption.
In Figure 4, it can be observed that an increase in load showed a rise in thermal brake efficiency. BD20 blend without any additive showed the lowest BTE. An increase in the octanol content in the blend showed an increase in BTE. An increase in octanol content increased the oxygen content in the blend. Because of this, there was complete combustion. A blend containing both octanol and butanol showed the highest BTE because of its higher oxygen content and complete combustion. Diesel showed the highest BTE because of its higher calorific value, lower viscosity, flash point and fire point. Among the blends, BD20A10N10D60 showed the highest BTE because of higher alcohol content, which increased the oxygen content causing complete combustion of fuel. Higher viscosity reduced the friction [19,26,28]. BD20A15D65 showed the highest BTE among the blends because of its higher iso-octanol content of 15% in the blend, increasing the oxygen content and causing complete combustion of fuel. BD20A10D70 showed the third-highest BTE among the blends. There was a significant difference between the trend line of BD20A10D70 and B20A15D65 because of the substantial difference of calorific value. BD20A5D75 showed the fourth highest BTE among the blends and a lower difference between BD20A5D75 and BD20A10D70 because of the lower difference of calorific value and viscosity [7]. BD20D80 showed the lowest BTE among the blends because of the absence of alcohols in the blends as the presence of alcohols increased the oxygen content, hence causing complete combustion of fuel [29,30].
In Figure 5, it can be observed that there was an increase in carbon dioxide with the increase in load. The presence of carbon dioxide in emissions is a sign of complete combustion. Carbon dioxide emission increased because of octanol and butanol addition because of the inherent oxygen content present. BD20A5D75 showed the highest CO2 among the blends. BD20A10D70 and BD20A15D65 showed similar CO2 emissions among the blends. BD20D80 showed the third-highest emissions among the blends. BD20A10N10D60 showed the lowest emission among the blends compared because the higher alcohol content increased the oxygen content causing complete combustion of fuel [30].
In Figure 6, it can be observed that an increase in load showed an increase in carbon monoxide emission. Blend with both octanol and butanol showed the lowest CO emissions among the blends. At higher load conditions, BD20D80 and BD20A15D65 showed the highest CO emissions among the blends. BD20A5D75 showed the third-highest emission among the blends at higher load conditions. BD20A10D70 showed the fourth highest CO emission among the blends. BD20A10N10D60 showed the lowest emission among the blends used because of its highest alcohol content, which allowed complete fuel combustion [31,32,33].
In Figure 7, it can be observed that an increase in load showed a rise in hydrocarbon. Hydrocarbon emission was observed to be highest for blends containing both octanol and butanol. Hydrocarbon emissions showed a decrease with decrease in octanol content. Hydrocarbon emission was lowest for the blend with 5% octanol content. BD20A10N10D70 showed the highest hydrocarbon emission among the blends. BD20A15D65 showed the second-highest hydrocarbon emission among the blends. BD20D80 showed the third-highest hydrocarbon emission. BD20A10D70 showed the fourth highest hydrocarbon emission among the blends. BD20A5D75 showed the lowest hydrocarbon emission among the blends because of its lowest viscosity. Hydrocarbon emissions in the blends can be correlated with the viscosity of the blends. An increase in viscosity of the blends was observed to increase the hydrocarbon emissions. Diesel showed the lowest hydrocarbon emission because of its lower viscosity [23,34].
Nanthagopal et al. [20] have reported that 30% octanol to the biodiesel and 10% pentanol improved the engine thermal efficiency. However, there was a decrease in emission from the engine with the alcohol addition. In the present study, the addition of N-octanol has initially reduced the emission while the thermal efficiency decreased significantly. The combined N-octanol and N-butanol also showed undesirable effects on engine performance.

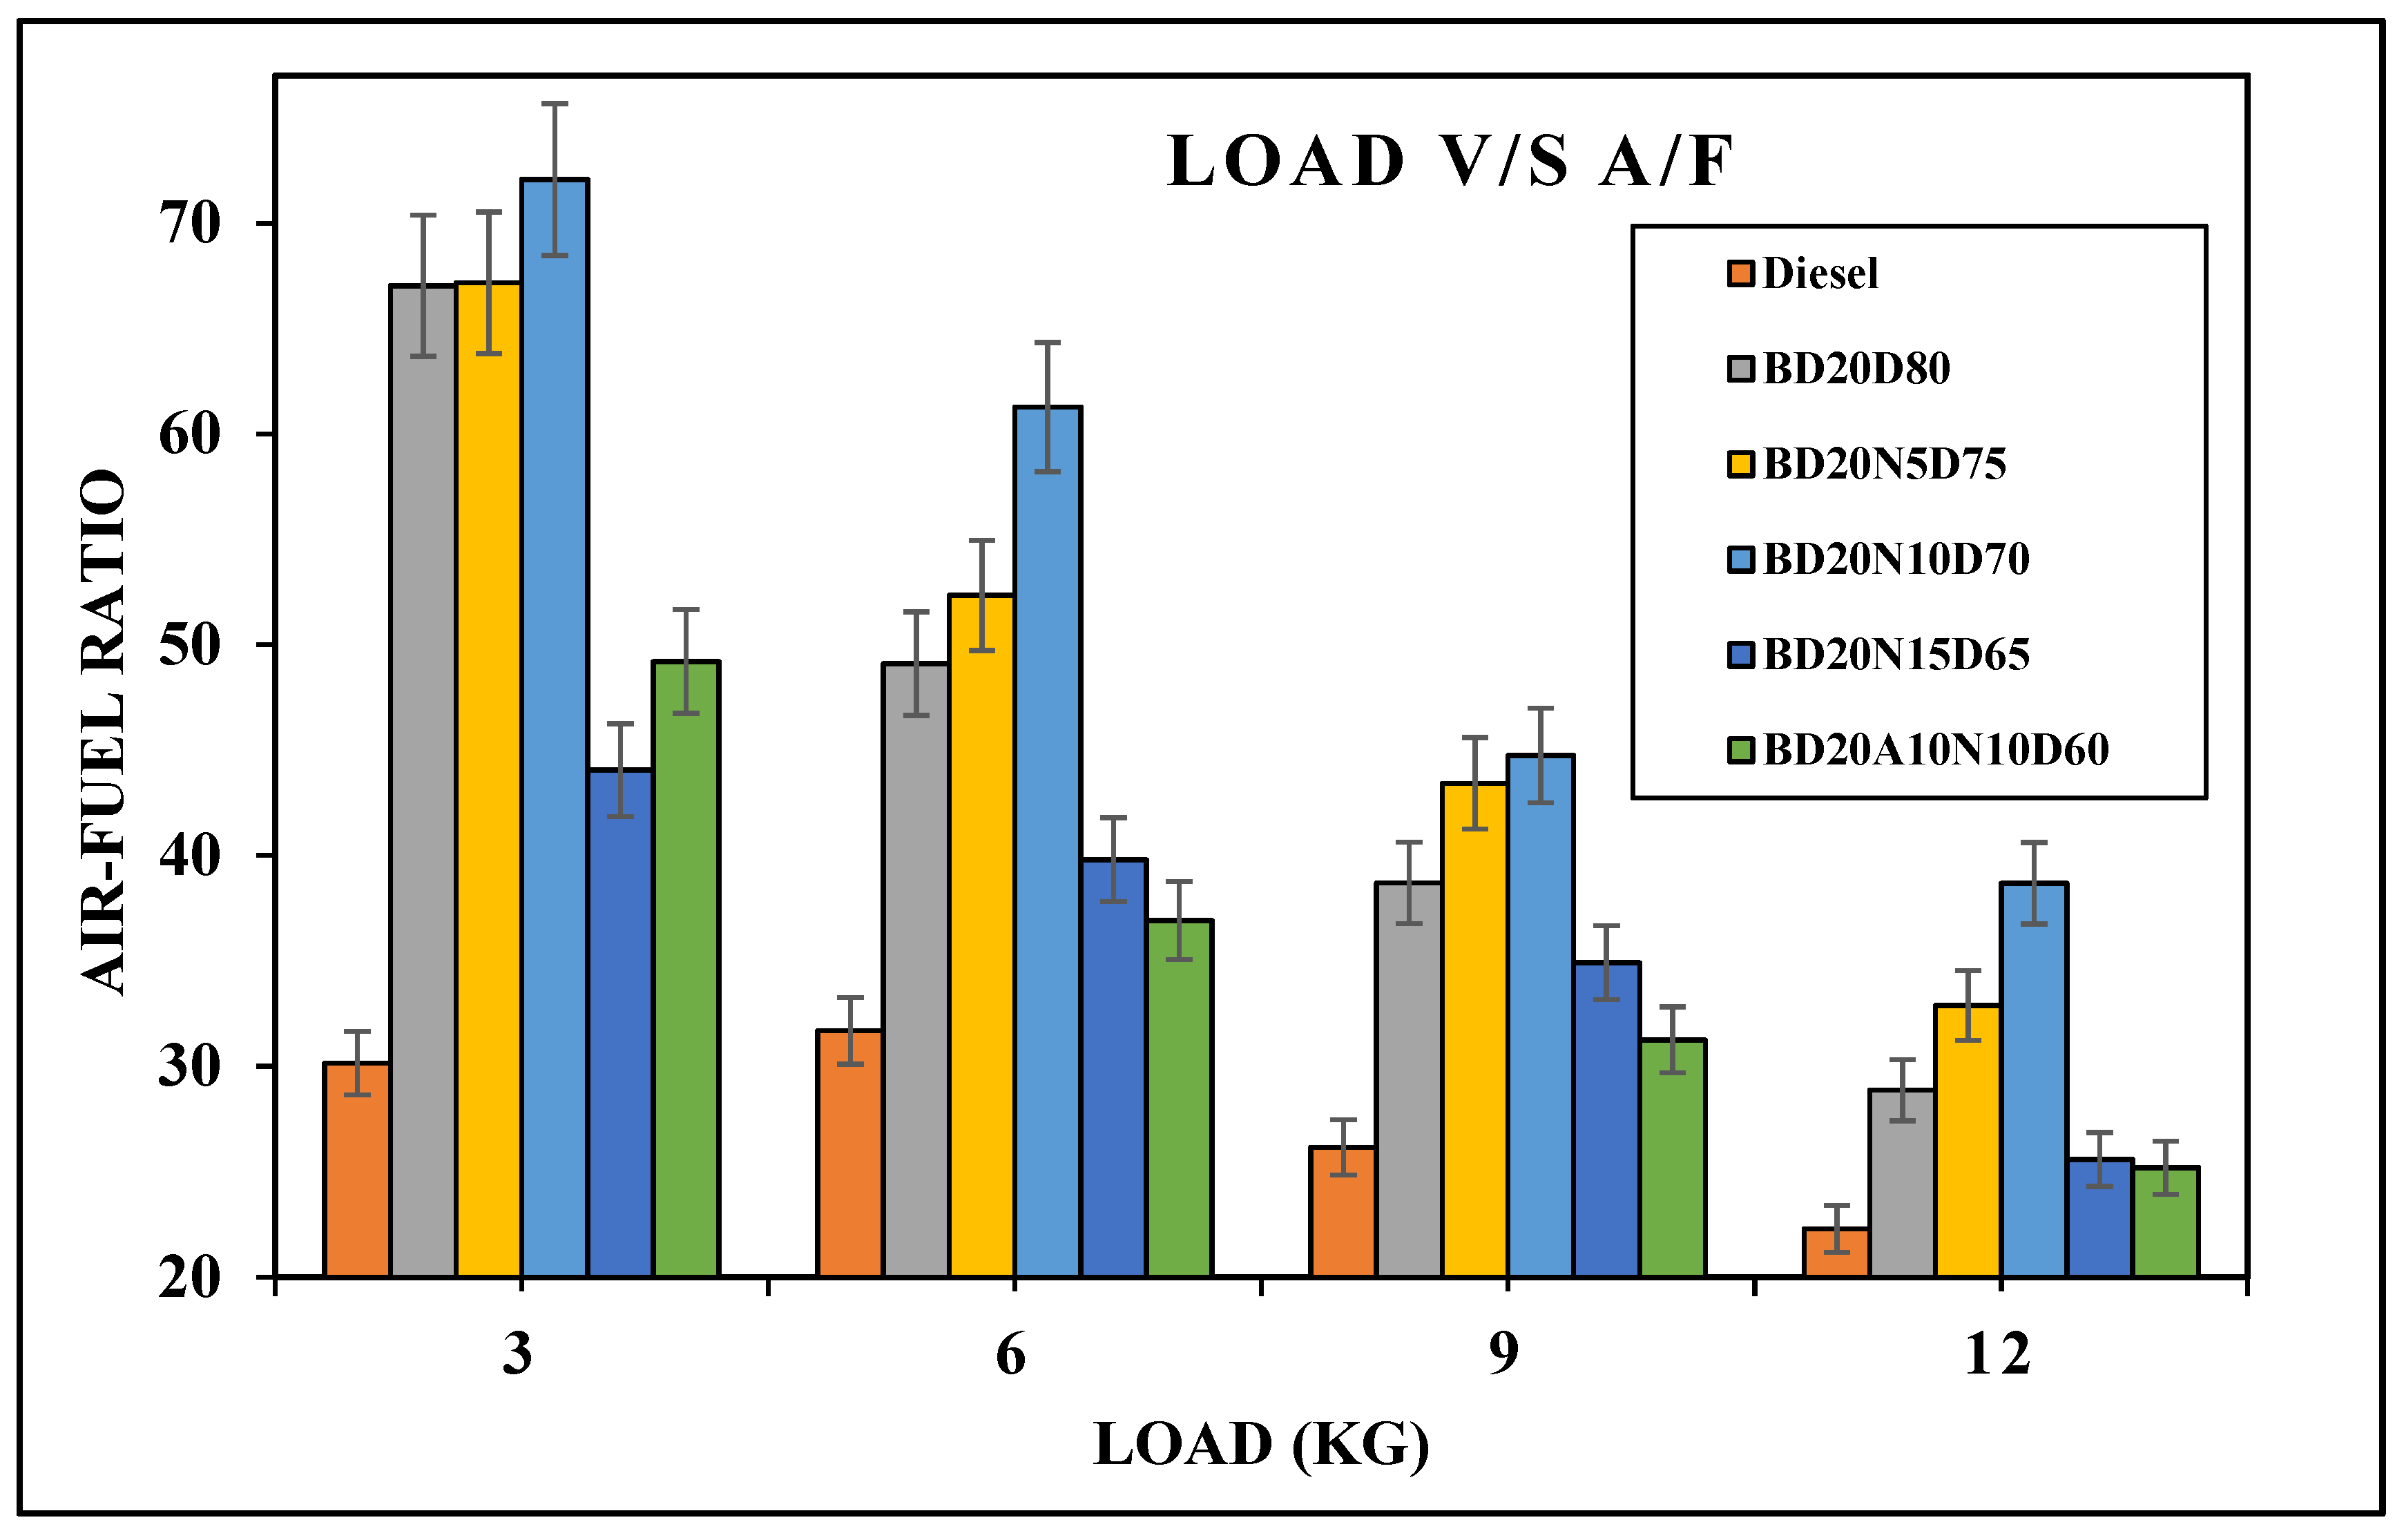
3.1.2. N-butanol Blends

In Figure 8, it can be observed that an increase in load showed a decrease in the air–fuel ratio. The blend with 10% butanol showed the highest air–fuel ratio. Diesel showed the lowest air–fuel ratio. BD20N15D65 and BD20A10N10D60 showed the lowest air–fuel ratio among the blends. The presence of butanol in the blend increased the air fuel because of latent heat of vaporization of butanol [35]. The cooling effect caused by the vaporization of butanol increased the amount of air inducted into the cylinder [36]. BD20N10D70 showed the highest air–fuel ratio among the blends. BD20A5D75 showed the second-highest air–fuel ratio. BD20D80 showed the second-highest air–fuel ratio. BD20N15D65 and BD20A10N10D60 showed a similar trend of air–fuel ratio because of their similar physicochemical properties. Diesel has the lowest air–fuel ratio.
In Figure 9, it can be observed that an increase in load showed a decrease in BSFC. BSFC of the blends showed an increase with the increase in the butanol content of the blends [37]. BD20N15D65 and BD20A10N10D60 showed the highest among the blends because of their lower calorific values and higher viscosities. BD20ND80, BD20N5D75 and BD20N10D70 showed lower BSFC among the blends because of their higher calorific value and lower viscosities consuming less fuel per kWh. Diesel has the highest BSFC. At lower load conditions, BD20N10D70 showed the lowest BSFC among the blends. At higher load conditions, BD20D80, BD20N5D75 and BD20N15D65 showed a similar trend of BSFC. The addition of butanol has increased the burning rate and its effect can be found at 12 kg load conditions. An increase in butanol content from 5% to 10% showed lower specific fuel consumption due to an increase in burning rate and presence of oxygen [38,39].
In Figure 10, it can be observed that there was an increase in BTE with the increase in load. BD20A10N10D60 showed the highest BTE among the blends because of the oxygen content present in the blend, which allows complete combustion of fuel. The addition of butanol in the blends showed an increase in BTE. BD20D80 showed the lowest BTE because of the absence of alcohol in the blend, which reduced the oxygen content. At lower load conditions, BD20N10D70 showed the second-highest BTE among the blends. BD20N5D75 showed the third-lowest BTE among the blends compared at lower load conditions. BD20N15D65 showed fourth-highest BTE among the blends. BD20D80 showed the lowest BTE among the blends because of the absence of alcohols in the blend compared to other blends which contain alcohol, resulting in complete combustion of fuel.
In Figure 11, it can be seen that the BD20D80 blend showed the highest CO2 emission, which is an indication of complete combustion. BD20N15D65 showed the second-highest CO2 emission. There was a decrease in CO2 emission with the reduction of butanol content in the blend. Emission of BD20A10N10D60 was found to be in between BD20N5D75 and BD20N10D75. The emission of diesel was found to be the lowest.
In Figure 12, it can be observed that CO emission increased with an increase in load. BD20N5D75 and BD20D80 showed the highest carbon monoxide emission among the blends. An increase in the percentage of the butanol in blend caused a decrease in carbon monoxide emission. BD20A10N10D60 showed the lowest carbon monoxide emissions.
In Figure 13, it can be observed that there is the increase in hydrocarbon emission with the increase in load. BD20A10N10D60 showed the highest hydrocarbon emission among the blends. BD20N5D75 showed the lowest hydrocarbon emissions among the blends. Hydrocarbon emissions for BD20D80, BD20N5D75 and BD20N10D70 showed similar hydrocarbon emissions at higher loads. The inclusion of butanol increased the viscosity of biodiesel, which led to increase in the size of the droplets during fuel injection, causing incomplete combustion; hence, the release of hydrocarbon in the higher amount due to the rise in butanol content in the blends.
To summarize, Tiwari et al. [17] illustrated that using Jojoba oil and Calophyllum inophyllum and alcohol additive (N-pentanol) in diesel engine was studied. With stable operating conditions of the engine, the use of 20% Calophyllum inophyllum in diesel added with 20% N-pentanol reduced the brake-specific fuel consumption of the engine. The emission characters were enhanced with the alcohol addition. With the addition of alcohols to Calophyllum inophyllum biodiesel, the emissions increased at lower loads. At the highest load, the emission was comparable with pure diesel. Thermal efficiency reduced with the alcohol addition, which was not with the addition of N-pentanol to Calophyllum inophyllum.
In Table 9, a comparative analysis of the present work is shown with the previously published research works mentioned. In the current study, the B20 blend with 10% N-octanol alcohol in the entire work is considered for the comparison. The previous works chosen for comparison considered the B20 blend of biodiesel with their specific alcohol at 10% and full load operation. The percentage increase or decrease stated is with diesel as the fuel in all the studies compared.

4. Response Surface Methodology (RSM) Optimization Method

RSM is one of the effective optimizing methods of experimental design tools. At the same time, RSM can explain the numerous variables through the least possible resources, quantitative data and a suitable test design on each and every time of the response variable affected by the many variables and factors [45]. The RSM is utilized to find the parameter effect and the interaction between various parameters. The RSM analysis was selected for this study to investigate the influence of the two effective parameters load and percentage of alcohol variations on thermal efficiency and emission from the engine.
These selected parameters are set to a different level, such as load at four levels and alcohol percentage at 4 levels. The statistical model table based on all possible combinations of parameters and their level is considered. As per the experimental approach, the circumstances of the 2400 runs are first investigated, which is based on all the points and then the experiments are randomized. The level of each parameter is directly enumerated with original values and considered a level that starts from minimum to maximum. Generally, RSM defines each dependent variable from the main effect and interaction effects of the factors on each level distinctly. The multivariate model is given as follows:
Y = β 0 + i = 1 3 β i X i + i = 1 3 β i i X i X i + i = 1 3 β i j X i X j + i = 1 3 β i j k X i X j X k
where
  • β 0 = intercept
  • β i = linear regression coefficient of ith factor (linear)
  • β i i = quadratic regression coefficients of ith factor (one-way)
  • β i j = interaction of ith and jth factors (two-way)
  • β i j k = interaction of ith, jth and kth factors (three-way)
  • Y = dependent variable
Interactions between independent and response variables are found by conducting a study about response variable Y to establish a relationship between response and independent variables. To establish a polynomial Equation (2) and a perfect fit, 2400 runs of the experiment were performed for a design with 4–8 cube points and a cube with 5 central points and 15 points on axis for 4 parameters which are independent for calculating error of the sum of squares for different levels. Minitab software was used to perform regression for the quadratic equation for statistical analysis and to find variables affected by coefficients and parameters. Variables and responses were analyzed by using the method of experimental design. The coefficient of the determination value was used to accept or decline the quality of fitting for resultant experiments and p-Value was used to change resources for 95% certainty. Finally, analysis was conducted by using analysis of variance (ANOVA).
The RSM optimization analysis for engine thermal efficiency and emission is performed with load and alcohol percentage as the input variables. Equation (3) denotes the response surface model and, in Table 10, the summary of this model is also mentioned in the form of analysis of variance (ANOVA). The performance of the model and effect of variables in linear mode, quadratic mode and the 2-way method is provided. The R-squared value of this model by RSM is 0.92. The highest value of load*load gives a p-Value of 0.654, indicating a significant contributor to the BTE of the engine. Then, next comes the interaction between load and alcohol for the BTE. The adjusted sum of squares (SS), mean of squares (MS) and the F-value indicate that the lowest probability is given to load independently and the interaction between load and alcohol.
The standardized effect and response surface of engine BTE added with N-octanol alcohol with a percentage of 5 to 15% is shown in Figure 14. The standardized result indicates that the load, alcohol and square of alcohol have a significant impact. The product of load and alcohol has a more negligible effect, as explained in the ANOVA table. Based on Figure 15, the actual contour of the BTE varying with load and alcohol indicates that, at the load between 3 and 6 kg with 6 to 12% of alcohol, the BTE is negligible. With 0% alcohol, the BTE increases consistently with load, and reaches the maximum at 12 kg of load. At 15% alcohol, the increase in BTE with load is much lesser. Hence, the optimized value is obtained at no alcohol and maximum load. However, alcohol in the range of 5 to 12% damages the BTE of the engine completely, which does not affect it much even with the increase of load. However, increasing beyond this percentage increases the BTE, which is less at a lower percentage of alcohol. The labels in the contours indicate the range of values of BTE. A total of 21% of BTE is seen at the bottom right of the corner, which indicates the highest BTE.
BTE (%) = 10.52 + 2.01 Load − 4.249 Alcohol − 0.046 Load∗Load + 0.2627 Alcohol∗Alcohol − 0.0756 Load∗Alcohol
The response of the BTE with the use of N-butanol as an alcohol additive to the blends of Calophyllum inophyllum in diesel is mentioned in Equation (4). The respective ANOVA of the response is mentioned in Table 11. The load as an independent parameter in the linear model and square of load are the critical parameters affecting the BTE with N-butanol additive. In addition, the standardized effect shown in Figure 15 is similar to the result previously shown in Figure 14.
BTE (%) = 8.52 + 2.36 Load (kg) − 2.220 Alcohol (%)− 0.0553 Load (kg)∗Load (kg)
+ 0.1281 Alcohol (%)∗Alcohol (%) − 0.0865 Load (kg)∗Alcohol (%)
The BTE profile presented in Figure 15, varying with load and alcohol, is indicated by the actual contour of its response. The load between 3 and 6 kg with 5.5 to 12% of alcohol the BTE is negligible. At 15% alcohol, the increase in BTE with load is much lesser. Hence, the optimized value is obtained at no alcohol and maximum load. However, alcohol in the range of 5 to 12% damages the BTE of the engine completely, which does not affect it much, even with the increase of load. With 0% alcohol, the BTE increases consistently with load, maximum at 12 kg load. However, rising beyond this percentage increases the BTE, which is lesser at lower percentages of alcohol. The labels in the contours indicate the range of values of BTE. A total of 24% of BTE is seen in the bottom right corner, which indicates the highest BTE.
From this analysis onwards, the RSM model summary obtained, with respect to ANVOA tables and the standardized effect, is not mentioned to avoid increasing the length of this study. The response of the CO emission from engine blends with Calophyllum inophyllum in diesel and N-octanol alcohol as the additive was obtained using the quadratic relation mentioned in Equation (5). In Equation (4), the response of CO emission from the engine using N-butanol as an additive in the considered biodiesel is provided. The response for CO emission using N-octanol and N-butanol additive is slightly different from Equations (5) and (6). The labels provided in the contour of the CO emission response for N-octanol and N-butanol additives indicate the zones and their emissions. In both cases, the highest emission is at full load, but comparatively, the emission is lower using N-octanol compared to using N-butanol. The trends for both the CO emissions are similar, but the N-butanol added engine provides a greater emission of CO gases. Emission increases with an increase in alcohol percentage and then reduces at the highest alcohol percentage at any load operated. Figure 16 shows the CO emission response for load and with varying percentages of N-octanol and N-butanol alcohol additives.
CO (%) = 0.03363 + 0.00361 Load (kg) + 0.001912 Alcohol (%) − 0.000104 Load (kg)∗Load (kg)
− 0.000137 Alcohol (%)∗Alcohol (%) + 0.000010 Load (kg)∗Alcohol (%)
CO (%) = 0.03888 + 0.00237 Load (kg) + 0.002838 Alcohol (%) − 0.000035 Load (kg)∗Load (kg)
− 0.000213 Alcohol (%)∗Alcohol (%) + 0.000003 Load (kg)∗Alcohol (%)
Equations (7) and (8) denote the responses of the CO2 emission from the engine with varying percentages of N-octanol and N-butanol alcohol additive. The contours added are not similar in this case due to their different effect on the engine emission of carbon dioxide. At the lowest load, with the increase in additive percentages, the CO2 emission continuously increases and reaches the maximum at the highest percentage of alcohol. However, at full usage, the CO2 emission initially increases at 15% of N-octanol and finally, in the added fuel, the emission reduces. The maximum CO2 emission at full load is obtained at 10% N-octanol. In the case of the N-butanol additive, the emission increases with an increase in percentage at full, which is different from the previous case. At lower loads, the emission increases continuously and does not reduce with the increasing percentage of the additive. However, at full load with a maximum addition of alcohol, the emission reduces slightly. Figure 17 shows the CO2 emission response for load and varying percentages of N-octanol and N-butanol alcohol additives.
CO2 (%) = 2.22 + 0.258 Load (kg) + 0.647 Alcohol (%) − 0.0001 Load (kg)∗Load (kg)
− 0.02452 Alcohol (%)∗Alcohol (%) − 0.02071 Load (kg)∗Alcohol (%)
CO2 (%) = 2.279 + 0.227 Load (kg) + 0.4258 Alcohol (%) + 0.0009 Load (kg)∗Load (kg)
− 0.01142 Alcohol (%)∗Alcohol (%) – 0.01967 Load (kg)∗Alcohol (%)
The HC emission from the CI engine using diesel added with Calophyllum inophyllum N-Octanol and N-butanol alcohol is analyzed using the response surface method. The response of HC emission is computed using Equations (9) and 10 obtained using the Minitab software. The varying load from no load to full load and additive alcohols from 5 to 15% is accessed. The surface analysis using the contours of HC emission at discrete points of alcohol and load is shown in Figure 18. The labels design in outlines is also pointed out with black dots, which indicates the start or end of surface modifications. From both the contours, it is clear that increasing the percentage of N-octanol in biodiesel increased the HC emission, irrespective of whatever load is applied. In addition, increasing the load at any percentage of alcohol increases the HC emission. However, when N-butanol is used, the HC emission at higher loads reduces significantly with the increase of percentage of alcohol. Up to 50% of the load increasing the percentage of alcohol causes a rise in HC emission. Later, with the increase in load, the same increase in alcohol content reduces the HC emission from the engine. Figure 18 illustrates the HC emission response for load and with varying percentages of N-octanol and N-butanol alcohol additive.
HC (PPM) = 14.82 + 1.53 Load (kg) + 0.828 Alcohol (%) + 0.0208 Load (kg)∗Load (kg)
+ 0.0675 Alcohol (%)∗Alcohol (%) − 0.0980 Load (kg)∗Alcohol (%)
HC (PPM) = 14.30 + 1.73 Load (kg) + 2.810 Alcohol (%) − 0.0000 Load (kg)∗Load (kg)
− 0.1000 Alcohol (%)∗Alcohol (%) – 0.0773 Load (kg)∗Alcohol (%)

5. Conclusions

This study was conducted to evaluate the influence of N-butanol and N-octanol on the BD20 blend of Calophyllum inophyllum biodiesel by varying the percentage of individual alcohols and the combined effect of both N-butanol and octanol used as the hybrid blend that is BD20A10N10D60. The test results revealed that Calophyllum inophyllum and N-butanol and octanol can be used in diesel engines without further modification.
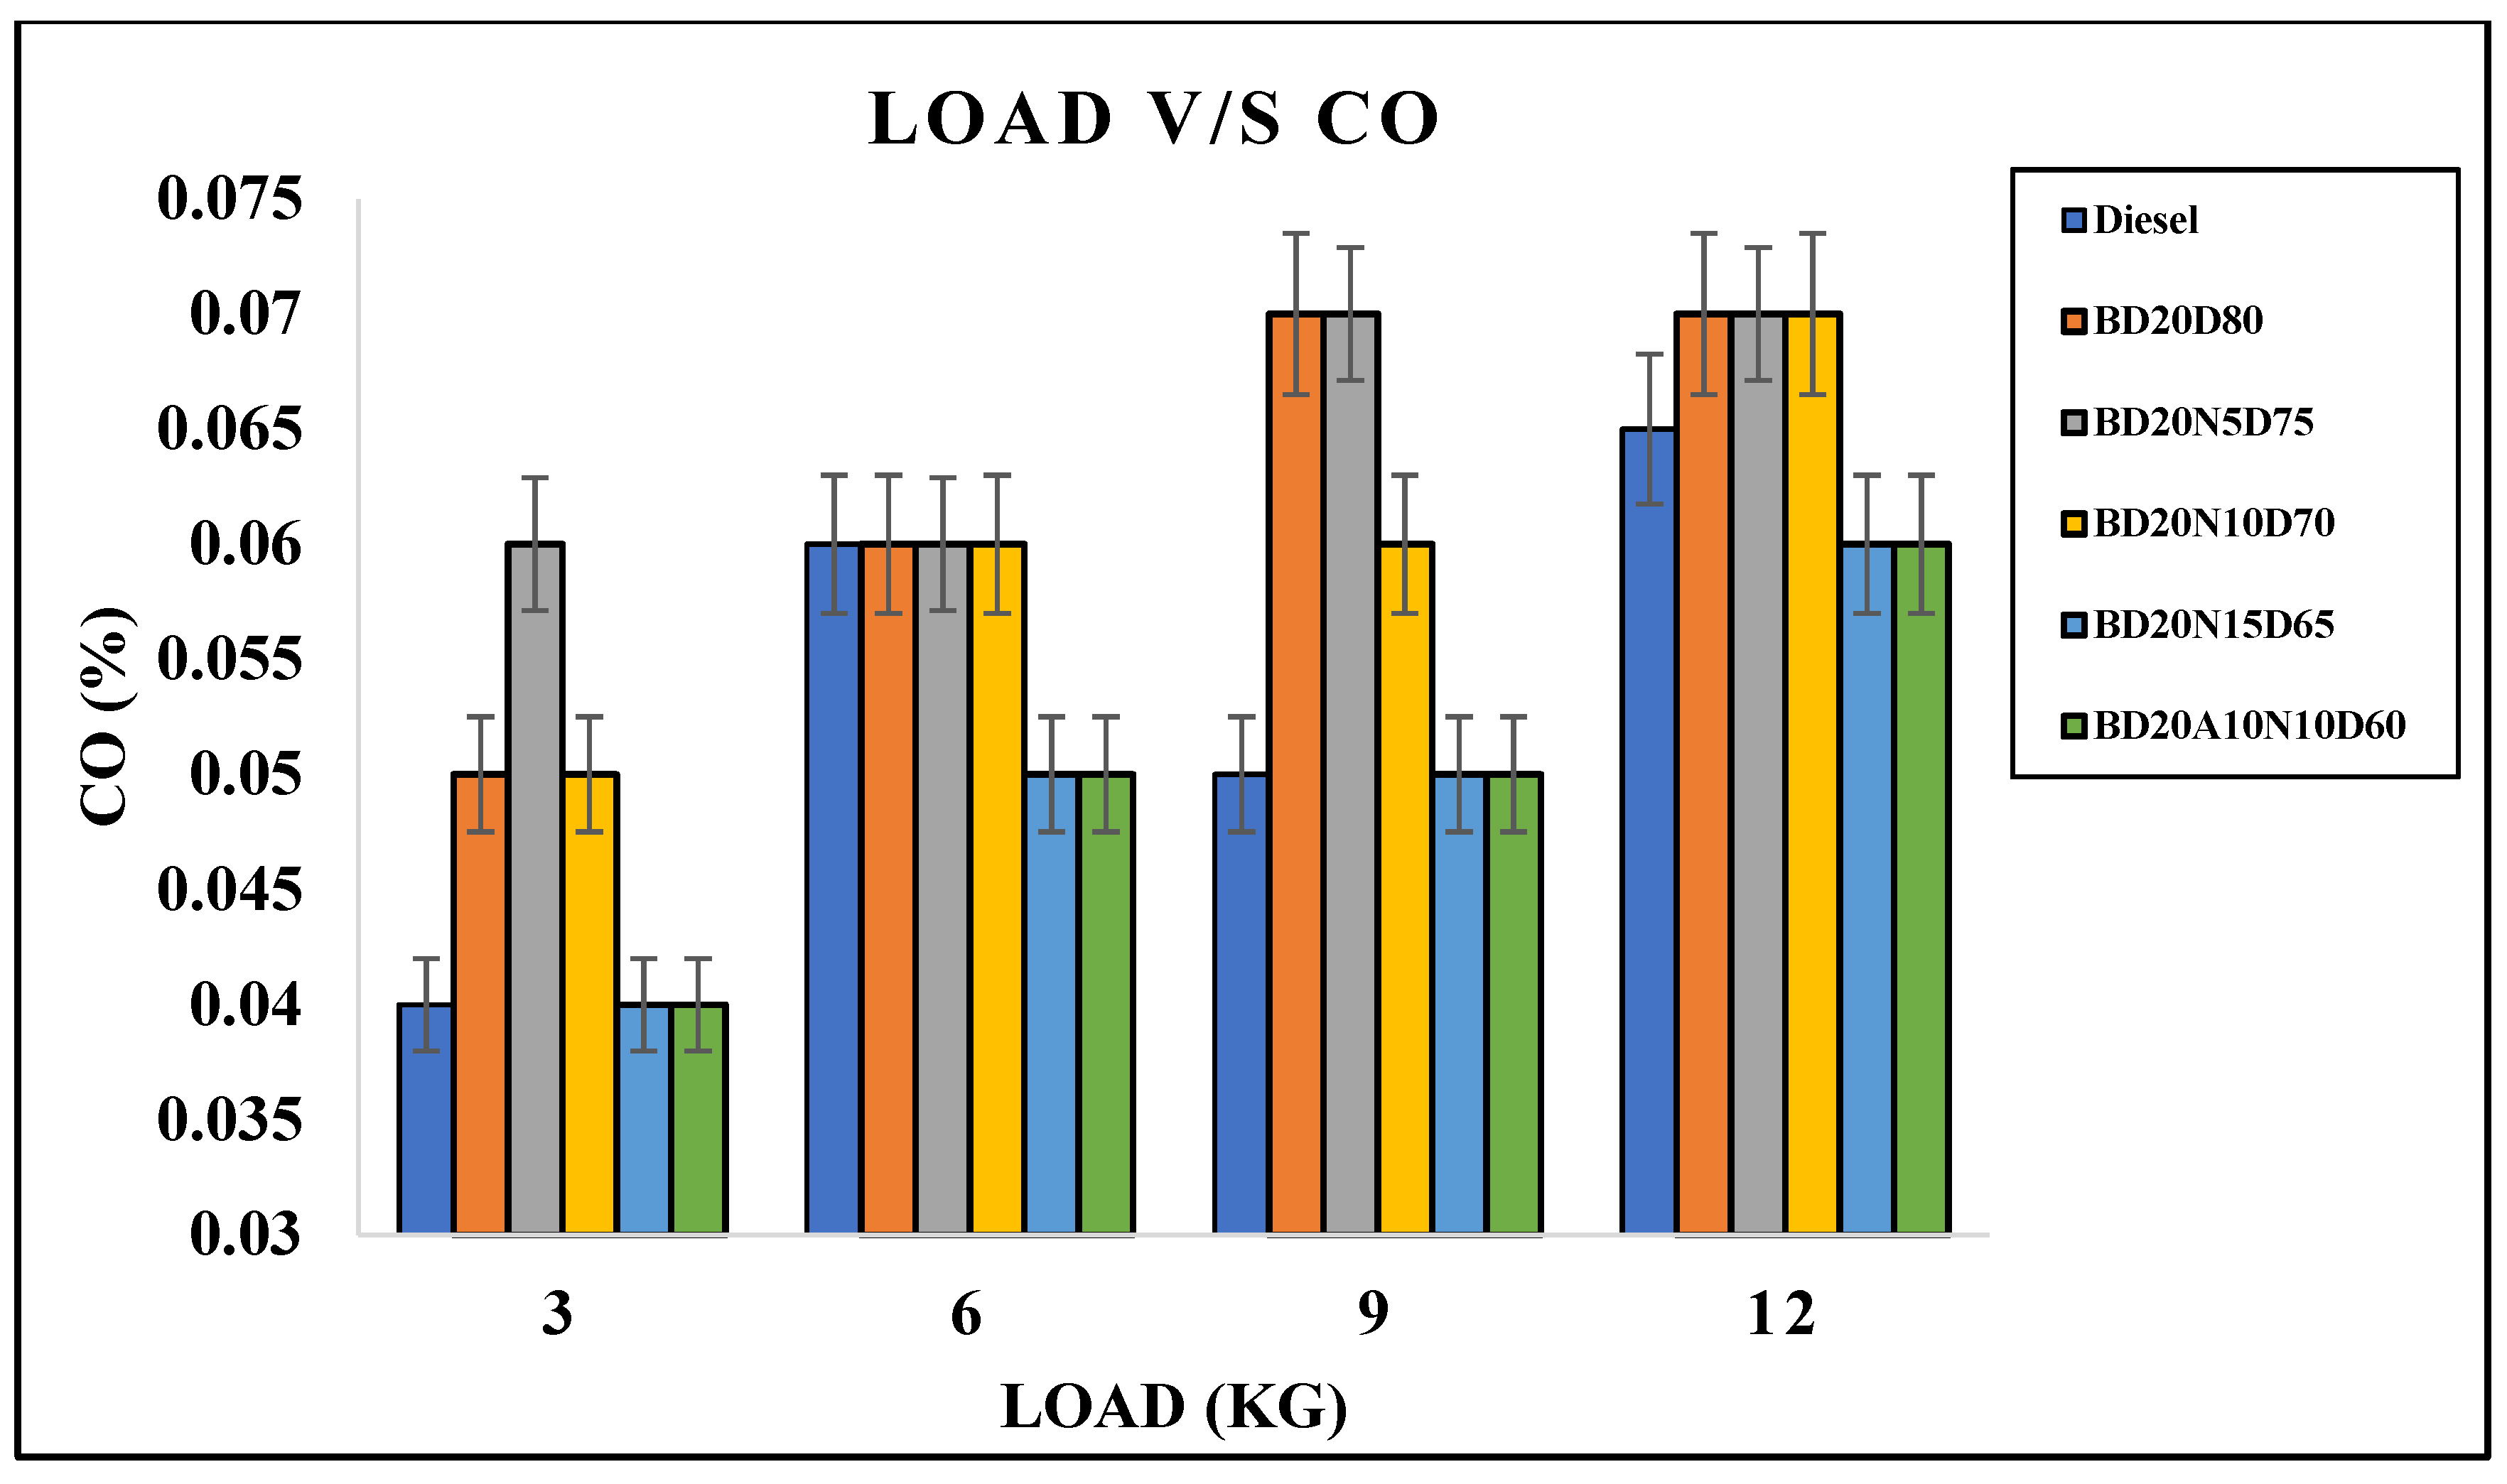
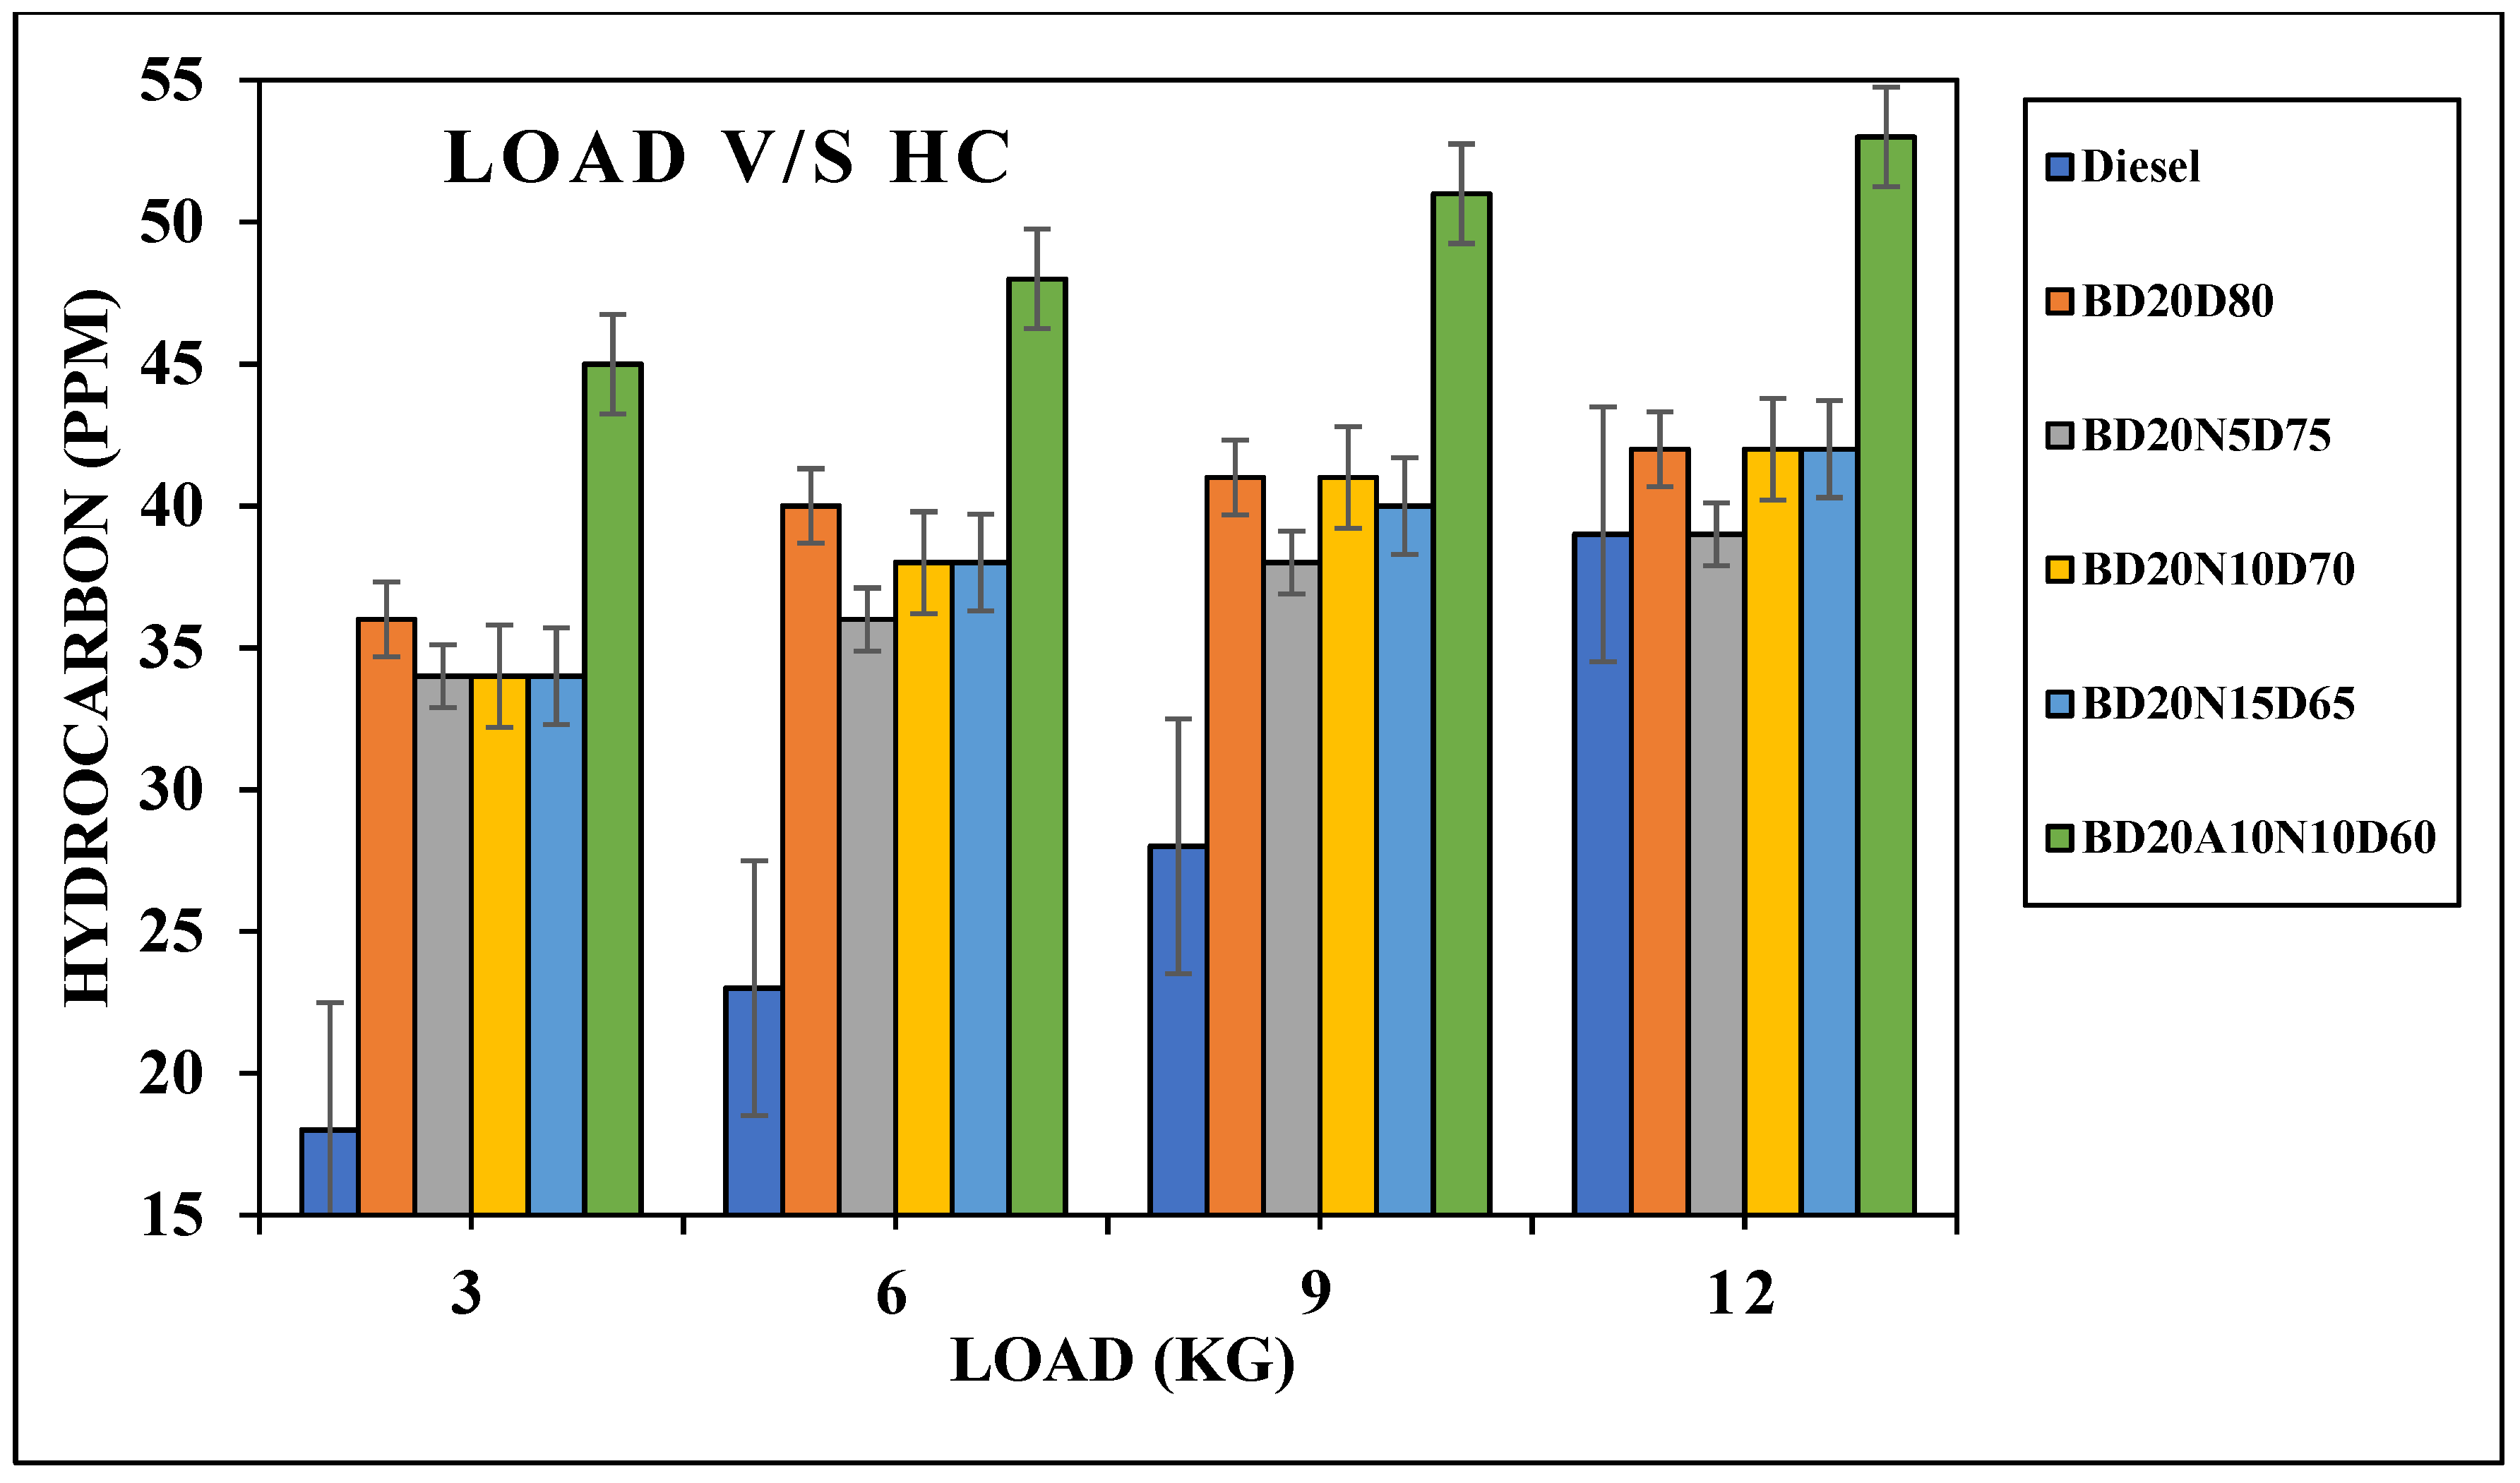
  • BD20A10N10D60 showed the highest BTE and lowest CO emission among the blends of N-octanol. BD20N10D70 was found to have the highest calorific value and lowest BSFC among the blends. BD20N5D75 showed the lowest HC emission among the blends of N-butanol. BD20A5D75 and BD20A10D70 showed the lowest HC emissions among the blends of octanol. BD20A10N10D60 showed the highest BTE and lowest CO emission among the blends of N-butanol. BD20N5D75 showed the lowest HC emission among the blends of N-butanol.
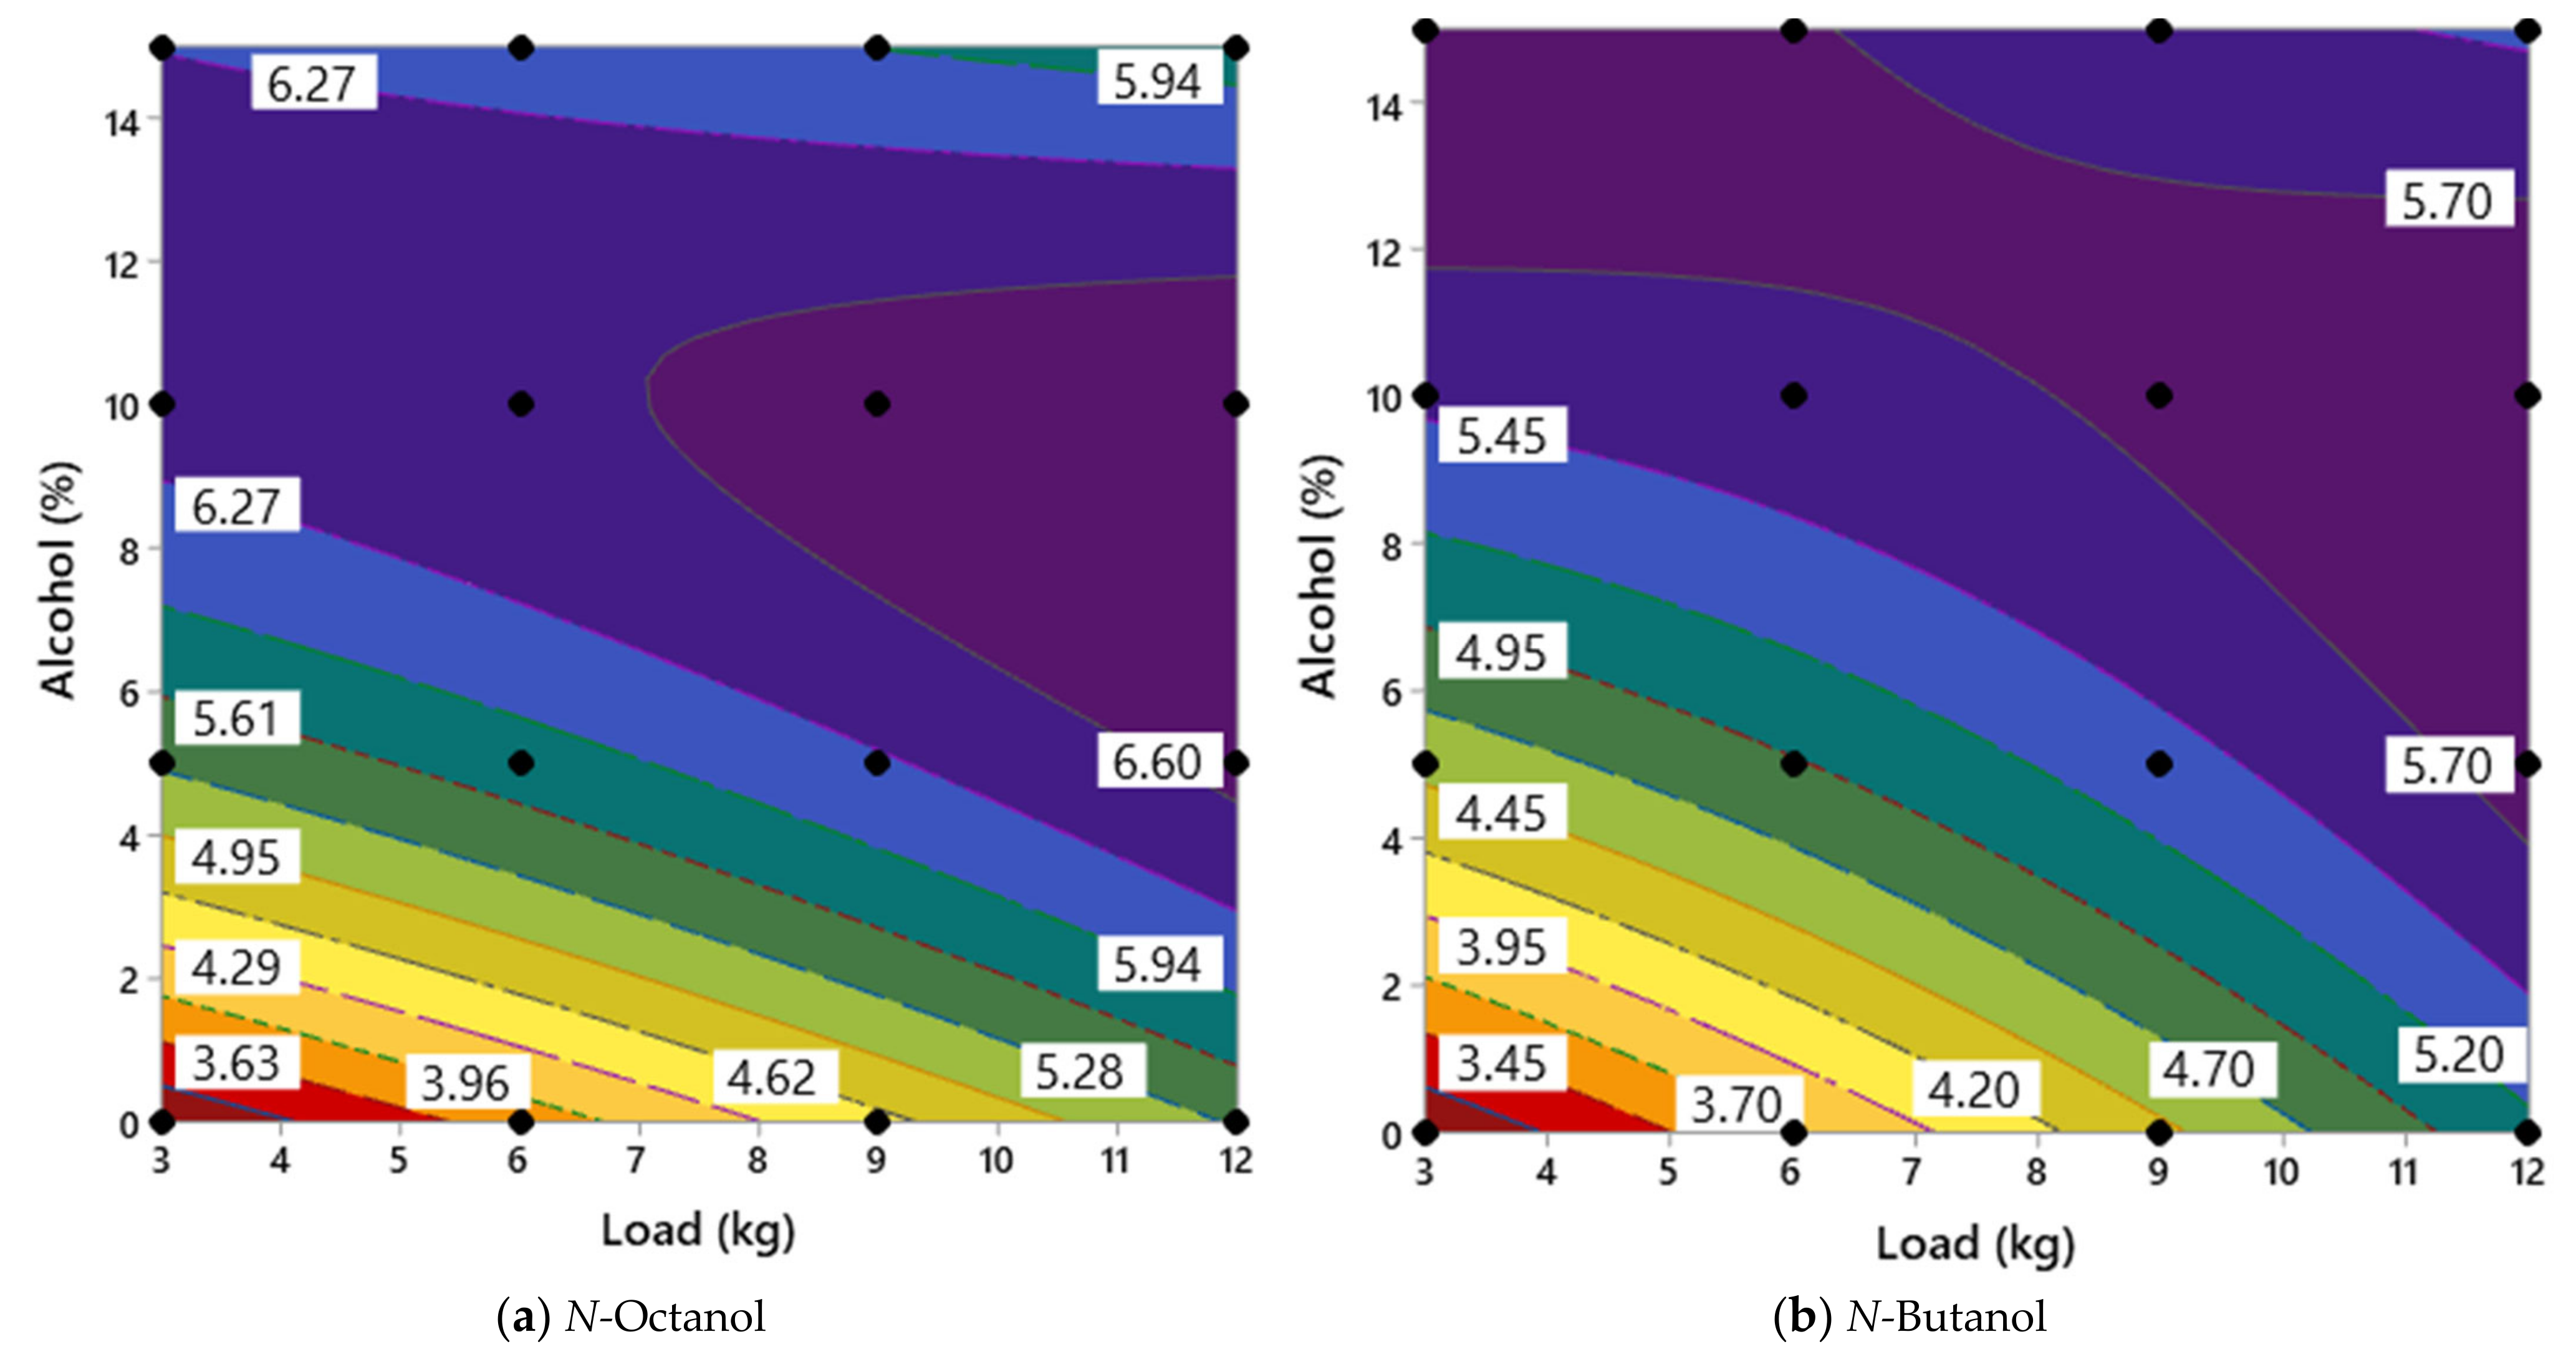
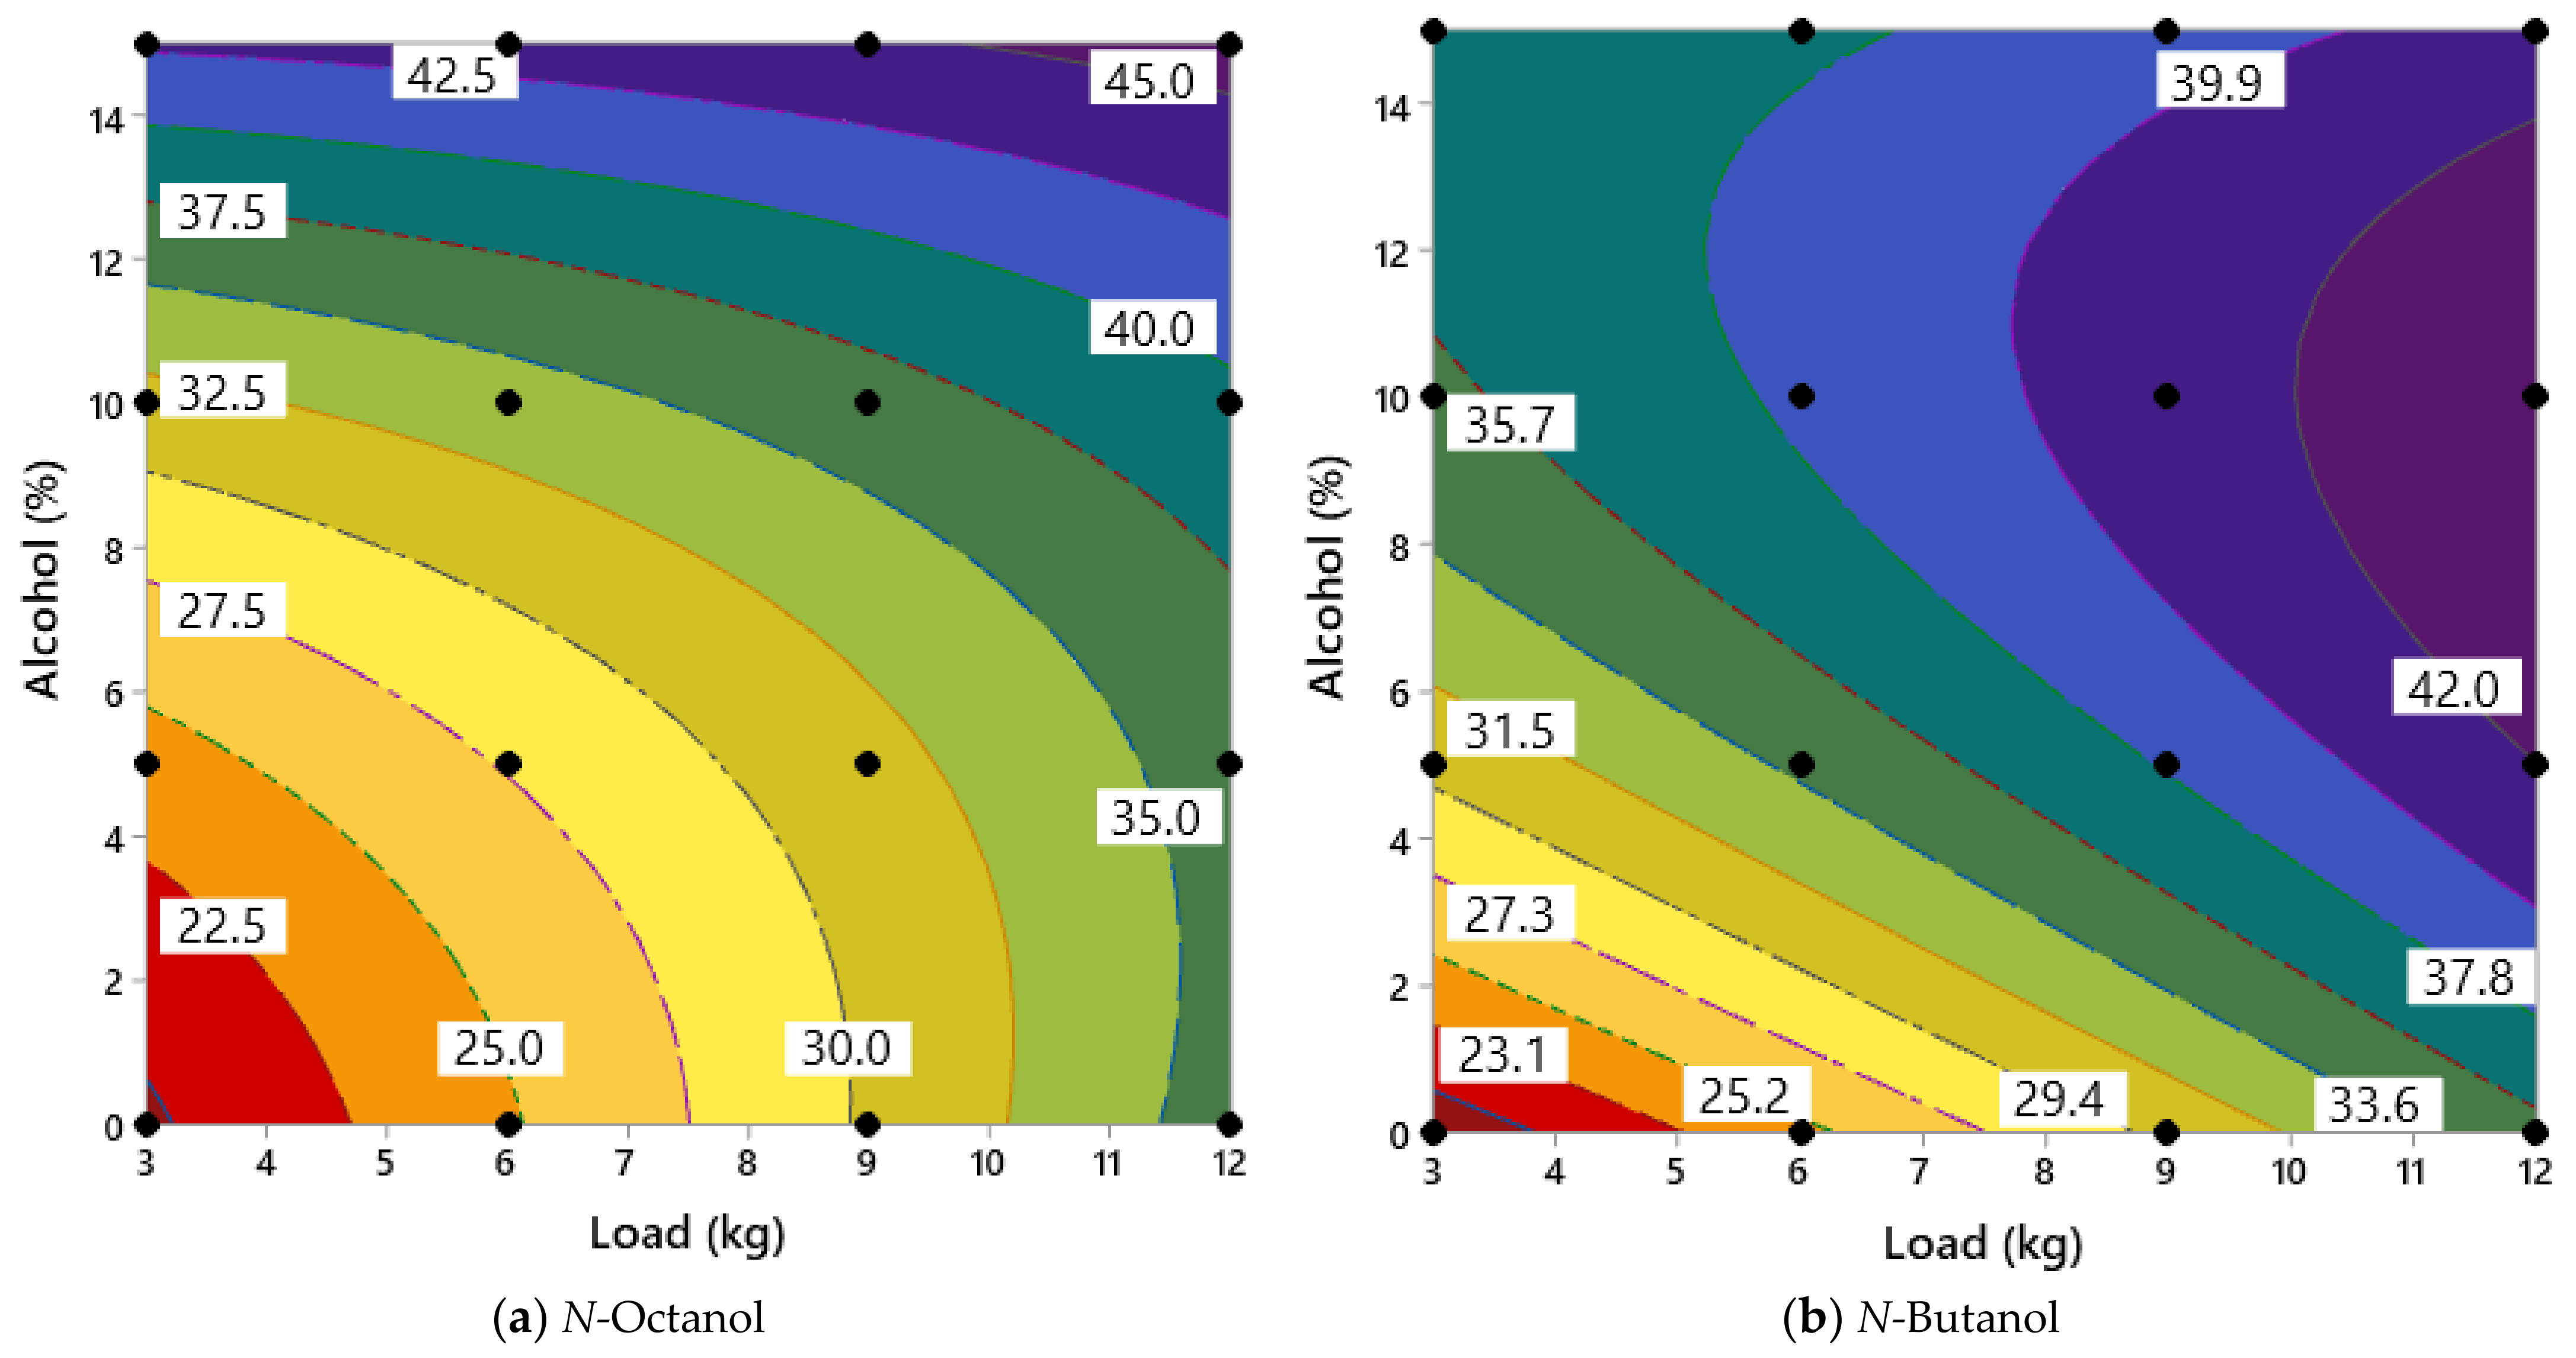
  • A hybrid blend of octanol and N-butanol that is BD20A10N10D60 is the optimum blend among the blends of N-octanol and N-butanol. From RSM optimization method, it is observed that when alcohol is not added, the BTE increases consistently with load and it reaches the maximum at full load. At 15% alcohol, the increase in BTE with load is much lesser. Hence, the optimized value is obtained at no alcohol and maximum load.
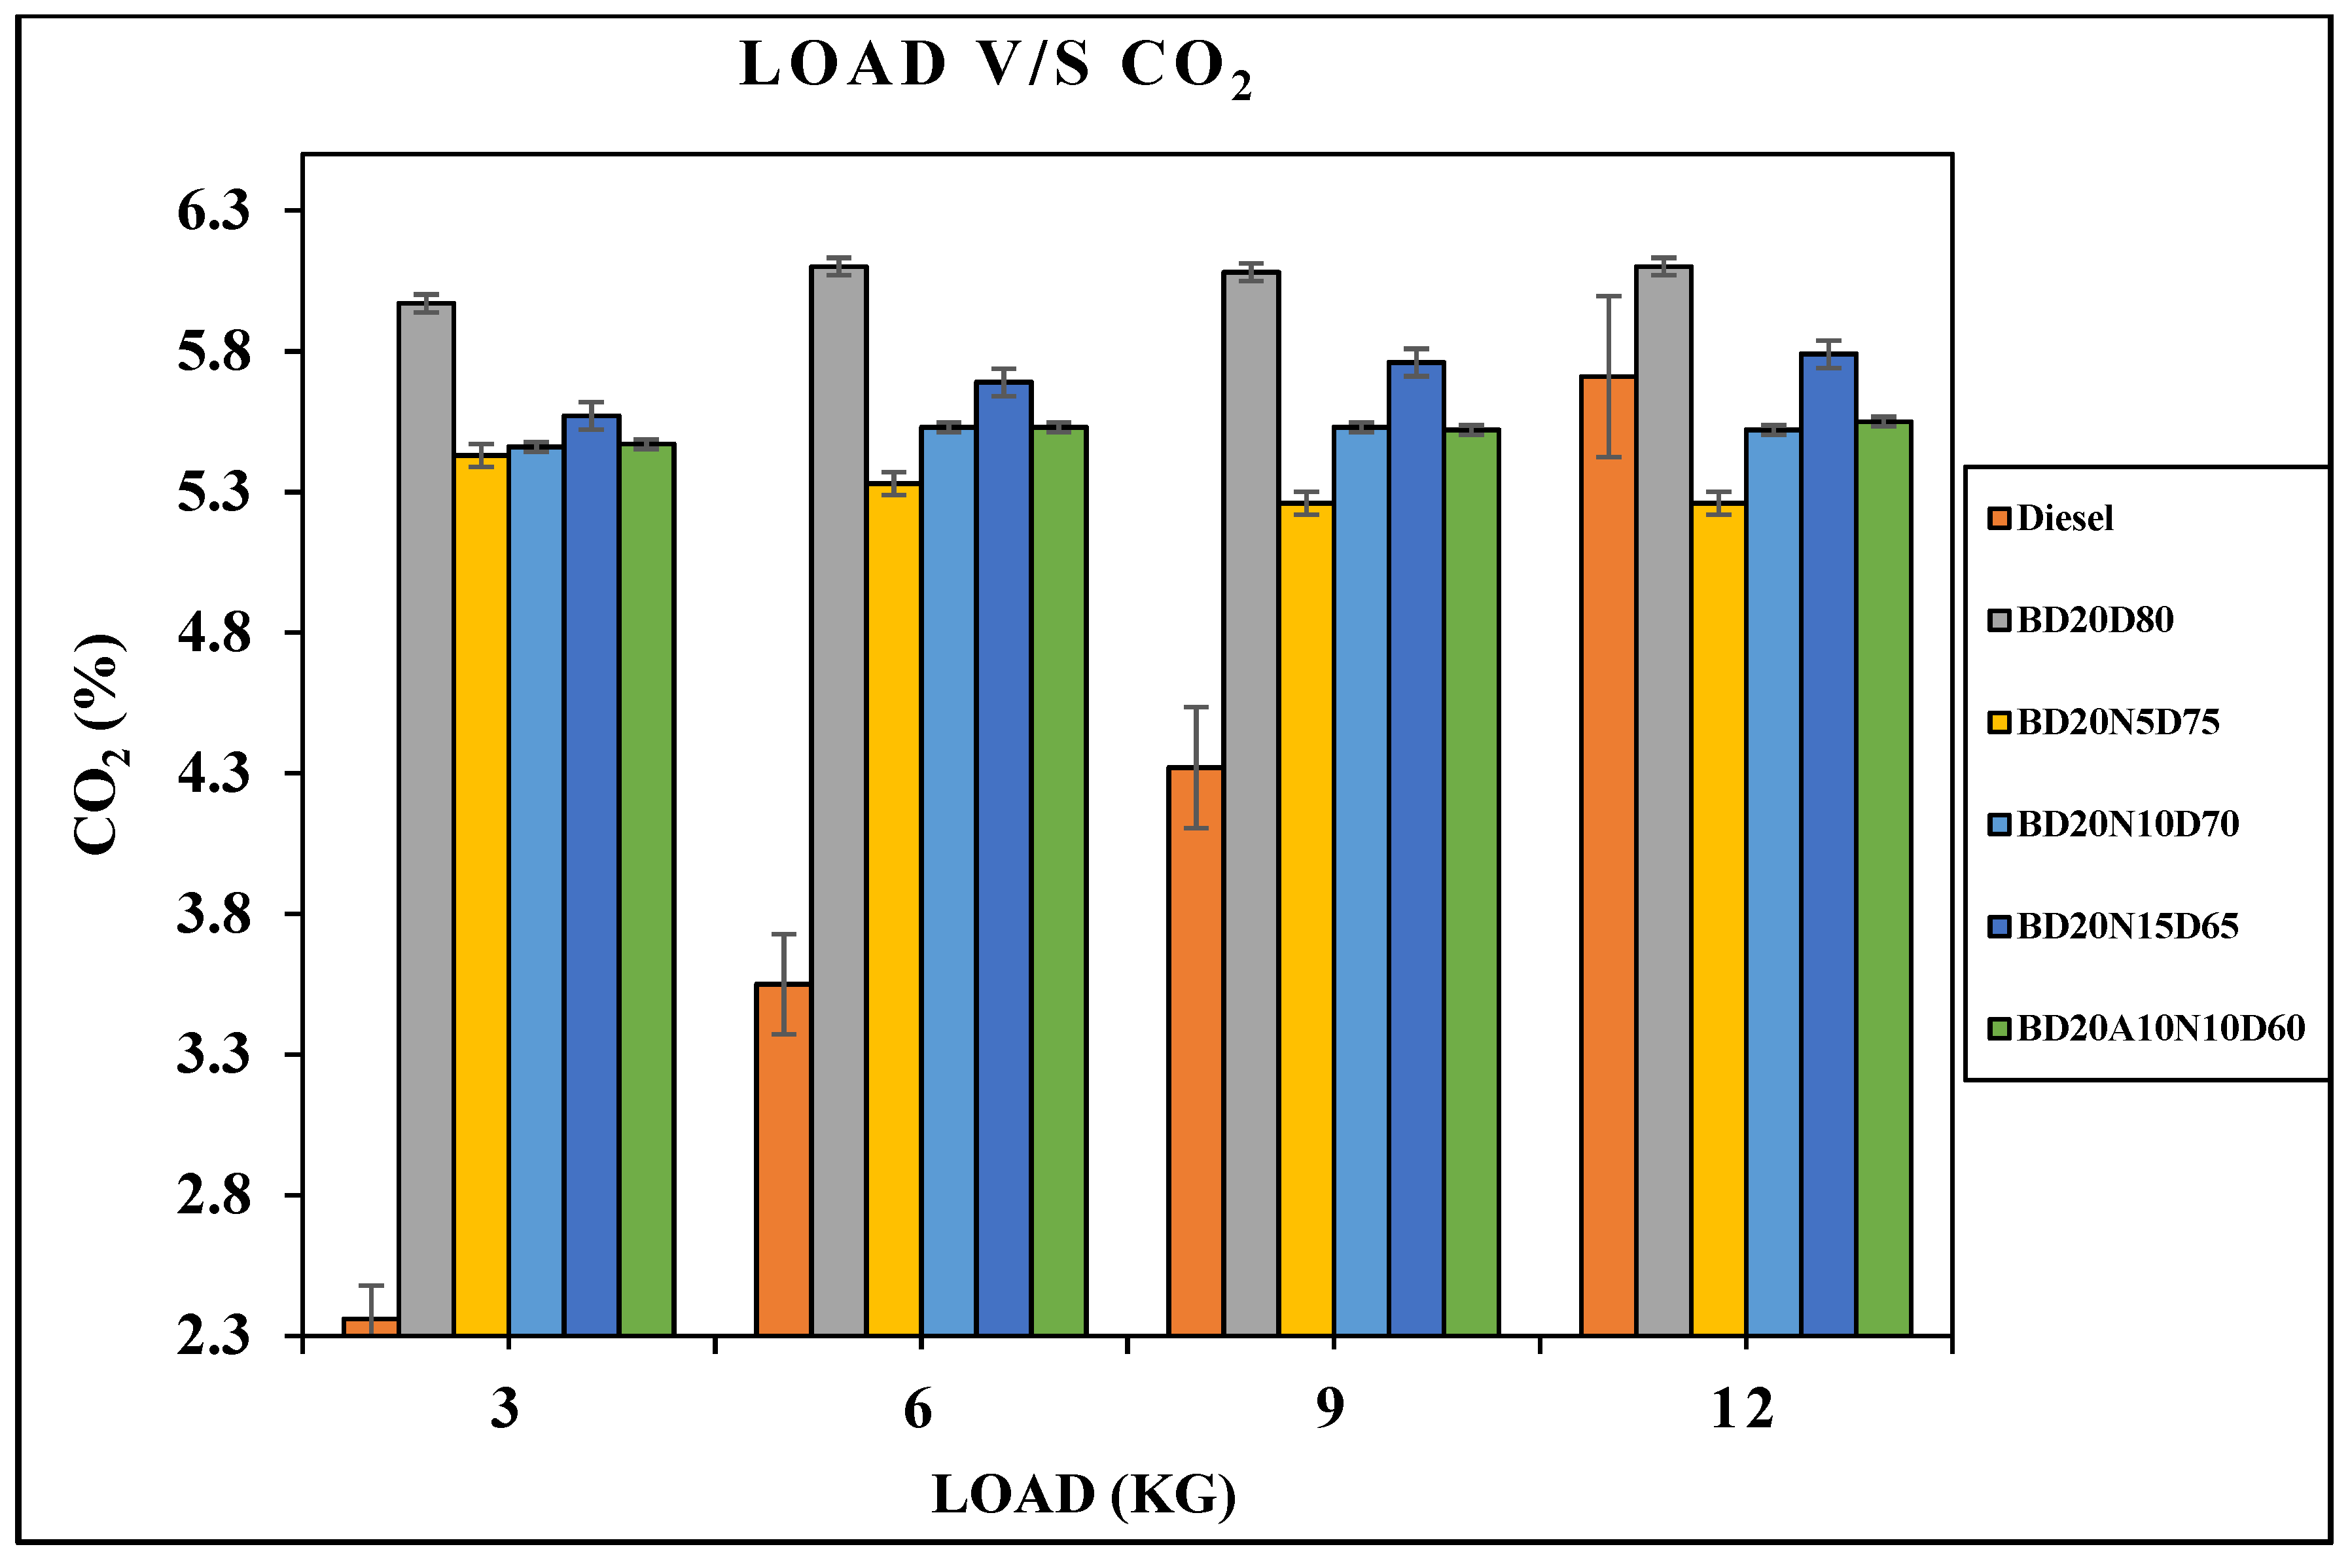
  • The role of N-octanol and N-butanol additives in the performance and emission of the engine is significant. With the increase of load, the emission increased and further deteriorated with the rise in the percentage of N-octanol. However, the use of N-butanol additive reduces the emissions at full loads.
  • The mathematical models from RSM are perfectly fitted with the experimental readings with more than 92% accuracy, which indicates their perfect fitting for optimization.
  • The ANOVA of the parameter interactions indicates that the alcohol percentage in the blend also significantly influences engine performance and emission profile.
  • The RSM analysis provided the optimal thermal efficiency value and emissions at higher loads and moderate percentage of alcohol.

Author Contributions

Conceptualization, M.A. and A.A.; methodology, A.A., M.K., M.E.M.S. and M.A; software, A.A.; validation, A.A., N.H.; formal analysis, M.E.M.S., N.H.; investigation, A.A.; resources, R.S., M.H.A., M.A. and M.K.; project administration, C.A.S. and S.A.; funding acquisition, C.A.S. and S.A. All authors have read and agreed to the published version of the manuscript.

Funding

This research was funded by the Research Group Program under Grant No: R.G.P.1/132/42.

Institutional Review Board Statement

Not applicable.

Informed Consent Statement

Not applicable.

Data Availability Statement

Based on request data will be provided by the corresponding author.

Acknowledgments

The authors extend their appreciation to the Deanship of Scientific Research at King Khalid University, Saudi Arabia, to fund this work through the Research Group Program under Grant No: R.G.P.1/132/42.

Conflicts of Interest

The authors declare no conflict of interest.

References

  1. Akram, N.; Montazer, E.; Kazi, S.; Soudagar, M.E.M.; Raju V., D.; Ahmed, W.; Zubir, M.N.M.; Afzal, A.; Muhammad, M.R.; Ali, H.M.; et al. Experimental investigations of the performance of a flat-plate solar collector using carbon and metal oxides based nanofluids. Energy 2021, 227, 120452. [Google Scholar] [CrossRef]
  2. Sateesh, K.A.; Yaliwal, V.S.; Soudagar, M.E.M.; Banapurmath, N.R.; Fayaz, H.; Safaei, M.R.; Elfasakhany, A.; El-Seesy, A.I. Utilization of biodiesel/Al2O3 nanoparticles for combustion behavior enhancement of a diesel engine operated on dual fuel mode. J. Therm. Anal. Calorim. 2021. [Google Scholar] [CrossRef]
  3. Fayaz, H.; Mujtaba, M.; Soudagar, M.E.M.; Razzaq, L.; Nawaz, S.; Nawaz, M.A.; Farooq, M.; Afzal, A.; Ahmed, W.; Khan, T.Y.; et al. Collective effect of ternary nano fuel blends on the diesel engine performance and emissions characteristics. Fuel 2021, 293, 120420. [Google Scholar] [CrossRef]
  4. Mujtaba, M.; Cho, H.M.; Masjuki, H.; Kalam, M.; Farooq, M.; Soudagar, M.E.M.; Gul, M.; Afzal, A.; Ahmed, W.; Raza, A.; et al. Effect of primary and secondary alcohols as oxygenated additives on the performance and emission characteristics of diesel engine. Energy Rep. 2021, 7, 1116–1124. [Google Scholar] [CrossRef]
  5. Razzaq, L.; Farooq, M.; Mujtaba, M.; Sher, F.; Farhan, M.; Hassan, M.; Soudagar, M.; Atabani, A.; Kalam, M.; Imran, M. Modeling viscosity and density of ethanol-diesel-biodiesel ternary blends for sustainable environment. Sustainability 2020, 12, 5186. [Google Scholar] [CrossRef]
  6. Khan, H.M.; Iqbal, T.; Yasin, S.; Irfan, M.; Kazmi, M.; Fayaz, H.; Mujtaba, M.; Ali, C.H.; Kalam, M.; Soudagar, M.E.M. Production and utilization aspects of waste cooking oil based biodiesel in Pakistan. Alex. Eng. J. 2021, 60, 5831–5849. [Google Scholar] [CrossRef]
  7. Soudagar, M.E.M.; Afzal, A.; Safaei, M.R.; Manokar, A.M.; El-Seesy, A.I.; Mujtaba, M.A.; Samuel, O.D.; Badruddin, I.A.; Ahmed, W.; Shahapurkar, K.; et al. Correction to: Investigation on the effect of cottonseed oil blended with different percentages of octanol and suspended MWCNT nanoparticles on diesel engine characteristics. J. Therm. Anal. Calorim. 2020, 1–18. [Google Scholar] [CrossRef]
  8. Soudagar, M.E.M.; Mujtaba, M.A.; Safaei, M.R.; Afzal, A.; Ahmed, W.; Banapurmath, N.R.; Hossain, N.; Bashir, S.; Badruddin, I.A.; Goodarzi, M.; et al. Effect of Sr@ ZnO nanoparticles and Ricinus communis biodiesel-diesel fuel blends on modified CRDI diesel engine characteristics. Energy 2020, 215, 119094. [Google Scholar] [CrossRef]
  9. Hossain, N.; Mahlia, T.M.I.; Miskat, M.I.; Chowdhury, T.; Barua, P.; Chowdhury, H.; Nizamuddin, S.; Ahmad, N.B.; Zaharin, N.A.B.; Mazari, S.A.; et al. Bioethanol production from forest residues and life cycle cost analysis of bioethanol-gasoline blend on transportation sector. J. Environ. Chem. Eng. 2021, 9, 105542. [Google Scholar] [CrossRef]
  10. Wategave, S.; Banapurmath, N.; Sawant, M.; Soudagar, M.E.M.; Mujtaba, M.; Afzal, A.; Basha, J.S.; Alazwari, M.A.; Safaei, M.R.; Elfasakhany, A. Clean combustion and emissions strategy using reactivity controlled compression ignition (RCCI) mode engine powered with CNG-Karanja biodiesel. J. Taiwan Inst. Chem. Eng. 2021. [Google Scholar] [CrossRef]
  11. Venkanna, B.; Reddy, C.V.; Wadawadagi, S.B. Performance, emission and combustion characteristics of direct injection diesel engine running on rice bran oil/diesel fuel blend. Diesel Engine 2009, 14, 15. [Google Scholar]
  12. Belagur, V.K.; Venkataramana, R. Injection timing impact on Calophyllum inophyllum linn oil (Honne Oil)/diesel fuelled diesel engine. Int. Energy J. 2011, 11, 3. [Google Scholar]
  13. Nanthagopal, K.; Ashok, B.; Saravanan, B.; Pathy, M.R.; Sahil, G.; Ramesh, A.; Nabi, N.; Rasul, M.G. Study on decanol and Calophyllum inophyllum biodiesel as ternary blends in CI engine. Fuel 2019, 239, 862–873. [Google Scholar] [CrossRef]
  14. Ashok, B.; Nanthagopal, K.; Darla, S.; Chyuan, O.H.; Ramesh, A.; Jacob, A.; Sahil, G.; Thiyagarajan, S.; Geo, V.E. Comparative assessment of hexanol and decanol as oxygenated additives with Calophyllum inophyllum biodiesel. Energy 2019, 173, 494–510. [Google Scholar] [CrossRef]
  15. Nanthagopal, K.; Ashok, B.; Saravanan, B.; Korah, S.M.; Chandra, S. Effect of next generation higher alcohols and Calophyllum inophyllum methyl ester blends in diesel engine. J. Clean. Prod. 2018, 180, 50–63. [Google Scholar] [CrossRef]
  16. Tamilvanan, A.; Balamurugan, K.; Ashok, B.; Selvakumar, P.; Dhamotharan, S.; Bharathiraja, M.; Karthickeyan, V. Effect of diethyl ether and ethanol as an oxygenated additive on Calophyllum inophyllum biodiesel in CI engine. Environ. Sci. Pollut. Res. 2020, 1–19. [Google Scholar] [CrossRef]
  17. Tiwari, P.K.; Raj, S.; Kumar, S.; Singh, P.; Swaraj, R.; Sarkar, S.; Nayak, S.K.; Mishra, P.C. Influence of Calophyllum inophyllum and Jojoba oil methyl ester blended with n-pentanol additive upon overall performance, combustion and emission characteristics of a TDI engine operated in natural aspirated mode. Fuel 2021, 288, 119576. [Google Scholar] [CrossRef]
  18. Wang, S.; Viswanathan, K.; Esakkimuthu, S.; Azad, K. Experimental investigation of high alcohol low viscous renewable fuel in DI diesel engine. Environ. Sci. Pollut. Res. 2021, 28, 12026–12040. [Google Scholar] [CrossRef] [PubMed]
  19. Yesilyurt, M.K.; Aydin, M.; Yilbasi, Z.; Arslan, M. Investigation on the structural effects of the addition of alcohols having various chain lengths into the vegetable oil-biodiesel-diesel fuel blends: An attempt for improving the performance, combustion, and exhaust emission characteristics of a compression ignition engine. Fuel 2020, 269, 117455. [Google Scholar]
  20. Rangabashiam, D.; Munuswamy, D.B.; Balasubramanian, S.D.; Christopher, D. Performance, emission, and combustion analysis on diesel engine fueled with blends of neem biodiesel/diesel/additives. Energy Sources Part A Recover. Util. Environ. Eff. 2020, 1–11. [Google Scholar] [CrossRef]
  21. Yesilyurt, M.K. A detailed investigation on the performance, combustion, and exhaust emission characteristics of a diesel engine running on the blend of diesel fuel, biodiesel and 1-heptanol (C7 alcohol) as a next-generation higher alcohol. Fuel 2020, 275, 117893. [Google Scholar] [CrossRef]
  22. Bawane, R.K.; Muthuraja, A.; Shelke, G.N.; Gangele, A. Impact analysis of Calophyllum inophyllum oil biodiesel on performance and emission characteristic of diesel engine under variation in compression ratio, engine load, and blend proportion. Int. J. Ambient. Energy 2020, 1–12. [Google Scholar] [CrossRef]
  23. Soudagar, M.E.M.; Nik-Ghazali, N.-N.; Kalam, M.; Badruddin, I.A.; Banapurmath, N.; Khan, T.Y.; Bashir, M.N.; Akram, N.; Farade, R.; Afzal, A. The effects of graphene oxide nanoparticle additive stably dispersed in dairy scum oil biodiesel-diesel fuel blend on CI engine: Performance, emission and combustion characteristics. Fuel 2019, 257, 116015. [Google Scholar] [CrossRef]
  24. Mujtaba, M.A.; Cho, H.M.; Masjuki, H.H.; Kalam, M.A.; Farooq, M.; Soudagar, M.E.M.; Gul, M.; Ahmed, W.; Afzal, A.; Bashir, S.; et al. Effect of alcoholic and nano-particles additives on tribological properties of diesel–palm–sesame–biodiesel blends. Energy Rep. 2020, 7, 1162–1171. [Google Scholar] [CrossRef]
  25. Harari, P.; Banapurmath, N.; Yaliwal, V.; Soudagar, M.E.M.; Khan, T.Y.; Mujtaba, M.; Safaei, M.R.; Akram, N.; Goodarzi, M.; Elfasakhany, A.; et al. Experimental investigation on compression ignition engine powered with pentanol and thevetia peruviana methyl ester under reactivity controlled compression ignition mode of operation. Case Stud. Therm. Eng. 2021, 25, 100921. [Google Scholar] [CrossRef]
  26. Soudagar, M.E.M.; Banapurmath, N.R.; Afzal, A.; Hossain, N.; Abbas, M.M.; Haniffa, M.A.C.M.; Naik, B.; Ahmed, W.; Nizamuddin, S.; Mubarak, N. Study of diesel engine characteristics by adding nanosized zinc oxide and diethyl ether additives in Mahua biodiesel–diesel fuel blend. Sci. Rep. 2020, 10, 1–17. [Google Scholar] [CrossRef]
  27. Atabani, A.; César, A.D.S. Calophyllum inophyllum L.—A prospective non-edible biodiesel feedstock. Study of biodiesel production, properties, fatty acid composition, blending and engine performance. Renew. Sustain. Energy Rev. 2014, 37, 644–655. [Google Scholar] [CrossRef]
  28. Soudagar, M.E.M.; Afzal, A.; Kareemullah, M. Waste coconut oil methyl ester with and without additives as an alternative fuel in diesel engine at two different injection pressures. Energy Sources Part A Recover. Util. Environ. Eff. 2020, 1–19. [Google Scholar] [CrossRef]
  29. Ashok, B.; Nanthagopal, K.; Anand, V.; Aravind, K.; Jeevanantham, A.; Balusamy, S. Effects of n-octanol as a fuel blend with biodiesel on diesel engine characteristics. Fuel 2019, 235, 363–373. [Google Scholar] [CrossRef]
  30. Devarajan, Y.; Munuswamy, D.B.; Nagappan, B.; Pandian, A.K. Performance, combustion and emission analysis of mustard oil biodiesel and octanol blends in diesel engine. Heat Mass Transf. 2018, 54, 1803–1811. [Google Scholar] [CrossRef]
  31. Kumar, B.R.; Saravanan, S.; Rana, D.; Anish, V.; Nagendran, A. Effect of a sustainable biofuel–n-octanol–on the combustion, performance and emissions of a DI diesel engine under naturally aspirated and exhaust gas recirculation (EGR) modes. Energy Convers. Manag. 2016, 118, 275–286. [Google Scholar] [CrossRef]
  32. Mahalingam, A.; Devarajan, Y.; Radhakrishnan, S.; Vellaiyan, S.; Nagappan, B. Emissions analysis on mahua oil biodiesel and higher alcohol blends in diesel engine. Alex. Eng. J. 2018, 57, 2627–2631. [Google Scholar] [CrossRef]
  33. Kumar, N. Some Studies on use of ternary blends of diesel, biodiesel and n-octanol. Energy Sources Part A Recover. Util. Environ. Eff. 2018, 40, 1721–1728. [Google Scholar] [CrossRef]
  34. Soudagar, M.E.M.; Nik-Ghazali, N.-N.; Kalam, M.; Badruddin, I.A.; Banapurmath, N.; Bin Ali, M.A.; Kamangar, S.; Cho, H.M.; Akram, N. An investigation on the influence of aluminium oxide nano-additive and honge oil methyl ester on engine performance, combustion and emission characteristics. Renew. Energy 2020, 146, 2291–2307. [Google Scholar] [CrossRef]
  35. Goga, G.; Chauhan, B.S.; Mahla, S.K.; Cho, H.M. Performance and emission characteristics of diesel engine fueled with rice bran biodiesel and n-butanol. Energy Rep. 2019, 5, 78–83. [Google Scholar] [CrossRef]
  36. Farkade, H.; Pathre, A. Experimental investigation of methanol, ethanol and butanol blends with gasoline on SI engine. Int. J. Emerg. Technol. Adv. Eng. 2012, 2, 205–215. [Google Scholar]
  37. Zheng, Z.; Xia, M.; Liu, H.; Shang, R.; Ma, G.; Yao, M. Experimental study on combustion and emissions of n-butanol/biodiesel under both blended fuel mode and dual fuel RCCI mode. Fuel 2018, 226, 240–251. [Google Scholar] [CrossRef]
  38. El-Seesy, A.I.; Hassan, H.; Ibraheem, L.; He, Z.; Soudagar, M.E.M. Combustion, emission, and phase stability features of a diesel engine fueled by Jatropha/ethanol blends and n-butanol as co-solvent. Int. J. Green Energy 2020, 17, 793–804. [Google Scholar] [CrossRef]
  39. Khan, H.; Soudagar, M.E.M.; Kumar, R.H.; Safaei, M.R.; Farooq, M.; Khidmatgar, A.; Banapurmath, N.R.; Farade, R.A.; Abbas, M.M.; Afzal, A.; et al. Effect of Nano-Graphene Oxide and n-Butanol Fuel Additives Blended with Diesel—Nigella sativa Biodiesel Fuel Emulsion on Diesel Engine Characteristics. Symmetry 2020, 12, 961. [Google Scholar] [CrossRef]
  40. Raj, V.M.; Subramanian, T.; Thiyagarajan, S.; Geo, V.E. Effects of minor addition of aliphatic (1-pentanol) and aromatic (benzyl alcohol) alcohols in Simarouba Glauca-diesel blend fuelled CI engine. Fuel 2018, 234, 934–943. [Google Scholar]
  41. Emiroğlu, A.O.; Şen, M. Combustion, performance and exhaust emission characterizations of a diesel engine operating with a ternary blend (alcohol-biodiesel-diesel fuel). Appl. Therm. Eng. 2018, 133, 371–380. [Google Scholar] [CrossRef]
  42. Singh, T.S.; Verma, T.N. Impact of tri-fuel on compression ignition engine emissions: Blends of waste frying oil–alcohol–diesel. In Methanol and the Alternate Fuel Economy; Springer: Berlin/Heidelberg, Germany, 2018; pp. 135–156. [Google Scholar]
  43. Khan, H.; Kareemullah, M.; Ravi, H.C.; Rehman, K.F.; Kumar, R.H.; Afzal, A.; Soudagar, M.E.M.; Fayaz, H. Combined Effect of Synthesized Waste Milk Scum Oil Methyl Ester and Ethanol Fuel Blend on the Diesel Engine Characteristics. J. Inst. Eng. India Ser. C 2020, 101, 947–962. [Google Scholar] [CrossRef]
  44. Zhu, L.; Cheung, C.S.; Zhang, W.; Huang, Z. Combustion, performance and emission characteristics of a DI diesel engine fueled with ethanol–biodiesel blends. Fuel 2011, 90, 1743–1750. [Google Scholar] [CrossRef]
  45. Myers, R.H.; Khuri, A.I.; Carter, W.H. Response surface methodology: 1966–l988. Technometrics 1989, 31, 137–157. [Google Scholar] [CrossRef]
Figure 1. Schematic diagram of diesel engine [Reprinted with permission from [23] Copyright 2003 Elsevier].
Sustainability 13 07345 g001
Figure 2. Change in air–fuel (A/F) ratio with engine load for biodiesel with N-octanol additive.
Sustainability 13 07345 g002
Figure 3. Change in brake specific fuel consumption (BSFC) with engine load for biodiesel with iso-octanol additive.
Sustainability 13 07345 g003
Figure 4. Change in BTE with engine load for biodiesel with N-octanol additive.
Sustainability 13 07345 g004
Figure 5. Change in CO2 emission with engine load for biodiesel with iso-octanol additive.
Sustainability 13 07345 g005
Figure 6. Change in CO emission with engine load for biodiesel with iso-octanol additive.
Sustainability 13 07345 g006
Figure 7. Change in HC emission with engine load for biodiesel with iso-octanol additive.
Sustainability 13 07345 g007
Figure 8. Change in air–fuel (A/F) ratio emission with engine load for biodiesel with N-butanol additive.
Sustainability 13 07345 g008
Figure 9. Change in BSFC with engine load for biodiesel with N-butanol additive.
Sustainability 13 07345 g009
Figure 10. Change in BTE with engine load for biodiesel with N-butanol additive.
Sustainability 13 07345 g010
Figure 11. Change in CO2 ratio emission with engine load for biodiesel with N-butanol additive.
Sustainability 13 07345 g011
Figure 12. Change in CO emission with engine load for biodiesel with N-butanol additive.
Sustainability 13 07345 g012
Figure 13. Change in HC emission with engine load for biodiesel with N-butanol additive.
Sustainability 13 07345 g013
Figure 14. BTE response for load with varying percentages of N-bctanol alcohol additive.
Sustainability 13 07345 g014
Figure 15. BTE response for load with varying percentages of N-butanol alcohol additive.
Sustainability 13 07345 g015
Figure 16. CO emission response for load and with varying percentages of N-octanol and N-butanol alcohol additive.
Sustainability 13 07345 g016
Figure 17. CO2 emission response for load and with varying percentages of N-octanol and N-butanol alcohol additive.
Sustainability 13 07345 g017
Figure 18. HC emission response for load and with varying percentages of N-octanol and N-butanol alcohol additive.
Sustainability 13 07345 g018
Table 1. Details of engine specifications.
Sl. No.Engine Specifications
1Make: Kirloskar
2No. of cylinders: 1
3No. of strokes: 4
4Fuel: Diesel, Biodiesel
5Rated power: 5.7 kw at 1500 RPM
6Cylinder diameter: 87.5 mm
7Stroke length: 110 mm
8Compression ratio: 17.5:1
9Air orifice diameter: 20 mm
10Cooling type: Water
11Volume: 990 cc
12Nozzle type/diameter: 3-hole/0.25 mm
13Injector pressure: 190 bar
14Injection time: 23° before TDC
Table 2. The load of the engine is expressed in kg, Nm and kW.
SLSpeed (rpm)Load (kg)Torque(N-m)Brake Power (kW)
1.150035.40.9
2.1500610.91.8
3.1500916.32.6
4.15001221.83.4
Table 3. Properties of Calophyllum inophyllum oil.
PropertiesUnitValue
Flash Point°C210
Fire Point°C220
Densitykg/m3820
Kinematic Viscosity
@40 °C
cSt3.81
Calorific ValueMJ/Kg37.50
Table 4. Properties of N-octanol.
PropertiesValue
Chemical formulaC8H18O
AppearanceColourless liquid
Density 15 °C830 kg/m3
Viscosity7.36 mm2s−1
Molecular Weight130.231 g/mol
Table 5. Properties of N-butanol.
PropertiesValue
Chemical formulaC4H10O
Molar mass74.121 g/mole
AppearanceColorless liquid
Density 15 °C 810 kg/m3
Viscosity4.1482 mm2s−1
Molecular Weight74.12 g/mole
Table 6. Composition of experimented Calophyllum inophyllum (BD) biodiesel blends.
BlendBiodiesel (BD) ContentN-octanol (A)
Content
N-butanol (N) ContentDiesel (D) Content
BD20D8020%NilNil80%
BD20A5D7520%5%Nil75%
BD20A10D7020%10%Nil70%
BD20A15D6520%15%Nil65%
BD20N5D7520%Nil5%75%
BD20N10D7020%Nil10%70%
BD20N15D6520%Nil15%65%
BD20A10N10D6020%10%10%60%
Table 7. Characterizing properties of all blends.
BlendsCalorific ValueKinematic ViscosityFlashpointFire Point
UnitKJ/kgcst°C°C
Diesel43,0003.455260
BD20+80D40,426.632.937078
BD20+5N+75D
(N-butanol)
36,227.883.488692
BD20+10N+70D
(N-butanol)
34,078.893.54100110
BD20+15N+65D
(N-butanol)
31,928.963.59122130
BD20+5A+75D
(N-octanol)
40,035.223.466674
BD20+10A+70D
(N-octanol)
36,535.423.498088
BD20+15A+65D
(Iso-Octanol)
30,083.663.5492104
BD20+10A+10N+60D25,885.033.66110120
Table 8. Uncertainty and accuracy levels of performance and emission parameters.
ParametersAccuracy (±)Uncertainty (%)
BP (kW)-±0.3
BTE (%)-±0.5
BSFC (kg/kWh)-±0.6
CO emission (%)±0.01%±0.5
NOx emission (ppm)±8 ppm±0.6
HC emission (ppm)±8 ppm±0.45
Smoke meter (HSU)±1±0.5
Table 9. Comparative analysis of present work with the previous results.
ParametersAlcohol UsedBSFCBTECO2COHC
Present studyN-octanol15.5% decrease87.5% decrease8% decrease15.62% decrease20% decrease
Raj et al. [40]Pentanol1.8% increase1.4% decrease-7.3% decrease1.1% decrease
Raj et al. [40]Butanol0.9% decrease1.4% increase-21.9% decrease24% decrease
Emiroğlu et al. [41]Butanol5.7% increase0.4% decrease-17.6% decrease7.1% increase
Emiroğlu et al. [41]Ethanol8.5% increase0.4% decrease-17.6% decrease7.1% increase
Emiroğlu et al. [41]Methanol2.8% increase0.4% decrease-17.6% decrease14.2% increase
Singh et al. [42]Ethanol0%5.9% decrease 42.8% decrease14.5% increase
Khan et al. [43]Ethanol34% increase1.3% increase---
Zhu et al. [44]Ethanol4.3% increase15.4% increase 1% increase2% decrease
Table 10. ANOVA of BTE with N-octanol alcohol.
SourceDFAdj SSAdj MSF-Valuep-Value
Model51209.48241.89718.680.000
Linear2484.47242.23318.710.000
Load1101.57101.5657.840.019
Alchohol1382.90382.90029.570.000
Square2692.87346.43426.760.000
Load∗Load12.762.7560.210.654
Alchohol∗Alchohol1690.11690.11353.300.000
2-Way Interaction132.1532.1492.480.146
Load∗Alchohol132.1532.1492.480.146
Error10129.4712.947
Total151338.96
Table 11. ANOVA of BTE with N-butanol alcohol.
SourceDFAdj SSAdj MSF-Valuep-Value
Model51209.48241.89718.680.000
Linear2484.47242.23318.710.000
Load (kg)1101.57101.5657.840.019
Alcohol (%)1382.90382.90029.570.000
Square2692.87346.43426.760.000
Load (kg)∗Load (kg)12.762.7560.210.654
Alcohol (%)∗Alcohol (%)1690.11690.11353.300.000
2-Way Interaction132.1532.1492.480.146
Load (kg)∗Alcohol (%)132.1532.1492.480.146
Error10129.4712.947
Total151338.96
Publisher’s Note: MDPI stays neutral with regard to jurisdictional claims in published maps and institutional affiliations.

