Abstract
The relationships between a variety of hydro-meteorological variables and irrigation water use rates (WUR) were investigated in this study. Standardized Precipitation Index (SPI), Potential Evapotranspiration (PET), and Normalized Difference Vegetation Index (NDVI) were explored to identify the relationship with the WUR. The Yeongsan river basin, the agricultural land of which is mostly occupied by well-irrigated paddy, was used for the pilot study. Four different temporal scales of SPI-3, 6, 9, and 12 were tested, and PET was calculated using the Thornthwaite method. To calculate NDVI, the surface spectral reflectance data, which was acquired by Moderate Resolution Imaging Spectroradiometer (MODIS) equipped on the Terra satellite, were used. As a result, there was a statistically significant relationship between SPI9 and the WUR during drought periods in which negative values of SPI9 were obtained. The WUR was strongly correlated with both PET and NDVI. Compared with SPI, the variability of WUR in this study area was more sensitively affected by PET and NDVI, which can cause a potential lack of agricultural water supply. The finding of this study implies that SPI9, PET, and NDVI are the critical factors for predicting water withdrawal during drought conditions so that they can be used for irrigational water use management. Although a part of the findings of this study has been discussed by a few previous studies, this study is novel in that it quantifies the relationship between these factors using actual field observations of streamflow withdrawal for irrigation.
1. Introduction
The impact of drought on water resources systems is quantified by a variety of methods since there are various definitions of drought. Therefore, there is no consensus on the evaluation of the duration and severity of the drought [1]. In general, drought can be generally classified into four categories: Meteorological, agricultural, hydrological, and socioeconomic drought [1,2]. Among various drought indexes, meteorological drought index has been widely used due to its straightforward definition and easy data accessibility. SPI (Standardized Precipitation Index [3]) is a well-known meteorological drought index characterizing a lack of precipitation on a range of timescales [4,5].
On the other hand, SDI (Streamflow Drought Index) has been used as a hydrologic drought index, which is based on the same calculation methodology with the SPI. SDI is defined as a shortage of streamflow comparing to its normal condition [6,7,8]. To define a drought condition, i.e., to judge whether there is lack of streamflow, the proper value for threshold level should be determined. Here, the threshold level is generally investigated using flow-duration curve of seasonal, monthly, and daily scale [9]. Therefore, the drought condition is defined as a period when the streamflow is less than the threshold value. For drought management, SDI analysis is preferred in the regions where the amount of streamflow withdrawals dominates the total water supply, as the shortage of streamflow directly leads to the lack of water supply. Hence, a drought management plan for regions where the streamflow is a dominant source for the water supply should be established by considering hydrologic drought information.
Water shortages arise from natural variability but also anthropogenic impacts, such as water diversions and withdrawals. In relation to agricultural water use, since persistent meteorological droughts also lead to a decrease in soil moisture, dependence on streamflow withdrawals increases to compensate for the lack of precipitation. Then, it eventually causes further decrease in streamflow. To prevent the risk of water shortage, a soft-path solution, which includes smart technologies and policies that focus on optimal operation and efficiency of water supply systems, has been widely used [10]. The soft-path solution [11] aims to improve the overall efficiency of water supply rather than adopting new sources [12,13]. For example, it delivers diverse water services to meet water demand at a community level [14].
The soft-path solution has various uncertainty sources which can be reduced by the data collection and regarding analysis. The prediction of water availability is one of the critical tasks in water resources management because a proper water use strategy should be preceded for sustainable water use, especially under intense drought conditions. Besides, water use can be a key variable for the prediction of water availability. In the case of agricultural water use, it has been well-known that the water use/withdrawal data are strongly correlated with meteorological variables. Under the below-normal conditions of water availability, such as rivers, lakes, and reservoirs, it can cause a severe water shortage due to high water demand. Then, it eventually threatens water supply and associated food production [15,16,17].
Therefore, this study aims to identify the relationships between meteorological variables and irrigation water use rates based on the assumption that water withdrawal for agricultural use is affected by natural weather conditions. For this purpose, this study explores the relationship between drought conditions and the amount of irrigation water withdrawal from the river. Various drought indicators, such as meteorological drought index, potential evapotranspiration (PET) and Normalized Difference Vegetation Index (NDVI) are investigated in this study.
2. Materials and Methods
2.1. Procedure
First, a wide range of SPI are calculated using the cumulative precipitation series in consecutive periods of 3-, 6-, 9-, and 12-month. The PET, which is highly correlated with agricultural drought, are calculated using Thornthwaite method [18]. NDVI, which is well-known as an agricultural drought assessment index, are calculated using the remote sensing data. Irrigation water withdrawal from the river is adopted for water use rate (WUR) data. This study then explores the relationship between SPI, PET, NDVI and WUR (Figure 1).
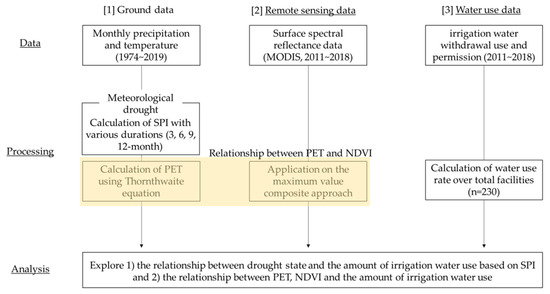
Figure 1.
Research procedure and data used in this study.
2.2. Target Watershed
The target watershed is the Yeongsan river basin, located in the southwestern part of the South Korea (Figure 2a). The Yeongsan river basin is still an agricultural-based watershed even after the rapid industrialization of South Korea since 1960s. The total area of the basin is approximately 3455 km2, and 85% of land use is occupied by forest and agricultural land. The agricultural land can be divided into two different types, a well-irrigated paddy where irrigation water is stably secured from irrigation facilities and rain-fed paddy where irrigation water depends on natural rainfall. The well-irrigated paddy occupies 70% of the entire Yeongsan river basin, thus Yeongsan river basin is very dependent on streamflow withdrawal for irrigation. Figure 2b shows that streamflow withdrawal facilities irrigation, the total number of facilities is 230. The size of the circle in Figure 2b represents the amount of permitted water withdrawal authorized by the government. The streamflow withdrawal facilities are evenly distributed across upstream and downstream of the watershed, but most of large-scale facilities are located downstream. The average amount of permitted water withdrawal is 25,041 m3/day, the largest amount is 1,086,220 m3/day, and the smallest amount is 120 m3/day. 161 facilities are permitted to use 0~10,000 m3/day of streamflow, and 59, 9, and 2 facilities are permitted to use 10,000~100,000 m3/day, 100,000~500,000 m3/day, and more than 500,000 m3/day of streamflow, respectively.
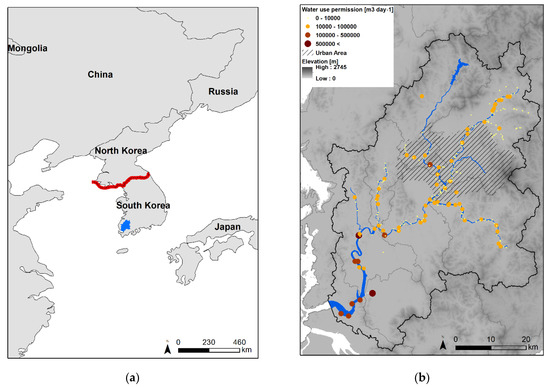
Figure 2.
Yeongsan river basin located in southwestern of the South Korea; (a) the Yeongsan river basin of South Korea; (b) Streamflow withdrawal permit for irrigation water use in the Yeongsan river basin.
Ministry of Environment of South Korea has managed the provision of water use permission to users of streamflow to prevent over-exploitation of streamflow. The total amount of authorized withdrawal is limited to the amount of the reference flow, which refers to the 10-year frequency of the low flow. Here, the low flow is defined as the value of the flow rate, which is maintained above more than 355 days in a year. This has been considered as the standard value of streamflow to be secured for the sustainability of the water environment in South Korea. The amount of water withdrawal from the river is monitored by monthly, and the amount of actual withdrawal is controlled when a severe drought occurs. The WUR is defined in this study as the ratio of water withdrawal from the river per water use permission. The dataset of WUR was collected from 2011 to 2018.
The irrigation water for rice paddy is mainly supplied from streamflow withdrawal facilities. Starting with the farming season, streamflow withdrawal begins in April, and the WUR becomes the highest in June, and then the WUR drops in September and becomes nearly zero in October (Figure 3). By comparing inter-annual variability of the WUR, it was observed that the highest WUR was in 2017. The year 2017 was a dry year given that the amount of total precipitation (903.6 mm) was about two third compared to the annual mean precipitation (Figure 4). It implies that less precipitation may cause higher WUR to compensate for the lack of surface run-off into the agricultural land.
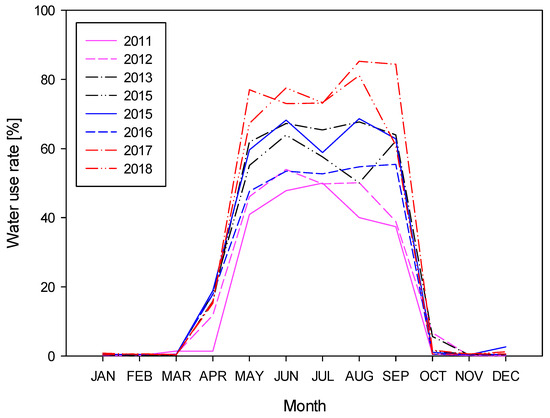
Figure 3.
The irrigation water use rate in Yeongsan river basin.
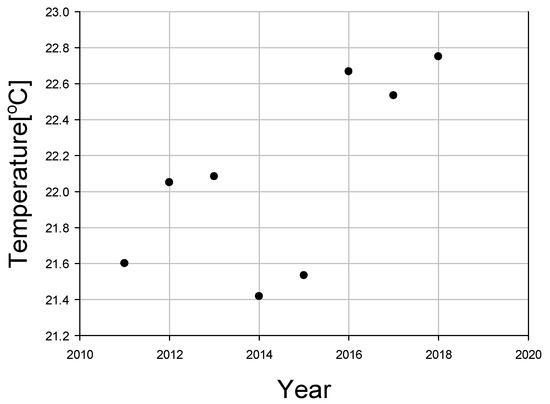
Figure 4.
Change in average temperature from April to September.
There was an increasing trend in irrigation water use rate. Although the record length is short, Figure 4 shows the change in average temperature from April to September. There are strongly increasing trends. The increase in temperature led to an increase in evapotranspiration and a decrease in soil moisture. Therefore, recently there was increasing in irrigation water use.
2.3. Meteorological Data
The meteorological data were collected from automated synoptic observing system (ASOS) which has been operated by Korea Meteorological Administration (KMA). The general climate characteristics of South Korea are represented as humid climate with high temperature in summer and dry climate with low temperature in winter. While 52% of annual precipitation is concentrated in summer (three months from June to August) due to the effect of East Asia Monsoon. Figure 5 showed monthly precipitation, temperature, and PET for 8 years (2011–2018). The average annual precipitation in the Yeongsan river basin was 1375 mm (Figure 5a), and the average annual temperature was 14.3 °C. The monthly mean temperature was the highest at 27 °C in August, on the contrary it was the lowest at 0.4 °C in January (Figure 5b).
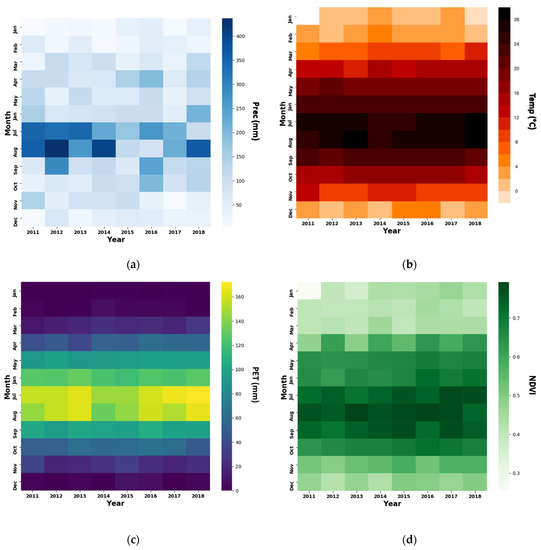
Figure 5.
Monthly precipitation, temperature, PET and NDVI in 2011–2018 in study area. (a) Precipitation; (b) Mean temperature; (c) PET; (d) NDVI.
PET was calculated using the Thornthwaite equation which uses observed temperature and latitude as input variables [18]. PET in July (159.1 mm) and August (152.3 mm) were largest as similar to the monthly temperature seasonality, and 46% (631.2 mm) of the annual PET was concentrated from May to September.
2.4. NDVI
The NDVI is a well-known indicator for monitoring vegetation conditions using the remote sensing technique. The pigments of chlorophyll content in the vegetation absorb the solar radiance in the wavelength of visible light (approximately 400 nm to 700 nm) for the photosynthetic process, and strongly reflects the near-infrared (NIR) light (approximately 700 nm to 1100 nm). Therefore, the value of NDVI is calculated by Equation (1), representing the normalized difference between absorptive and reflective reflectance to enhance the signals of vegetations photosynthesis [19,20],
where NIR and RED are the spectral reflectance of the near-infrared band, and the visible red band in the multi-spectral data, respectively. The values of NDVI are always calculated in the range from −1.0 to 1.0. The values of NDVI from 0.5 to 1.0 indicates the highly vegetated regions, while the values less than 0 are typically shown in the regions without vegetations such as water or soil regions.
NDVI = (NIR − RED)/(NIR + RED)
In this study, the surface spectral reflectance data, acquired by Moderate Resolution Imaging Spectroradiometer (MODIS) equipped on Terra satellite, were used to calculate NDVI for the study area. The various types of the Terra/MODIS data are freely available through the Land Processes Distributed Archive Center (LP DAAC) within NASA Earth Observing System Data and Information System (EOSDIS) [21]. In this study, the atmospherically corrected surface reflectance data acquired within the 8-day composite period, which is called MOD09A1 product, were employed to calculate the spatial distribution of NDVI for 8 years (2011–2018). The NDVI distributions for 8-day intervals, were processed as the monthly NDVI distribution using the maximum value composite (MVC) approach [22]. Figure 6 shows the spatial distribution of averaged NDVI. In summer (from June to August), the values of NDVI higher than 0.5 account for 87.8% of this study area while it tended to decrease as 11.3% in winter (from December to February). The monthly variation of NDVI were a quite large in South Korea. It generally began to increase from April and reached the highest in August (Figure 5d).
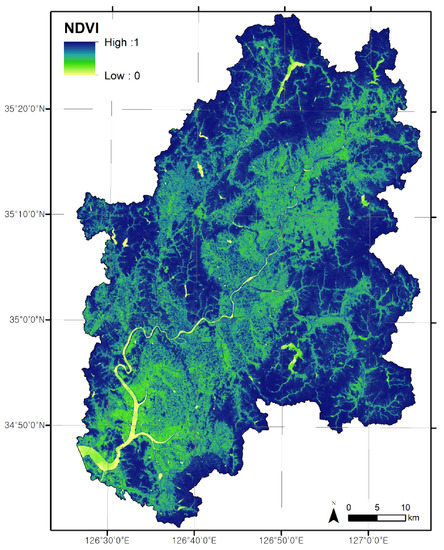
Figure 6.
The spatial distribution of averaged NDVI in Yeongsan river basin.
3. Results
3.1. Relationship between SPI and WUR
SPI was calculated based on the cumulative precipitation of 3, 6, 9, and 12 monthly time scales (Figure 7). The X-axis represents time, and Y-axis represents different time scales of SPI (SPI3, SPI6, SPI9, and SPI12). Regardless of the time scales, the most severe drought has occurred in 1995 (i.e., 3-month SPI: −1.66; 6-month SPI: −2.46; 9-month SPI: −2.17; 12-month SPI: −2.31) and followed by severe droughts in 1978, 1988, 2009, and 2018 (Table 1). It seems that a drought event occurs with a 10-year cycle, which implies that water resources management has been exposed to drought risk frequently with approximate decadal cycle.
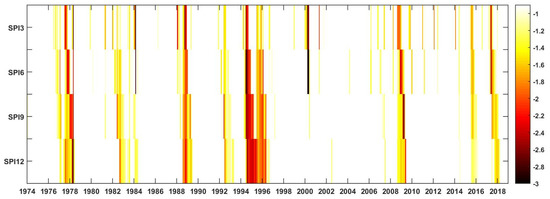
Figure 7.
SPI3, SPI6, SPI9, SPI12 in Yeongsan river basin.

Table 1.
Major droughts of Yeongsan river basin.
Figure 8 represents SPI time-series (red lines with right-vertical axis) and the WUR (blue bars with left-vertical axis) from 2011~2019. It is difficult to find the relationship between SPI time-series and the WUR. It only shows that the WUR gradually increases over time. However, interestingly, it is found that the WUR was the highest during the severe drought in 2017. To explore the relationship under only the drought conditions, scatter plots for the WUR and SPI, where the values are less than zero are presented in Figure 9, whereby only the cultivating periods, May to September, are plotted.
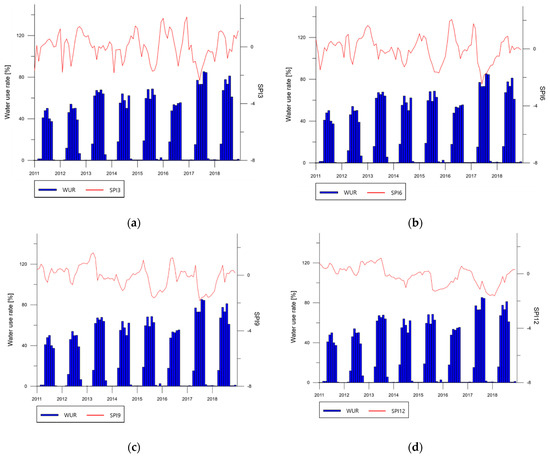
Figure 8.
Time series of SPI and irrigation water use rate. (a) SPI3; (b) SPI6; (c) SPI9; (d) SPI12.
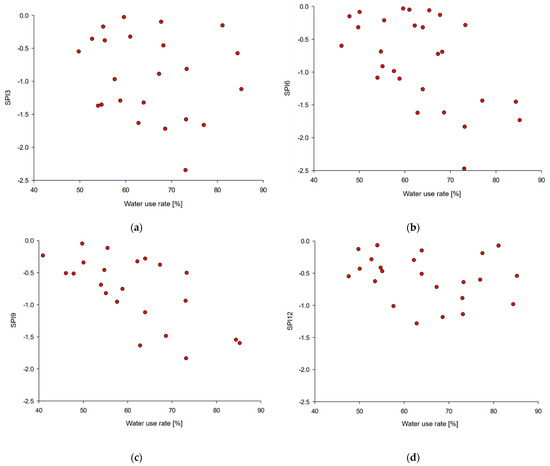
Figure 9.
SPI (SPI < 0) and irrigation water use rate (WUR) from May to September. (a) 3-month; (b) 6-month; (c) 9-month; (d) 12-month.
As shown in Figure 9, it seems that there is a negative correlation between the WUR and drought conditions indicated by SPI6 to SPI9. In particular, the highest correlation was shown in SPI9, the least correlation was shown in SPI12 (Table 2). Generally, the drought is relieved by passing wet summer season (June to August under strong seasonality with temperate climate), thus, drought rarely last longer than a year in Korean Peninsula. As mentioned above, the relationship between the severe drought and the WUR was demonstrated, and it was found that longer accumulative duration shows stronger relationship with the WUR unless it persists longer than a year.
Table 2.
Correlation analysis with irrigation water use rate and SPI.
The Pearson correlation coefficient [23] and Spearman rank correlation coefficient [24,25] were calculated to analyze the correlation between SPI and the WUR for different drought durations (3-, 6-, 9- and 12-month). Pearson correlation coefficient reflects the magnitude of the linear relationship represented by a parametric method, and Spearman correlation coefficient shows the monotonic relationship between two variables expressed by a non-parametric method. Both correlation coefficients return closer value to 1 (or −1) when the two different datasets have a strong positive (or negative) relationship. Ebi et al. [26] assumed a linear or monotonic increase in global or regional temperatures can lead to inefficient planning processes that under-estimate the magnitude, pattern, and timing of the risks faced by human and natural systems. PET is often modelled as a function of temperature alone, thus a temperature-based method was adopted to calculate PER in this study. Therefore, the relationships between a variety of hydro-meteorological variables and irrigation WUR were investigated through Spearman and Pearson correlation coefficients. The correlation coefficients between the SPI with different accumulation period and the WUR were summarized in Table 2. The calculated Spearman correlation coefficients (rs) range from −0.195 to −0.561, and the Pearson correlation coefficients (r) range from −0.187 to −0.667. Absolute value of both r and rs were calculated as less than 0.3 (i.e., above than −0.3) with SPI3 and SPI12. On the other hand, SPI6 and SPI9 showed statistically significant negative correlation. Especially, SPI9 shows the strongest correlation with the WUR.
3.2. Relationship between PET, NDVI and WUR
The evapotranspiration (ET) is very important factor in designing of hydraulic facilities and planning of agricultural irrigation. Despite that, there is no available observed data of ET in the study area. Therefore, in this study, the PET was alternatively estimated, based on the mean temperature (Figure 5c) using the Thornthwaite method [18]. Then, the relationship between PET and WUR was quantitatively explored by correlation analyses.
As shown in Figure 5c, The PET in Yeongsan river basin has strong monthly variability since PET is strongly affected by temperature. The annual PET was about 788 mm for 8 year. Figure 10 shows the relationship between PET and WUR. As the Spearman and Pearson correlation coefficients were 0.86, and 0.90, respectively, so that the relationship between two variables could be implied to have a strong monotonic and linear relationship. The significance probability (p-value) for both the Spearman and Pearson correlation coefficients calculated in this study were less than 0.01, which implies that the estimated PET in Yeongsan river basin has statistically significant correlation with WUR under 1% of significance level. Therefore, a linear regression model was developed using the ordinary least square (OLS) method to quantify the relationship between PET and WUR, as shown in Figure 10. The performance of the constructed regression model was evaluated by the coefficient of determination (R2) and the root mean squared error (RMSE). The regression model returned fair prediction results with 0.81 of R2 and 12.88 of RMSE.
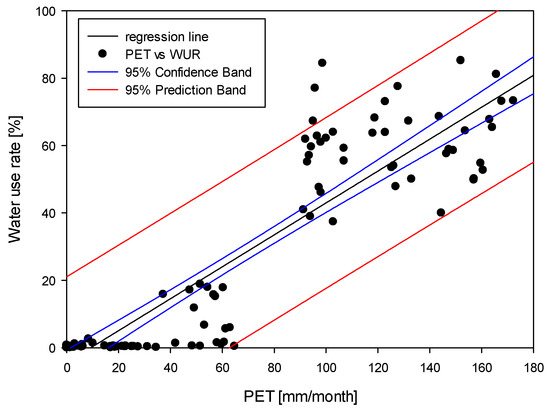
Figure 10.
The spatial distribution of averaged NDVI in Yeongsan river basin.
As shown in Table 2 and Figure 10, the WUR was more affected by the PET than the SPI. Meanwhile, several related studies have reported that the PET or Actual ET was strongly correlated to NDVI [27,28,29]. It can be inferred that the strong correlation between NDVI and PET is due to the photosynthetic activity of vegetation in the agricultural land. The increase in the remotely observed NDVI values in the study area means that the crops in the area actively grow by photosynthetic process. The vegetation consumes the soil moistures as part of the natural process, and this process potentially increases the amount of transpiration. Consequently, the increase in NDVI values can lead to an increase in the amount of PET which can eventually cause the water loss.
Figure 11a shows the relationship between PET and NDVI in this study. As discussed above, the correlations between two variables were statistically significant as the correlation coefficients were over 0.9 (p-value < 0.05) for both Spearman and Pearson correlation analyses. Based on the results of correlation analyses, the feasibility of the use of NDVI for quantitative prediction of the WUR was also investigated as shown in Figure 11b. The NDVI was also highly correlated to the WUR with the correlation coefficients over 0.8 (p-value < 0.05) for both Spearman and Pearson correlation. The linear regression model constructed by OLS method yielded the prediction results with 0.63 of R2 and 17.98 of RMSE. The performance of the linear regression model was relatively inaccurate than the regression model using PET. Despite that, this approach based on the satellite data could be attractive to couple with various meteorological and hydrological data.
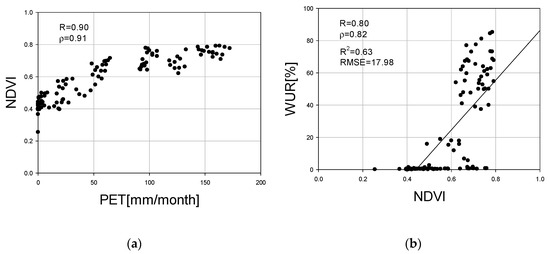
Figure 11.
The linearity analysis of irrigation WUR and PET. (a) Relationship between PET and NDVI; (b) relationship between NDVI and WUR.
4. Discussion
In this study we quantitatively analyzed the relationship between the WUR and hydro-metrological variables (SPI, PET, and NDVI) collected in the agricultural land. The major result was as follows; WUR was highly correlated with PET and NDVI while the WUR was less sensitive to SPI (<0, from May to September). We inferred that these results could be caused by following reasons. First, the agricultural land in this area was mainly occupied by the rice paddy, and the irrigated paddies which are supplied with water by the irrigation facilities around the stream accounting for 70% of the total farmland area. The optimum average daily temperature for rice cultivation is about 20–22 °C, and the growth of this kind of crops is notably activated from July to August when the optimum temperate is satisfied under the climatic condition of this area. This seasonal trend could be also described by the Figure 5d which illustrated that the values of NDVI reached to the maximum value in the summer season. Moreover, as shown in Figure 10, the maximum values for PET were observed in the summer due to simultaneous impacts of both the increase in the transpiration by progressive photosynthesis of crops and the increase in the evaporation by the maximum temperatures in a year. Consequently, seasonal trends of PET and NDVI were significantly dominated by the variability of temperature for a year, and these two variables can be strongly correlated.
We compared the WUR and SPI from April to September for the years 2011 and 2017. A deficit of precipitation from April to September, which consumes large volumes of irrigation water, was occurred in 2017 (Figure 12). It led to more consumption of agricultural irrigation water than non-drought year 2011. Bae et al. [30] investigated propagation from meteorological to hydrological droughts in South Korea. They focused on agricultural reservoir and dam storage levels with SPI. A deficit of precipitation from April to September led to decrease in storage of an agricultural reservoir. It means that a decrease in water sources arose due to lack of precipitation. In this study, it was confirmed that the agricultural water use increased according to the meteorological drought. In addition to the decrease in water source, the increase in water use due to the meteorological drought was expected to accelerate the hydrological drought.
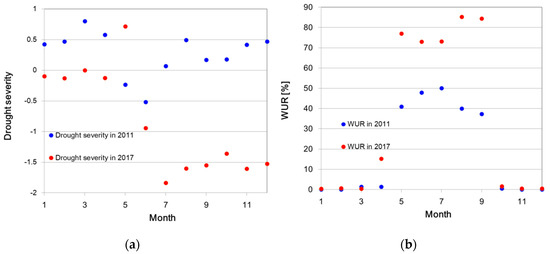
Figure 12.
WUR relative to SPI from April to September in 2011 and 2017. (a) SPI; (b) WUR.
Sung et al. [31] proposed a deep learning-based model to estimate WUR using precipitation and PET. Correlations were explored to identify relationships among accumulated meteorological variables for various time durations (3-, 4-, 5-, and 6-month cumulative) and the WUR, which revealed that the three-month cumulative meteorological variables and the WUR were highly correlated. It was confirmed that SPI9 can be used as a good indicator for WUR prediction. The framework in this study can provide a forecast model for deficiency in stream water use, which is coupled with a weather forecast and SPI for previous consecutive months.
To support the sustainable agricultural production, stable means of agricultural water supplies are required to recharge the soil moisture content which is lost by ET. In the study area where the irrigated paddies are highly occupied, the agricultural water can be supplied by the well-operated irrigation facilities, which intake water from rivers regardless of the occurrence of the meteorological drought. For this reason, the variability of the WUR was more sensitively affected by PET and NDVI, which causes a potential lack of agricultural water supply than the metrological drought factor. Therefore, anthropogenic activity, such as streamflow withdrawal for the agricultural land where the irrigation facilities were sufficiently secured could more securely response to the potential water demand caused by ET rather than the deficiency of precipitation.
The results from this study showed similar trends with the findings of previous studies that investigated the impact of drought intensity on the agricultural production. For instance, Dutta et al. [32] mentioned that NDVI was not significantly affected by SPI in the agricultural area where the irrigation facilities were sufficiently secured. Moreover, Kurukulasuriya et al. [33] and Vanschoenwinkel and Passel [34] emphasized that the type of agriculture, which is dependent on the irrigation system, is less sensitive to the change in local climatic characteristics than the type of rain-fed agriculture.
This study clarified that the amount of streamflow withdrawal in agricultural land eventually depends on the ET and can be consequentially correlated to NDVI. The regression equations empirically derived from the collected data showed highly correlated results for both WUR versus PET and WUR versus NDVI. Therefore, the PET and NDVI should be considered as crucial factors for planning the amount of streamflow intake in agricultural area.
5. Conclusions
Hydrological drought, such as streamflow deficit, causes a water shortage for the community. Therefore, it is necessary to monitor and predict the use of streamflow withdrawal in advance. For this purpose, the relationship between the WUR and drought index, SPI, was investigated. Although the total amount of aggregated precipitation demonstrated a weak relationship, during the drought period in which negative values of SPI occurred, there was a statistically significant relationship between SPI and the WUR. Besides, the longer the cumulative duration of SPI, the higher the correlation, up to nine months. This is due to the seasonality of climate in Korea, confirming the large amount of rainfall during the humid summer season can alleviate drought conditions. Hence, SPI12 has shown no predictability of the WUR, i.e., less correlation was detected. On the contrary, the WUR was highly correlated with PET and NDVI while the WUR was less sensitive to SPI.
Both soft-path and hard-path approaches are seeking the way to manage the water shortages, but hard-path approaches have some disadvantages of costly and complicated decision-making processes. On the other hand, one of the great advantages of the soft-path approaches is the ability to adjust and control the water use so that it can reduce the water deficit in streamflow. The soft-path approaches have also received much attention due to its efficiency. To adjust and limit the water withdrawal on streamflow, monitoring of the water withdrawals and good skill of prediction of the water use must become the highest priority in drought management.
The increasing trend of PET is more rapid than the precipitation in South Korea, which would lead to the decrement of water availability. Water availability is expected to decrease in the future, thus, managing water use and improving efficiencies is required for the security of agricultural water use under the influence of climate change.
Once predictions around the amount of water withdrawal are made, the changes in WUR can be quantified. It will be possible to adjust the volume of water withdrawal. In particular, SPI, PET and NDVI have been widely used in South Korea for drought management and operation due to its easy implementation. Therefore, based on the finding of this study, it implies that these indexes-SPI9, PET, NDVI-can be used for the irrigational water use management. Previous studies have suggested that the amount of water withdrawal of streamflow is dependent on the occurrence of drought, but to the best of the knowledge of the authors, there has been no research conducted using the observed data of water withdrawal from streamflow.
Although some previous studies often implied that the ‘well-irrigated paddy’ has no relation with streamflow deficiency [33,34], this study found that the WUR for irrigation purpose on well-irrigated paddy is strongly affected by prolonged meteorological drought evaluated by such as SPI9. This relationship is clearer under extreme drought conditions. To make the finding of this study more practical to the field, future studies can be implemented with more exhaustive datasets and applied to various agricultural lands.
Author Contributions
Conceptualization, K.-W.S. and J.-H.S.; analysis and writing, J.-H.S.; data collection and figure drawing, D.B., J.-H.S. and Y.R.; writing and typesetting, Y.R.; revision and funding acquisition; S.-B.S. All authors have read and agreed to the published version of the manuscript.
Funding
This study is supported by the 2020 Research Fund of the University of Seoul.
Institutional Review Board Statement
Not applicable.
Informed Consent Statement
Not applicable.
Data Availability Statement
Not applicable.
Acknowledgments
The authors thank to University of Seoul for the support for this research.
Conflicts of Interest
The authors declare that there is no conflict of interest.
References
- Wilhite, D.A.; Glantz, M.H. Understanding the Drought Phenomenon: The Role of Definitions. Water Int. 1985, 10, 111–120. [Google Scholar] [CrossRef]
- American Meteorological Society Meteorological Drought—Policy Statement. In Bulletin of the American Meteorological Society; American Meteorological Society: Boston, MA, USA, 1997; pp. 847–849.
- McKee, T.B.; Doesken, N.J.; Kleist, J. The Relationship of Drought Frequency and Duration to Time Scales. In Proceedings of the 8th Conference on Applied Climatology, Anaheim, CA, USA, 17–22 January 1993; pp. 179–184. [Google Scholar]
- Lorenzo-Lacruz, J.; Vicente-Serrano, S.M.; López-Moreno, J.I.; Beguería, S.; García-Ruiz, J.M.; Cuadrat, J.M. The Impact of Droughts and Water Management on Various Hydrological Systems in the Headwaters of the Tagus River (Central Spain). J. Hydrol. 2010, 386, 13–26. [Google Scholar] [CrossRef]
- Zhai, J.; Su, B.; Krysanova, V.; Vetter, T.; Gao, C.; Jiang, T. Spatial Variation and Trends in PDSI and SPI Indices and Their Relation to Streamflow in 10 Large Regions of China. J. Clim. 2010, 23, 649–663. [Google Scholar] [CrossRef]
- Tallaksen, L.M.; Madsen, H.; Clausen, B. On the Definition and Modelling of Streamflow Drought Duration and Deficit Volume. Hydrol. Sci. J. 1997, 42, 15–33. [Google Scholar] [CrossRef]
- Tallaksen, L.M.; Van Lanen, H.A.J. Hydrological Drought: Processes and Estimation Methods for Streamflow and Groundwater; Elsevier: Amsterdam, The Netherlands, 2004; ISBN 978-0-444-51767-8. [Google Scholar]
- Sung, J.H.; Chung, E.-S. Development of Streamflow Drought Severity-Duration-Frequency Curves Using the Threshold Level Method. Hydrol. Earth Syst. Sci. 2014, 18, 3341–3351. [Google Scholar] [CrossRef]
- Sung, J.H.; Seo, S.B. Estimation of River Management Flow Considering Stream Water Deficit Characteristics. Water 2018, 10, 1521. [Google Scholar] [CrossRef]
- Brooks, D.B.; Holtz, S. Water Soft Path Analysis: From Principles to Practice. Water Int. 2009, 34, 158–169. [Google Scholar] [CrossRef]
- Olmstead, S.M.; Stavins, R.N. Comparing Price and Nonprice Approaches to Urban Water Conservation. Water Resour. Res. 2009, 45. [Google Scholar] [CrossRef]
- Sankarasubramanian, A.; Sabo, J.L.; Larson, K.L.; Seo, S.B.; Sinha, T.; Bhowmik, R.; Vidal, A.R.; Kunkel, K.; Mahinthakumar, G.; Berglund, E.Z.; et al. Synthesis of Public Water Supply Use in the United States: Spatio-Temporal Patterns and Socio-Economic Controls. Earth’s Future 2017, 5, 771–788. [Google Scholar] [CrossRef]
- Das Bhowmik, R.; Seo, S.B.; Das, P.; Sankarasubramanian, A. Synthesis of Irrigation Water Use in the United States: Spatiotemporal Patterns. J. Water Resour. Plan. Manag. 2020, 146, 04020050. [Google Scholar] [CrossRef]
- Gleick, P.H.; Burns, W.C.G.; Chalecki, E.L.; Cohen, M.; Cushing, K.K.; Mann, A.S.; Reyes, R.; Wolff, G.H.; Wong, A.K. The World’s Water 2002–2003: The Biennial Report on Freshwater Resources; Island Press: Washington, DC, USA, 2002; ISBN 978-1-55963-949-1. [Google Scholar]
- Falkenmark, M. Meeting Water Requirements of an Expanding World Population. Philos. Trans. R. Soc. Lond. Ser. B Biol. Sci. 1997, 352, 929–936. [Google Scholar] [CrossRef]
- Döll, P.; Fiedler, K.; Zhang, J. Global-Scale Analysis of River Flow Alterations Due to Water Withdrawals and Reservoirs. Hydrol. Earth Syst. Sci. 2009, 13, 2413–2432. [Google Scholar] [CrossRef]
- Wisser, D.; Fekete, B.M.; Vörösmarty, C.J.; Schumann, A.H. Reconstructing 20th Century Global Hydrography: A Contribution to the Global Terrestrial Network- Hydrology (GTN-H). Hydrol. Earth Syst. Sci. 2010, 14, 1–24. [Google Scholar] [CrossRef]
- Thornthwaite, C.W. An Approach toward a Rational Classification of Climate. Geogr. Rev. 1948, 38, 55–94. [Google Scholar] [CrossRef]
- Rouse, J.W., Jr.; Haas, R.H.; Schell, J.A.; Deering, D.W. Monitoring Vegetation Systems in the Great Plains with Erts. Nasa Spec. Publ. 1974, 351, 309. [Google Scholar]
- Tucker, C.J. Red and Photographic Infrared Linear Combinations for Monitoring Vegetation. Remote Sens. Environ. 1979, 8, 127–150. [Google Scholar] [CrossRef]
- Behnke, J.; Mitchell, A.; Ramapriyan, H. NASA’s Earth Observing Data and Information System—Near-Term Challenges. Data Sci. J. 2019, 18, 40. [Google Scholar] [CrossRef]
- Holben, B.N. Characteristics of Maximum-Value Composite Images from Temporal AVHRR Data. Int. J. Remote Sens. 1986, 7, 1417–1434. [Google Scholar] [CrossRef]
- Pearson, K.; Galton, F. VII. Note on Regression and Inheritance in the Case of Two Parents. Proc. R. Soc. Lond. 1895, 58, 240–242. [Google Scholar] [CrossRef]
- Spearman, C. Demonstration of Formulæ for True Measurement of Correlation. Am. J. Psychol. 1907, 18, 161–169. [Google Scholar] [CrossRef]
- Spearman, C. Correlation Calculated from Faulty Data. Br. J. Psychol. 1904–1920 1910, 3, 271–295. [Google Scholar] [CrossRef]
- Ebi, K.L.; Ziska, L.H.; Yohe, G.W. The Shape of Impacts to Come: Lessons and Opportunities for Adaptation from Uneven Increases in Global and Regional Temperatures. Clim. Chang. 2016, 139, 341–349. [Google Scholar] [CrossRef]
- Cihlar, J.; St.-Laurent, L.; Dyer, J.A. Relation between the Normalized Difference Vegetation Index and Ecological Variables. Remote Sens. Environ. 1991, 35, 279–298. [Google Scholar] [CrossRef]
- Seevers, P.M.; Ottmann, R.W. Evapotranspiration Estimation Using a Normalized Difference Vegetation Index Transformation of Satellite Data. Hydrol. Sci. J. 1994, 39, 333–345. [Google Scholar] [CrossRef]
- Johnson, L.F.; Trout, T.J. Satellite NDVI Assisted Monitoring of Vegetable Crop Evapotranspiration in California’s San Joaquin Valley. Remote Sens. 2012, 4, 439–455. [Google Scholar] [CrossRef]
- Bae, H.; Ji, H.; Lim, Y.-J.; Ryu, Y.; Kim, M.-H.; Kim, B.-J. Characteristics of Drought Propagation in South Korea: Relationship Between Meteorological, Agricultural, and Hydrological Droughts. Nat. Hazards 2019, 99, 1–16. [Google Scholar] [CrossRef]
- Sung, J.H.; Ryu, Y.; Chung, E.-S. Estimation of Water-Use Rates Based on Hydro-Meteorological Variables Using Deep Belief Network. Water 2020, 12, 2700. [Google Scholar] [CrossRef]
- Dutta, D.; Kundu, A.; Patel, N.R. Predicting Agricultural Drought in Eastern Rajasthan of India Using NDVI and Standardized Precipitation Index. Geocarto Int. 2013, 28, 192–209. [Google Scholar] [CrossRef]
- Kurukulasuriya, P.; Mendelsohn, R.; Hassan, R.; Benhin, J.; Deressa, T.; Diop, M.; Eid, H.M.; Fosu, K.Y.; Gbetibouo, G.; Jain, S.; et al. Will African Agriculture Survive Climate Change? World Bank Econ. Rev. 2006, 20, 367–388. [Google Scholar] [CrossRef]
- Vanschoenwinkel, J.; Passel, S. Climate Response of Rainfed versus Irrigated Farms: The Bias of Farm Heterogeneity in Irrigation. Clim. Chang. 2018, 147, 225–234. [Google Scholar] [CrossRef]


Publisher’s Note: MDPI stays neutral with regard to jurisdictional claims in published maps and institutional affiliations. |
© 2021 by the authors. Licensee MDPI, Basel, Switzerland. This article is an open access article distributed under the terms and conditions of the Creative Commons Attribution (CC BY) license (https://creativecommons.org/licenses/by/4.0/).