Article

Interrelationships of Chemical, Physical and Biological Soil Health Indicators in Beef-Pastures of Southern Piedmont, Georgia

Department of Crop and Soil Sciences, University of Georgia, Miller Plant Sciences Building, 3111 Carlton St, Athens, GA 30602, USA
*
Author to whom correspondence should be addressed.
Sustainability 2021, 13(9), 4844; https://doi.org/10.3390/su13094844
Submission received: 2 March 2021 / Revised: 21 April 2021 / Accepted: 23 April 2021 / Published: 26 April 2021
(This article belongs to the Special Issue Agroecological Approaches for Soil Health and Water Management)

Abstract

:
The study of interrelationships among soil health indicators is important for (i) achieving better understanding of nutrient cycling, (ii) making soil health assessment cost-effective by eliminating redundant indicators, and (iii) improving nitrogen (N) fertilizer recommendation models. The objectives of this study were to (i) decipher complex interrelationships of selected chemical, physical, and biological soil health indicators in pastures with history of inorganic or broiler litter fertilization, and (ii) establish associations among inorganic N, potentially mineralizable N (PMN), and soil microbial biomass (SMBC), and other soil health indicators. In situ soil respiration was measured and soil samples were collected from six beef farms in 2017 and 2018 to measure selected soil health indicators. We were able to establish associations between easy-to-measure active carbon (POXC) vs. PMN (R2 = 0.52), and N (R2 = 0.43). POXC had a noteworthy quadratic relationship with N and nitrate, where we found dramatic increase of N and nitrate beyond an inflection point of 500 mg kg−1 POXC. This point may serve as threshold for soil health assessment. The relationships of loss-on-ignition (LOI) carbon with other soil health indicators were discernable between inorganic- and broiler litter-fertilized pastures. We were able to establish association of SMBC with other soil variables (R2 = 0.76) and there was detectable difference in SMBC between inorganic-fertilized and broiler litter-fertilized pastures. These results could be useful for cost-effective soil health assessment and optimization of N fertilizer recommendation models to improve N use efficiency and grazing system sustainability.

1. Introduction

Soil is a complex and dynamic ecosystem; hence, a deep understanding of complex interrelationships between soil health indicators is required for sustainable utilization of this non-renewable resource. There is no single indicator that can describe the overall state of soil health and productivity [1,2]; thus, several indicators are used for that purpose [3]. However, many indicators provide redundant information; thus, the study of their interrelationship is very important for cost-effective assessment of soil health. Moreover, soil health is highly affected by climate and management [4,5,6,7], and a deeper understanding of interrelationship between soil health indicators and management factors [8], such as fertilizer source and grazing system, is highly important [9].
Chemical indicators are the oldest and most studied indicators of soil health and they still remain the most important ones from farmer’s perspective, although biological, physical, and biochemical indicators are equally important [3], if not more [10]. Nitrogen fertilizer remains one of the most important inputs in agricultural production [11]; hence, soils’ ability to store and release nitrogen has always been a high priority research area among soil scientists. Traditional fertilizer recommendation models typically depend on the soil test value of the nutrient and plant requirement; however, advances have been made to utilize other soil health indicators for optimum fertilizer recommendation [10,12,13].
In this manuscript we focused on several chemical indicators (potentially mineralizable nitrogen, inorganic nitrogen, loss on ignition carbon, permanganate oxidizable carbon, Mehlich-I phosphorus) of soil health, along with one physical (bulk density) and two biological indicators (soil respiration and soil microbial biomass). The main goal of this research was to analyze and report the interrelationships of selected soil health indicators and to provide generalized models for predicting soil microbial biomass and N availability, by utilizing a large number of soil-samples from multiple locations and two common grazing systems in the Piedmont region of Georgia.

2. Materials and Methods

2.1. Study Sites

Soil samples were collected from six study sites (Figure 1), including twelve grazed-pastures and one hay field, between May 2017 and July 2018 (Table 1). JPC and ADS (two of the sites) are research pastures owned by University of Georgia, whereas WF, TC, TH and FC are farmers’ fields in Northeastern Georgia. A detailed description of the pasture characteristics is shown in Table 1. The study area has a hot humid sub-tropical climate with mean minimum annual temperature of 10.4–11.1 °C, mean maximum annual temperature of 22.5–25.6 °C and mean annual rainfall of 1190–1230 mm.

2.2. In Situ Soil Respiration and Soil Sampling

In JPC and ADS pastures, soil samples (0–5, 5–10, and 10–20 cm) were collected from 1020 locations in July 2017 and July 2018 by using a 5-cm diameter Giddings hydraulic probe (Giddings Machine Corporation, Windsor, Colorado). Two replicate soil samples were collected from each sampling location which resulted in 2040 soil samples. On the day of soil sampling, in situ alkali traps, containing 1 mol L1 Sodium Hydroxide (NaOH) were installed in a static PVC chamber that was inserted to a 5-cm soil depth to measure soil respiration as described by Anderson [14]. After 24 h, alkali traps were brought to the lab and Barium Chloride (BaCl3) was added to precipitate the CO2 captured by NaOH, then residual NaOH was titrated with 1 N HCl (Hydrochloric acid) to calculate the amount of CO2 produced by soil respiration in 24 h. Similarly, in WF, TC, TH, and FC pastures, soil samples were collected in the same manner as JPC and ADS, however only at 0–10 cm soil depth, resulting in 204 samples.

2.3. Soil Analysis

Soil samples were air-dried for two weeks, ground, and sieved (2-mm mesh) then stored in air-tight plastic bags for further analysis. Bulk density for each soil core was measured following the USDA Soil Survey Laboratory Methods Manual [15]. Samples were analyzed for Loss-on-Ignition Carbon using the combustion method as described in the USDA Soil Survey Laboratory Methods Manual [15]. Two replicate cores were then composited for further analysis, which resulted in a total of 1020 samples from JPC and ADS pastures, and a total of 102 samples from other pastures. Permanganate Oxidizable Carbon was analyzed by using the method described by Weil et al. [16]. Soil Microbial Biomass was measured using the method described by Vance et al. [17], in a smaller subset of the samples. Soil samples were extracted using 2 mol L1 KCl [18] then NH4+-N was measured as described in Kempers and Zweers [19] and the NO3-N was measured as described by Doane and Horwath [20]. Inorganic N was calculated as the sum of NH4+-N and NO3-N fractions from 2 mol L1 cold KCl extraction. Potentially mineralizable N was measured using the hot KCl extraction method [21], In this method, 20 mL of 2 mol L1 KCl was added to 3 g of soil, heated at 100 °C for 4 h in a hot water bath, allowed to cool to room temperature, and filtered through Whatman #42 filter paper. Then the supernatant was analyzed for NH4+-N as described by Kempers and Zweers [19]. Potentially mineralizable N was calculated by subtracting cold KCL extracted NH4+-N from hot KCl extracted NH4+-N. Plant available P (Mehlich-I P) was measured using the method described by Mehlich [22]. Clay percentage in each sample was calculated from NRCS_USDA (Web Soil Survey) [23] and first-order soil survey conducted by NRCS in the pastures. Clay percentage was not used in the analysis due to coarse resolution of the data, but could be useful for interpretation of some results.

2.4. Statistical Analysis

All data processing and analysis was done using R Statistical Software [24]. Stepwise backward selection method, with minimum AIC [25], was used to identify variables. The dependent variable and a multiple regression model was fit using selected variables. The regression model was defined as
Y = Xβ + ε
where, Y denotes the response variable, X denotes the matrix of explanatory variable, β denotes the vectors of regression coefficients, and ε denotes the vector of random error term. Several simple linear regression models were fit between different variables to understand their interrelationships as follows:
y = β0 + β1x + ε
where y is the response variable, x is the predictor variable, β0 is the intercept of the model, β1 is the slope, and ε is the error term.
For some variables, a quadratic model was more suitable:
y = β0 + β1x + β2x2+ ε
where y is the response variable, x is the predictor variable, β0 is the intercept of the model, β1 is the regression coefficient related to x, β2 is the regression coefficient related to the quadratic term, and ε is the error term.
In addition, a factor analysis of mixed data (FAMD) was conducted to identify variables contributing most to the overall variance of the dataset as suggested by [26]. FAMD is a Principal Component Analysis (PCA) method which allows both categorical and quantitative variables. All variables were normalized in order to balance the effect of each set of variables.

3. Results and Discussion

3.1. Summary Statistics of Soil Health Indicators

A summary of all variables under study, grouped by soil-depth and fertilizer management systems, is presented in Table 2. Except bulk density, there was a general decrease in all soil parameters with soil increasing depth. Bulk density was highest in the 5–10 cm depth followed by 10–20 cm and 0–5 cm. We utilized soil samples with a wide range of soil health indicator values to increase the applicability of the developed models. For example, soils had a wide range of LOI which ranged from 1.6 to 3.6 g 100 g−1, while POXC values ranged from 192 mg kg−1 to 1355 mg kg−1. Research pastures (23%) had greater clay content compared to farmer’s pastures (15.6%).

3.2. Exploratory Data Analysis

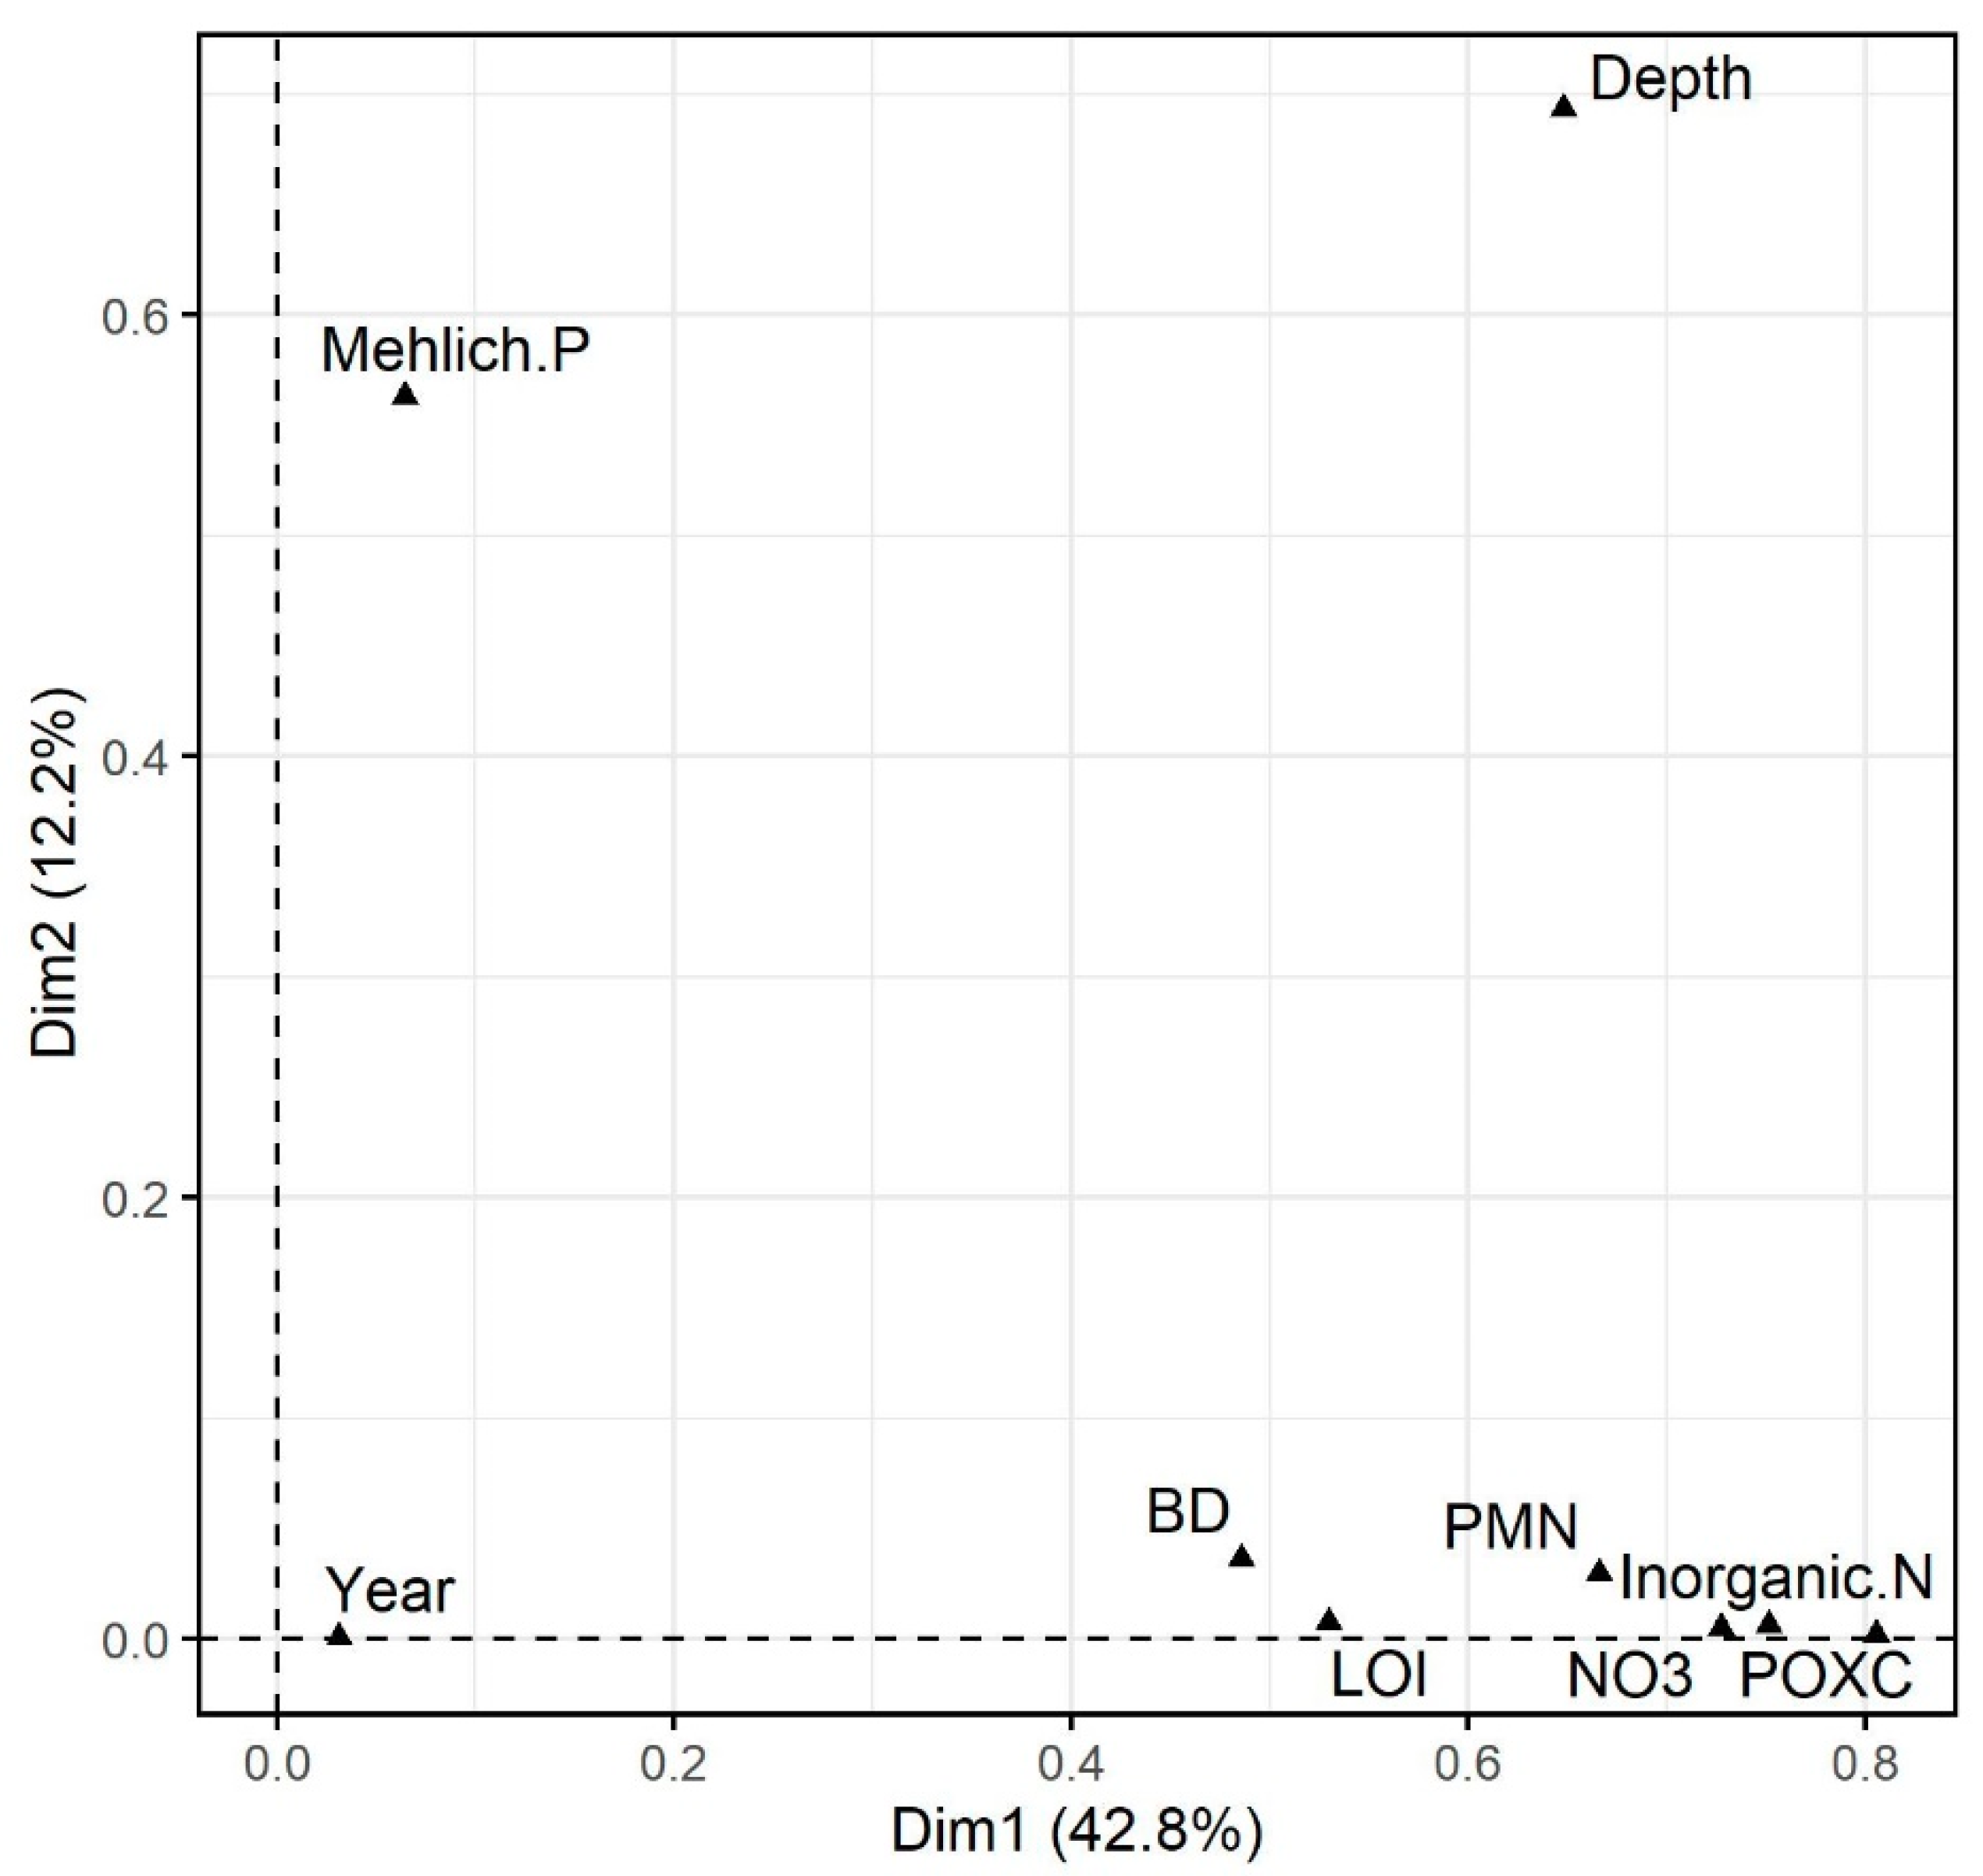
The PCA analysis showed that first two principal components accounted for 55% of total variability of the dataset. As expected, soil depth was a significant contributer in both first and second principal components. Year of sampling did not have any useful role. BD, LOI, Nitrate, PMN, Inorganic N, and POXC were important contributer on the first principal component, whereas Mehlich-1 P was an important contributor in the second principal component (Figure 2). More details on the role of qualitative and quantitative variables in overal variation on data are presented in the Supplementary Materials (Figures S1 and S2). While we realize that depth of sampling had a profound effect on the dataset, the objective of this manuscript is not to estimate the differences in soil health indicators by soil depth. Rather, the focus is on understanding the relationships between soil health indicators in a diverse population of soil samples.

3.3. Relationship of Soil Nitrogen with Other Soil Health Indicators

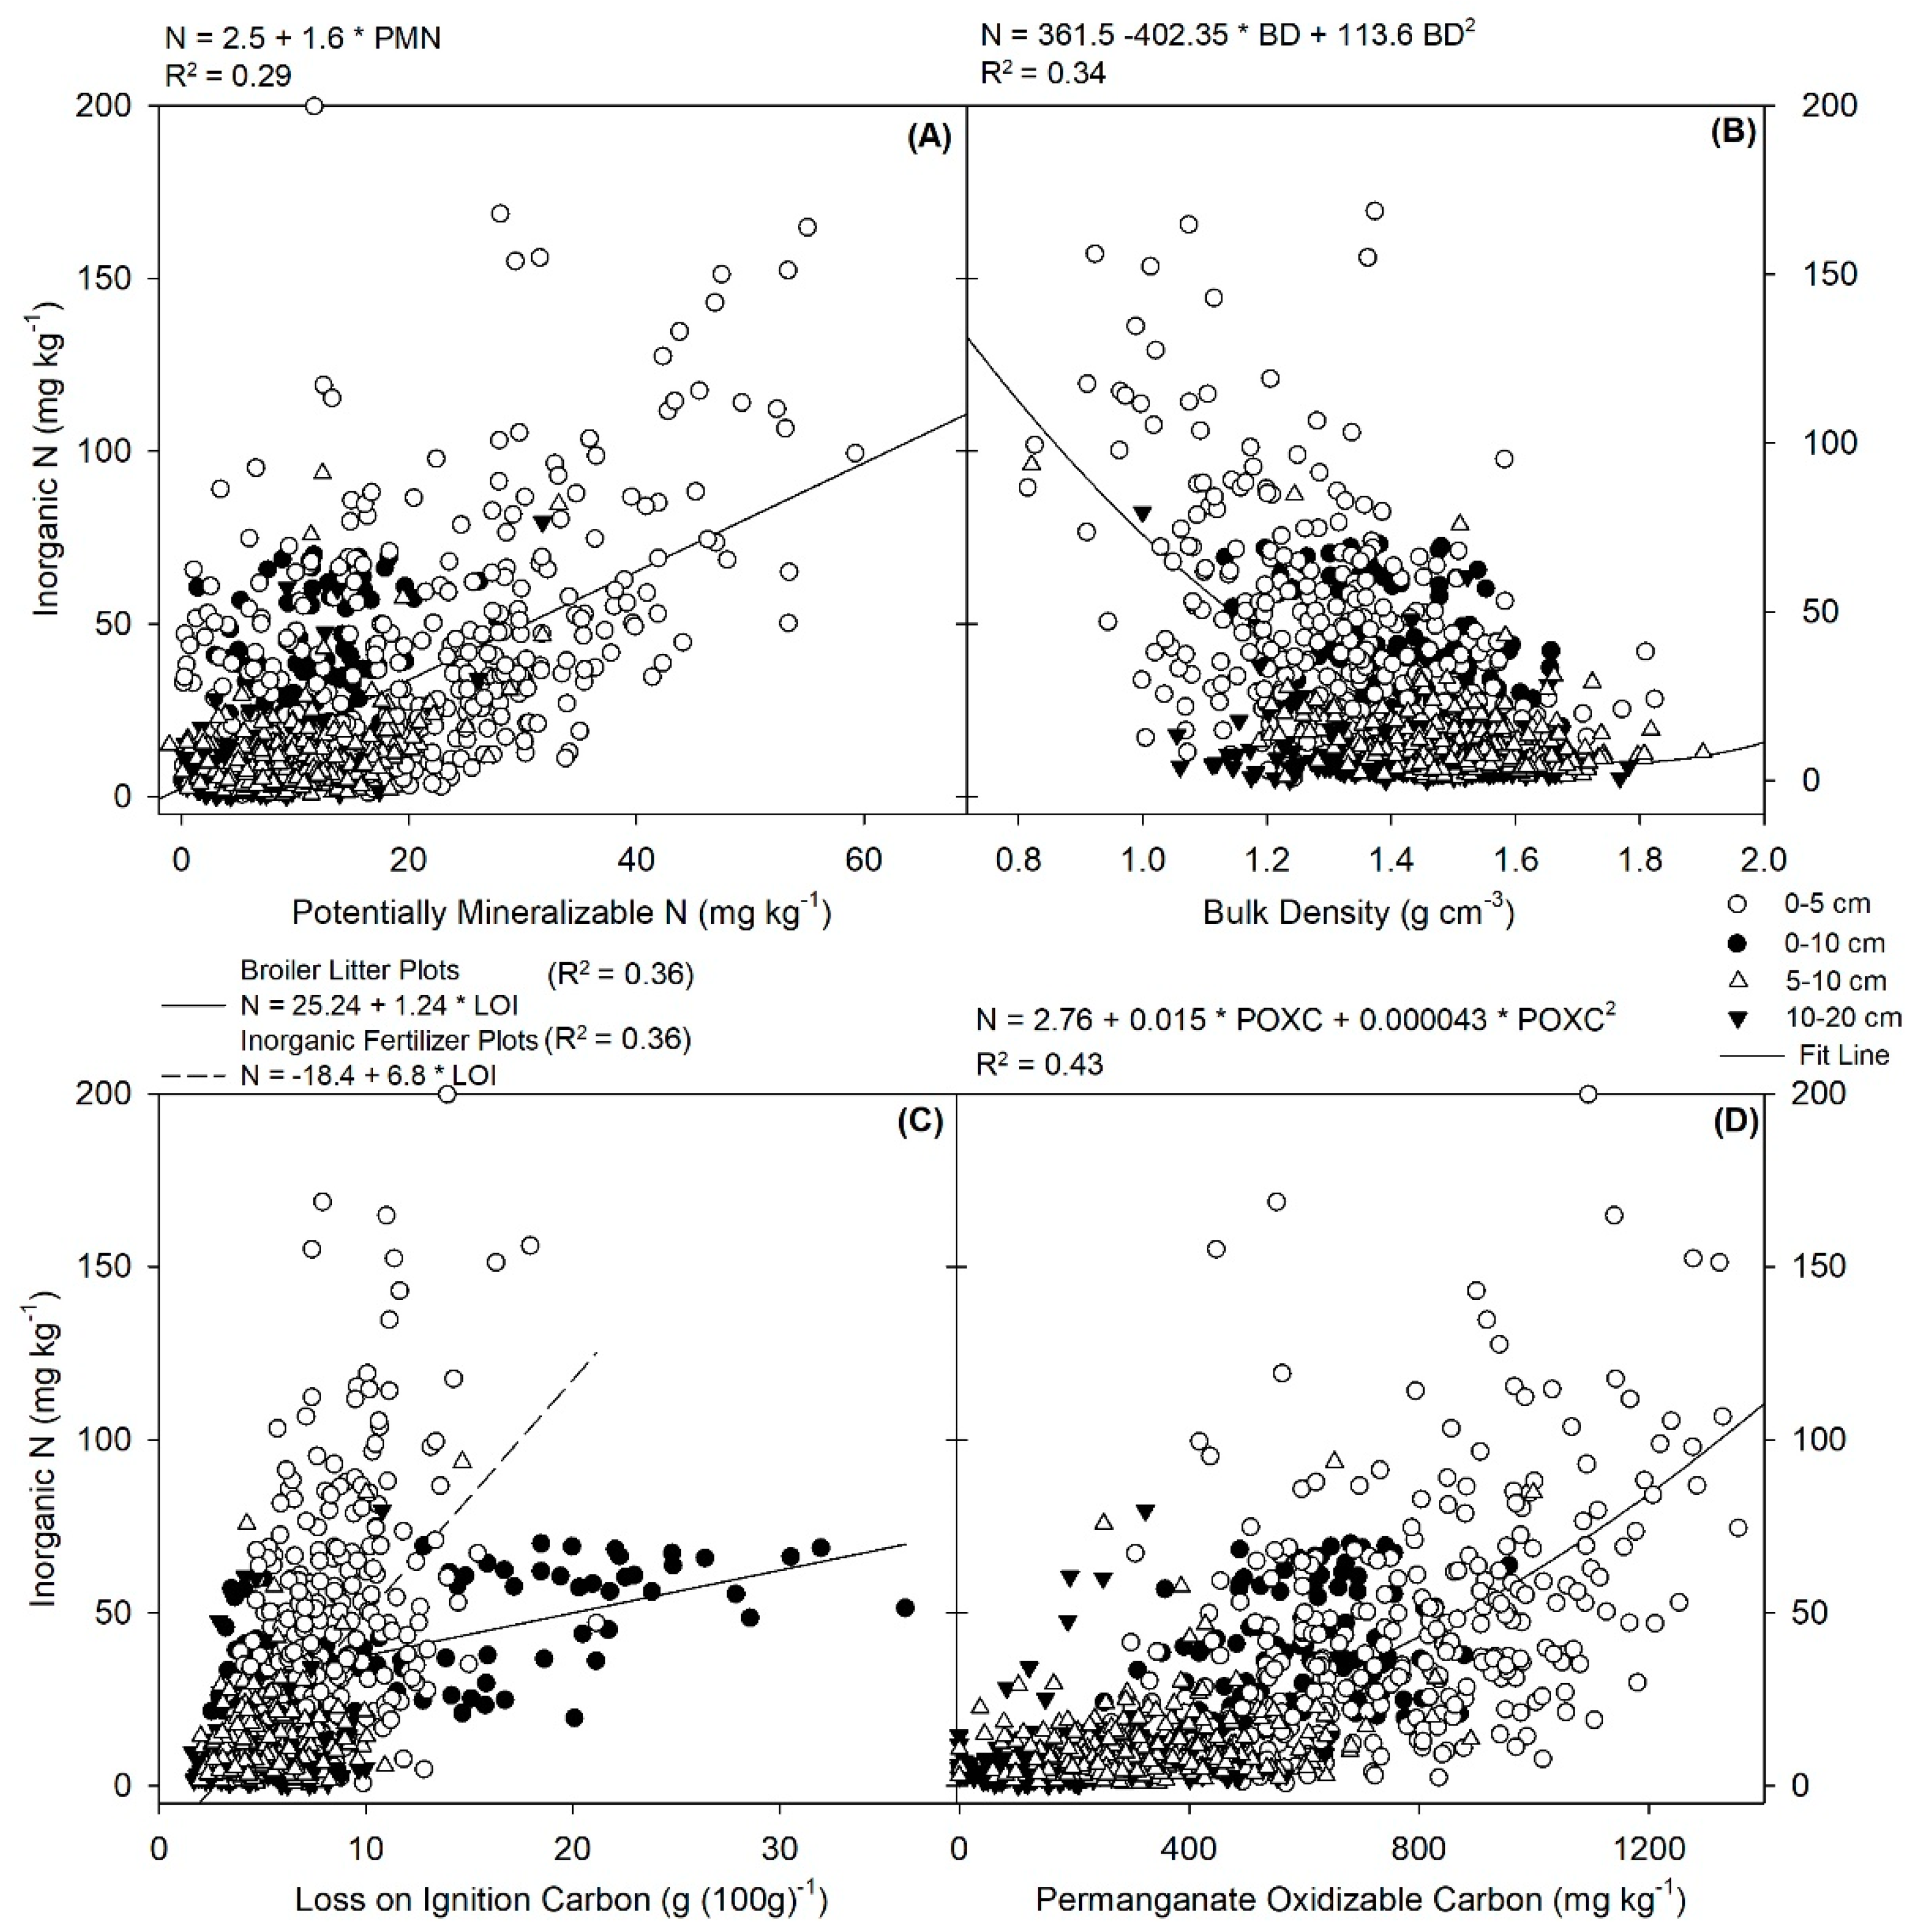
PNM is a widely used indicator of soil health [3] and could be used for making nitrogen fertilization decisions in pastures to avoid over-application and potential loss of nitrogen via runoff, leaching, and volatilization [27]. In agreement with other researchers, we found that PMN was related to inorganic N (Figure 3A). Ros et al. [28] and Picone et al. [21] reported correlation of 0.74 and 0.68, respectively. PMN is the fraction of soil N which is yet to be mineralized and as shown here it contributes to the readily plant-available inorganic N fraction (inorganic N, Figure 3A), when mineralized [28,29].
Bulk density had a significant inverse relationship with N and PMN which was explained by a quadratic relationship (Figure 3B and Figure 4C). Chaudhari et al. [30] also reported a significant negative correlation between bulk density and N + P + K (−0.87) content in tropical croplands, for a smaller sample size. Other studies [31,32] found a highly significant negative relationship between BD and total N. Generally, soils with BD greater than 1.6 g cm−3 are highly restrictive for root growth [9]; however, it has also been suggested that soils with BD as low as 1.2 might have detrimental effect on overall root and shoot growth in perennial ryegrass [31,33]. Root growth restriction coupled with low nutrient holding capacity of high BD soils might lead to over application of expensive nitrogen fertilizer and losses during runoff.
LOI had positive relationship with N and PMN which were explained by simple linear models (Figure 3C and Figure 4D). Our result is in agreement with a study by Yang et al. [34] in Tibetan grasslands, who reported that a simple linear model explains the relationship between total carbon and total nitrogen to a depth of 100 cm. Steffens et al. [35] also reported a similar relationship in arid regions of China. In this analysis, grasslands that received broiler litter as primary source of fertilizer behaved differently as compared to pastures that received inorganic fertilizers or no fertilizers (Figure 3C). Inorganically fertilized pastures had significantly (p < 0.001) steeper slope (6.8) compared to broiler litter fertilized pastures (1.24). Broiler litter pastures had very high (up to 40 g 100 g−1) LOI; however, the rate of increase in N per unit increase in LOI was significantly lower as compared to inorganically fertilized pastures. Past studies [36,37] have reported an improved prediction of mineralizable nitrogen when organic matter was included in the model; however, our results indicate that we need to use caution as the relationships between organic matter and nitrogen can be dissimilar for different fertilizer management systems [38]. This might be attributed to high C/N ratio [39,40] of the bedding material used in poultry farms which could result in an accumulation of carbon but little corresponding increase in nitrogen. In addition to that, soils in research pastures with high in clay content could have retained more nitrogen due to greater surface area of clay particles. Upon extraction, nitrogen was released rapidly, showing a steeper slope of relation between LOI and nitrogen fractions. As sampling depths for inorganic (0–5, 5–10 and 10–20 cm) and broiler litter pastures (0–10 cm) were different, we also calculated all soil health indicators for 0–10 cm soil depth for inorganic pastures (by averaging values for 0–5 cm and 5–10 cm) and did a confirmatory analysis. The results from this confirmatory analysis are presented in the supplementary section (Figures S3–S5). Confirmatory analysis corroborates our findings as described earlier.
POXC has been suggested as a reliable and management sensitive soil health indicator [16,41]. In these pasture soils, the POXC relationship with inorganic N was explained by a quadratic model (Figure 3D). We found that up to a value of POXC = 500 mg kg−1, inorganic N was consistently low (within 50 mg kg−1). When POXC was greater than 500 mg kg−1, there was a dramatic increase in inorganic N. This inflection point might be utilized as a soil health criterion or a threshold for given management systems or carbon sources. The relationship of POXC and inorganic N did not have the characteristic difference (which was seen for LOI vs. N, Figure 3C) between broiler litter and inorganic pastures signifying the reliability of POXC, as a soil health indicator, because it was more stable across two fertilizer management systems. PMN also had significant strong positive relationship with POXC which was explained (R2 = 0.52) by a simple linear model (Figure 3A). Ros et al. [28] found high correlation (r = 0.84) between hot water extractable carbon and mineralizable N for native grasslands and croplands soils with a history of mixed chemical and manure fertilization system. Since POXC is reliable and easy to measure [16] as compared to hot water extractable carbon or PMN, the POCX relationship may be a more accessible means to better understanding of nitrogen availability and nitrogen fertilizer recommendation in pastures.

3.4. Relationship of Soil Nitrogen with Other Soil Health Indicators

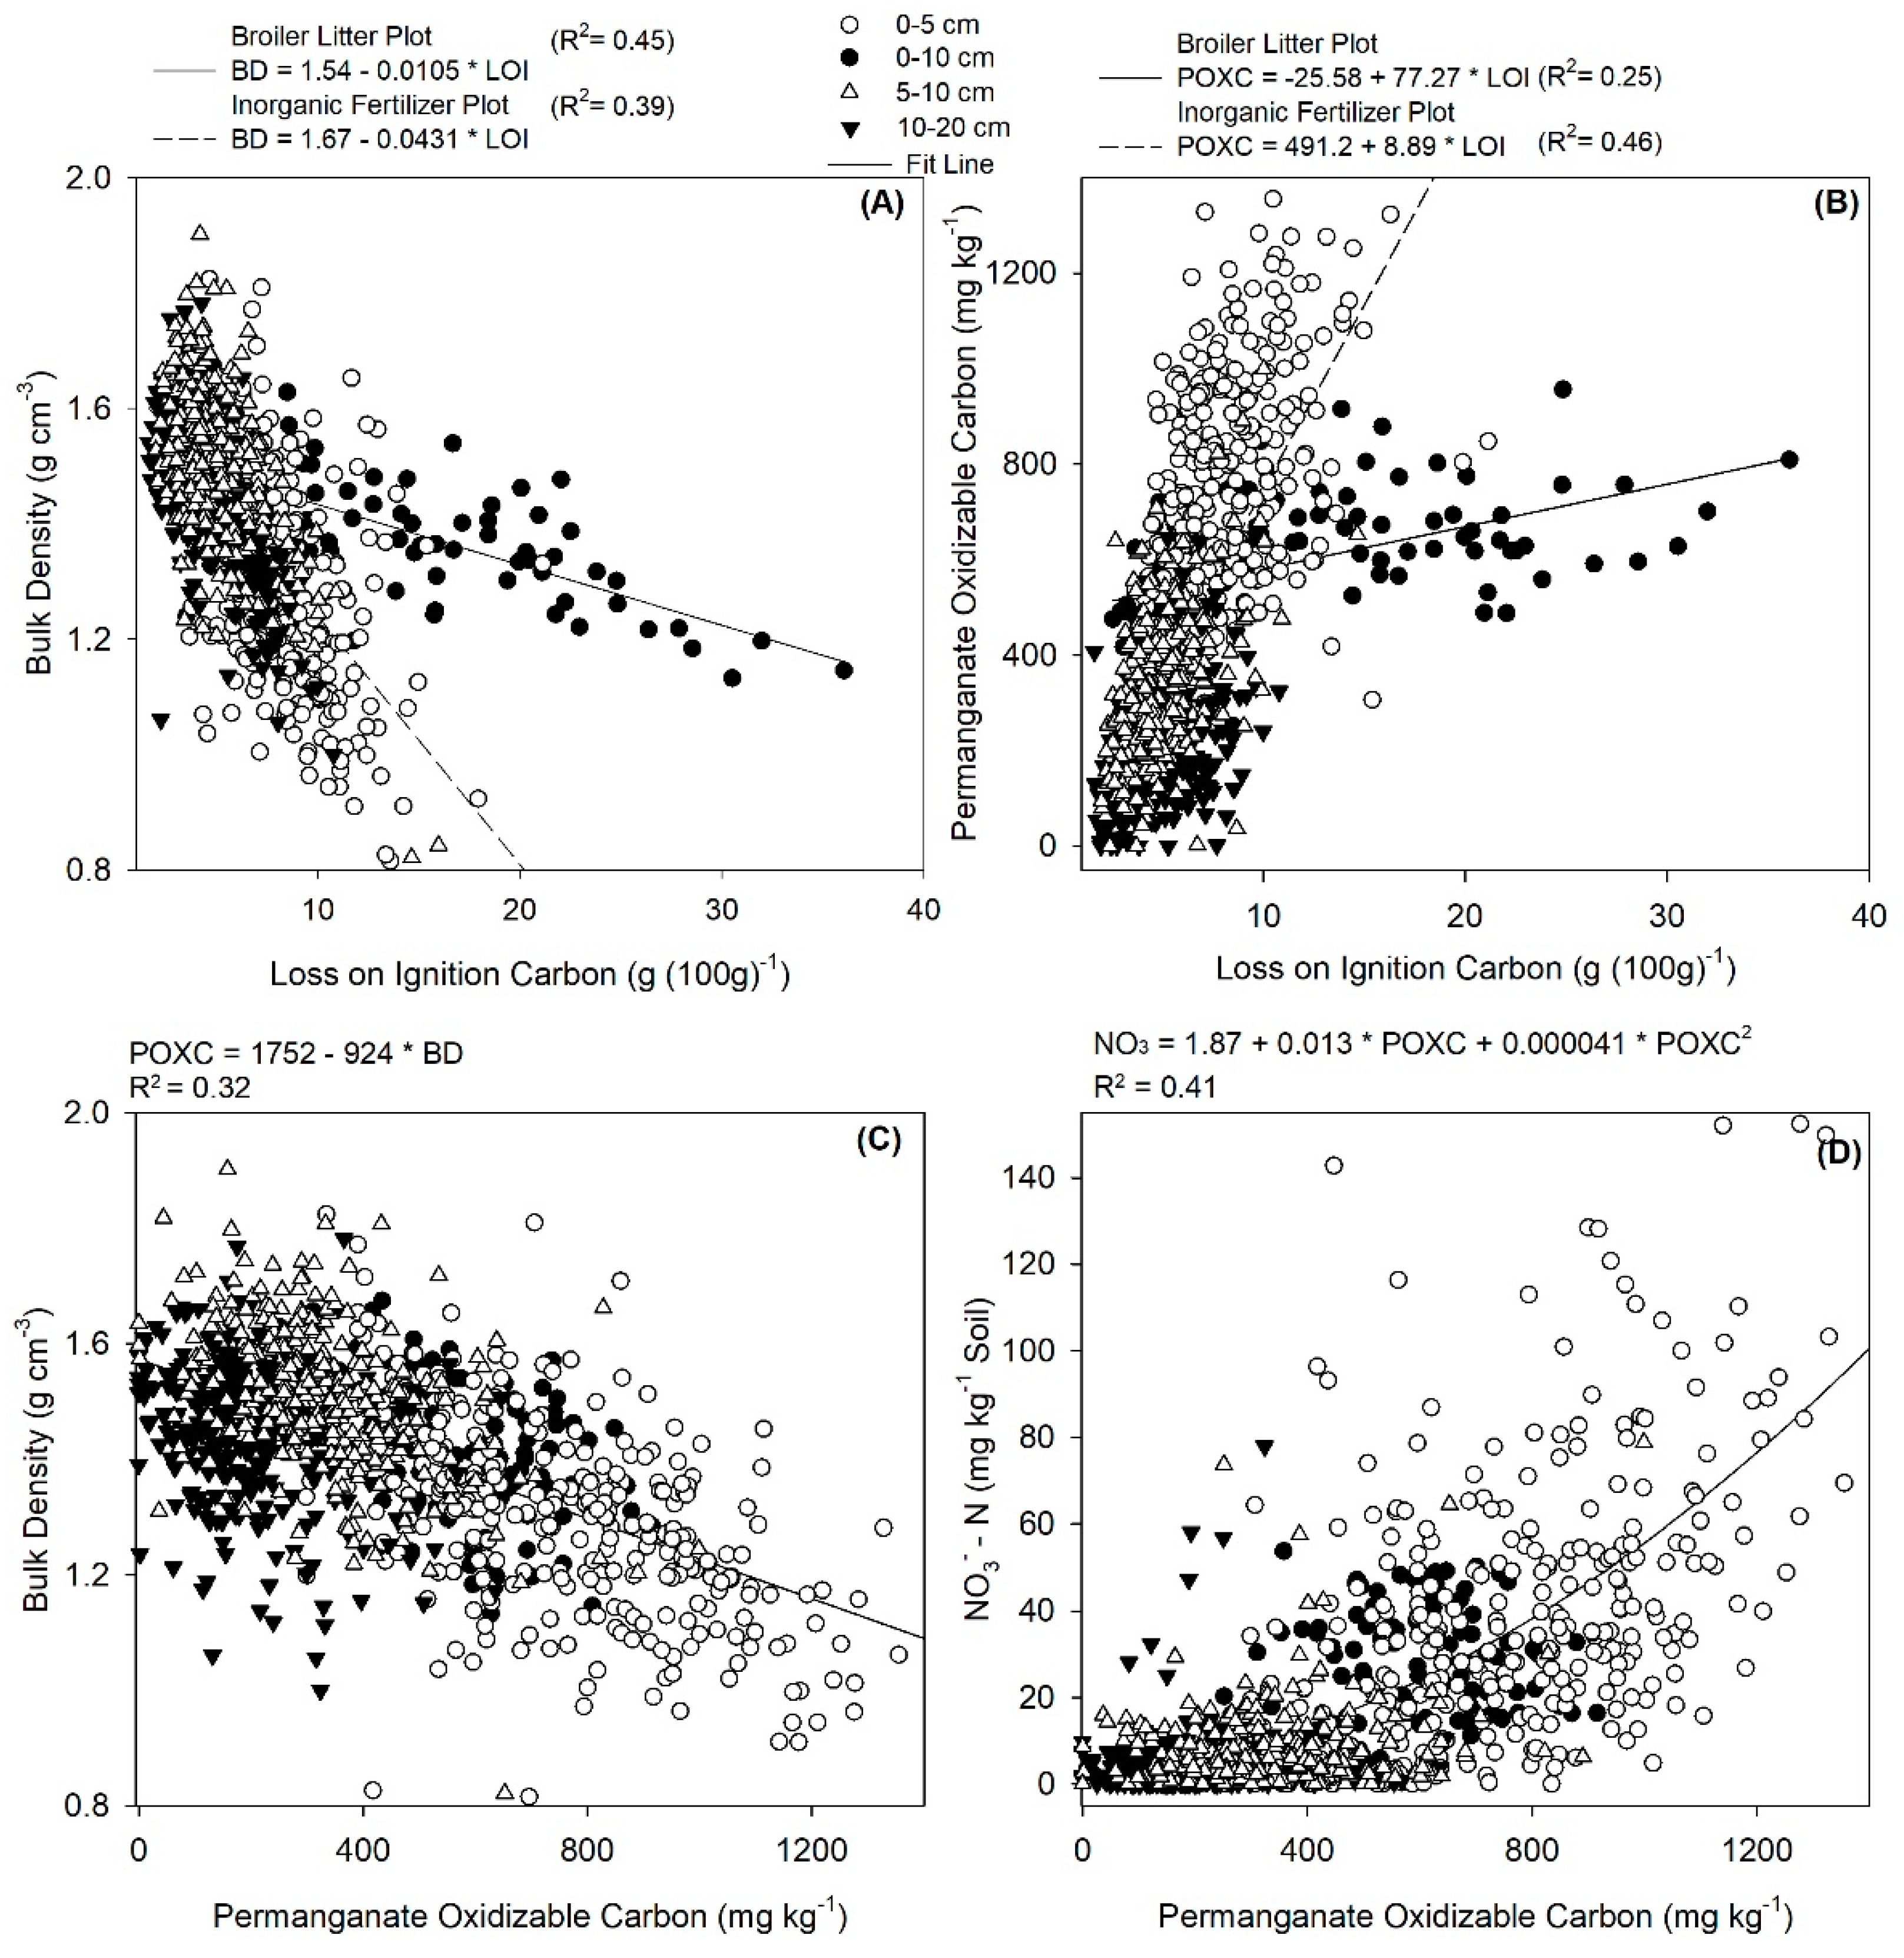
Soils contain more organic carbon than global vegetation and atmospheric carbon [42], and soil organic matter is central for agricultural production [43]; thus, the study of its interrelationship with other soil parameters is important to increase the productivity of agricultural systems. LOI and POXC had inverse relationship with BD and was explained by a simple linear model (Figure 5A,C). Typically, an increase in LOI is associated with reduced BD, but the two fertilizer application systems differed in the rate at which BD reduced with increasing LOI (Figure 5A). In cases of LOI, in inorganic fertilizer pastures, the slope of the equation was significantly (p < 0.001) steeper (−0.043) as compared to the broiler litter fertilized pastures (−0.015). In broiler litter pastures, some soil cores with LOI values as high as 30 g 100 g−1 had BD of 1.2. This incongruity between inorganic pastures and broiler litter pastures might also be due to differences in managerial decisions and stocking density. In addition, inherently greater bulk density of clay soils from research pastures could have added to this inconsistency between two systems by limiting the range of bulk density values. Generally our finding is in agreement with Franzluebbers [44] who reported an inverse relationship between soil organic carbon and bulk density and suggested an exponential model for predicting bulk density (R2 = 0.64). The shorter-term Franzluebbers [44] study had different fertilizer sources, but there was no distinct separation between the carbon and BD relationship based on fertilizer source. Similarly, in case of POXC vs. BD, we found an inverse relationship (Figure 5C). The difference between two fertilizer systems, as was found in LOI vs. N (Figure 5A), was not observed. This again indicates that the active fraction of carbon could be a more reliable soil health indicator across pastures with different fertilizer sources.
LOI and POXC had a positive significant relationship and was explained by linear regression model (Figure 5B); however, broiler litter applied vs. inorganic pastures behaved differently. The slope of line for inorganic pastures was very steep as compared to the broiler litter applied pastures. Past studies [45,46,47] also reported that total organic carbon was linearly related to POXC in plantation, cropland, and pasture soils, respectively.
POXC had an interesting relationship with NO3-N which was explained by a quadratic model (Figure 5D). POXC values below 500 mg kg−1 had very low NO3-N (below 20 mg kg−1), but beyond 500 mg kg−1 POXC, there was a sharp increase in NO3-N. This relationship might be an important consideration in fertilizing hay pastures or predicting NO3-N in forage to prevent nitrate toxicity in cattle.

3.5. Soil Microbial Biomass vs. Other Soil Health Indicators

Soil microbial biomass [17] has been suggested as a reliable indicator of soil health [3,44]; however, its measurement is highly time- and resource-consuming and requires hazardous chemicals. Thus, research is required in various agroecosystems to create models to assess soil microbial biomass by using other easy-to-measure soil health indicators.
The multiple regression model Equation (1) had an R2 of 0.76 (Figure 6A), suggesting that most of the variables under consideration were useful indicators of SMBC (Table 3). The regression parameters (Table 3) show the complex nature of this biological soil health indicator. The POXC/PMN ratio had a significant positive effect, whereas the ratio of LOI/P ratio had a negative effect on SMBC. While others found a positive relationship with SMBC [16,48,49], our research showed weak though significant relationships which varied by fertilizer management systems (Figure 6B). High LOI/P ratio and high BD had negative effect, whereas LOI alone did not have any effect. The dissimilar relationship of LOI with POXC (Figure 5B) in broiler litter pastures vs. inorganic pastures may have been why we did not detect an effect of LOI in SMBC. For similar LOI values, POXC was relatively high in inorganic pastures as compared to broiler litter applier pastures. Furthermore, Franzluebbers and Stuedemann [50] suggested that larger biologically active carbon pools can be related to higher microbial carbon, whereas very high biologically resistant carbon (likely present in pastures with long history of broiler litter application) might have lower microbial biomass [51].
Contrary to previous studies [50,52], broiler litter applied pastures had significantly less SMBC as compared to the inorganic pastures. However, those studies had applied poultry litter for only 4 years as compared to >20 years in our study. Typically, broiler litter applied pastures are rich in Phosphorus [53], which was the case in our study, and the negative effect of P (Table 3) might be confounded with the presence of heavy metals in broiler litter pastures. Past studies have suggested that long term application of poultry litter leads to accumulation of heavy metals such as Arsenic, Copper, Zinc, and Manganese [14,29,49,54].

3.6. Inorganic N and PMN vs. Other Soil Health Indicators

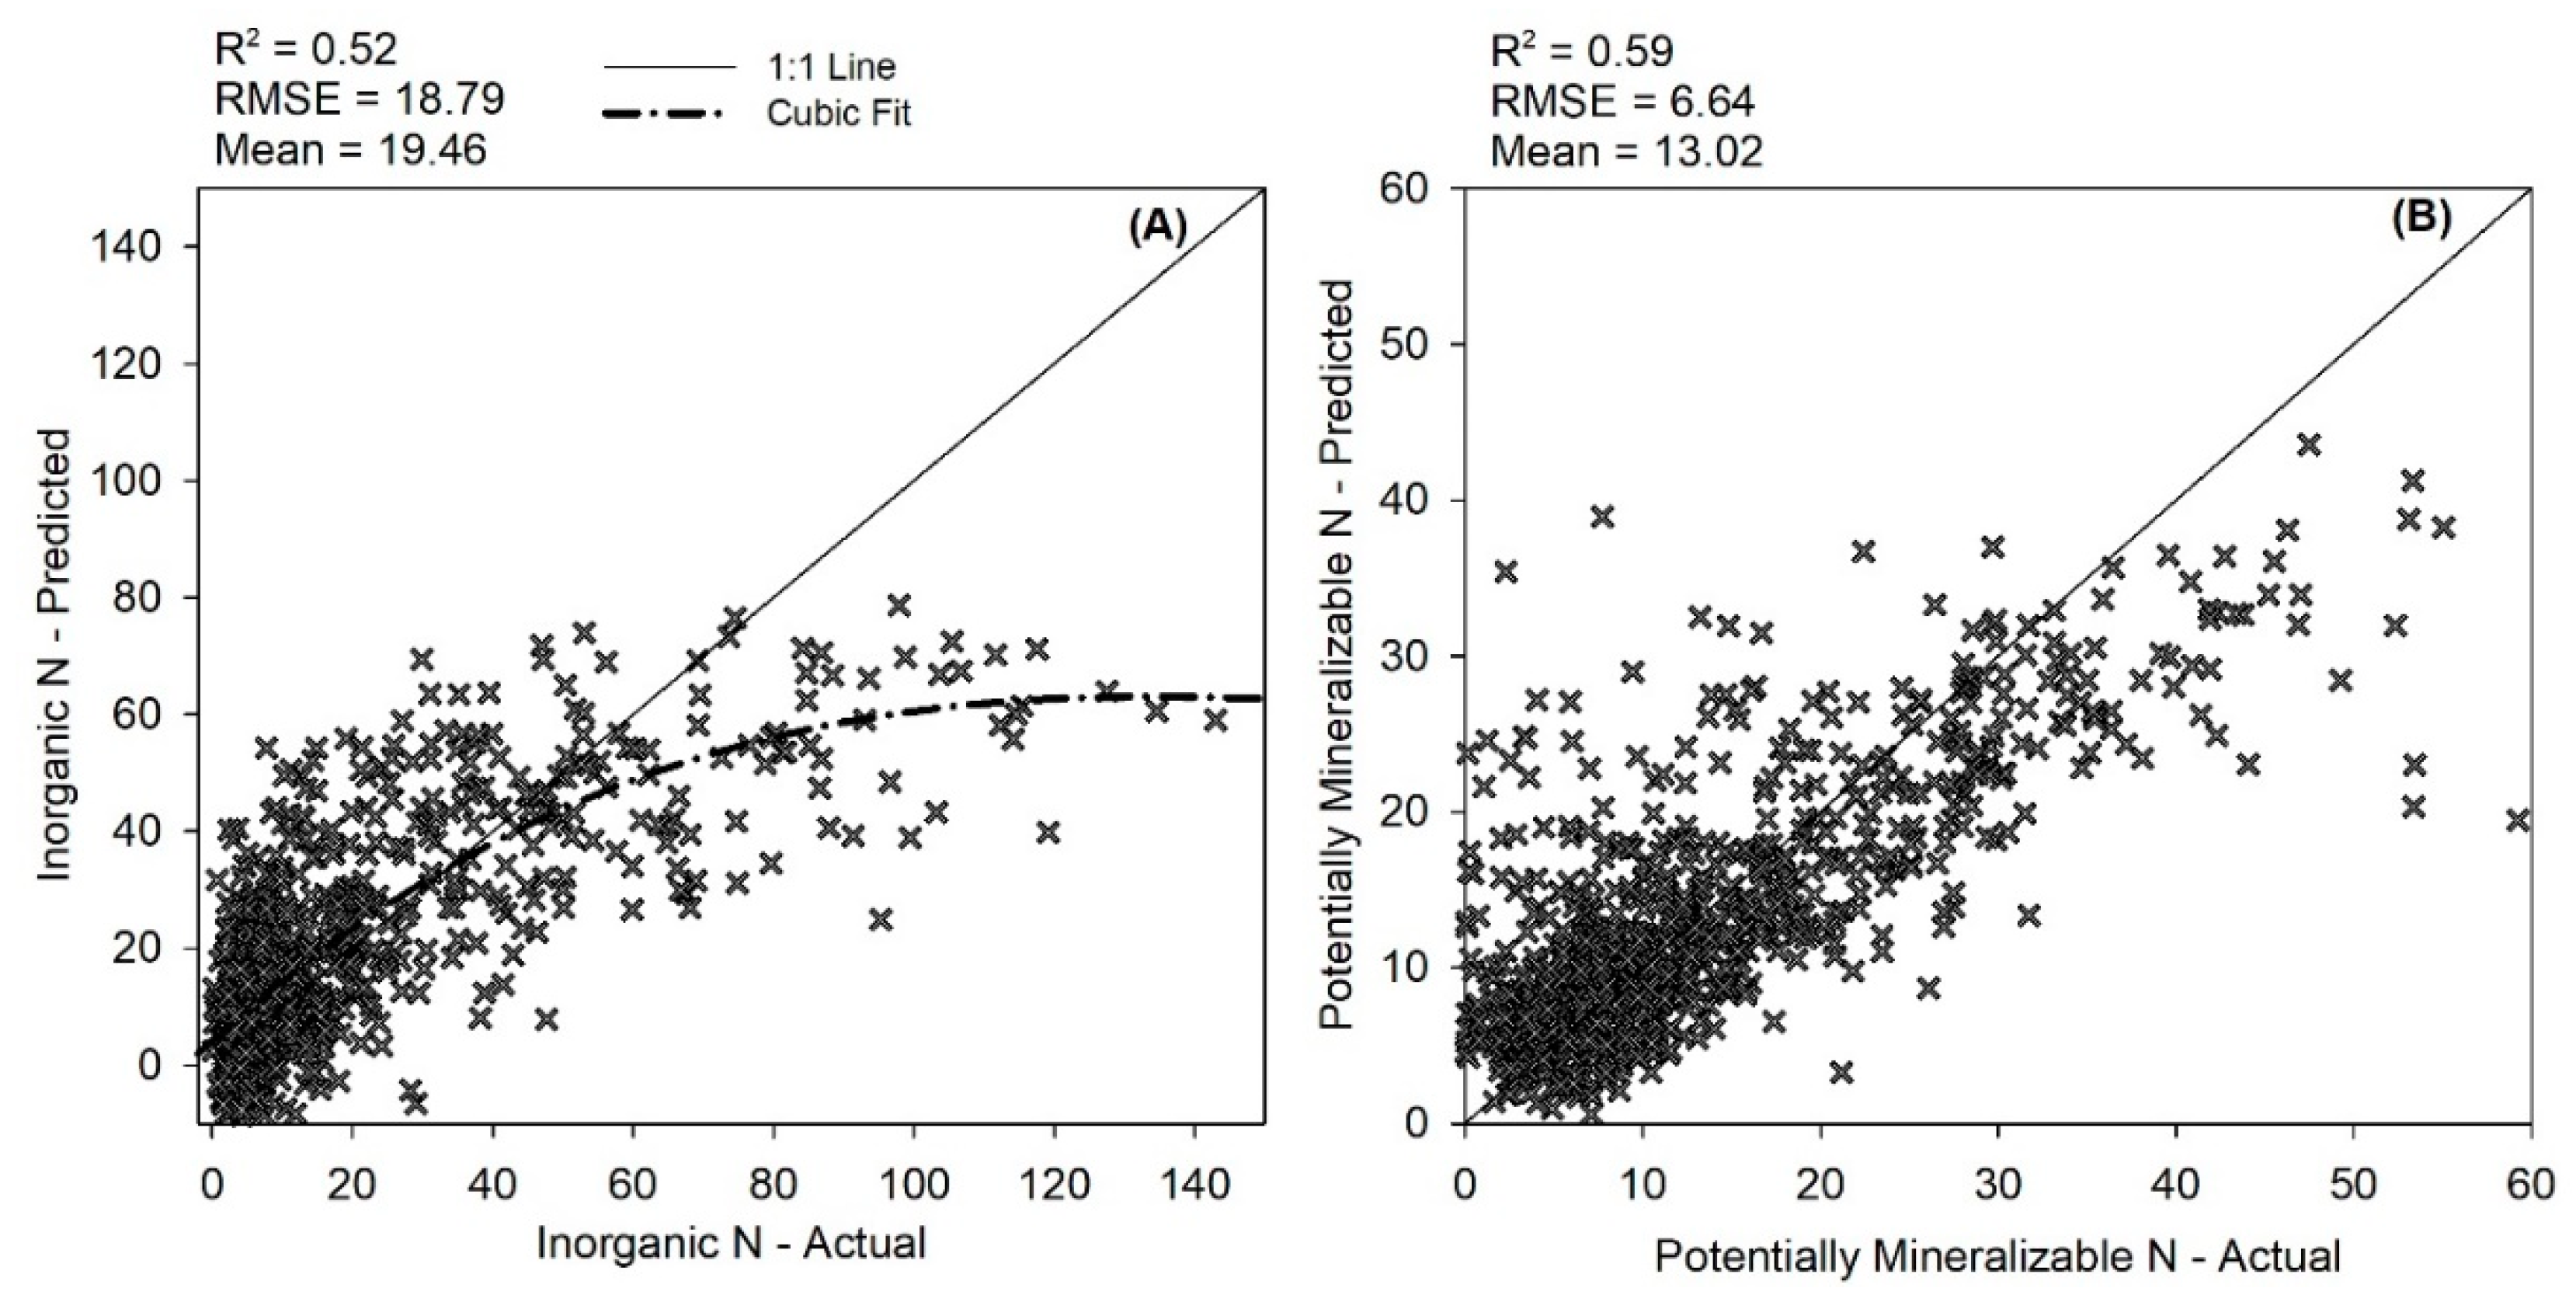
A multiple regression model was fit for Inorganic Nitrogen (Figure 7) as explained in Equation (1). Inorganic N was significantly related to all variables under consideration (Table 1). As PNM and LOI variables were correlated with POXC, they were removed from the model to address the problem of collinearity. Only variables with VIF (Variance Inflation Factor) less than 2.5 were kept in the model. Since inorganic nitrogen is the most readily plant available fraction of soil N, its accurate measurement is important from a producer’s perspective. Figure 3 shows how soil health indicators under consideration relate with N. There was under-prediction below 10 mg kg−1 N and over-prediction above 60 mg kg−1 N.
PMN was significantly affected by POXC, BD, P, and Resp (Table 4). POXC had most significant impact on PMN which was indicative of the ability of active carbon in soil to predict potentially mineralizable nitrogen in soil. Several researchers found respiration to have a significant positive effect on inorganic N, because higher soil respiration can be indicative of high microbial activity and associated N mineralization, which releases a flush of inorganic N [55,56]. Thus, soils with higher respiration rates had accumulated more inorganic N. In our work, Resp had a negative effect on PMN because actively respiring soils mineralize organic matter and release nitrogen in mineral form causing a decrease in potentially mineralizable nitrogen pool.

4. Conclusions

We documented significant relationships of active carbon (POXC) with PMN, N, LOI, BD, and SMBC, which substantiates the importance of POXC as an easily measured soil health indicator within the Southern Piedmont, USA. Of particular importance is our finding of the strong positive relationship of POXC with N and PMN, which showed the ability of active carbon-fraction to influence dynamics of nitrogen cycling in pastures. The quadratic relationship of POXC with N and nitrate-N is very interesting and needs to be studied in various grazing management systems to determine if there is one or several inflection points. These inflection points may serve as a soil health criterion/threshold or as indicator when nitrates in forages could be hazardous to grazing animals or as hay. We conclude that soil microbial biomass, a reliable and sensitive but difficult-to-measure indicator of soil health, could be assessed using other easy-to-measure variables. Fertilizer management systems significantly affect the relationship between soil health indicators and this information needs to be included in fertilizer recommendation models. The multiple regression models presented for Inorganic N, PMN and SMBC provide useful insights for developing and updating fertilizer recommendation models. Measurement of POXC and BD will help modelers, farmers, and farm managers to determine optimum nitrogen fertilizer recommendations for healthy and sustainable grazing systems.

Supplementary Materials

The following are available online at https://www.mdpi.com/article/10.3390/su13094844/s1, Figure S1: Principal Component Analysis of variables showing contribution of qualitative variables in the first and second principal components; Figure S2: Principal Component Analysis of variables showing contribution of quantitative variables in the first and second principal components; Figure S3: Relationship of inorganic N with (A) potentially mineralizable N, (B) bulk density, (C) loss on ignition carbon, and (D) active carbon; Figure S4: Relationship of potentially mineralizable N with (A) active carbon, (B) soil respiration, (C) bulk density, and (D) loss on ignition carbon; Figure S5: Relationships of loss on ignition carbon with (A) bulk density and (B) active carbon, and relationship of active carbon with (C) bulk density, and (D) nitrate-nitrogen.

Author Contributions

Conceptualization, D.H.F.; methodology, D.H.F., S.D., and A.S.; formal analysis, S.D.; investigation, D.H.F., S.D., A.S., L.N., B.F., and K.M.; resources, D.H.F.; data curation, S.D.; writing—original draft preparation, S.D.; writing—review and editing, S.D., D.H.F., M.L.C.; visualization, S.D.; supervision, D.H.F., M.L.C.; project administration, D.H.F.; funding acquisition, D.H.F. All authors have read and agreed to the published version of the manuscript.

Funding

This research was funded by USDA-NRCS.

Informed Consent Statement

Not applicable.

Data Availability Statement

Not applicable.

Acknowledgments

The authors are grateful to USDA-NRCS for their assistance with the first-order soil survey, and to the Sustainable Agriculture Laboratory team, John Rema, and Charles T. Trumbo at the University of Georgia for their endless help in the laboratory and the field.

Conflicts of Interest

The authors declare no conflict of interest.

References

  1. Liebig, M.A.; Varvel, G.; Doran, J. A Simple Performance-Based Index for Assessing Multiple Agroecosystem Functions. Agron. J. 2001, 93, 313–318. [Google Scholar] [CrossRef] [Green Version]
  2. Roper, W.R.; Osmond, D.L.; Heitman, J.L.; Wagger, M.G.; Reberg-Horton, S.C. Soil Health Indicators Do Not Differentiate among Agronomic Management Systems in North Carolina Soils. Soil Sci. Soc. Am. J. 2017, 81, 828–843. [Google Scholar] [CrossRef] [Green Version]
  3. Moebius-Clune, B.N. Comprehensive Assessment of Soil Health: The Cornell Framework Manual; Cornell University: Ithaca, NY, USA, 2016. Available online: http://www.css.cornell.edu/extension/soil-health/manual.pdf (accessed on 11 February 2019).
  4. Bhandari, K.B.; West, C.P.; Acosta-Martinez, V.; Cotton, J.; Cano, A. Soil health indicators as affected by diverse forage species and mixtures in semi-arid pastures. Appl. Soil Ecol. 2018, 132, 179–186. [Google Scholar] [CrossRef]
  5. Bhowmik, A.; Fortuna, A.-M.; Cihacek, L.J.; Bary, A.I.; Cogger, C.G. Use of biological indicators of soil health to estimate reactive nitrogen dynamics in long-term organic vegetable and pasture systems. Soil Biol. Biochem. 2016, 103, 308–319. [Google Scholar] [CrossRef] [Green Version]
  6. Byrnes, R.C.; Eastburn, D.J.; Tate, K.W.; Roche, L.M. A Global Meta-Analysis of Grazing Impacts on Soil Health Indicators. J. Environ. Qual. 2018, 47, 758–765. [Google Scholar] [CrossRef] [PubMed] [Green Version]
  7. Ghimire, R.; Ghimire, B.; Mesbah, A.O.; Sainju, U.M.; Idowu, O.J. Soil Health Response of Cover Crops in Winter Wheat–Fallow System. Agron. J. 2019, 111, 2108–2115. [Google Scholar] [CrossRef] [Green Version]
  8. Dahal, S.; Franklin, D.H.; Cabrera, M.L.; Hancock, D.W.; Stewart, L.; Ney, L.C.; Subedi, A.; Mahmud, K. Spatial Distribution of Inorganic Nitrogen in Pastures as Affected by Management, Landscape, and Cattle Locus. J. Environ. Qual. 2018, 47, 1468–1477. [Google Scholar] [CrossRef]
  9. USDA. Soil Bulk Density: Soil Health Guide for Educators. Available online: https://www.nrcs.usda.gov/Internet/FSE_DOCUMENTS/nrcs142p2_050936.pdf (accessed on 10 December 2019).
  10. Haney, R.L.; Haney, E.B.; Smith, D.R.; Harmel, R.D.; White, M.J. The soil health tool—Theory and initial broad-scale application. Appl. Soil Ecol. 2018, 125, 162–168. [Google Scholar] [CrossRef]
  11. Parfitt, R.; Yeates, G.; Ross, D.; Mackay, A.; Budding, P. Relationships between soil biota, nitrogen and phosphorus availability, and pasture growth under organic and conventional management. Appl. Soil Ecol. 2005, 28, 1–13. [Google Scholar] [CrossRef]
  12. Schomberg, H.H.; Cabrera, M.L. Modeling in situ N mineralization in conservation tillage fields: Comparison of two versions of the CERES nitrogen submodel. Ecol. Model. 2001, 145, 1–15. [Google Scholar] [CrossRef]
  13. Veum, K.S.; Sudduth, K.A.; Kremer, R.J.; Kitchen, N.R. Sensor data fusion for soil health assessment. Geoderma 2017, 305, 53–61. [Google Scholar] [CrossRef]
  14. Anderson, T.-H.; Domsch, K. Application of eco-physiological quotients (qCO2 and qD) on microbial biomasses from soils of different cropping histories. Soil Biol. Biochem. 1990, 22, 251–255. [Google Scholar] [CrossRef]
  15. Staff, S.S.L. Soil survey laboratory methods manual. In Soil Survey Investigation Report 42; National Soil Survey Center: Lincoln, NE, USA, 1996. [Google Scholar]
  16. Islam, K.R.; Stine, M.A.; Gruver, J.B.; Samson-Liebig, S.E.; Weil, R.R. Estimating active carbon for soil quality assessment: A simplified method for laboratory and field use. Am. J. Altern. Agric. 2003, 18, 3–17. [Google Scholar] [CrossRef]
  17. Vance, E.; Brookes, P.; Jenkinson, D. An extraction method for measuring soil microbial biomass C. Soil Biol. Biochem. 1987, 19, 703–707. [Google Scholar] [CrossRef]
  18. Maynard, D.; Kalra, Y.; Crumbaugh, J. Nitrate and Exchangeable Ammonium Nitrogen, 2nd ed.; CRC Press: Boca Raton, FL, USA; Taylor and Francis Group: Abingdon, UK, 1993; Volume 1, pp. 71–80. [Google Scholar]
  19. Kempers, A.; Zweers, A. Ammonium determination in soil extracts by the salicylate method. Commun. Soil Sci. Plant Anal. 1986, 17, 715–723. [Google Scholar] [CrossRef]
  20. Doane, T.A.; Horwáth, W.R. Spectrophotometric Determination of Nitrate with a Single Reagent. Anal. Lett. 2003, 36, 2713–2722. [Google Scholar] [CrossRef]
  21. Picone, L.I.; Cabrera, M.L.; Franzluebbers, A.J. A Rapid Method to Estimate Potentially Mineralizable Nitrogen in Soil. Soil Sci. Soc. Am. J. 2002, 66, 1843–1847. [Google Scholar] [CrossRef]
  22. Mehlich, A. Determination of P, Ca, Mg, K, Na, and NH4. In North Carolina Soil Test Division (Mimeo 1953); 1953; pp. 23–89. Available online: http://www.ncagr.gov/AGRONOMI/pdffiles/mehlich53.pdf (accessed on 10 December 2019).
  23. Soil Survey Staff, U. Web Soil Survey; US Department of Agriculture—Natural Resources Conservation Service. Available online: http://websoilsurvey.sc.egov.usda.gov/ (accessed on 10 December 2019).
  24. R Core Team. R: A Language and Environment for Statistical Computing; R Foundation for Statistical Computing: Vienna, Austria, 2013. [Google Scholar]
  25. Bozdogan, H. Model selection and Akaike’s information criterion (AIC): The general theory and its analytical extensions. Psychometrika 1987, 52, 345–370. [Google Scholar] [CrossRef]
  26. Kassambara, A. Practical guide to principal component methods in R: PCA, M (CA), FAMD, MFA, HCPC, Factoextra; Sthda. Available online: https://cloud.r-project.org/package=factoextra/factoextra.pdf (accessed on 12 August 2019).
  27. Saint-Fort, R.; Frank, K.; Schepers, J. Role of nitrogen mineralization in fertilizer recommendations. Commun. Soil Sci. Plant Anal. 1990, 21, 1945–1958. [Google Scholar] [CrossRef]
  28. Ros, G.H.; Hanegraaf, M.C.; Hoffland, E.; van Riemsdijk, W.H. Predicting soil N mineralization: Relevance of organic matter fractions and soil properties. Soil Biol. Biochem. 2011, 43, 1714–1722. [Google Scholar] [CrossRef]
  29. Kingery, W.; Wood, C.; Delaney, D.; Williams, J.; Mullins, G. Impact of Long-Term Land Application of Broiler Litter on Environmentally Related Soil Properties. J. Environ. Qual. 1994, 23, 139–147. [Google Scholar] [CrossRef]
  30. Chaudhari, P.R.; Ahire, D.V.; Ahire, V.D.; Chkravarty, M.; Maity, S. Soil bulk density as related to soil texture, organic matter content and available total nutrients of Coimbatore soil. Int. J. Sci. Res. Publ. 2013, 3, 1–8. [Google Scholar]
  31. Houlbrooke, D.J.; Thom, E.R.; Chapman, R.; McLay, C.D.A. A study of the effects of soil bulk density on root and shoot growth of different ryegrass lines. N. Z. J. Agric. Res. 1997, 40, 429–435. [Google Scholar] [CrossRef]
  32. Hu, C.; Li, F.; Xie, Y.-H.; Deng, Z.-M.; Chen, X.-S. Soil carbon, nitrogen, and phosphorus stoichiometry of three dominant plant communities distributed along a small-scale elevation gradient in the East Dongting Lake. Phys. Chem. Earth Parts A/B/C 2018, 103, 28–34. [Google Scholar] [CrossRef]
  33. Chapman, R.; Allbrook, R. The effects of subsoiling compacted soils under grass-a progress report. Available online: https://www.agronomysociety.nz/uploads/94803/files/1987_13._Subsoiling_compacted_soils_under_grass.pdf (accessed on 2 June 2012).
  34. Yang, Y.; Fang, J.; Guo, D.; Ji, C.; Ma, W. Vertical patterns of soil carbon, nitrogen and carbon: Nitrogen stoichiometry in Tibetan grasslands. Biogeosci. Discuss. 2010, 7. [Google Scholar] [CrossRef]
  35. Steffens, M.; Kölbl, A.; Totsche, K.U.; Kögel-Knabner, I. Grazing effects on soil chemical and physical properties in a semiarid steppe of Inner Mongolia (P.R. China). Geoderma 2008, 143, 63–72. [Google Scholar] [CrossRef]
  36. Dessureault-Rompré, J.; Zebarth, B.J.; Burton, D.L.; Sharifi, M.; Cooper, J.; Grant, C.A.; Drury, C.F. Relationships among Mineralizable Soil Nitrogen, Soil Properties, and Climatic Indices. Soil Sci. Soc. Am. J. 2010, 74, 1218–1227. [Google Scholar] [CrossRef]
  37. Schomberg, H.H.; Wietholter, S.; Griffin, T.S.; Reeves, D.W.; Cabrera, M.L.; Fisher, D.S.; Endale, D.M.; Novak, J.M.; Balkcom, K.S.; Raper, R.L.; et al. Assessing Indices for Predicting Potential Nitrogen Mineralization in Soils under Different Management Systems. Soil Sci. Soc. Am. J. 2009, 73, 1575–1586. [Google Scholar] [CrossRef]
  38. Wyngaard, N.; Cabrera, M.L.; Shober, A.; Kanwar, R. Fertilization strategy can affect the estimation of soil nitrogen mineralization potential with chemical methods. Plant Soil 2018, 432, 75–89. [Google Scholar] [CrossRef]
  39. Franklin, D.; Bender-Özenç, D.; Özenç, N.; Cabrera, M. Nitrogen mineralization and phosphorus release from composts and soil conditioners found in the Southeastern United States. Soil Sci. Soc. Am. J. 2015, 79, 1386–1395. [Google Scholar] [CrossRef]
  40. Riffaldi, R.; Saviozzi, A.; Levi-Minzi, R. Carbon mineralization kinetics as influenced by soil properties. Biol. Fertil. Soils 1996, 22, 293–298. [Google Scholar] [CrossRef]
  41. Melero, S.; López-Garrido, R.; Madejón, E.; Murillo, J.M.; Vanderlinden, K.; Ordóñez, R.; Moreno, F. Long-term effects of conservation tillage on organic fractions in two soils in southwest of Spain. Agric. Ecosyst. Environ. 2009, 133, 68–74. [Google Scholar] [CrossRef]
  42. Lehmann, J.; Kleber, M. The contentious nature of soil organic matter. Nat. Cell Biol. 2015, 528, 60–68. [Google Scholar] [CrossRef] [PubMed]
  43. Joshi, D.R.; Clay, D.E.; Smart, A.; Clay, S.A.; Kharel, T.P.; Mishra, U. Soil and land-use change sustainability in the Northern Great Plains of the USA. In Land Use Change and Sustainability; IntechOpen: London, UK, 2019. [Google Scholar] [CrossRef] [Green Version]
  44. Franzluebbers, A.J.; Pehim-Limbu, S.; Poore, M.H. Soil-Test Biological Activity with the Flush of CO2: IV. Fall-Stockpiled Tall Fescue Yield Response to Applied Nitrogen. Agron. J. 2018, 110, 2033–2049. [Google Scholar] [CrossRef] [Green Version]
  45. Hendricks, T.; Franklin, D.; Dahal, S.; Hancock, D.; Stewart, L.; Cabrera, M.; Hawkins, G. Soil carbon and bulk density distribution within 10 Southern Piedmont grazing systems. J. Soil Water Conserv. 2019, 74, 323–333. [Google Scholar] [CrossRef]
  46. Mendham, D.S.; O’Connell, A.M.; Grove, T.S. Organic matter characteristics under native forest, long-term pasture, and recent conversion to Eucalyptus plantations in Western Australia: Microbial biomass, soil respiration, and permanganate oxidation. Soil Res. 2002, 40, 859. [Google Scholar] [CrossRef]
  47. Plaza-Bonilla, D.; Álvaro-Fuentes, J.; Cantero-Martínez, C. Identifying soil organic carbon fractions sensitive to agricultural management practices. Soil Tillage Res. 2014, 139, 19–22. [Google Scholar] [CrossRef] [Green Version]
  48. Culman, S.W.; Snapp, S.S.; Freeman, M.A.; Schipanski, M.E.; Beniston, J.; Lal, R.; Drinkwater, L.E.; Franzluebbers, A.J.; Glover, J.D.; Grandy, A.S.; et al. Permanganate Oxidizable Carbon Reflects a Processed Soil Fraction that is Sensitive to Management. Soil Sci. Soc. Am. J. 2012, 76, 494–504. [Google Scholar] [CrossRef] [Green Version]
  49. Islam, K.; Weil, R. Land use effects on soil quality in a tropical forest ecosystem of Bangladesh. Agric. Ecosyst. Environ. 2000, 79, 9–16. [Google Scholar] [CrossRef]
  50. Franzluebbers, A.J.; Stuedemann, J.A. Bermudagrass management in the southern piedmont USA. III. Particulate and biologically active soil carbon. Soil Sci. Soc. Am. J. 2003, 67, 132–138. [Google Scholar] [CrossRef]
  51. Franzluebbers, A.J.; Haney, R.L.; Honeycutt, C.W.; Schomberg, H.H.; Hons, F.M. Flush of Carbon Dioxide Following Rewetting of Dried Soil Relates to Active Organic Pools. Soil Sci. Soc. Am. J. 2000, 64, 613–623. [Google Scholar] [CrossRef]
  52. Acosta-Martínez, V.; Harmel, R.D. Soil Microbial Communities and Enzyme Activities under Various Poultry Litter Application Rates. J. Environ. Qual. 2006, 35, 1309–1318. [Google Scholar] [CrossRef] [PubMed] [Green Version]
  53. Franklin, D.; Truman, C.; Potter, T.; Bosch, D.; Strickland, T.; Jenkins, M.; Nuti, R. Nutrient losses in runoff from conventional and no-till pearl millet on pre-wetted Ultisols fertilized with broiler litter. Agric. Water Manag. 2012, 113, 38–44. [Google Scholar] [CrossRef]
  54. Brookes, P.C. The use of microbial parameters in monitoring soil pollution by heavy metals. Biol. Fertil. Soils 1995, 19, 269–279. [Google Scholar] [CrossRef]
  55. Francis, G.S.; Haynes, R.J.; Williams, P.H. Effects of the timing of ploughing-in temporary leguminous pastures and two winter cover crops on nitrogen mineralization, nitrate leaching and spring wheat growth. J. Agric. Sci. 1995, 124, 1–9. [Google Scholar] [CrossRef]
  56. Rustad, L.E.; News, G.-; Campbell, J.L.; Marion, G.M.; Norby, R.J.; Mitchell, M.J.; Hartley, A.E.; Cornelissen, J.H.C.; Gurevitch, J. A meta-analysis of the response of soil respiration, net nitrogen mineralization, and aboveground plant growth to experimental ecosystem warming. Oecologia 2001, 126, 543–562. [Google Scholar] [CrossRef] [PubMed]
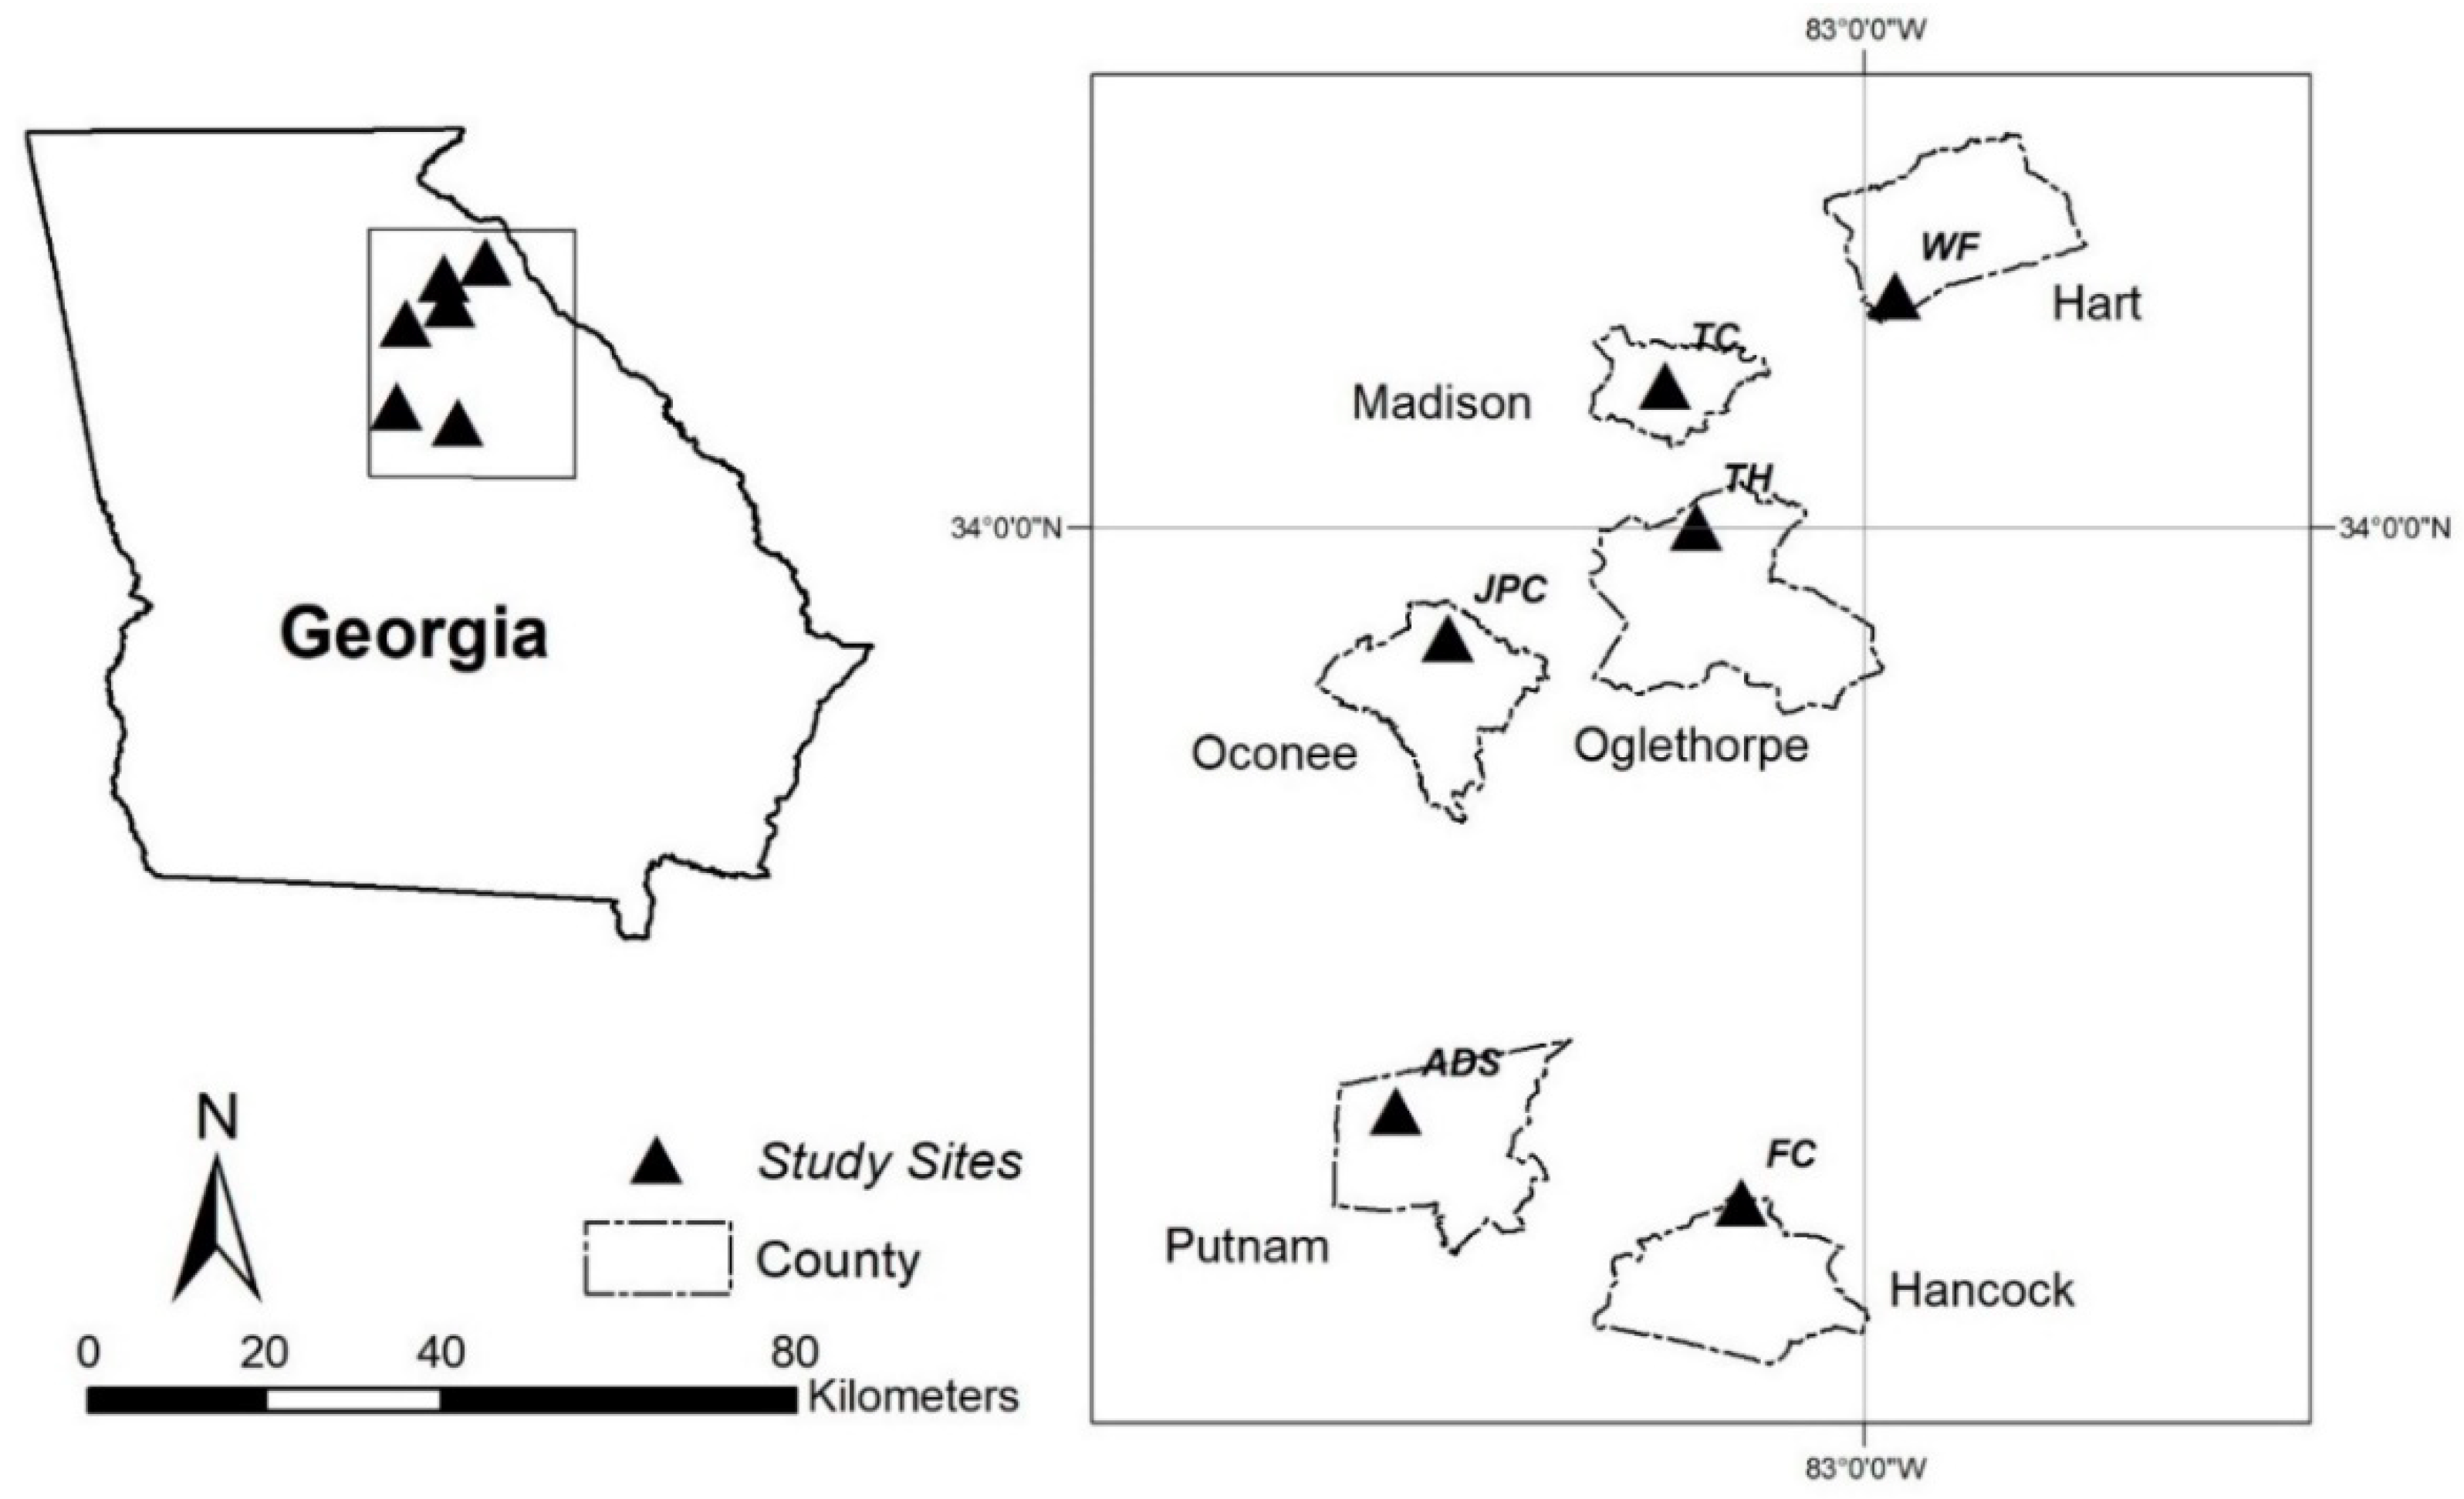
Figure 1. Map of study sites showing pasture locations and respective counties in Georgia, USA.
Sustainability 13 04844 g001
Figure 2. Principal Component Analysis of variables. Dim1 = First principal component, Dim2 = second principal component.
Sustainability 13 04844 g002
Figure 3. Relationship of inorganic N with (A) potentially mineralizable N, (B) bulk density, (C) loss on ignition carbon, and (D) active carbon. The black circles represent soils from the broiler litter applied pastures. Other symbols denote soils from inorganic fertilizer applied pastures.
Sustainability 13 04844 g003
Figure 4. Relationship of potentially mineralizable N with (A) active carbon, (B) soil respiration, (C) bulk density, and (D) loss on ignition carbon. The black circles represent soils from the broiler litter applied pastures. Other symbols denote soils from inorganic fertilizer applied pastures.
Sustainability 13 04844 g004
Figure 5. Relationships of loss on ignition carbon with (A) bulk density and (B) active carbon, and relationship of active carbon with (C) bulk density, and (D) nitrate-nitrogen. The black circles represent soils from the broiler litter applied pastures. Other symbols denote soils from inorganic fertilizer applied pastures.
Sustainability 13 04844 g005
Figure 6. Graphs showing (A) predicted vs. actual plots for soil microbial biomass, and relationships of soil microbial biomass with (B) active carbon, (C) Mehlich-I phosphorus, and (D) bulk density.
Sustainability 13 04844 g006
Figure 7. Predicted vs. actual plots for (A) Inorganic N, and (B) Potentially mineralizable N.
Sustainability 13 04844 g007
Table 1. Location, pasture attributes, management, soil type, and sampling time of study sites.
SiteLocationPasture AttributesManagement/FertilizationSoil TypeSampling DatesSoil Samples
JPCJ. Phil Campbell Sr. Research and Education Center Watkinsville, GAFour Tall Fescue-Bermudagrass mixed pastures, approx. 17 ha each.Historically (more than 10 years before 2016) conventionally grazed. In May 2016, 2 pastures were strategically grazed and other 2 were continuously grazed with rolling out of hay. Inorganic fertilizeri. Fine, kaolinitic, thermic
Typic Kanhapludults
(NRCS-First Order Soil Survey)
July 2017
July 2018
492
ADSAnimal and Dairy
Science Beef Cattle Farm,
Eatonton, GA
Four Tall Fescue-Bermudagrass mixed pastures, approx. 17 ha each.Same as JPC except no external fertilizer applied after May 2016.i. Fine, kaolinitic, thermic
Rhodic Kandiudults;
ii. Loamy, mixed, active,
thermic, shallow
Typic Hapludalfs
(NRCS-First Order Soil Survey)
July 2017
July 2018
528
WFHartwell, GAOne Tall Fescue pasture (19.71 ha) and one Hay field (4.28 ha)Rotationally grazed; Broiler litter fertilizedi. Fine, kaolinitic, thermic
Typic Kanhapludults
May 2017
June 2018
52
TCDanielsville, GAOne Tall Fescue pasture (6.93 ha)Rotationally grazed; Broiler litter fertilizedi. Fine, kaolinitic, thermic
Rhodic Kandiudults;
ii. Fine, kaolinitic, thermic
Typic Kanhapludults
June 201825
THCrawford, GAOne Tall Fescue pasture (2.27 ha)Rotationally grazed; Broiler litter fertilizedi. Fine, kaolinitic, thermic
Typic Kanhapludults
June 201813
FCDevereux, GAOne Tall Fescue pasture (11.26 ha)Rotationally grazed; Broiler litter fertilizedi. Fine, kaolinitic, thermic
Rhodic Kanhapludults;
ii. Fine-loamy, mixed, active, nonacid, thermic Oxyaquic Udifluvents
May 201712
Table 2. Summary statistics of variables including number of samples, median, mean, standard deviation, minimum and maximum, grouped by type of fertilizer applied and depth of soil samples.
Soil Health IndicatorSoil DepthNMedianMeanSDMinMax
Research Pastures (Inorganic and/or No Fertilizer)
Loss on Ignition Carbon (LOI)
(g 100 g−1)
0–533573782729211
5–1033544481719159
10–2032341451716107
Active Carbon (POXC)
(mg kg −1)
0–533572273624024.881355
5–103342993171430.19996
10–203211801921100.1645
Soil Microbial Biomass (SMBC)
(mg CO2-C kg−1)
0–5271681728516409
Soil Respiration
(mg CO2-C m−2 24 h−1)
0–53168441078849194136
Inorganic Nitrogen (N)
(mg kg−1)
0–532936.644.939.10.7327.1
5–103297.910.510.10.593.6
10–203164.76.37.60.179.5
Potentially mineralizable Nitrogen (PMN)
(mg kg−1)
0–533020.721.612.20.159.2
5–103299.610.15.11.033.1
10–203176.26.53.70.131.7
Nitrate-Nitrogen (NO3-N)
(mg kg−1)
0–533031.739.337.80.00298.2
5–103295.37.69.40.0078.7
10–203172.54.37.50.0077.9
Mehlich-I Phosphorus (P)
(mg kg−1)
0–530213.318.327.50.2383.5
5–103286.717.033.10.0257.9
10–203153.114.234.80.0321.3
Bulk Density (BD)
(g cm−3)
0–53331.321.310.190.682.41
5–103301.511.510.150.822.41
10–203151.471.450.130.621.78
Clay%0–533523.521.17.01037.5
5–103352122.010.31036.5
10–203232126.614.91050
A. Farmers’ Field (Broiler Litter Fertilized)
LOI (g 100 g−1)0–101029.411.87.82.536.1
POXC (mg kg−1)0–10102611596139251956
SMBC (mg CO2-C kg−1)0–106425.945.747.14.2235.8
N (mg kg−1)0–1010237.539.916.38.570.1
PMN (mg kg−1)0–1010212.312.45.11.430.1
NO3-N (mg kg−1)0–1010228.228.112.95.153.8
P (mg kg−1)0–106464.162.044.91.5246.7
BD (g cm−3)0–101021.411.410.621.131.67
Clay%0–10641515.65.39.931
Table 3. Multiple regression results for Soil Microbial Biomass prediction.
Multiple Regression for SMBC
TermEstimateSEt-Valuep-ValueVIF
Intercept190.97759.9733.180.0021
Inorganic-Broiler−42.5866.563−6.49<00011.67
POXC/PMN0.3950.0745.34<00011.51
P−0.5640.118−4.79<00011.3
PMN3.1140.9133.410.0011.74
LOI/P−3.7701.187−3.180.00211.16
BD−85.58436.337−2.360.0211.59
The variables are ordered by the log-worth in descending order. SE = standard error, t-value = t score for respective term, VIF = variance inflation factor. Terms with p-value less than 0.05 listed are significant at α = 0.05 significance level. POXC = active carbon, BD = bulk density, P = Mehlich-I phosphorus, Resp = soil respiration, N = inorganic nitrogen, LOI = loss-on-Ignition carbon, PMN = potentially mineralizable nitrogen.
Table 4. Multiple regression results for Inorganic N and Potentially Mineralizable N.
Multiple Regression for N Multiple Regression for PNM
TermEstimateSEt-Valuep-ValueVIFTermEstimateSEt-Valuep-ValueVIF
Intercept40.1347.5985.28<0001 Intercept9.0572.5593.540.0004
POXC0.0490.00317.34<00011.60POXC0.0220.00119.64<00012.02
BD−32.0344.693−6.83<00011.58N0.0580.0115.39<00011.88
P0.1360.0216.5<00011.02Resp−0.0010.000−5.18<00011.02
Resp0.0020.0012.770.00571.01BD−3.3991.599−2.130.03391.63
The variables are ordered by the log-worth in descending order. SE = standard error, t-value = t score for respective term, VIF = variance inflation factor. Terms with p-value less than 0.05 listed are significant at α = 0.05 significance level. POXC = active carbon, BD = bulk density, P = Mehlich-I phosphorus, Resp = soil respiration, N = inorganic nitrogen.
Publisher’s Note: MDPI stays neutral with regard to jurisdictional claims in published maps and institutional affiliations.