
A Causal Network-Based Risk Matrix Model Applicable to Shield TBM Tunneling Projects

 ,
,
Abstract
:1. Introduction
2. Tunnel Risk Analysis Models
2.1. Decision Aids for Tunneling
2.2. Risk Evaluation Based on Event Tree Analysis
2.3. Risk Analysis Based on Matrix Model
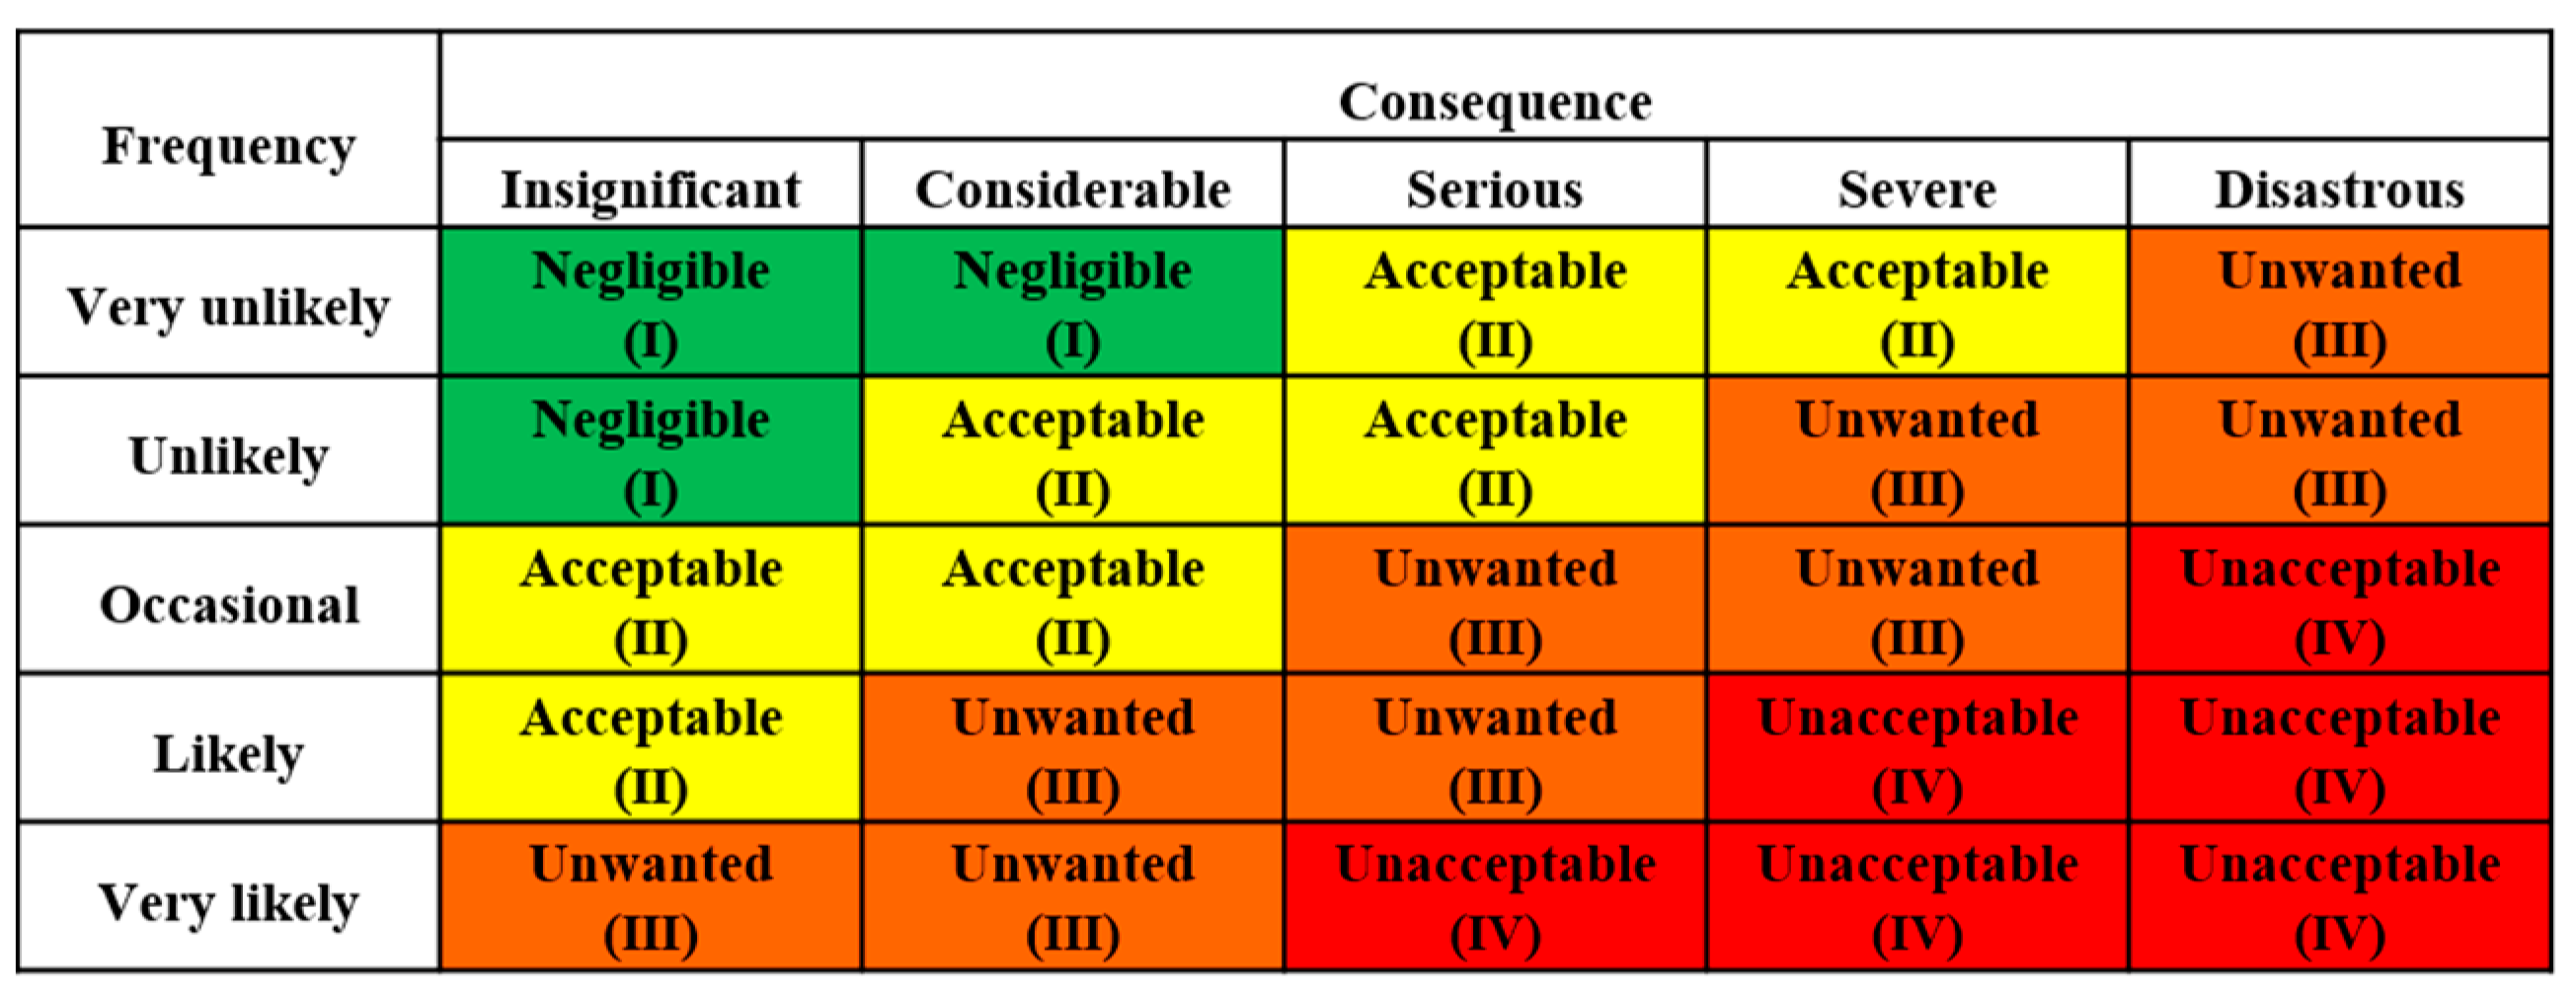
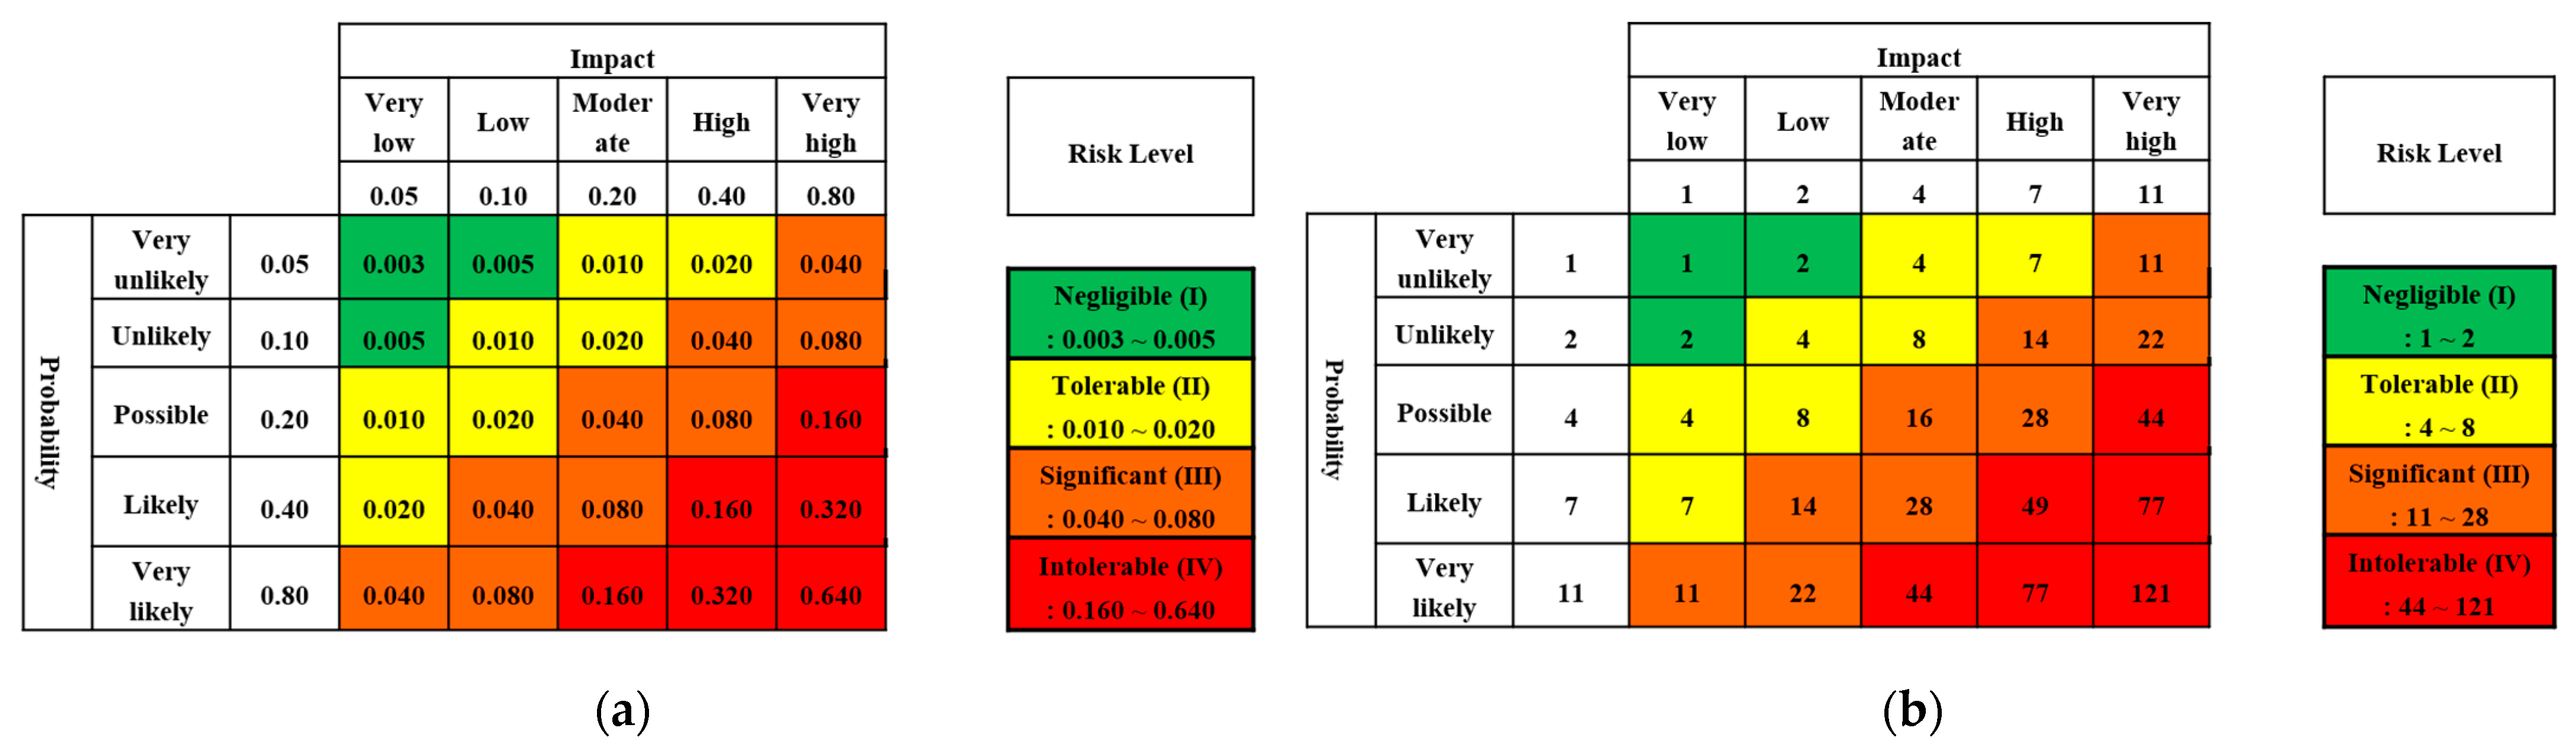
2.3.1. Risk Matrix Model
2.3.2. Risk Matrix Model Using Fault Tree Analysis and Analytic Hierarchy Process
2.4. Risk Analysis Model Using Bayesian Network
3. Development of Causal Network-based Risk Matrix Model
4. Application of CN-Matrix Model
4.1. Modeling Conditions for Real Tunnel Projects
4.2. Comparison of Risk Analysis Models
5. Conclusions
- The ITA-Matrix model easily estimates the degree of risk, but its disadvantage is that it is a qualitative analysis/assessment model. The FTA-AHP Matrix model is a quantitative analysis/assessment model, but there are questions on the endowed weighting scores, which range from 1 to 5 for both the probability and impact categories. Furthermore, the current FTA-AHP Matrix model can be applied only in the design stage because it is difficult for this model to reflect the ground conditions of the job site due to its inability to estimate the degree of risk events caused by the corresponding geological risk factors.
- The STRAM-BN, which uses the Bayesian network, can produce more reasonable results because this model estimates the degree of risk by using the cost of countermeasure on the designated job site; however, the disadvantage is that it is difficult to obtain this cost for a given site. Unlike the FTA-AHP Matrix model, the STRAM-BN has the advantage that it can be used for risk analysis in the construction stage as well as in the design stage because it can estimate the risk degree of sub-risk events caused by the corresponding geological risk factors.
- According to the results of the comparative analysis for the three existing risk analysis models, this study proposes a new risk matrix model named the CN-Matrix model, which is a modified and improved version of the FTA-AHP Matrix model, by complementing the disadvantages of each model and exploiting their advantages. The CN-Matrix model can perform a risk analysis for sub-risk events in the same way as the STRAM-BN. In addition, the newly developed model can analyze risks even in the construction stage as well as in the design stage because it estimates the risk degree of sub-risk events caused by the corresponding geological risk factors, which is similar to the STRAM-BN.
- This study proposed to change the weighting scores of the probability of the sub-risk event as well as its impact so that the change can address the underestimating problems. Furthermore, the impact of this model is determined based on the relative downtimes caused by each risk event, which is easier to apply in practice rather than estimating the cost of countermeasures. Thus, the improved CN-Matrix model is more reliable and robust than the three existing models.
Author Contributions
Funding
Institutional Review Board Statement
Informed Consent Statement
Data Availability Statement
Acknowledgments
Conflicts of Interest
References
- Sharafat, A.; Latif, K.; Seo, J. Risk analysis of TBM tunneling projects based on generic bow-tie risk analysis approach in difficult ground conditions. Tunn. Undergr. Space Technol. 2021, 111, 103860. [Google Scholar] [CrossRef]
- Centers for Medicare & Medicaid Services. XLC Risk Management Guidance and Risk Register Instructions Version 2; Office of Information Services, Centers for Medicare & Medicaid Services: Baltimore, MD, USA, 2014.
- Project Management Institute. PMBOK Guide, 5th ed.; Project Management Institute, Inc.: Newtown Square, PA, USA, 2013. [Google Scholar]
- Tasmanian Government. Project Management Guidelines; Office of eGovernment, Department of Premier and Cabinet, Hobart: Tasmania, Australia, 2011.
- Land Transport Authority. Construction Safety Handbook; Land Transport Authority: Singapore, 2012.
- Land Transport Authority. Safety, Health and Environment (General Specification Appendix A); Land Transport Authority: Singapore, 2018.
- WSP | Parsons Brinckerhoff. NCHRP 08-36 Task 126 Development of Risk Register Spreadsheet Tool; Transportation Research Board, National Academy of Sciences: Washington, DC, USA, 2016. [Google Scholar]
- Ministry of Land, Infrastructure and Transport. Task Manual on Design for Safety; Ministry of Land, Infrastructure and Transport: Sejong, Korea, 2017.
- Korea Expressway Corporation Research Institute. A Development of Risk Management System for Safety Management During Tunnel Construction Stage; Korea Expressway Corporation Research Institute, Hwaseong: Gyeonggi, Korea, 2017. [Google Scholar]
- Einstein, H.H.; Indermitte, C.; Sinfield, J.; Descoeudres, F.P.; Dudt, J.-P. Decision aids for tunneling. Transp. Res. Rec. 1999, 1656, 6–13. [Google Scholar] [CrossRef]
- Min, S.; Einstein, H.; Lee, J.; Lee, H. Application of the Decision Aids for Tunneling (DAT) to update excavation cost/time information. KSCE J. Civ. Eng. 2005, 9, 335–346. [Google Scholar] [CrossRef]
- Hong, E.S.; Lee, I.M.; Shin, H.S.; Nam, S.W.; Kong, J.S. Quantitative risk evaluation based on event tree analysis technique: Application to the design of shield TBM. Tunn. Undergr. Space Technol. 2009, 24, 269–277. [Google Scholar] [CrossRef]
- Eskesen, S.D.; Tengborg, P.; Kampmann, J.; Veicherts, T.H. Guidelines for tunnelling risk management: International Tunnelling Association, Working Group No.2. Tunn. Undergr. Space Technol. 2004, 19, 217–237. [Google Scholar] [CrossRef]
- Hyun, K.C.; Min, S.; Choi, H.; Park, J.; Lee, I.M. Risk analysis using fault-tree analysis (FTA) and analytic hierarchy process (AHP) applicable to shield TBM tunnels. Tunn. Undergr. Space Technol. 2015, 49, 121–129. [Google Scholar] [CrossRef]
- Liu, Y.; Fan, Z.P.; Yuan, Y.; Li, H.Y. A FTA-based method for risk decision-making in emergency response. Comput. Oper. Res. 2014, 42, 49–57. [Google Scholar] [CrossRef] [PubMed]
- Zhou, X.Y.; Wang, L.Q.; Qin, J.D.; Chai, J.; Munoz, C.Q.G. Emergency rescue planning under probabilistic linguistic information: An integrated FTA-ANP method. Int. J. Disast. Risk Reduct. 2019, 37, 101170. [Google Scholar] [CrossRef]
- Saaty, T. The Analytical Hierarchy Process, Planning, Priority; RWS Publications: Pittshurgh, PA, USA, 1980. [Google Scholar]
- Chung, H.; Lee, I.-M.; Jung, J.-H.; Park, J. Bayesian networks-based shield TBM risk management system: Methodology development and application. KSCE J. Civ. Eng. 2019, 23, 452–465. [Google Scholar] [CrossRef]


| Class | Interval 1 | Central Value 1 |
|---|---|---|
| Very likely | >0.3 | 1 |
| Likely | 0.03 to 0.3 | 0.1 |
| Occasional | 0.003 to 0.03 | 0.01 |
| Unlikely | 0.0003 to 0.003 | 0.001 |
| Very unlikely | <0.0003 | 0.0001 |
| Class | Injury to Workers and Emergency Crew [No. of Fatalities/Injuries] 1 | Injury to Third Parties [No. of Fatalities/Injuries] 1 | Damage or Economic Loss to the Third Party [Loss in Million Euro] | Harm to the Environment [Guideline for Proportions of Damage] | Delay [Months per Hazard] | Economic Loss to the Owner [Loss in Million Euro] |
|---|---|---|---|---|---|---|
| Disastrous | F > 10 | F > 1, SI > 10 | >3 | Permanent severe damage | >10 or >24 | >30 |
| Severe | 1 < F ≤ 10, SI > 10 | 1F, 1 < SI ≤ 10 | 0.3–3 | Permanent minor damage | 1–10 or 6–24 | 3–30 |
| Serious | 1F, 1 < SI ≤ 10 | 1SI, 1 < MI ≤ 10 | 0.03–0.3 | Long-term effects | 0.1–1 or 2–6 | 0.3–3 |
| Considerable | 1SI, 1 < MI ≤ 10 | 1MI | 0.003–0.03 | Temporary severe damage | 0.01–0.1 or 1/2–2 | 0.03–0.3 |
| Insignificant | 1MI | - | <0.003 | Temporary minor damage | <0.01 or <1/2 | <0.03 |
| Response Phase | Degree of Risk 1 | Description |
|---|---|---|
| I | 0–10 | Excavation without mitigation measure owing to a low degree of risk |
| II | 10–30 | Excavation with the intention to prepare for the risk |
| III | 30–80 | Excavation with mitigation measure owing to a high degree of risk |
| IV | >80 | Unconditionally applying mitigation measure owing to a very high degree of risk |
| Risk Analysis Model | Frequency (Probability) | |
|---|---|---|
| ITA-Matrix model | Determines the frequency class of a risk event based on the frequency classification criteria - The grounds for the criteria are unclear [Disadvantage] | 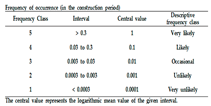 |
| FTA-AHP Matrix model | Determines the probability of top risk events by using FTA - Difficult to calculate the probability of risk events for each geological risk factor [Disadvantage] |  |
| STRAM-BN | Determines the conditional probability of sub-risk events by using the Bayesian network - Can calculate the probability of risk events for each geological risk factor [Advantage] |  |
| Risk Analysis Model | Consequence (Impact) |
|---|---|
| ITA-Matrix model | Determines the consequence class based on the classification criteria of six consequence analysis items - The grounds for the criteria are unclear [Disadvantage] |
| FTA-AHP Matrix model | Can determine the impact of top risk events using AHP even without cost estimation [Advantage] |
| STRAM-BN | Cost of countermeasure of the site are required [Disadvantage] |
| The consequence analysis results with consequence using the detailed countermeasure cost of the site further reflect site conditions [Advantage] |
| Risk Analysis Model | Risk Degree |
|---|---|
| ITA-Matrix model | Combination of frequency and consequence classes -Relatively easy to determine [Advantage] -It is based on qualitative analysis results [Disadvantage] |
| Difficult to determine the risk degree of potential risk events resulting from each geological risk factor [Disadvantage] | |
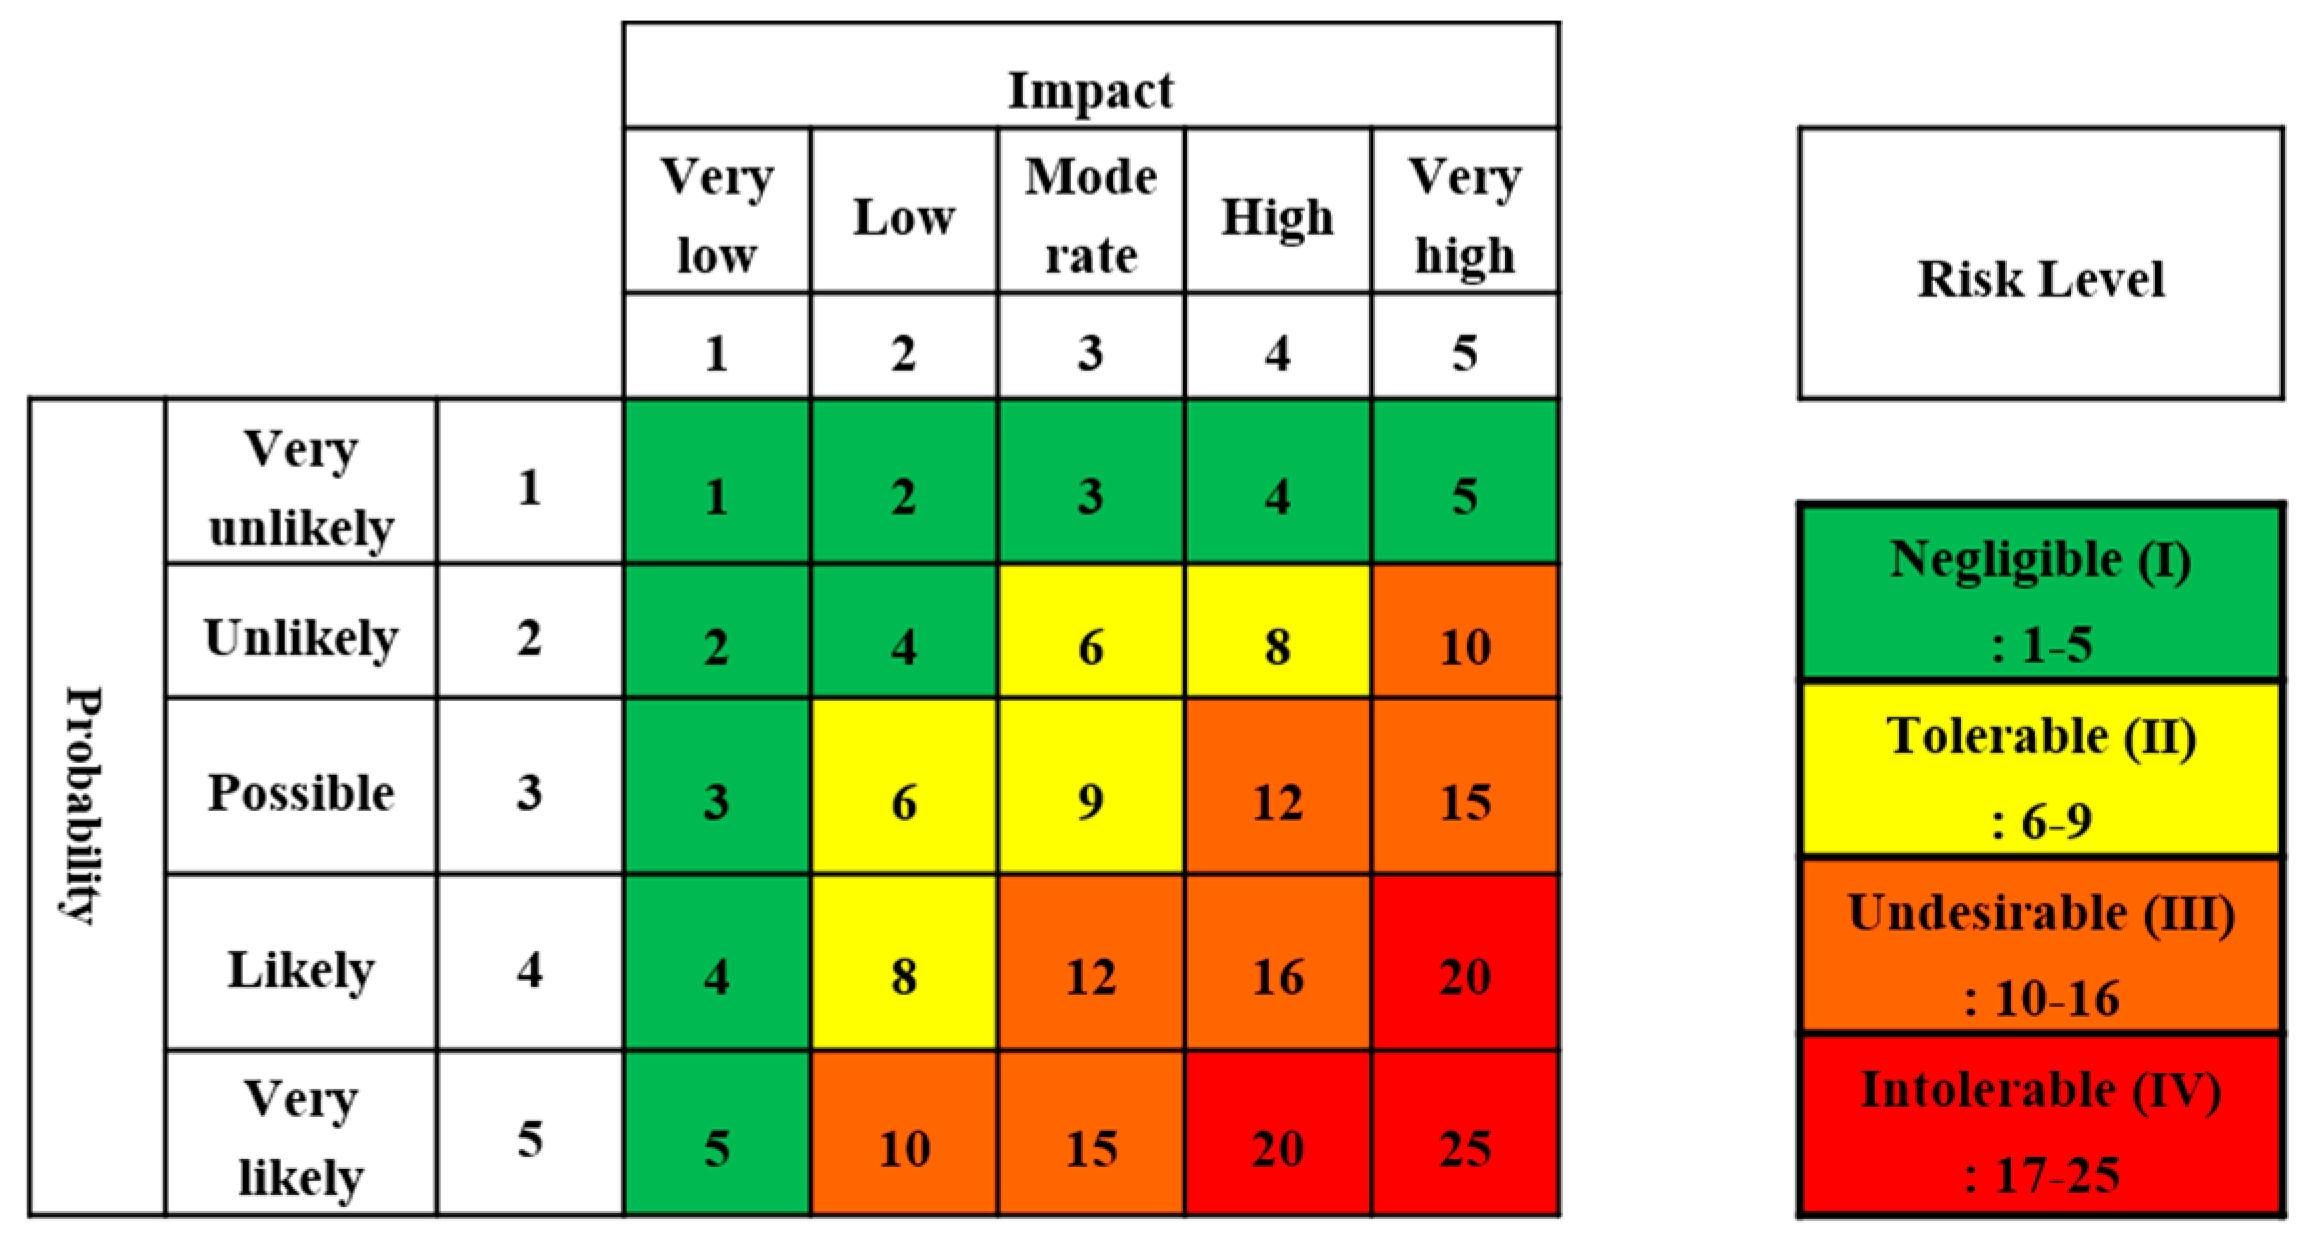
| FTA-AHP Matrix model | Probability score × Impact score (1–5 points) (1–5 points) - Relatively easy to determine [Advantage] - Quantitative analysis results [Advantage] |
| Difficult to determine the risk degree of potential risk events resulting from each geological risk factor [Disadvantage] - Difficult to reflect site ground conditions - Difficult to apply to the construction stage | |
| STRAM-BN | Probability × Countermeasure cost (1–5 points) (1–5 points) - Relatively complex to calculate [Disadvantage] - Quantitative analysis results [Advantage] |
| Can determine the risk degree of potential risk events resulting from each geological risk factor [Advantage] - Can reflect the site ground conditions - Applicable to the construction stage as well as to the design stage |
| Risk Analysis Model | Risk Level (Risk Response Phase) |
|---|---|
| ITA-Matrix model |
|
| FTA-AHP Matrix model |
|
| STRAM-BN |
|
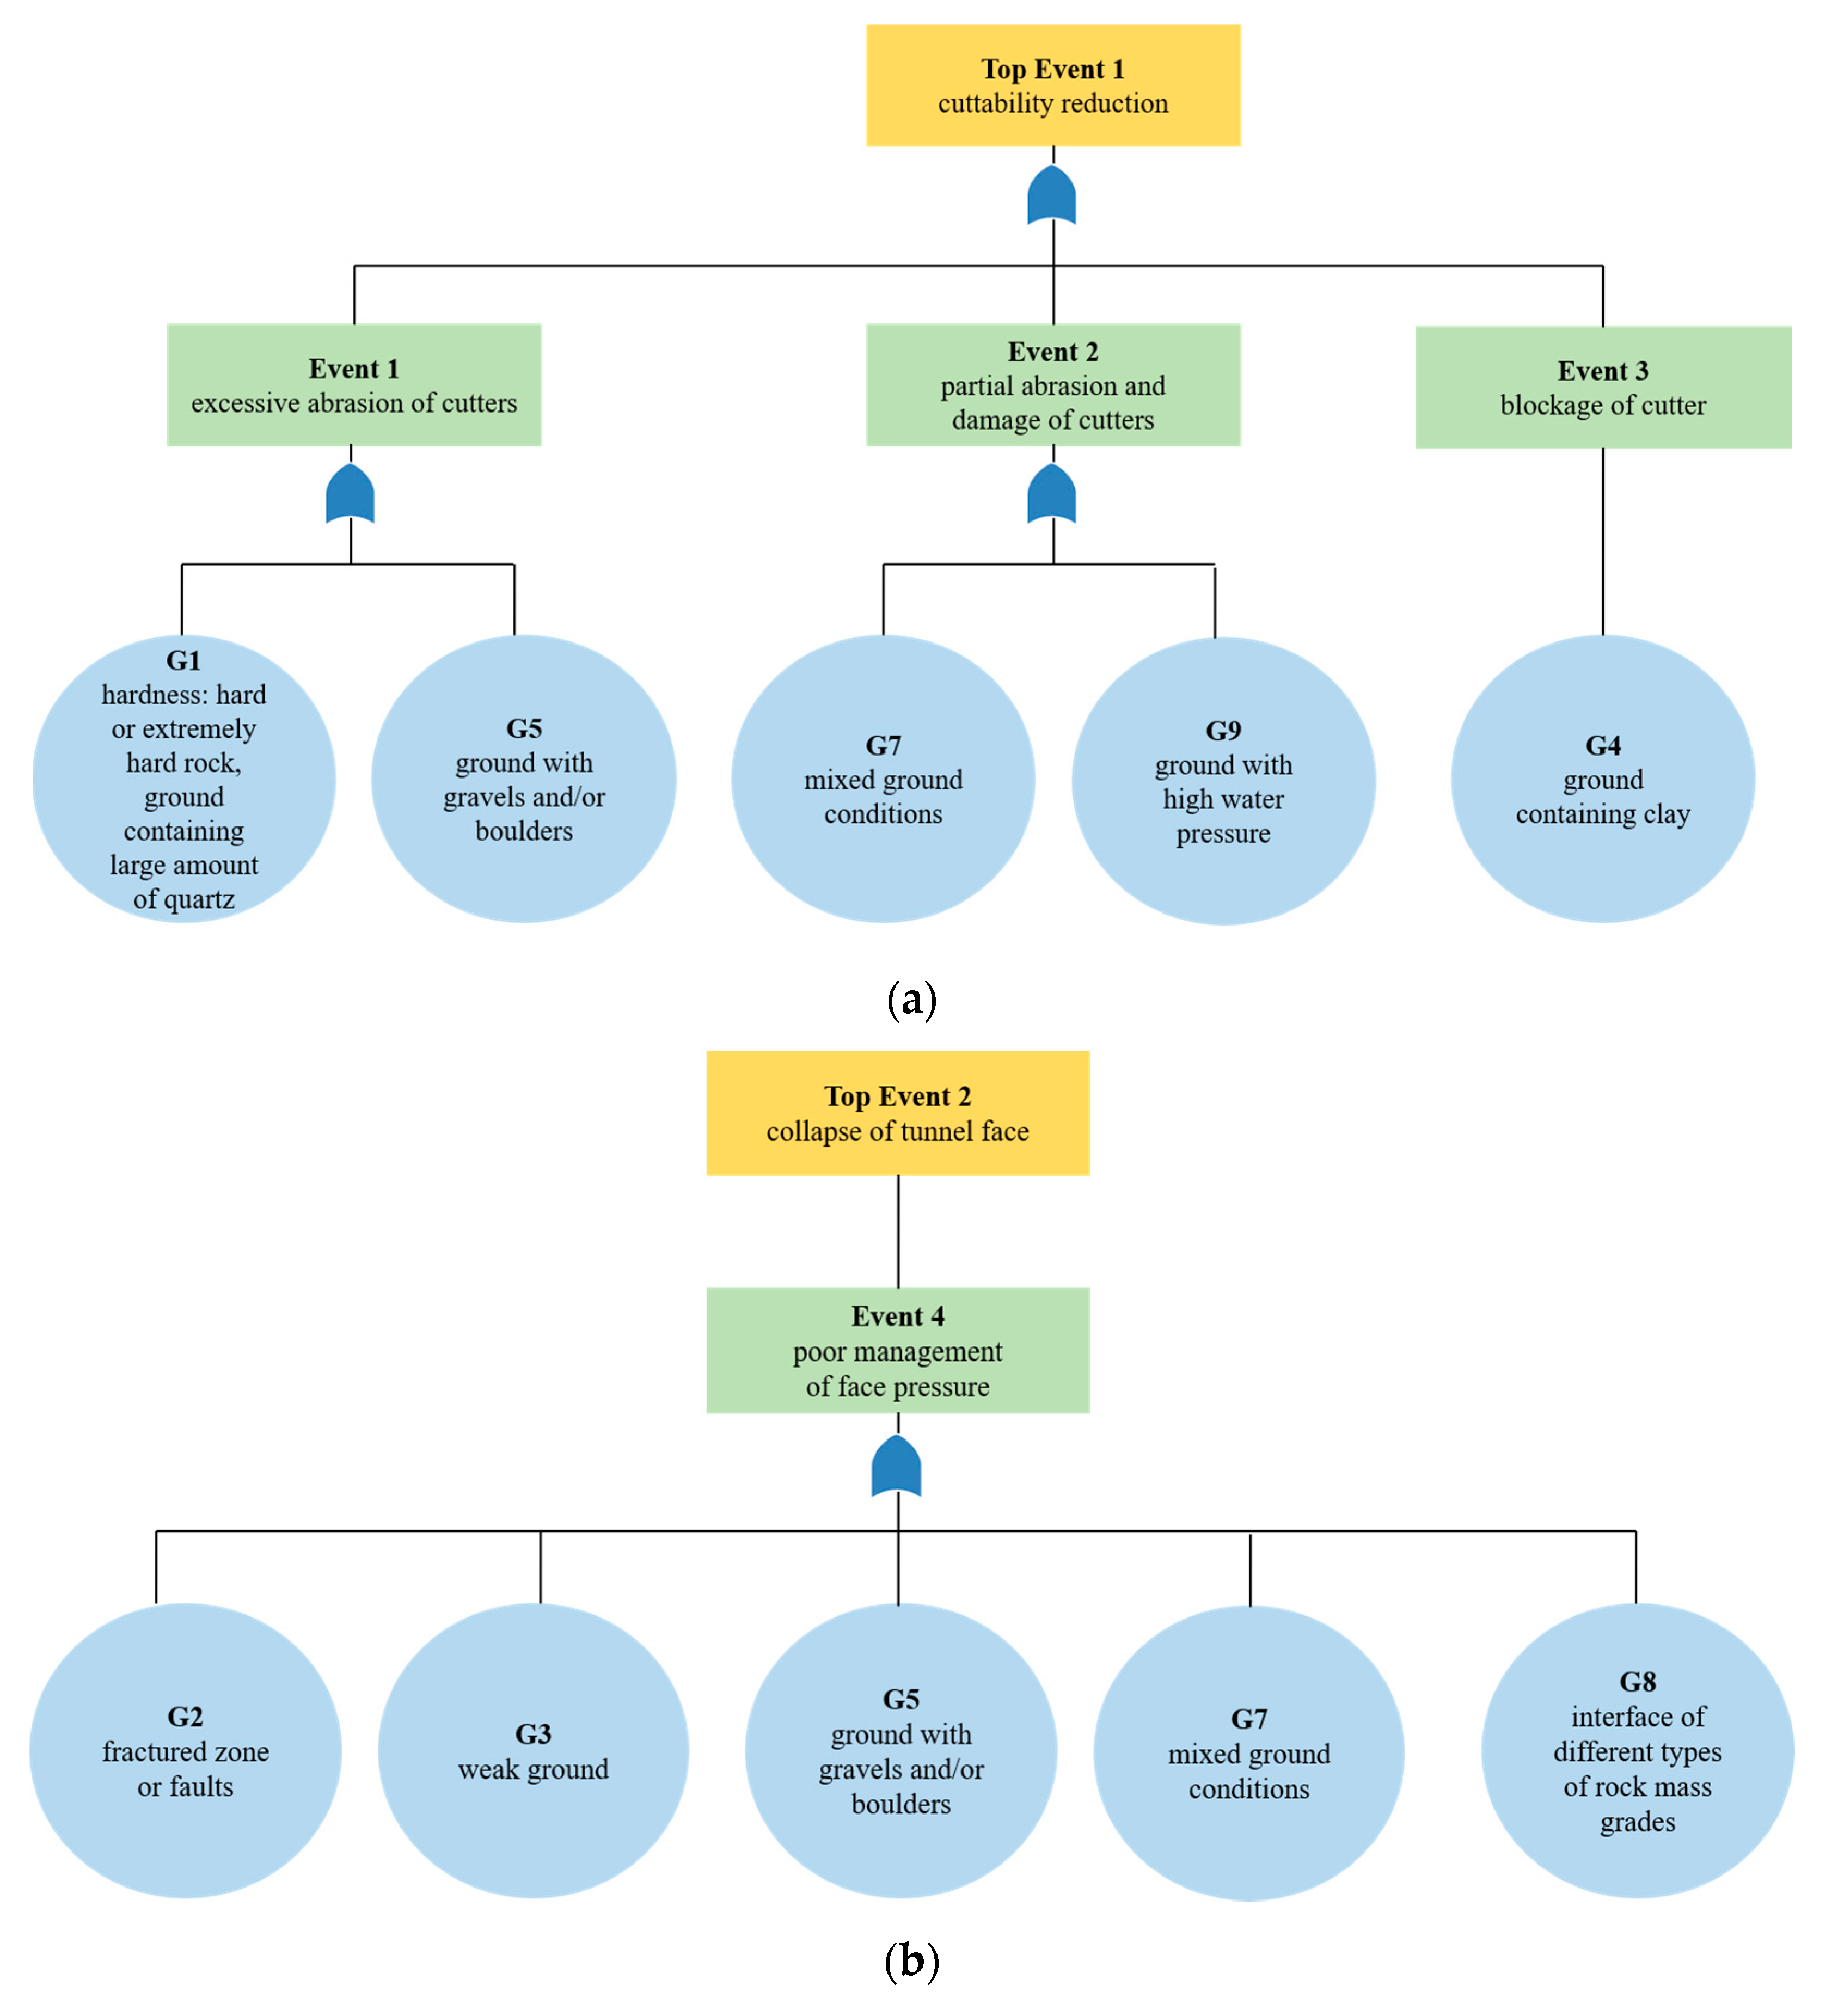
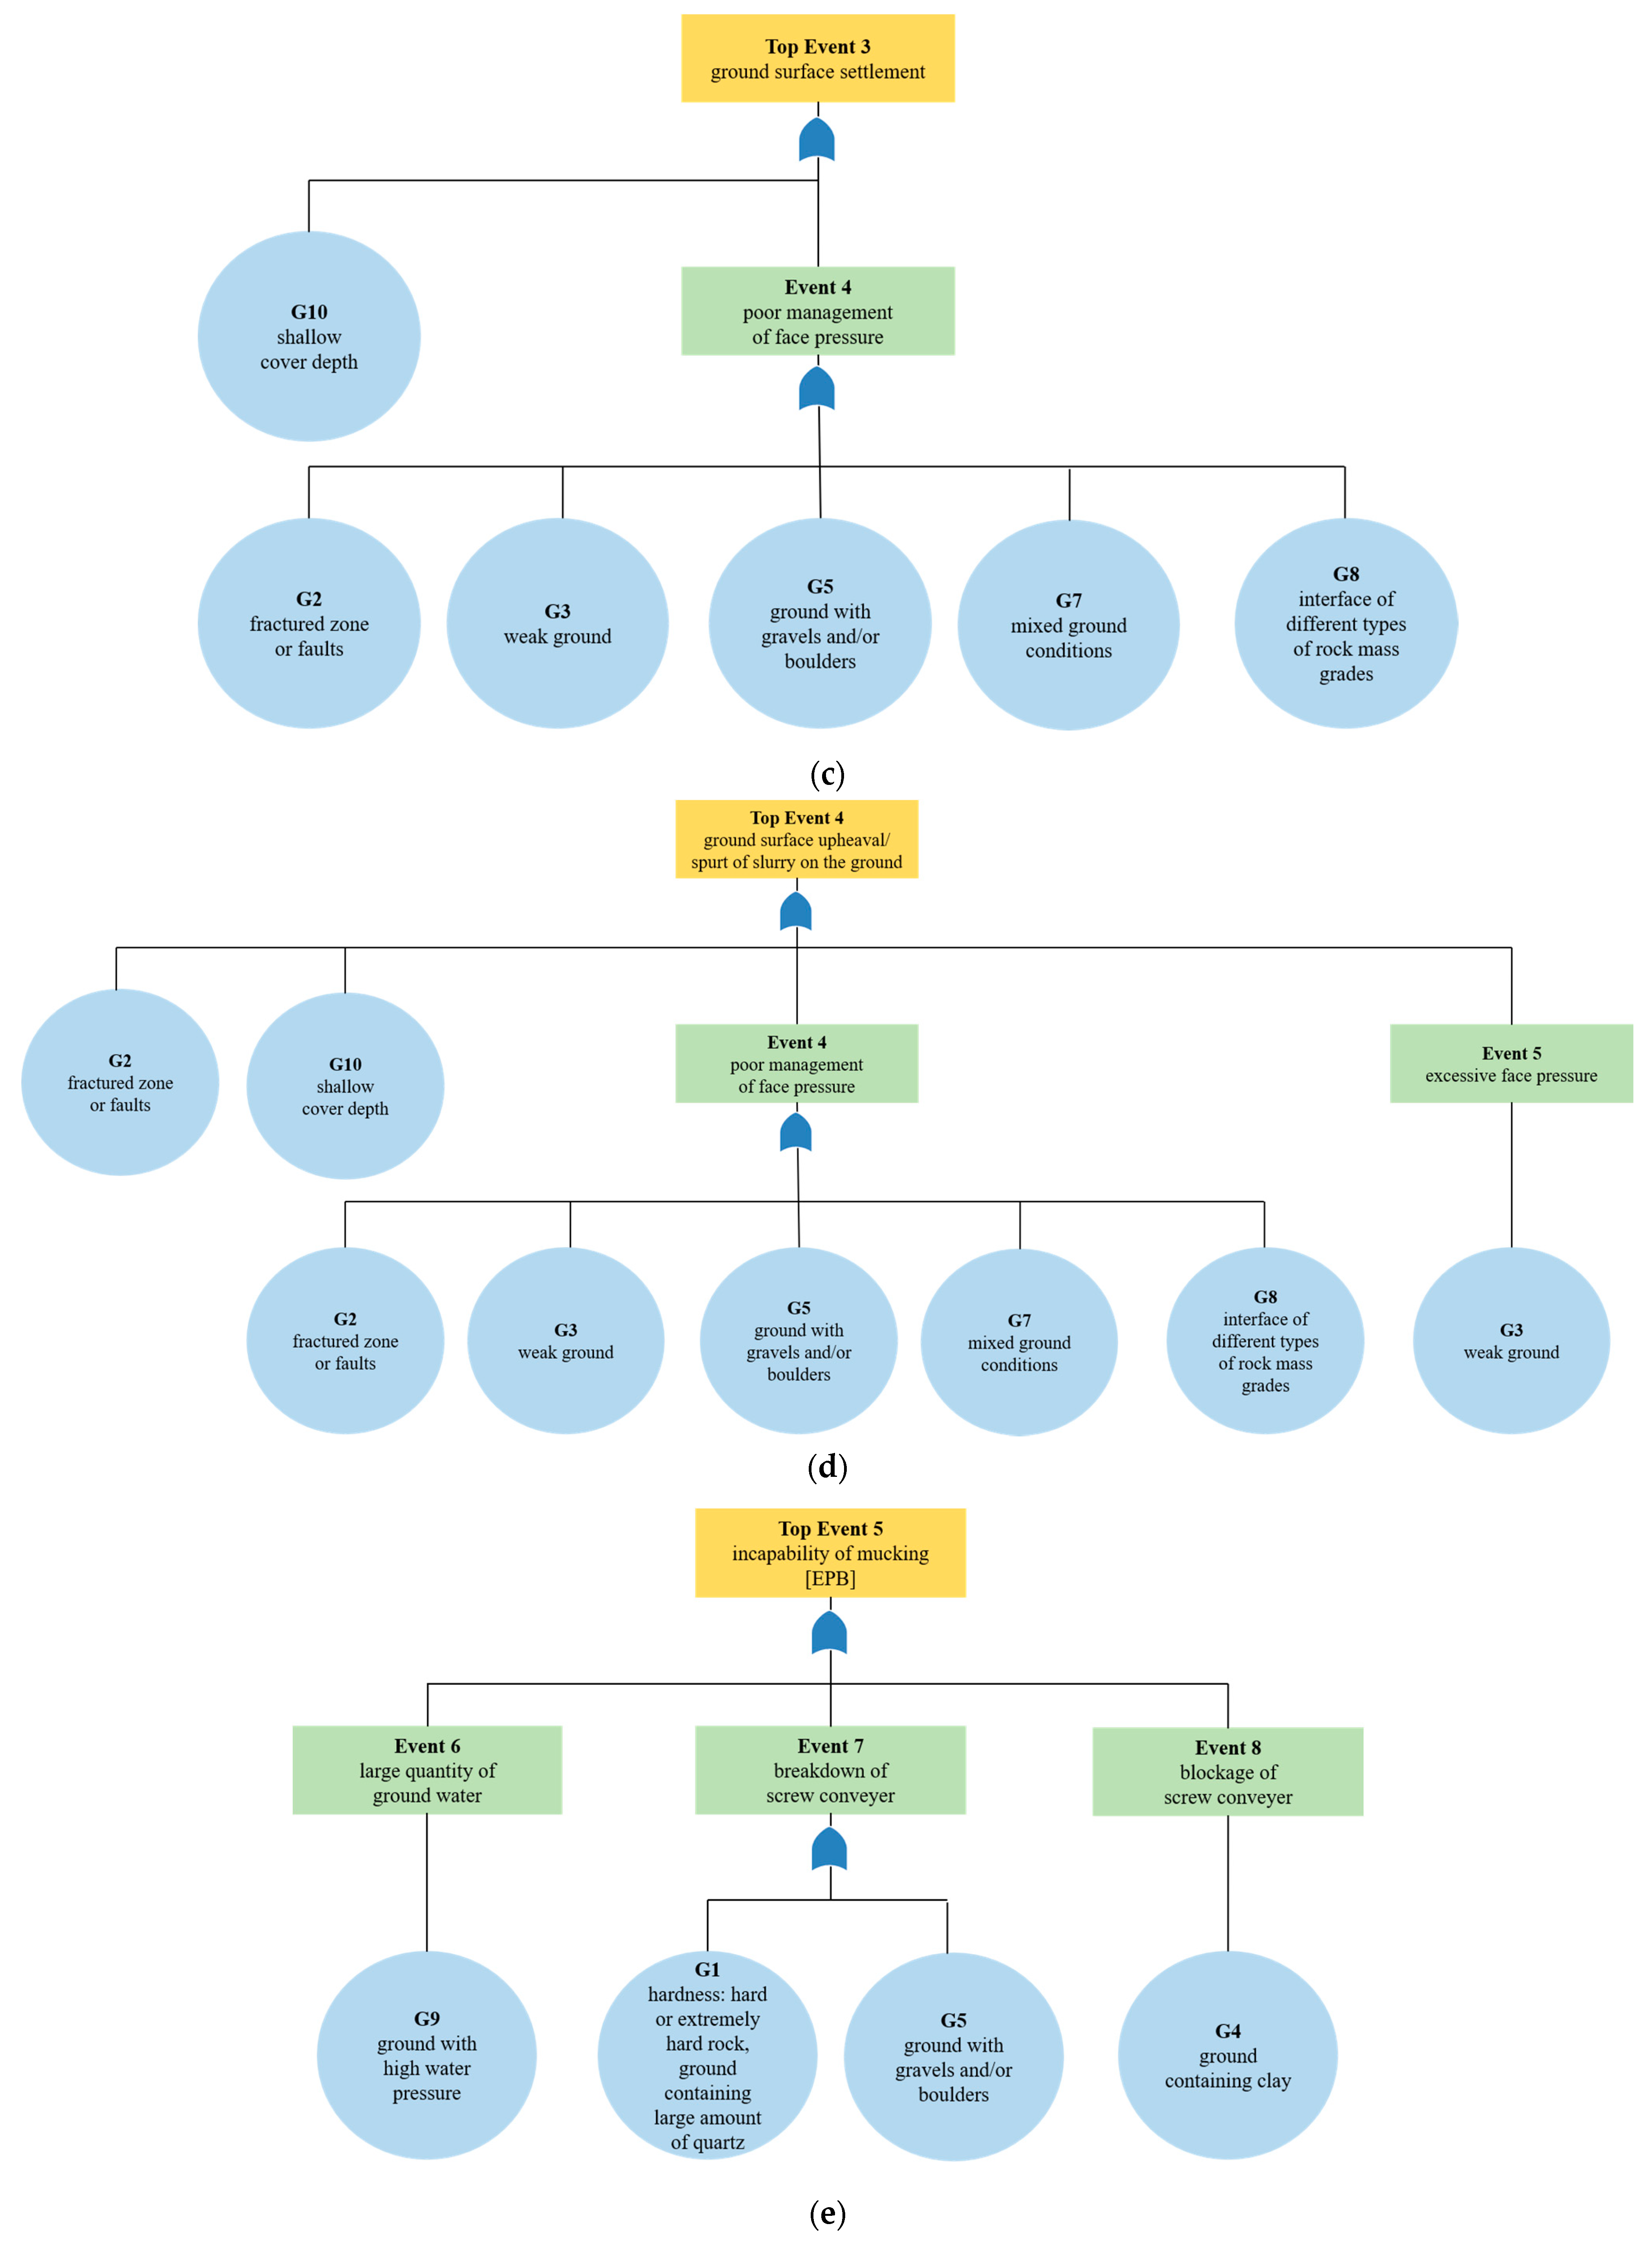
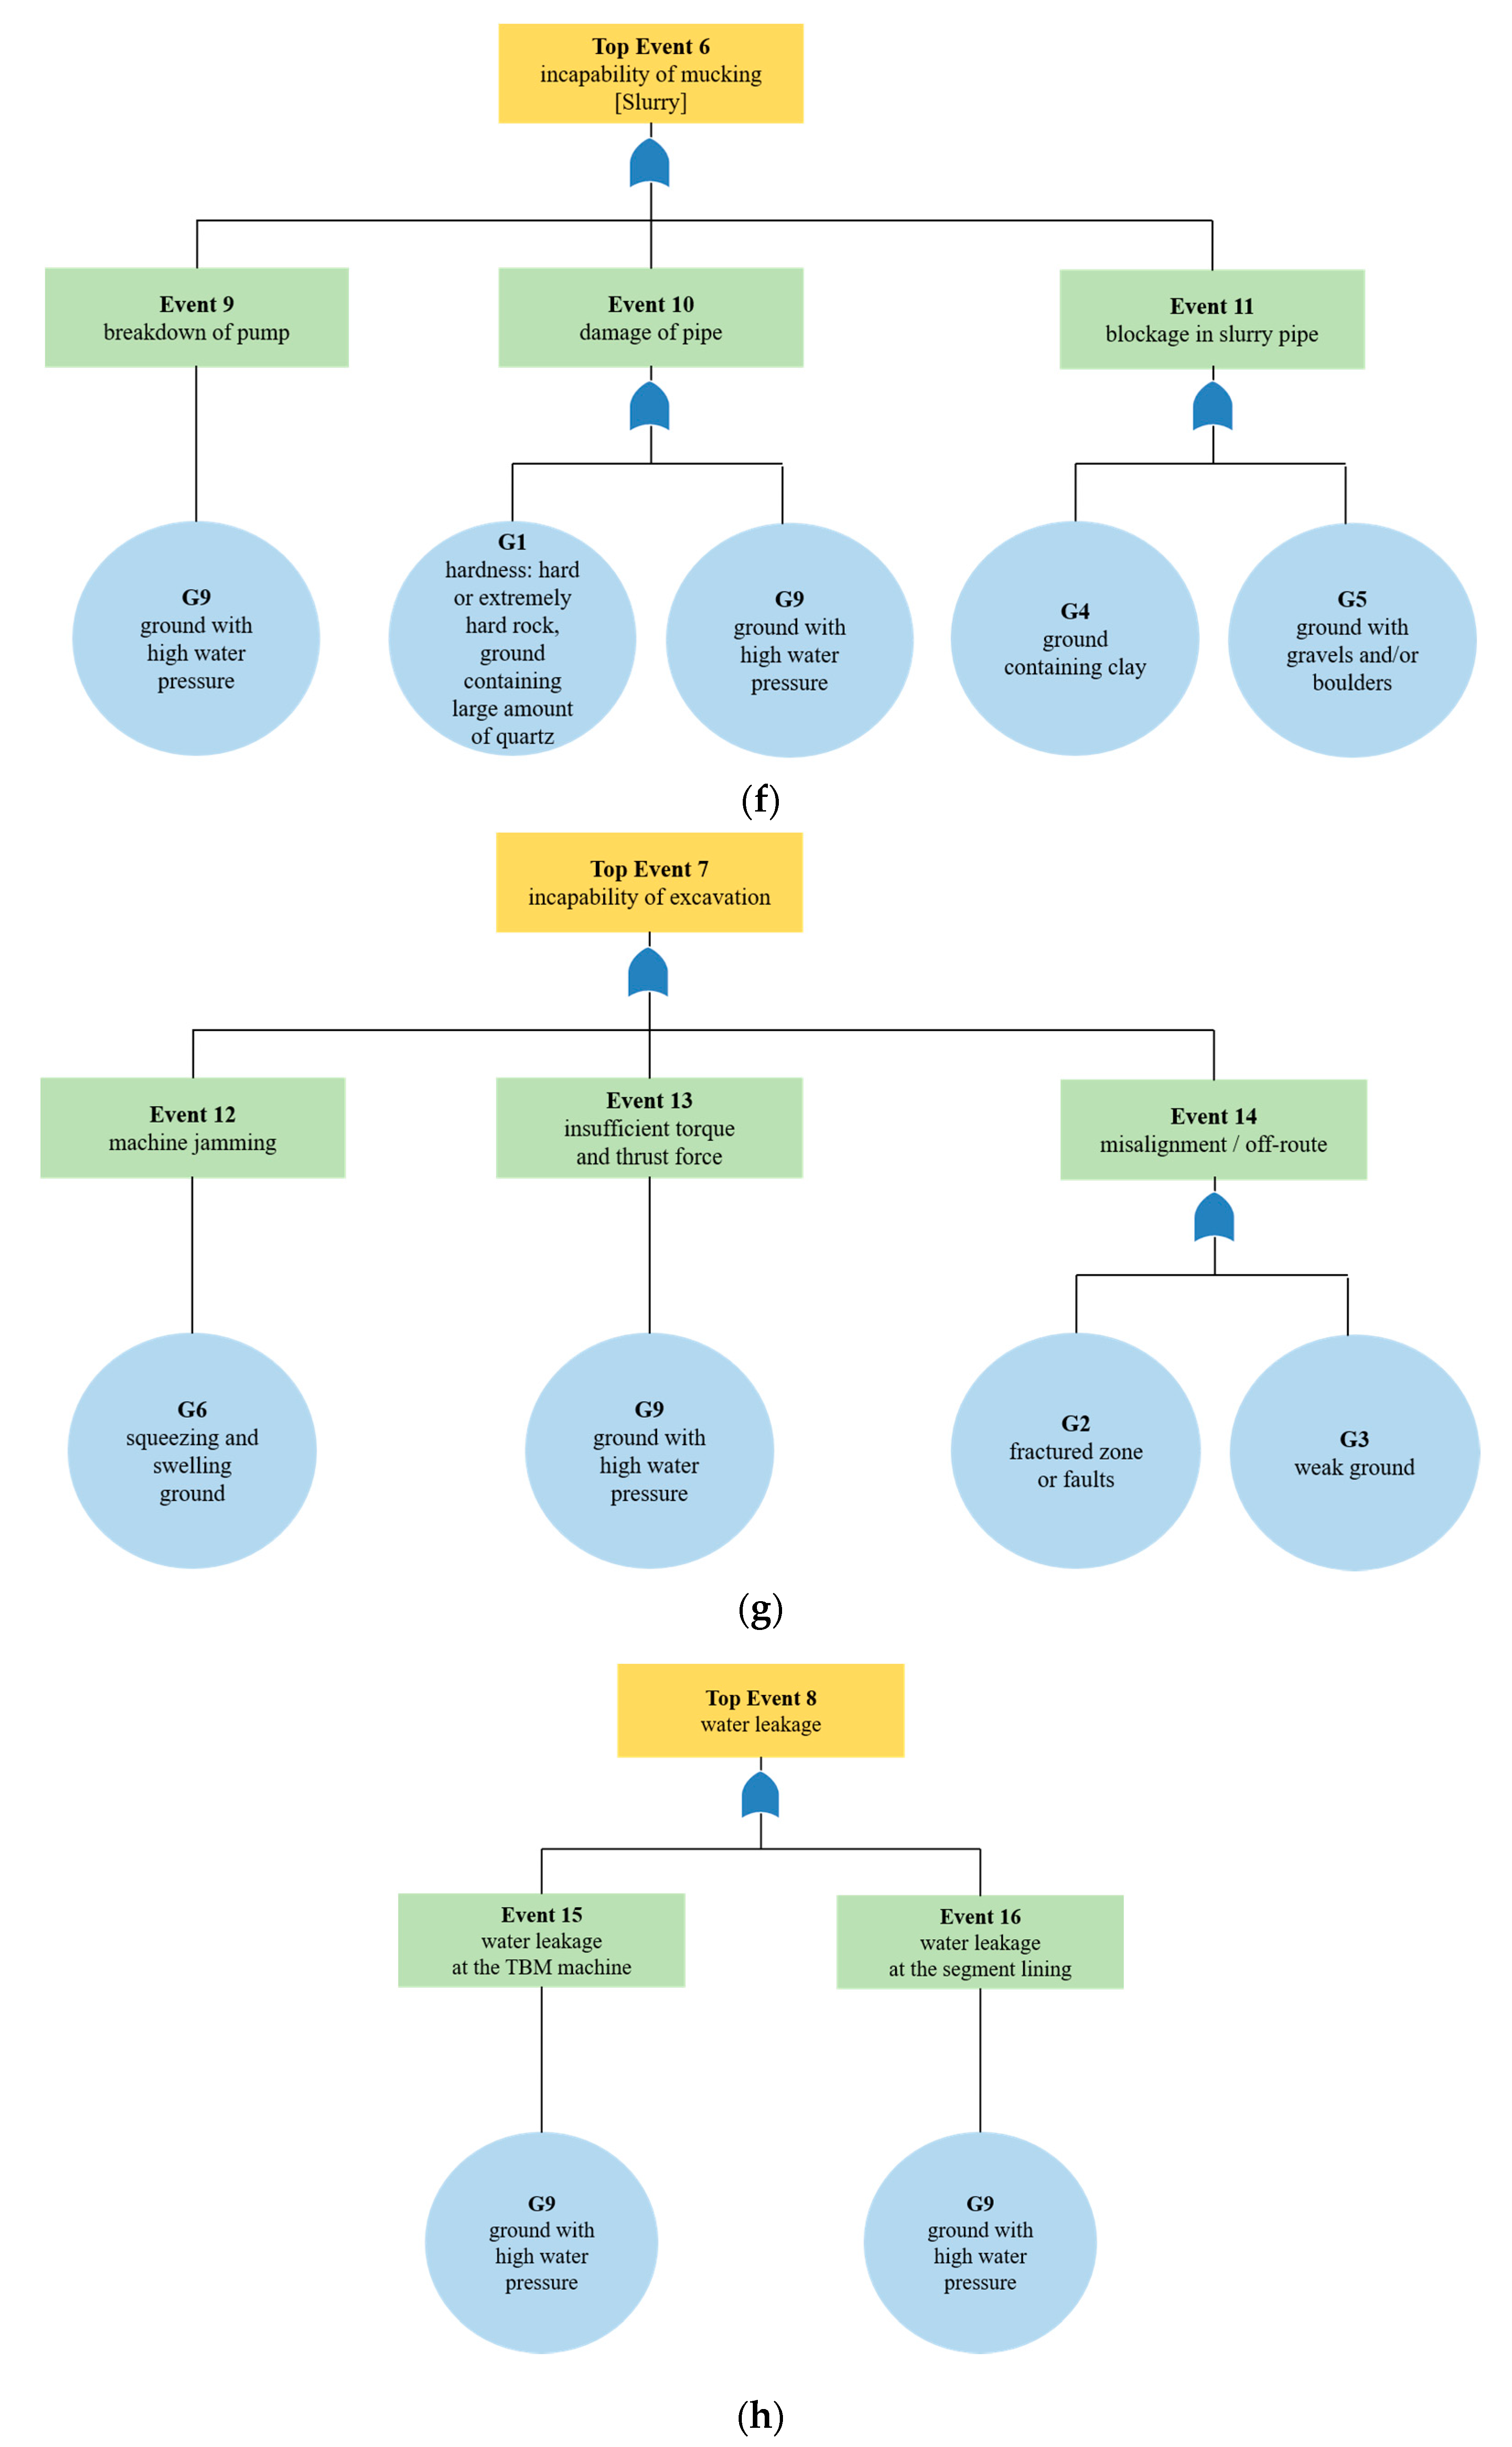
| Class | Geological Risk Factor |
|---|---|
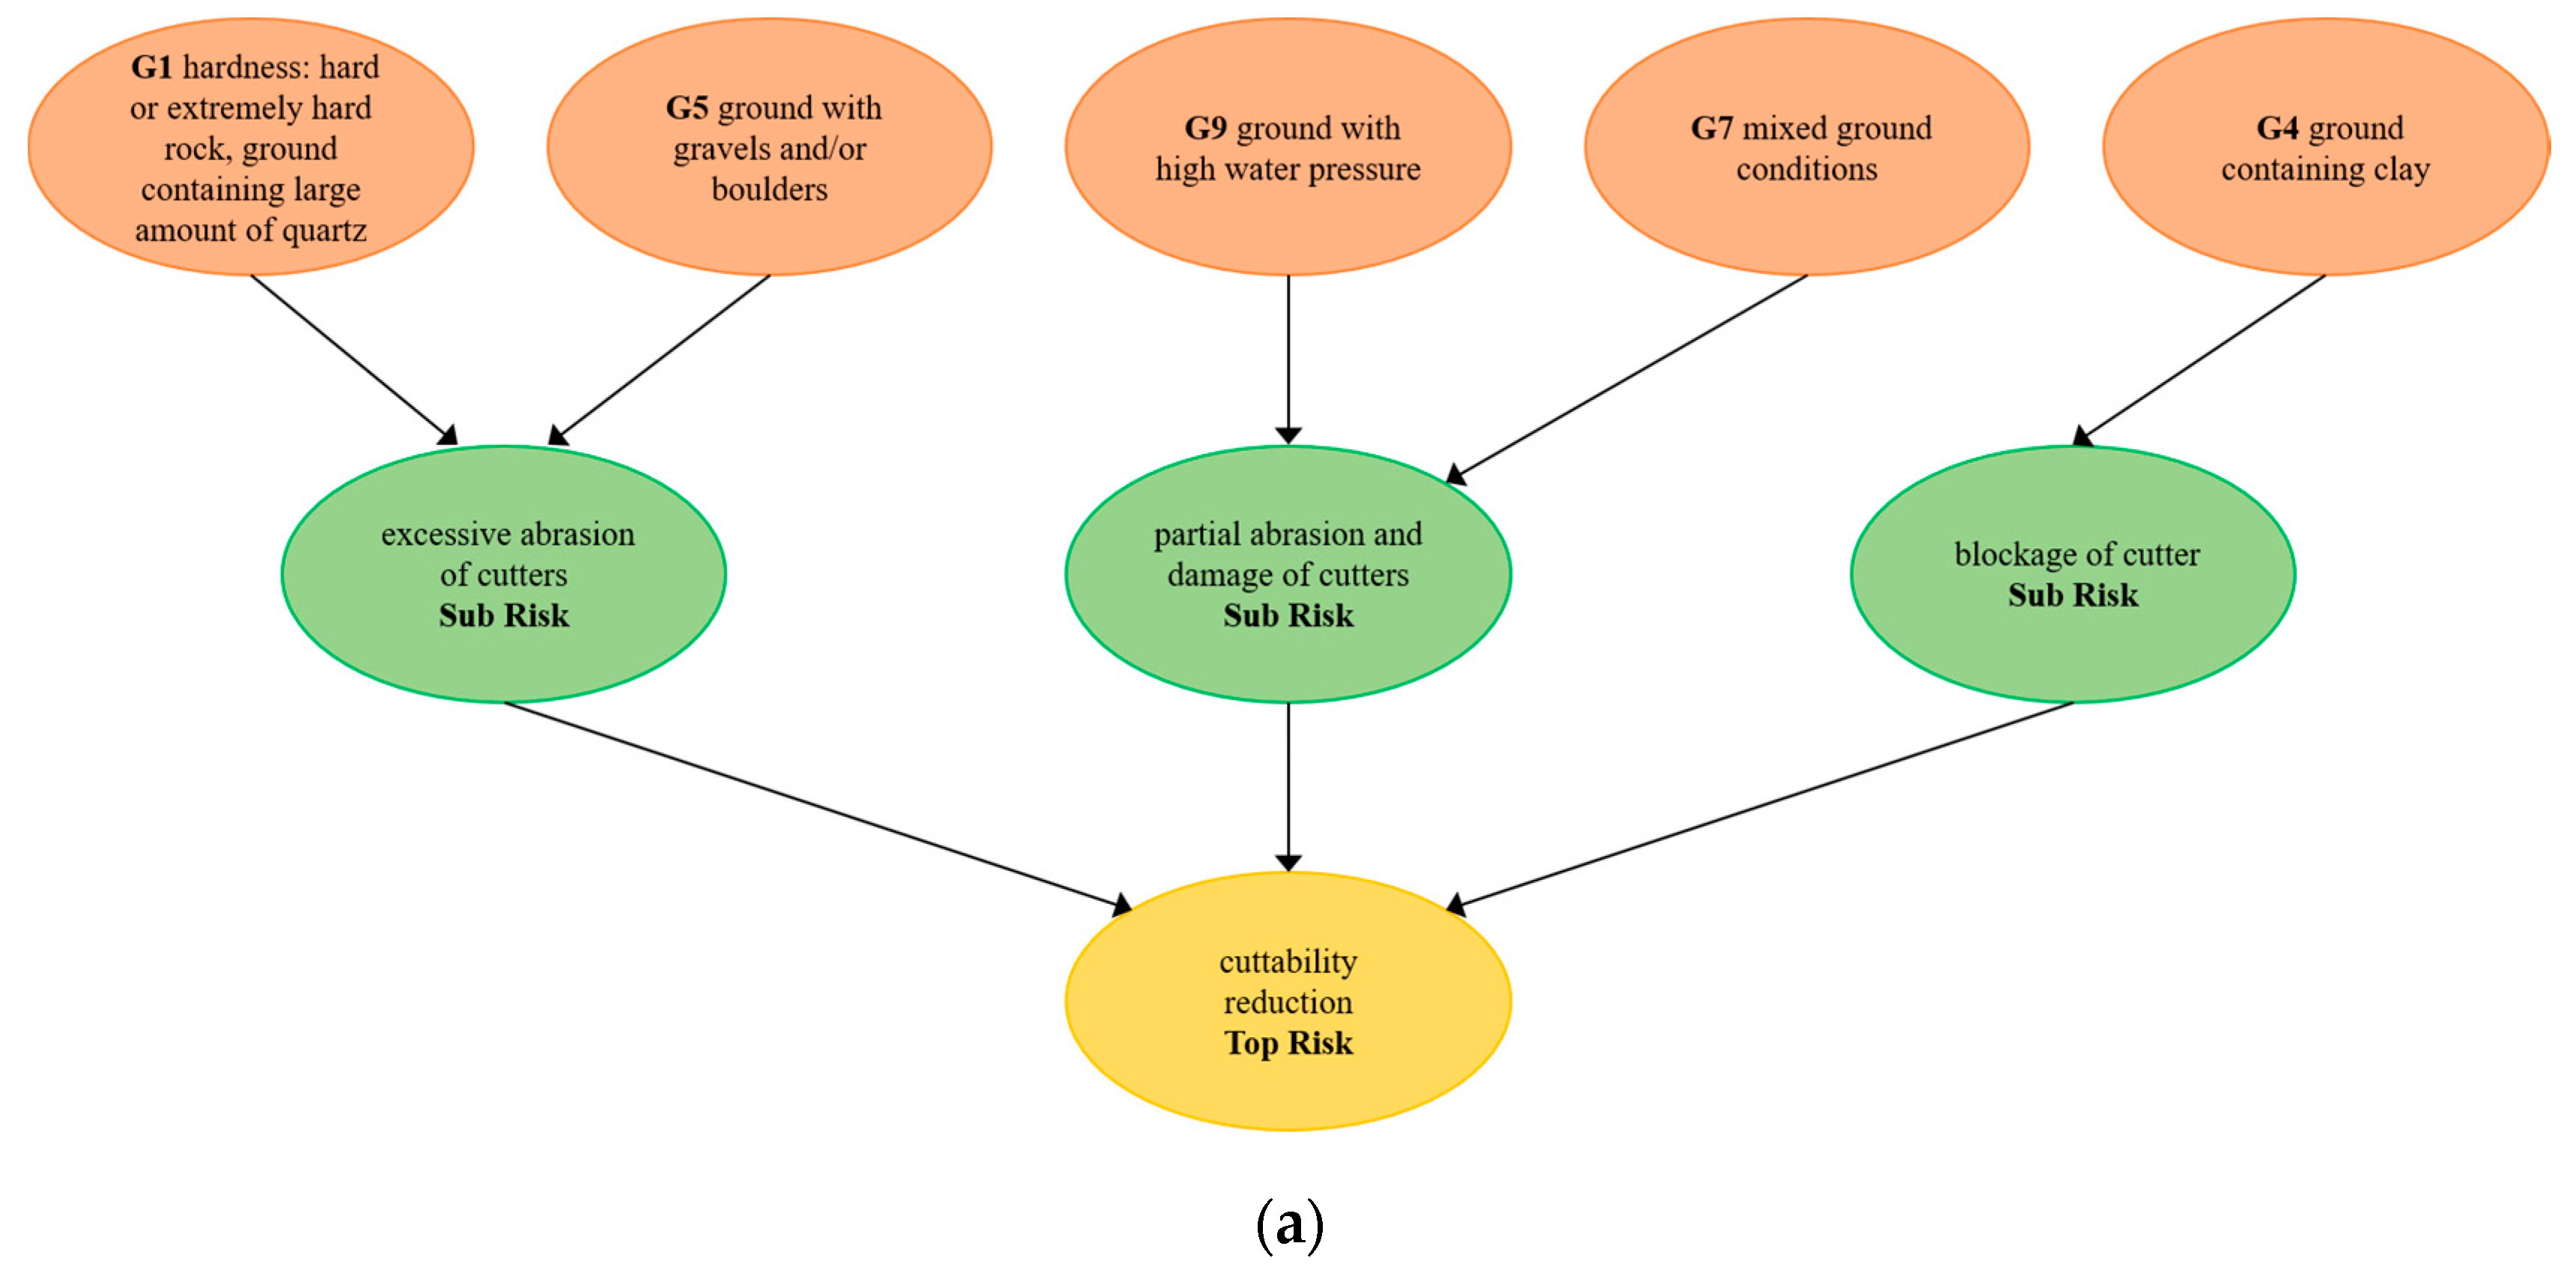
| G1 | Hardness: hard or extremely hard rock, ground containing a large amount of quartz |
| G2 | Fractured zone or faults |
| G3 | Weak ground |
| G4 | Ground containing clay |
| G5 | Ground with gravels and/or boulders |
| G6 | Squeezing and swelling ground |
| G7 | Mixed ground conditions |
| G8 | Interface of different types of rock mass grades |
| G9 | Ground with high water pressure |
| G10 | Shallow cover depth |
| Top Risk Event | Sub-Risk Event | Risk Event No. | |
|---|---|---|---|
| STRAM-BN/CN-Matrix | FTA-AHP Matrix | ||
| Cuttability reduction | Excessive abrasion of cutters | RE1-1 | T1 |
| Partial abrasion and damage of cutters | RE1-2 | ||
| Blockage of cutter | RE1-3 | ||
| Collapse of tunnel face | RE2 | T2 | |
| Ground surface settlement | RE3 | T3 | |
| Ground surface upheaval [Slurry] | RE4 | T4 | |
| Spurt of slurry on the ground [Slurry] | RE5 | ||
| Incapability of mucking [EPB] | Large quantity of groundwater | RE6-1 | T5 |
| Breakdown of screw conveyor | RE6-2 | ||
| Blockage of screw conveyor | RE6-3 | ||
| Incapability of mucking [Slurry] | Damage of pipe and pump | RE6-4 | T6 |
| Blockage of slurry pipe | RE6-5 | ||
| Incapability of excavation | Machine jamming | RE7-1 | T7 |
| Insufficient torque and thrust force | RE7-2 | ||
| Misalignment/Off-route | RE7-3 | ||
| Water leakage | RE8 | T8 | |
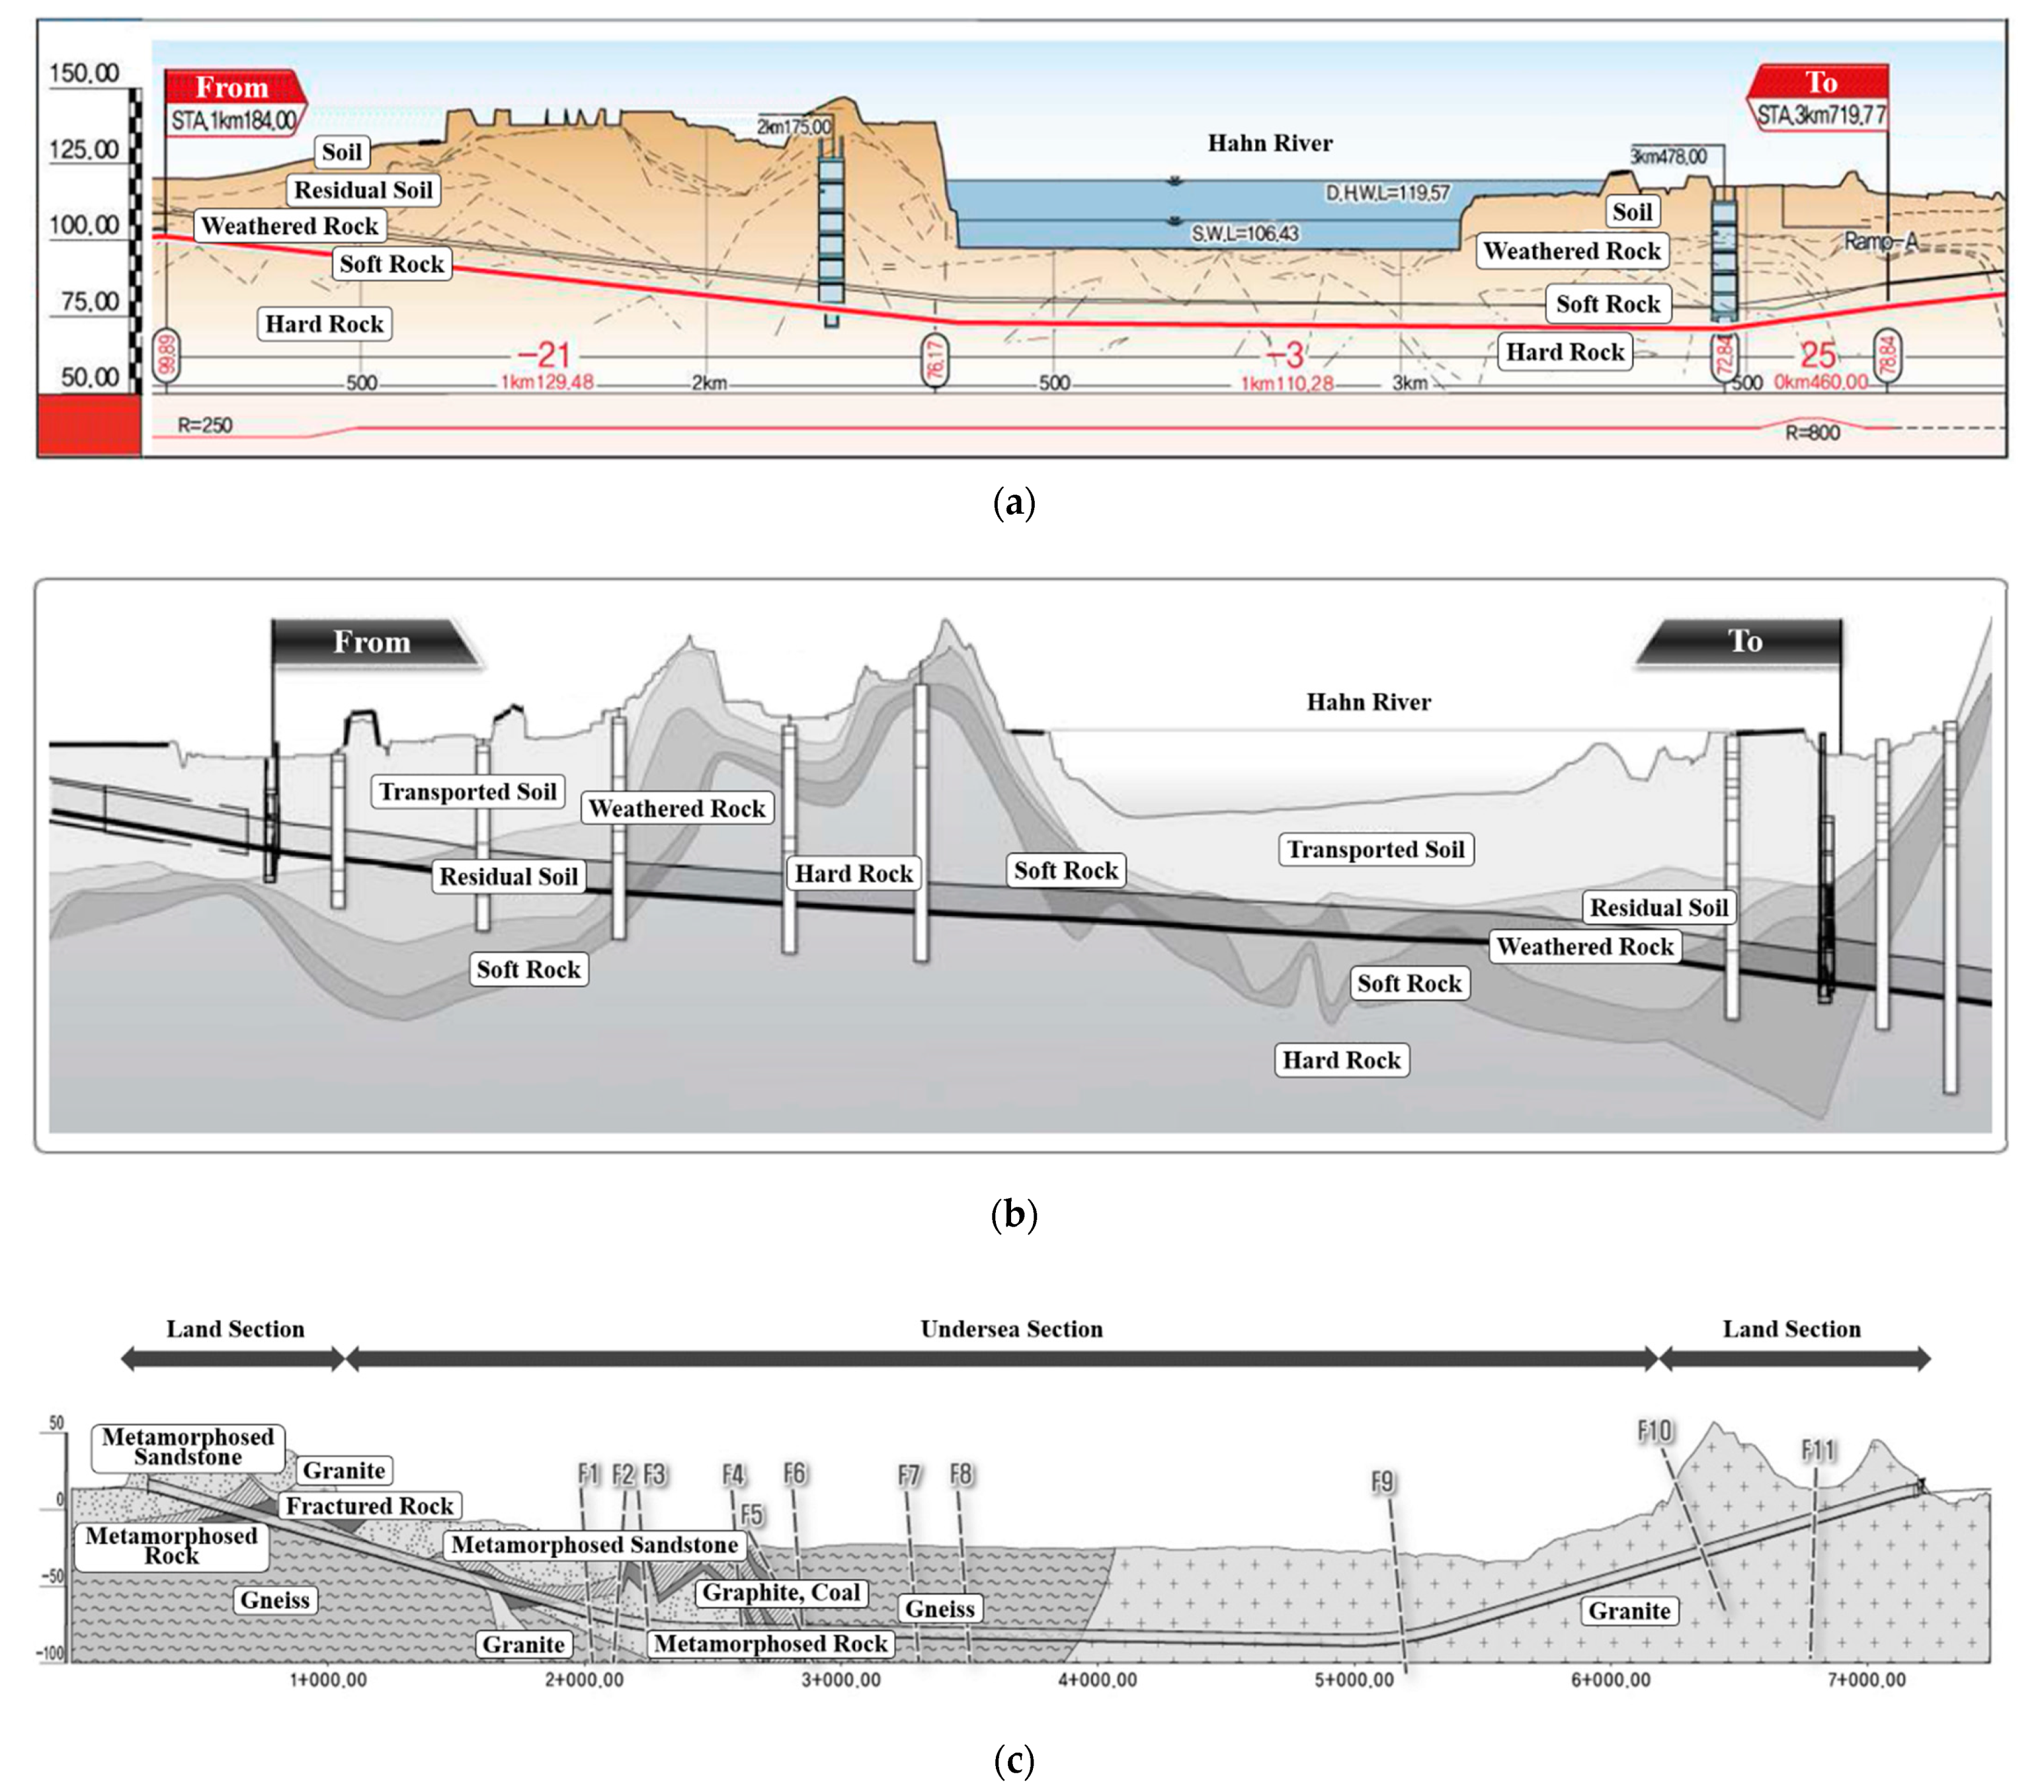
| Project I | Project II | Project III | |
|---|---|---|---|
| TBM type | Slurry shield TBM | EPB shield TBM | EPB shield TBM |
| Tunnel length | 1.28 km | 2.695 km | 6.297 km |
| Tunnel diameter | 7.66 m | 7.8 m | 9.7 m |
| Maximum water depth | About 35 m (Under-river tunnel) | About 45 m (Under-river tunnel) | About 80 m (Subsea tunnel) |
| Score | Probability Class | Probability | Score | Impact Class | Impact |
|---|---|---|---|---|---|
| 5 | Very likely | More than 80% | 5 | Very high | More than 0.16 |
| 4 | Likely | 50–80% | 4 | High | 0.12–0.16 |
| 3 | Occasional | 30–50% | 3 | Moderate | 0.08–0.12 |
| 2 | Unlikely | 10–30% | 2 | Low | 0.04–0.08 |
| 1 | Very unlikely | Below 10% | 1 | Very low | Below 0.04 |
| Risk Event | Project I | Project II | Project III | ||||||||||||||||
|---|---|---|---|---|---|---|---|---|---|---|---|---|---|---|---|---|---|---|---|
| FTA-AHP Matrix | ITA-Matrix | FTA-AHP Matrix | ITA-Matrix | FTA-AHP Matrix | ITA-Matrix | ||||||||||||||
| Probability Score | Impact Score | Risk Score (Level) | Frequency | Consequence | Risk Level 1 | Probability score | Impact Score | Risk Score (Level) | Frequency | Consequence | Risk Level 1 | Probability Score | Impact Score | Risk Score (Level) | Frequency | Consequence | Risk Level 1 | ||
| T1 | Cuttability reduction | 4 | 5 | 20 (IV) | Likely | Serious | III | 4 | 3 | 12 (III) | Occasional | Serious | III | 5 | 3 | 15 (III) | Likely | Serious | III |
| T2 | Collapse of tunnel face | 4 | 5 | 20 (IV) | Occasional | Severe | III | 4 | 5 | 20 (IV) | Occasional | Severe | III | 4 | 5 | 20 (IV) | Occasional | Severe | III |
| T3 | Ground surface settlement | 4 | 1 | 4 (I) | Occasional | Considerable | II | 4 | 1 | 4 (I) | Unlikely | Considerable | II | 5 | 1 | 5 (I) | Occasional | Considerable | II |
| T4 | Ground surface upheaval/Spurt of slurry on the ground [Slurry] | 5 | 1 | 5 (I) | Occasional | Considerable | II | 4 | 1 | 4 (I) | Very unlikely | Insignificant | I | 5 | 1 | 5 (I) | Very unlikely | Insignificant | I |
| T5 | Incapability of mucking [EPB] | 3 | 1 | 3 (I) | Very unlikely | Considerable | I | 2 | 5 | 10 (III) | Occasional | Serious | III | 4 | 5 | 20 (IV) | Occasional | Serious | III |
| T6 | Incapability of mucking [Slurry] | 3 | 4 | 12 (III) | Occasional | Serious | III | 3 | 1 | 3 (I) | Very unlikely | Considerable | I | 4 | 1 | 4 (I) | Very unlikely | Considerable | I |
| T7 | Incapability of excavation | 3 | 5 | 15 (III) | Unlikely | Severe | III | 3 | 5 | 15 (III) | Occasional | Severe | III | 4 | 5 | 20 (IV) | Occasional | Severe | III |
| T8 | Water leakage | 1 | 3 | 3 (I) | Occasional | Considerable | II | 3 | 4 | 12 (III) | Likely | Serious | III | 3 | 3 | 9 (II) | Likely | Severe | IV |
| Geological Risk Factor | Risk Event | STRAM-BN | CN-Matrix | ITA-Matrix | ||||||
|---|---|---|---|---|---|---|---|---|---|---|
| Degree of Risk 1 (Risk Level) | Probability Score | Impact Score | Risk Score (Level) | Frequency | Consequence | Risk Level | ||||
| G1 | Hardness: hard or extremely hard rock, ground containing large amount of quartz | RE1-1 | Cuttability reduction (Excessive abrasion of cutters) | 24.64 (II) | 4 | 3 | 12 (III) | Likely | Serious | III |
| RE6-4 | Incapability of mucking (Damage of pipe and pump) | 25.14 (II) | 3 | 4 | 12 (III) | Occasional | Serious | III | ||
| G2 | Fractured zone or faults | RE2 | Collapse of tunnel face | 33.43 (III) | 1 | 5 | 5 (I) | Unlikely | Severe | III |
| RE7-3 | Incapability of excavation (Misalignment/Off-route) | 4.22 (I) | 2 | 1 | 2 (I) | Unlikely | Serious | II | ||
| G4 | Ground containing clay | RE1-3 | Cuttability reduction (Blockage of cutter) | 19.34 (II) | 4 | 2 | 8 (II) | Occasional | Serious | III |
| RE6-5 | Incapability of mucking (Blockage of slurry pipe) | 10.21 (II) | 2 | 2 | 4 (I) | Unlikely | Serious | II | ||
| G7 | Mixed ground conditions | RE1-2 | Cuttability reduction (Partial abrasion and damage of cutters) | 15.04 (II) | 3 | 3 | 9 (II) | Likely | Serious | III |
| RE2 | Collapse of tunnel face | 33.43 (III) | 1 | 5 | 5 (I) | Unlikely | Severe | III | ||
| G9 | Ground with high water pressure | RE1-2 | Cuttability reduction (Partial abrasion and damage of cutters) | 17.28 (II) | 3 | 3 | 9 (II) | Unlikely | Serious | II |
| RE6-4 | Incapability of mucking (Damage of pipe and pump) | 36.79 (III) | 3 | 4 | 12 (III) | Occasional | Serious | III | ||
| RE7-2 | Incapability of excavation (Insufficient torque and thrust force) | 88.57 (IV) | 2 | 5 | 10 (III) | Unlikely | Severe | III | ||
| RE8 | Water leakage | 6.62 (I) | 2 | 2 | 4 (I) | Unlikely | Serious | II | ||
| Geological Risk Factor | Risk Event | EPB-Open | EPB-Closed | ||||||||||
|---|---|---|---|---|---|---|---|---|---|---|---|---|---|
| STRAM-BN | CN-Matrix | ITA-Matrix | STRAM-BN | CN-Matrix | ITA-Matrix | ||||||||
| Degree of Risk 1 (Risk Level) | Probability Score | Impact Score | Risk Score (Level) | Risk Level | Degree of Risk 1 (Risk Level) | Probability Score | Impact Score | Risk Score (Level) | Risk Level | ||||
| G2 | Fractured zone or faults | RE2 | Collapse of tunnel face | 123.52 (IV) | 4 | 5 | 20 (IV) | IV | 68.62 (III) | 2 | 5 | 10 (III) | III |
| RE7-3 | Incapability of excavation (Misalignment/Off-route) | 3.98 (I) | 2 | 1 | 2 (I) | II | 3.98 (I) | 2 | 1 | 2 (I) | II | ||
| G4 | Ground containing clay | RE1-3 | Cuttability reduction (Blockage of cutter) | 9.40 (I) | 2 | 2 | 4 (I) | II | 14.65 (II) | 3 | 2 | 6 (II) | II |
| RE6-3 | Incapability of mucking (Blockage of screw conveyer) | 6.08 (I) | 2 | 1 | 2 (I) | II | 6.64 (I) | 2 | 1 | 2 (I) | II | ||
| G7 | Mixed ground conditions | RE1-2 | Cuttability reduction (Partial abrasion and damage of cutters) | 18.61 (II) | 3 | 2 | 6 (II) | III | 20.01 (II) | 3 | 2 | 6 (II) | III |
| RE2 | Collapse of tunnel face | 123.52 (IV) | 4 | 5 | 20 (IV) | IV | 68.62 (III) | 2 | 5 | 10 (III) | III | ||
| G9 | Ground with high water pressure | RE1-2 | Cuttability reduction (Partial abrasion and damage of cutters) | 18.61 (II) | 3 | 2 | 6 (II) | III | 22.47 (II) | 4 | 2 | 8 (II) | III |
| RE6-1 | Incapability of mucking (Large quantity of ground water) | 93.84 (IV) | 4 | 5 | 20 (IV) | IV | 64.97 (III) | 3 | 5 | 15 (III) | III | ||
| RE7-2 | Incapability of excavation (Insufficient torque and thrust force) | 83.24 (IV) | 2 | 5 | 10 (III) | III | 83.24 (IV) | 2 | 5 | 10 (III) | III | ||
| RE8 | Water leakage | 31.38 (III) | 3 | 3 | 9 (II) | IV | 10.61 (II) | 2 | 3 | 6 (II) | III | ||
| Geological Risk Factor | Risk Event | EPB-Open | EPB-Closed | ||||||||||
|---|---|---|---|---|---|---|---|---|---|---|---|---|---|
| STRAM-BN | CN-Matrix | ITA-Matrix | STRAM-BN | CN-Matrix | ITA-Matrix | ||||||||
| Degree of Risk 1 (Risk Level) | Probability Score | Impact Score | Risk Score (Level) | Risk Level | Degree of Risk 1 (Risk Level) | Probability Score | Impact Score | Risk Score (Level) | Risk Level | ||||
| G1 | Hardness: hard or extremely hard rock, ground containing large amount of quartz | RE1-1 | Cuttability reduction (Excessive abrasion of cutters) | 26.96 (II) | 4 | 2 | 8 (II) | III | 31.52 (III) | 5 | 2 | 10 (III) | III |
| RE6-2 | Incapability of mucking (Breakdown of screw conveyer) | 24.87 (II) | 2 | 2 | 4 (I) | III | 27.07 (II) | 2 | 2 | 4 (I) | III | ||
| G2 | Fractured zone or faults | RE2 | Collapse of tunnel face | 112.17 (IV) | 4 | 5 | 20 (IV) | IV | 62.31 (III) | 2 | 5 | 10 (III) | III |
| RE7-3 | Incapability of excavation (Misalignment/Off-route) | 3.77 (I) | 2 | 1 | 2 (I) | II | 3.77 (I) | 2 | 1 | 2 (I) | II | ||
| G4 | Ground containing clay | RE1-3 | Cuttability reduction (Blockage of cutter) | 7.00 (I) | 2 | 1 | 2 (I) | II | 10.92 (II) | 3 | 1 | 3 (I) | II |
| RE6-3 | Incapability of mucking (Blockage of screw conveyer) | 4.53 (I) | 2 | 1 | 2 (I) | II | 4.94 (I) | 2 | 1 | 2 (I) | II | ||
| G7 | Mixed ground conditions | RE1-2 | Cuttability reduction (Partial abrasion and damage of cutters) | 18.56 (II) | 3 | 2 | 6 (II) | III | 21.01 (II) | 3 | 2 | 6 (II) | III |
| RE2 | Collapse of tunnel face | 112.17 (IV) | 4 | 5 | 20 (IV) | IV | 62.31 (III) | 2 | 5 | 10 (III) | III | ||
| G8 | Interface of different types of rock mass grades | RE2 | Collapse of tunnel face | 112.17 (IV) | 4 | 5 | 20 (IV) | III | 62.31 (III) | 2 | 5 | 10 (III) | III |
| G9 | Ground with high water pressure | RE1-2 | Cuttability reduction (Partial abrasion and damage of cutters) | 18.56 (II) | 3 | 2 | 6 (II) | III | 23.46 (II) | 4 | 2 | 8 (II) | III |
| RE6-1 | Incapability of mucking (Large quantity of ground water) | 116.26 (IV) | 4 | 5 | 20 (IV) | IV | 80.49 (IV) | 3 | 5 | 15 (III) | IV | ||
| RE7-2 | Incapability of excavation (Insufficient torque and thrust force) | 191.20 (IV) | 2 | 5 | 10 (III) | III | 191.20 (IV) | 2 | 5 | 10 (III) | III | ||
| RE8 | Water leakage | 29.75 (II) | 3 | 3 | 9 (II) | IV | 10.06 (II) | 2 | 3 | 6 (II) | III | ||
Publisher’s Note: MDPI stays neutral with regard to jurisdictional claims in published maps and institutional affiliations. |
© 2021 by the authors. Licensee MDPI, Basel, Switzerland. This article is an open access article distributed under the terms and conditions of the Creative Commons Attribution (CC BY) license (https://creativecommons.org/licenses/by/4.0/).
Share and Cite
Chung, H.; Park, J.; Kim, B.-K.; Kwon, K.; Lee, I.-M.; Choi, H. A Causal Network-Based Risk Matrix Model Applicable to Shield TBM Tunneling Projects. Sustainability 2021, 13, 4846. https://doi.org/10.3390/su13094846
Chung H, Park J, Kim B-K, Kwon K, Lee I-M, Choi H. A Causal Network-Based Risk Matrix Model Applicable to Shield TBM Tunneling Projects. Sustainability. 2021; 13(9):4846. https://doi.org/10.3390/su13094846
Chicago/Turabian StyleChung, Heeyoung, Jeongjun Park, Byung-Kyu Kim, Kibeom Kwon, In-Mo Lee, and Hangseok Choi. 2021. "A Causal Network-Based Risk Matrix Model Applicable to Shield TBM Tunneling Projects" Sustainability 13, no. 9: 4846. https://doi.org/10.3390/su13094846
APA StyleChung, H., Park, J., Kim, B.-K., Kwon, K., Lee, I.-M., & Choi, H. (2021). A Causal Network-Based Risk Matrix Model Applicable to Shield TBM Tunneling Projects. Sustainability, 13(9), 4846. https://doi.org/10.3390/su13094846