Article

Putting It All Together: Combining Learning Analytics Methods and Data Sources to Understand Students’ Approaches to Learning Programming

1
Departamento de Ingeniería de Sistemas Telemáticos, ETSI Telecomunicación, Universidad Politécnica de Madrid, Avda. Complutense 30, 28003 Madrid, Spain
2
School of Computing, University of Eastern Finland, Yliopistokatu 2, FI-80100 Joensuu, Finland
3
EECS-School of Electrical Engineering and Computer Science, KTH Royal Institute of Technology, Lindstedtsvägen 3, SE-100 44 Stockholm, Sweden
*
Author to whom correspondence should be addressed.
Sustainability 2021, 13(9), 4825; https://doi.org/10.3390/su13094825
Submission received: 12 March 2021 / Revised: 10 April 2021 / Accepted: 20 April 2021 / Published: 25 April 2021

Abstract

:
Learning programming is a complex and challenging task for many students. It involves both understanding theoretical concepts and acquiring practical skills. Hence, analyzing learners’ data from online learning environments alone fails to capture the full breadth of students’ actions if part of their learning process takes place elsewhere. Moreover, existing studies on learning analytics applied to programming education have mainly relied on frequency analysis to classify students according to their approach to programming or to predict academic achievement. However, frequency analysis provides limited insights into the individual time-related characteristics of the learning process. The current study examines students’ strategies when learning programming, combining data from the learning management system and from an automated assessment tool used to support students while solving the programming assignments. The study included the data of 292 engineering students (228 men and 64 women, aged 20–26) from the two aforementioned sources. To gain an in-depth understanding of students’ learning process as well as of the types of learners, we used learning analytics methods that account for the temporal order of learning actions. Our results show that students have special preferences for specific learning resources when learning programming, namely, slides that support search, and copy and paste. We also found that videos are relatively less consumed by students, especially while working on programming assignments. Lastly, students resort to course forums to seek help only when they struggle.

1. Introduction

In recent years, there has been a growing interest in examining the ways students approach the challenge of learning programming [1,2]. This topic has drawn the attention of researchers and practitioners due to the high failure rates that programming courses often have [3,4]. Indeed, research has shown that students experience several difficulties when learning programming, including designing a program to solve a certain task, understanding programming structures, memorizing the programming language syntax, and debugging their programs [5,6].
As online learning has become more prevalent, students play an increasingly central role in their learning process. Therefore, students’ ability to learn on a self-directed basis is recognized as an essential skill for their study success [7,8,9], especially in online learning settings [7,9]. Research has consistently shown that effective use and implementation of learning strategies is a consistent predictor of a successful learning process and consequently, of academic success. Learning strategies are defined as “any thoughts, behaviors, beliefs, or emotions that facilitate the acquisition, understanding, or later transfer of new knowledge and skills” [10]. Learning tactics—a closely related term—is commonly used to refer to the cognitive routines, actions a student makes to accomplish a learning objective or perform a task, i.e., the way a student attempts to learn something [11]. Students’ choice of learning tactics can be decisive for their success in the challenging and demanding task of learning programming [12]. In fact, enhancing the process of self-regulation has proven to lead to better programming performances [8]. Hence, understanding which learning tactics students undertake when learning programming is of paramount importance to optimize learning and support academic achievement, as well as to improve programming course design.
In 2020, as the COVID-19 pandemic spread across the world, a majority of countries announced the temporary closure of schools, impacting more than 91% of students worldwide. Without the support that teachers provide to students in face-to-face settings, it becomes an even greater challenge to assist students throughout their learning process [13]. Therefore, ensuring that students are capable of self-regulating their learning is imperative [14]. This pressing need is addressed by the UN Sustainable Development Goals (SDGs) [15], which advocates for Quality Education (SDG4) [16].
The availability of immense volumes of students’ digital traces coupled with a burgeoning field of learning analytics (LA) has enabled valuable insights into the learning tactics and strategies that students apply when learning a topic or skill [17]. What is more, a growing number of publications have provided convincing evidence on the value and validity of using learner data to understand and enhance learning and teaching through the analysis of students’ digital traces [17]. In particular, methods that combine the time and order of learning and tactics (e.g., process and sequence mining) are of particular relevance to programming education since the order and the sequence of events in coding are fundamental to the success of how code is constructed, debugged, or executed.
The analysis of learners’ data from online learning environments on its own may fail to account for the full breadth of students’ learning actions if part of their learning process takes place outside this scope, such as in Integrated Development Environments (IDEs). With this in mind, authors have analyzed the data collected from auxiliary systems that support programming students in their learning process (e.g., automated assessment systems for programming assignments), to examine how different factors affect students’ outcomes and programming mastery, such as code quality, code size, and usage frequency [18,19,20]. In this study, we argue that a holistic approach that is based on the analysis of data originating from several relevant sources to programming education would provide a more accurate view of students’ learning, considering how the temporality of the learning tactics, the interconnectedness of events, and the combination of various learning strategies may influence the outcome of the learning process [21].
The current study makes a novel contribution to the body of literature by examining the tactics and strategies that students apply when learning programming, using data from the learning management system (LMS) as well as from an automated assessment tool employed by the students, with an emphasis on how they approach challenging tasks and the tactics they undertake to overcome such challenges. We further attempt to discover the different groups of students who have distinct learning strategies and investigate how such strategies correlate with performance.
The following research questions have been formulated:
RQ1: How can learning analytics help understand students’ tactics when learning programming (i.e., when and how they struggle, seek help, and succeed)?
RQ2: How can learning analytics help identify different strategies of programming learners and how they relate to performance?
This article is structured as follows. In the next section, we examine the existing literature on LA, delving on its applications in programming education. Then, we present the methods used in this study, followed by the results obtained. Subsequently, we present a discussion of the results, with an emphasis on how the results obtained can help improve the course design. Lastly, concluding remarks and an outlook of future work are offered.

2. Background

2.1. Temporality in Learning Analytics

Learning is a dynamic process that follows an unidirectional forward path: it is time-ordered, sequential, and unfolds over time [22,23]. Furthermore, temporality is embedded in the way programming learning is designed, how learning materials are organized, and how students are assessed. Research has consistently exhibited that students who use efficient time management strategies outperform those who do not [24]. The emergence of the field of LA and the abundance of time-stamped learning events has motivated researchers to explore methods that enable sense-making of time, order, and relational information. As such, an expanding repertoire of methods has proven valuable, such as process mining and sequence mining [17].
Process mining is a relatively young analytical method that allows extracting meaningful insights from time-ordered event logs [17]. The aim of process mining is to discover the real process (as observed, i.e., not the hypothesized or assumed), evaluate the efficiency, and help or enhance the (learning) process [25]. Recently, a wide range of applications of process mining in education have emerged to, e.g., study the process of students’ assessment, and how it conforms to the standard model, study the learning process in Massive Open Online Courses (MOOCs) and the alignment of such processes using conformance checking, or examine student efficiency in using time management strategies and how this influences their grades [26,27].
Sequence mining is another approach that is increasingly gaining ground among educational researchers. As the name suggests, the primary goal of sequence mining is to extract meaningful insights from sequential data, i.e., to efficiently summarize the sequential patterns of learning data and categories/cluster those patterns into a limited number of groups [28]. Such categories help identify subgroups of, for instance, learning approaches. The procedure is particularly powerful when the learning process is seen to be sequential [27]. Scholars have successfully used sequence mining to detect and classify students’ learning tactics and strategies. To study the multifaceted nature of temporality of students’ ways of learning, the two approaches (process and sequence mining) are commonly combined [27,29].

2.2. Learning Analytics in Programming Education

Existing LA studies in programming education have mainly relied on frequency analysis to classify students according to their activity or to predict academic achievement. Azcona et al. [19] presented a predictive analytics system that aggregates students’ digital footprints from a blended programming classroom to find which factors potentially predict learning outcomes. They found a positive correlation between the time spent by students on programming assignments and exam scores. In another study, Pereira et al. [30] employed LA methods to identify early effective behaviors of novice students. They reported that among the best predictors of programming efficiency were the frequency of mistakes and the proportion between pasted characters and written characters in the programming environment. In the same vein, Filvà and colleagues [31] collected and analyzed students’ clickstream data in Scratch (a block-based visual programming language and website targeted primarily at children) and performed both exploratory and predictive analytics to classify students according to the frequency with which they clicked on the different parts of the programming environment. Although informative, frequency analysis provides limited insights into the individual time-related characteristics of the constructs researched, as pointed out by Molenaar [32]. Frequency analysis regards the learning process as a set of disconnected units, ignoring the fact that learning actions are time-ordered and essentially interrelated [21,32].
Going beyond frequency counts as representative of learning allowed Fields et al. [33] to trace and document the iterative ways that users approached particular concepts as well as the changes in programming styles in the Scratch environment. Blikstein [18] used the data captured from a programming environment to analyze the changes in the number of code compilations over time, identify moments of greater difficulty in the programming process, and trace an approximation of each prototypical coding profile and style. In the work by Chen et al. [20], cluster analysis confirmed that learning motivation (denoted by early and on-time submissions) was strongly associated with final grades, and not the number of submissions made by students. Furthermore, Watson et al. [34] developed a unique approach for predicting performance based upon how a student responds to different types of errors compared to their peers. In the same line, Jiang et al. [35] used sequence analysis to calculate the trajectories followed by students when solving block-based programming assignments to identify common patterns in their behavior. Lastly, Matcha et al. [12] used sequence and process mining to detect students’ tactics and strategies from LMS data from a programming MOOC. Accounting for the individual time-related characteristics has allowed to illustrate how events occur within the flow of continuous events in a particular time window. However, the aforementioned studies analyzed data exclusively from programming environments [18,20,33,34,35] or from LMSs alone [12]. Learning programming involves both understanding theoretical concepts and acquiring practical skills. Hence, analyzing learners’ data from a single learning environment fails to capture the full breadth of students’ learning actions if part of their learning process takes place elsewhere.
This study takes the previous literature as a departure point by combining, synchronizing and analyzing data from two complementary systems (an LMS and an automated assessment tool) to gain a holistic understanding of how students approach the task of learning programming where it occurs, and the tactics they implement when they successfully undertake a programming challenge, while accounting for the temporal dimension of the learning process. We further examine the different types of students using unsupervised learning to investigate if differences exist in terms of the learning strategies used or academic performance.

3. Methods

3.1. Context

The programming course analyzed in this study is part of the Bachelor’s Degree in Telecommunications Engineering at Universidad Politécnica de Madrid (UPM). It is a third-year blended course that accounts for 4.5 ECTS (European Credit Transfer System), equivalent to 115–135 h of student work. This course teaches the basics of web development, including HTML (HyperText Markup Language), CSS (Cascading Style Sheets), JavaScript, and more advanced technologies, such as node.js, express, and SQL (Structured Query Language). The course is structured into nine units, each of which contains several modules.
The course materials are delivered to students through the Moodle LMS. These materials include 27 slideshows (with both theoretical content and code snippets), 22 video lessons, 17 solved exam exercises from past years, and the instructions of the 9 programming assignments. In these assignments, a code template is provided to students with some basic features that are already implemented in the code, as per the AMMIL (Active Meaningful Micro-Inductive Learning) methodology [36]. They need to follow the instructions in order to complete a set of missing features. The students work on these assignments offline and use a student-centered automated assessment tool—developed by the course faculty staff—which runs a test suite on their code and provides them with a score according to the code’s compliance with the assignment requirements. The tool also provides feedback messages (pre-set by the instructors) designed to help students find errors or missing features in the code. The students are allowed to run these tests as many times as they may wish. Once they are satisfied with the score, they can submit their work in the LMS by using a command provided by the automated assessment system itself. A complete description of this tool is available in [37].
Students are required to submit all of the assignments, which account for 30% of the final grade. The remaining 70% corresponds to one final exam conducted at the end of the course. In order to pass the course, students needed to achieve a grade greater than or equal to 4 out of 10 in the exam and obtain a grade of at least 5 out of 10 in the course final grade.

3.2. Data Sources

The complete cohort of 292 students enrolled in the course participated in the study: 228 men (78%) and 64 women (22%). The age of the participants ranged from 20 to 26 years old (mean = 20.9, standard deviation = 1.1).
The log data of all the enrolled students were gathered from two different sources: (1) the Moodle LMS and (2) the automated assessment tool utilized in the course. The students gave their informed consent to share their data for research purposes, and confidentiality and anonymity at all times were assured.

3.2.1. LMS Data

The logs originated from the students’ learning actions—involving the course activities and materials available in the Moodle LMS during the entire duration of the course—were extracted from this platform. The logs included the timestamp, user ID, course module ID, and the learning action performed. Table 1 shows all the learning actions recorded and their descriptions. After data preparation (see Section 3.3), the total number of logs collected from the LMS amounted to 42,046. The final exam grades of the course recorded in the grade book were also extracted from the LMS.

3.2.2. Automated Assessment Tool Data

The logs of students’ learning actions performed while working on the assignments were extracted from the automated assessment tool. These logs included the timestamp, user ID, assignment ID, and the learning action performed, as well as the score obtained each time they used the tool to test their code. Although all the interactions with the automated assessment tool took place offline, since students used it locally in their own computers to test their code while solving an assignment, once they submitted their solution, they automatically submitted the complete logging history of their interactions with the tool for that particular assignment. Thus, the data gathered by the automated assessment tool includes the full breadth of students’ work on the assignments since the moment they started coding until submission, including all the trials they performed in-between to check the completeness and correctness of their solution. Table 2 shows the learning actions recorded by the automated assessment and their descriptions. After data preparation (see Section 3.3), the total number of logs collected from this tool amounted to 39,940.

3.3. Data Preparation

The data from both sources were anonymized and cleaned: traces of the learning actions that took place before the start or after the end of the course were discarded. Traces from teachers, administrators, and test users were removed as well. The data from the two sources were then ordered chronologically and grouped into sessions. A session was defined as an uninterrupted sequence of learning actions where the time gap between any two consecutive actions is below 15 min for the LMS logs, and 30 min for the automated assessment tool logs (roughly the 95th percentile of the time gap between two successive learning actions), as per the approach proposed in [38].

3.4. Data Analysis

Our first step was to perform a frequency analysis of both the logs that took place in the LMS and in the automated assessment tool, to explore the distribution of the learning actions throughout the course. Then, we used methods that account for the sequence and process in which these learning actions occurred, with emphasis on how and when students learn, struggle, and get support. These methods are detailed in the following subsections.

3.4.1. Identification of Learning Tactics

In order to answer RQ1, we used clustering to identify learning tactics, i.e., distinct groups of learning sessions according to their shared patterns of similar learning actions. The clustering was performed for each data source separately. First, a sequence object was constructed from the chronologically ordered learning actions grouped into sessions as a preparation for sequence mining. Sequence mining allowed us to gain a deeper insight into the overall sequence of learning actions that students carried out within a learning session [38,39,40]. The clustering of the learning sessions was performed following the method described in detail by [39,41,42], using the Agglomerative Hierarchical Clustering (AHC) based on Ward’s algorithm, a technique that has proven suitable for detecting students’ learning tactics [38,39,40]. The optimal matching method based on minimal cost (in terms of insertions, deletions and substitutions, for transforming one sequence into another) was used as distance metric for the clustering algorithm. The optimal number of clusters for each dataset was based on the dendrograms.
This step resulted in two sets of clusters of learning tactics: a set of clusters of learning tactics on the LMS, and another set of clusters of learning tactics on the automated assessment tool. Both sets of clusters of learning tactics were plotted and described in detail.
The two sets of clusters were then combined and analyzed using process mining, which allowed us to understand what students do on the LMS system while they are working on an assignment offline (e.g., when they complete an assignment successfully or struggle to do so), and when they are not working on the assignment (e.g., studying or planning). The process maps of the combined clusters were created following the methods of [27,43], using the BupaR package [44]. BupaR offers sequential process maps that highlight the flow and frequencies of examined learning tactics. A relative frequency process map was constructed where the node metrics of the process map represent the relative frequency of the tactic (i.e., the percentage of the total activity each tactic accounts for); the edges represent the associative internode relative frequencies (i.e., the percentage of sessions of a given tactic that shift to another one), and median time between the tactics (i.e., how many minutes it takes in median to shift from a tactic to another).

3.4.2. Identification of Types of Learners According to Their Learning Strategies

To answer RQ2, we used K-means clustering [45] to classify students according to their learning strategies. We used the frequency with which each student carried out each learning tactic as an input to perform the clustering. The frequencies were standardized (SD = 1, mean = 0) and centered (divided by SD) beforehand, as a preparation step for K-means clustering to make variables comparable and also to minimize the influence of individual measures on the results of the clustering of students’ strategies. The elbow method suggested three clusters as the optimum number, which was selected for our study.
The Shapiro–Wilk test was used to check the distribution of variables, which indicated that the variables did not follow a normal distribution. Hence, the Kruskal–Wallis non-parametric one-way analysis of variance was used to compare the final exam grade among clusters [46]. Post hoc pairwise comparisons were performed through Dunn’s test to verify the magnitude and significance of the difference in grades among clusters, using Holm’s correction for multiple testing [47].

4. Results

In the LMS, viewing the slideshows was the most frequent learning carried out by students, followed by viewing the assignment instructions, reading the forum posts, and watching the video lessons (Table 3). Although resorting to reading forum posts for help-seeking was a recurring activity among students, the number of posts written was somewhat low.
Students used the automated assessment tool to test their code from the early stages of the development of the assignments; therefore, the most common score was an F. The number of Bs and Cs is lower than the number of Fs and As. A possible explanation might be that some students did not use the automated assessment tool repeatedly during the development but rather resorted to using the tool only before submitting to ensure that they are obtaining the highest score.

4.1. Identification of Learning Tactics

4.1.1. Identification of Learning Tactics in the LMS

The overall sequence distribution plot (Figure 1) accounts for the sequential nature of the logged data (n = 16,574 sequences), adding to what can be inferred from the frequency analysis. The plot reveals that most students started by reading the programming assignment instructions. Then, driven by the requirements of the programming assignments, they often resorted to viewing slideshows or watching videos. Slideshow viewing was increasingly common towards the end of the learning sessions, usually being the last resource consulted by the students. Reviewing exams from past years was commonly performed at the end of the session as well. This might indicate that the students used these to practice after a study session or when they were stuck working on the assignments as a last resort after searching for answers on the forum, slides, and videos.
To identify distinct groups of learning sessions according to their shared patterns of similar learning actions, i.e., learning tactics, we used AHC. The clustering resulted in four distinct learning tactics (Figure 2):
  • Slide-oriented instruction (n = 9258, 56.2%): This cluster is dominated by actions mostly related to studying and viewing the course materials. In particular, viewing slideshows was the prevailing learning activity. This tactic was the most frequent among the students.
  • Video-oriented instruction (n = 2054, 12.5%): The most predominant action in this cluster was video-watching. These were sessions in which students consumed the videos to acquire the necessary knowledge and skills to be able to tackle the assignments.
  • Assignment-viewing (n = 2784, 16.9%): This cluster contains single activity sessions in which the only traced learning activity carried out by the students was viewing the assignment instructions.
  • Help-seeking (n = 2379, 14.4%): This cluster is dominated by forum consumption. Students’ first action in this learning tactic was reading the forum messages, followed by reviewing the assignment instructions and sometimes consulting the slides or videos or even write a forum post.

4.1.2. Identification of Learning Tactics in the Automated Assessment Tool

The overall sequence distribution plot (Figure 3) of the automated assessment tool logged data (n = 6753) illustrates how students often started their learning sessions by downloading the code template for the assignment (Start assignment) or by running the tests and scoring an F, which means they had downloaded the code in a previous session (as suggested by the presence of Start assignment actions at the end of the plot). Nonetheless, there were learning sessions that began by students obtaining a score higher than an F (C, B, or A). This might be an indicator that students split the assignment work into several sessions and perhaps came back to work after a break, or after help-seeking or self-instruction in the LMS or offline. As anticipated, scoring an A was more common towards the end of the sessions, which implies that most students got an A after using the tool to run the tests several times.
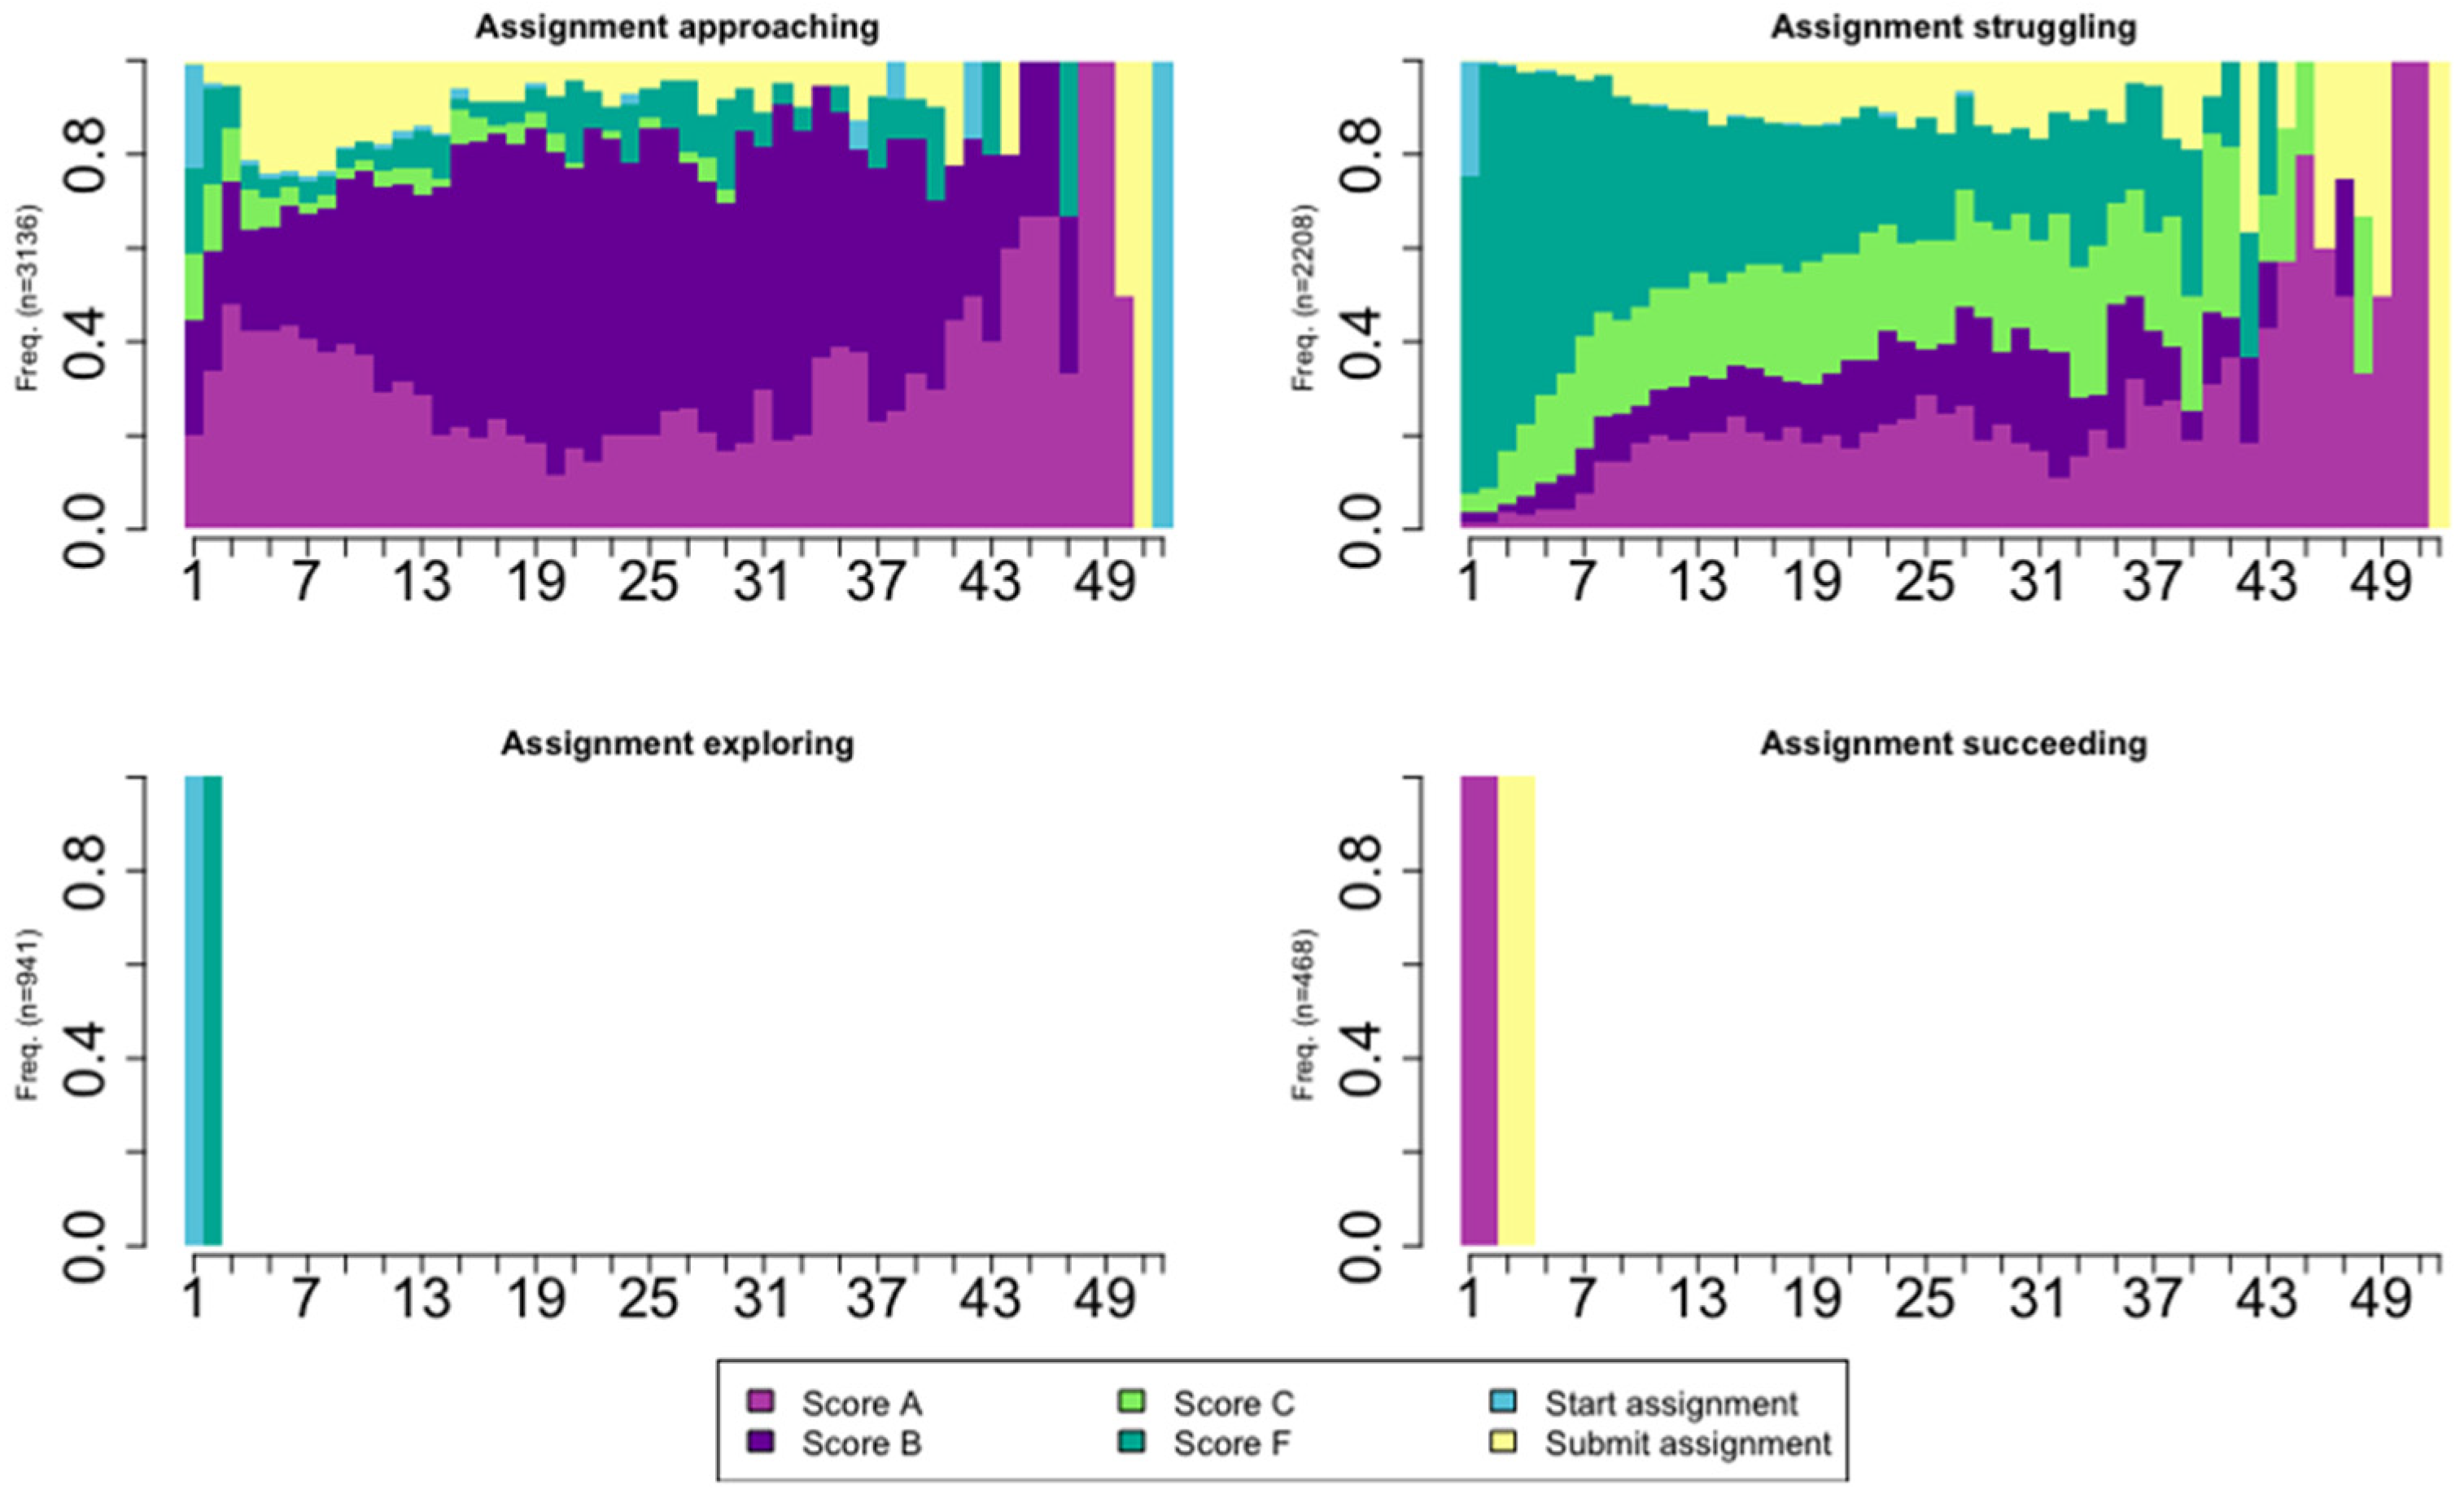
The use of AHC to group the sessions according to the action sequence resulted in four distinct learning tactics (Figure 4):
  • Assignment approaching (n = 3136, 46.4%): This cluster shows learning sessions in which students progressively improved their score until they got an A. It can be seen that most students managed to quickly score at least a B, and often achieved an A score towards the end of the session, which led them to submit the assignment.
  • Assignment struggling (n = 2280, 32.7%): This cluster is initially dominated by students obtaining an F score and shows a much less straightforward improvement towards succeeding at the assignment than the previous cluster, indicating that students found difficulties when completing the assignment.
  • Assignment exploring (n = 941, 13.9%): This cluster includes sessions in which students only downloaded the code template for an assignment and ran the tests once to get an idea of what the assignment looked like, as mentioned earlier, so they could watch out for similar content when viewing the slides or watching the videos. Compared to the previous tactics, this one was not very common among students.
  • Assignment succeeding (n = 468, 6.9%): This cluster shows that students immediately score an A and submit the assignment.

4.2. Putting It All Together

The two sets of clusters were then combined and analyzed using process mining. We first examined students’ choice of tactics when they were not working on the assignments (e.g., studying or planning). We then explored the tactics students used while working on the assignments. Two types of sessions were closely examined: sessions in which students completed an assignment successfully and sessions in which students showed signs of struggling.

4.2.1. Learning Tactics Applied When Studying (Not Working on the Assignments)

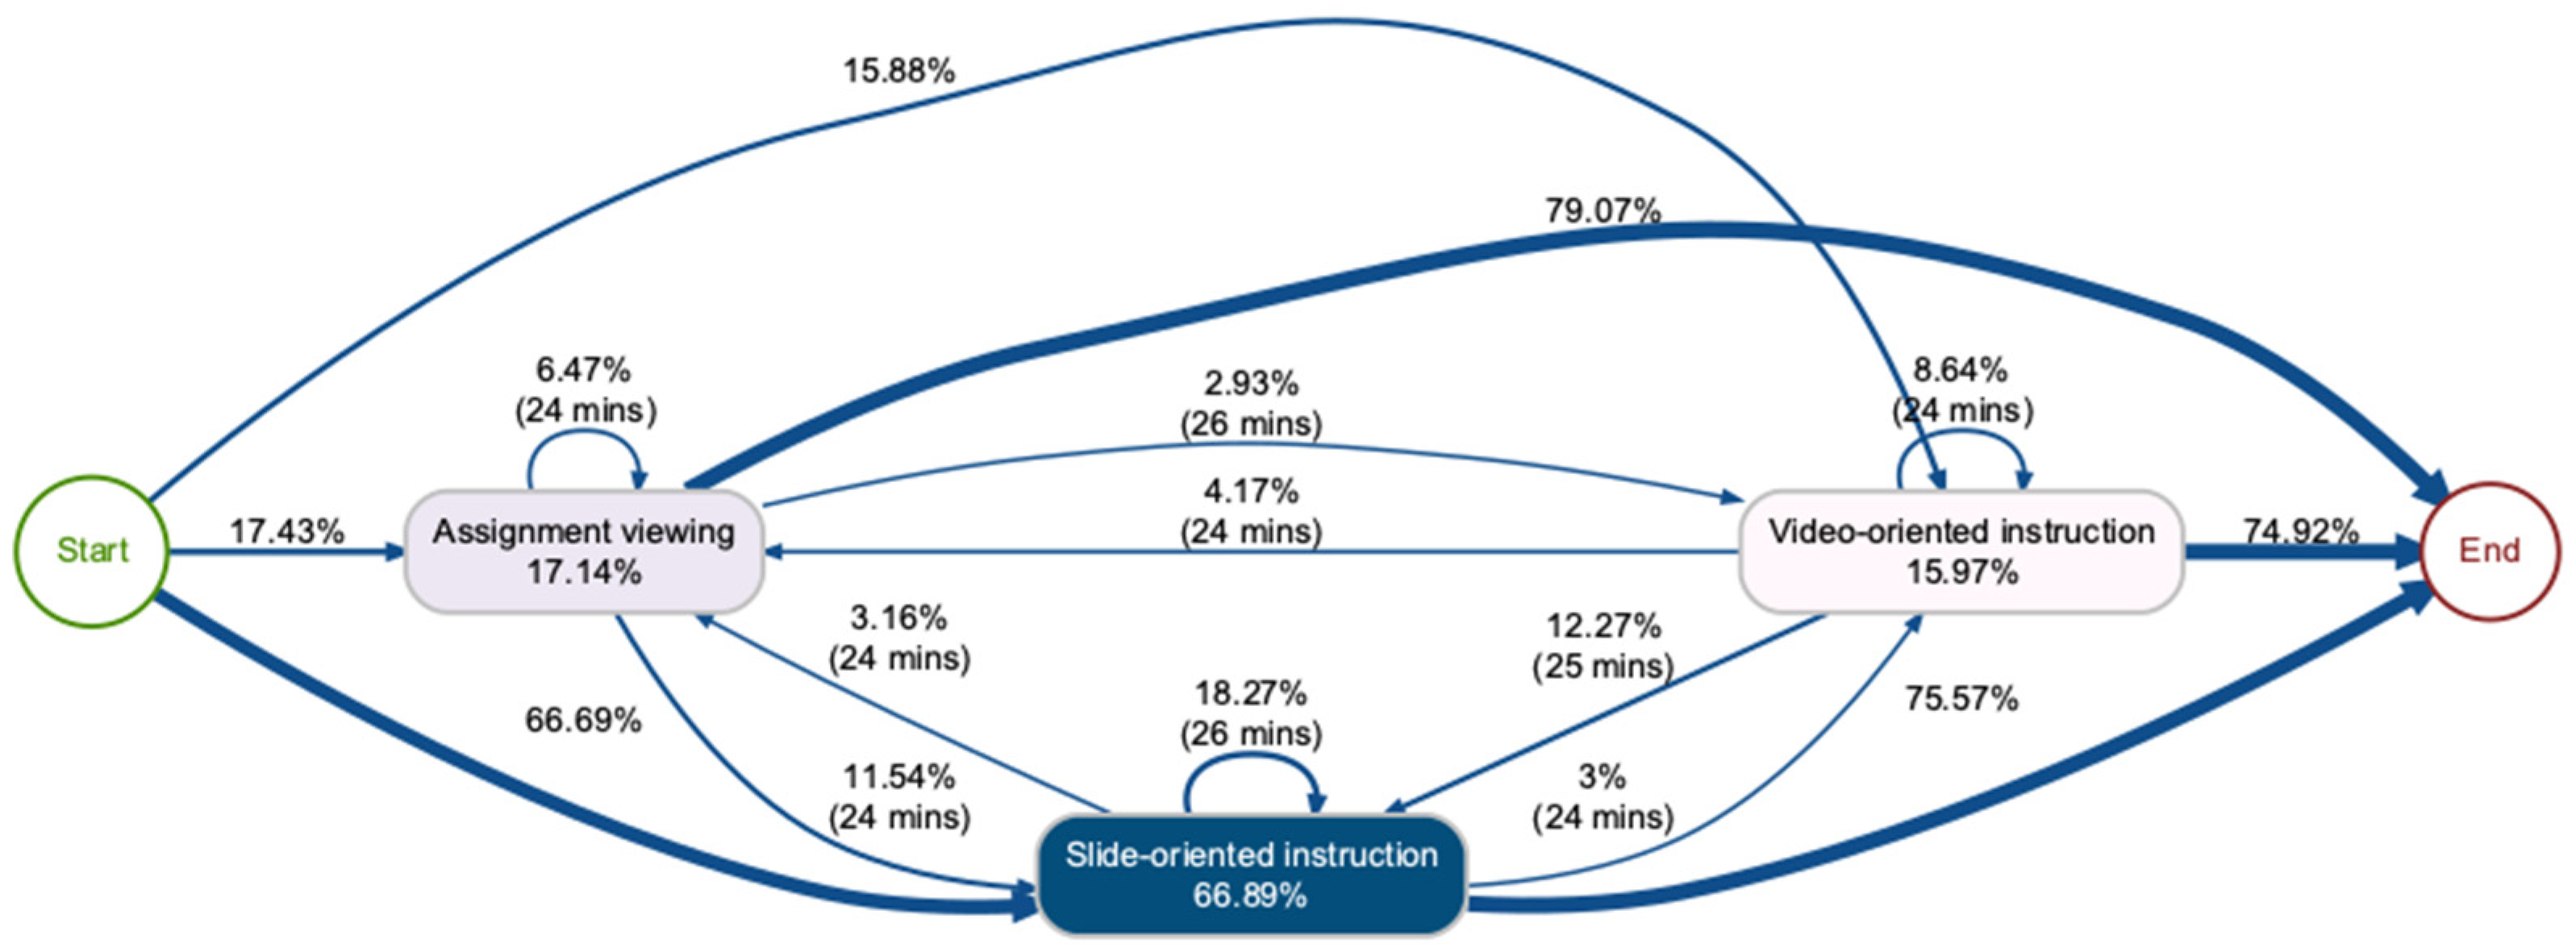
Figure 5 presents the process map of the sessions in which students were not working on the assignments. As can be seen, Slide-oriented instruction was the most common tactic carried out by the students (roughly two thirds of the total activity). Video-oriented instruction was a recurrent tactic (around 16% of the activity), meaning that the students used videos mainly for self-instruction. The presence of the Assignment viewing tactic (representing about 17% of the total activity) suggests that, when students were not working on the assignments, students also carried out planning-related actions, such as consulting the assignment instructions to learn about the assignment requirements so they could prepare themselves and organize their time.

4.2.2. Learning Tactics Applied When Struggling

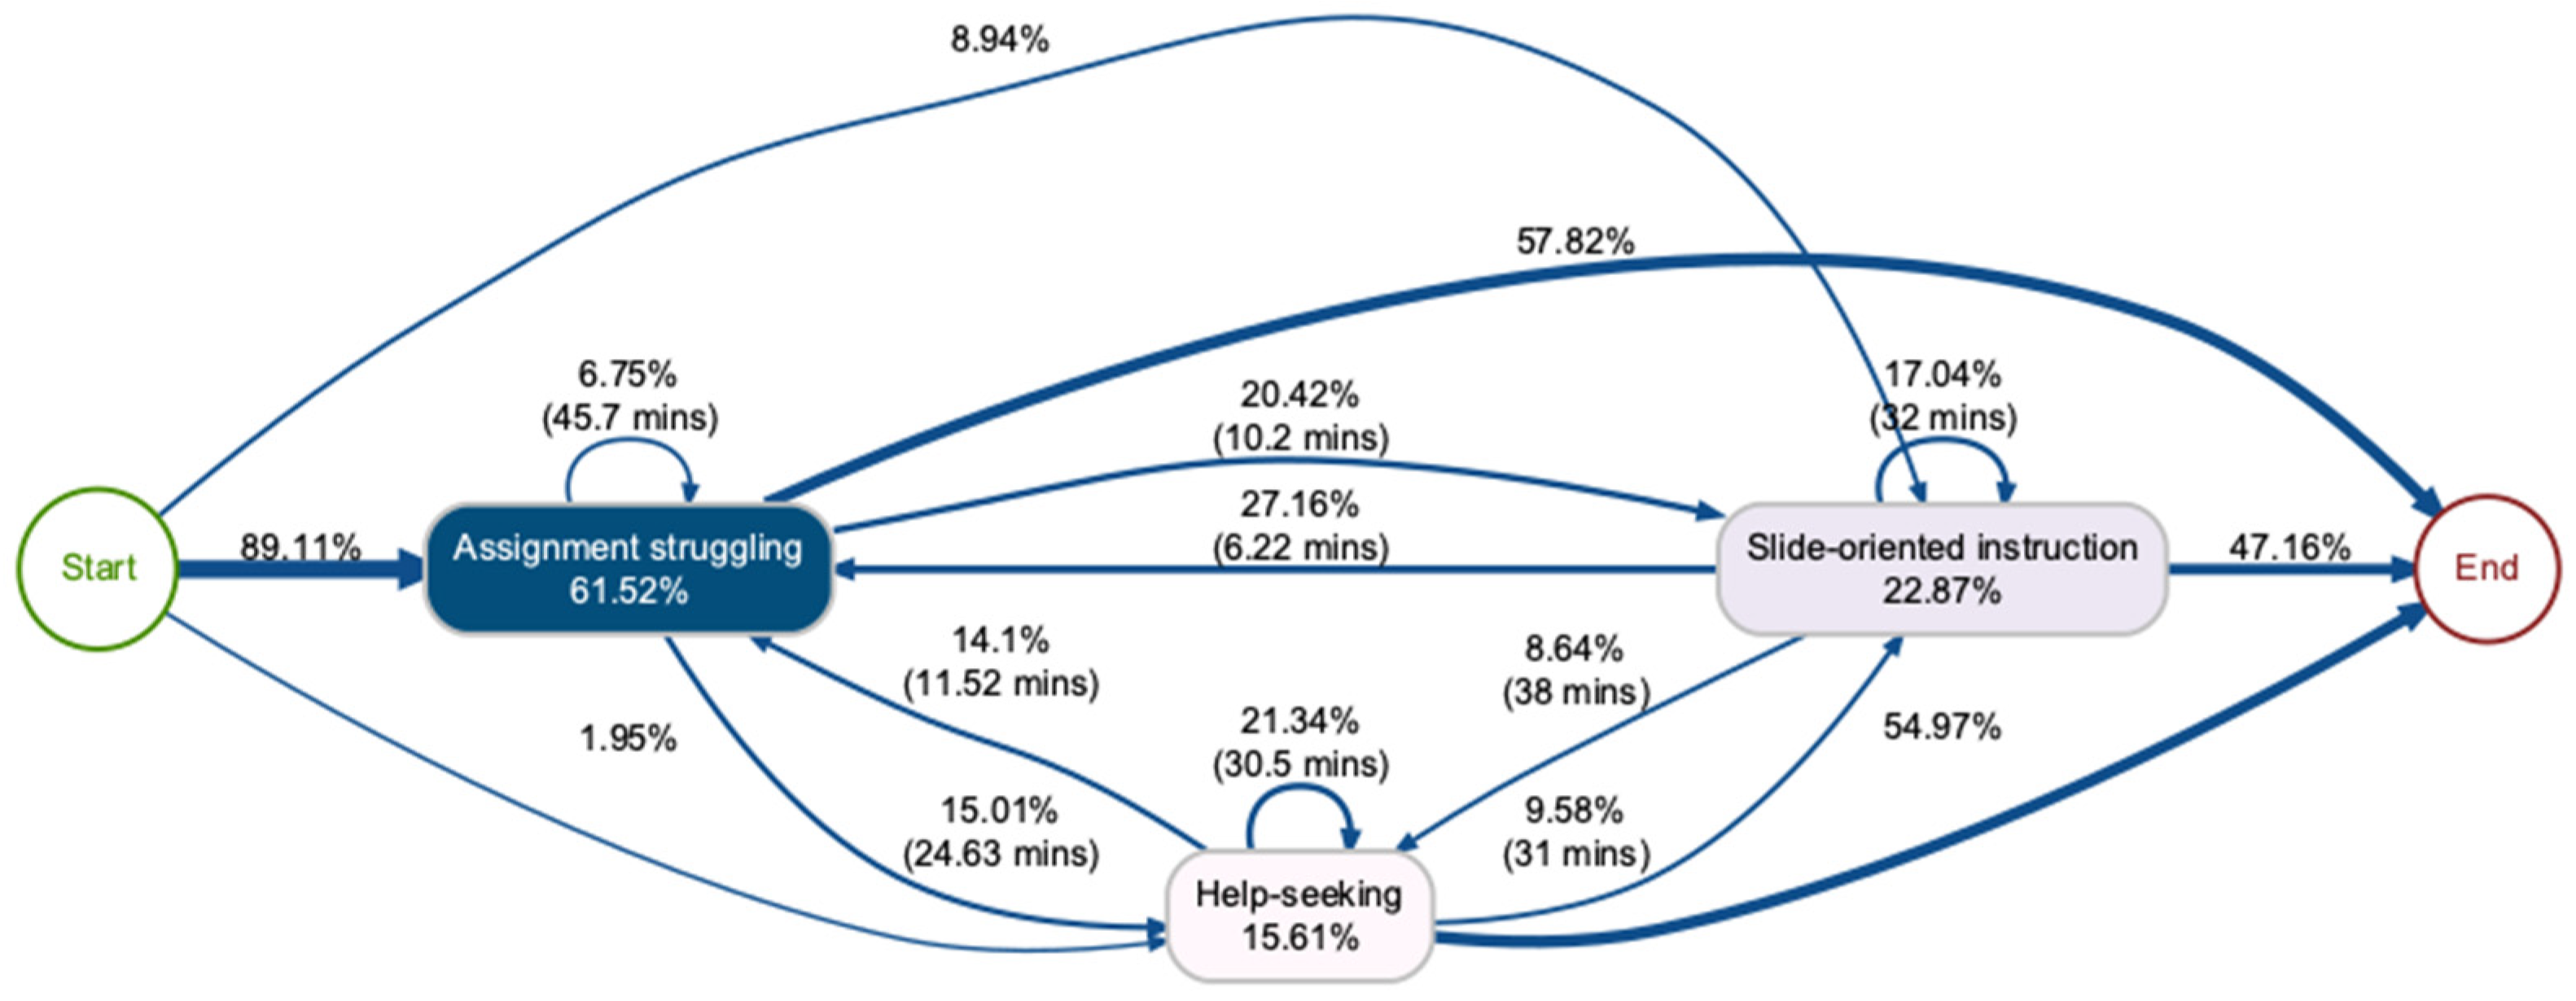
Figure 6 shows the process map of the sessions in which students had difficulties completing the assignments, i.e., sessions that included at least one Assignment struggling tactic. In 89.1% of these sessions, the students started directly by working on an assignment without accessing the LMS beforehand. More than half of the students did not make use of any additional tactic after struggling. In around 20% of the sessions, the students resort to Slide-oriented instruction, after a median of 10 min of struggling, in search for answers in the learning materials. In 15% of the sessions, they resorted to Help-seeking in the forum, after a median of 24.6 min of struggling. Moreover, a majority of the students who resorted to help-seeking concluded the learning session after doing so, i.e., did not work on the assignment or access the learning resources. Lastly, it is worth noting that Video-oriented instruction was not among the frequent learning tactics applied by students showing signs of struggle.

4.2.3. Learning Tactics Applied When Not Showing Signs of Struggle

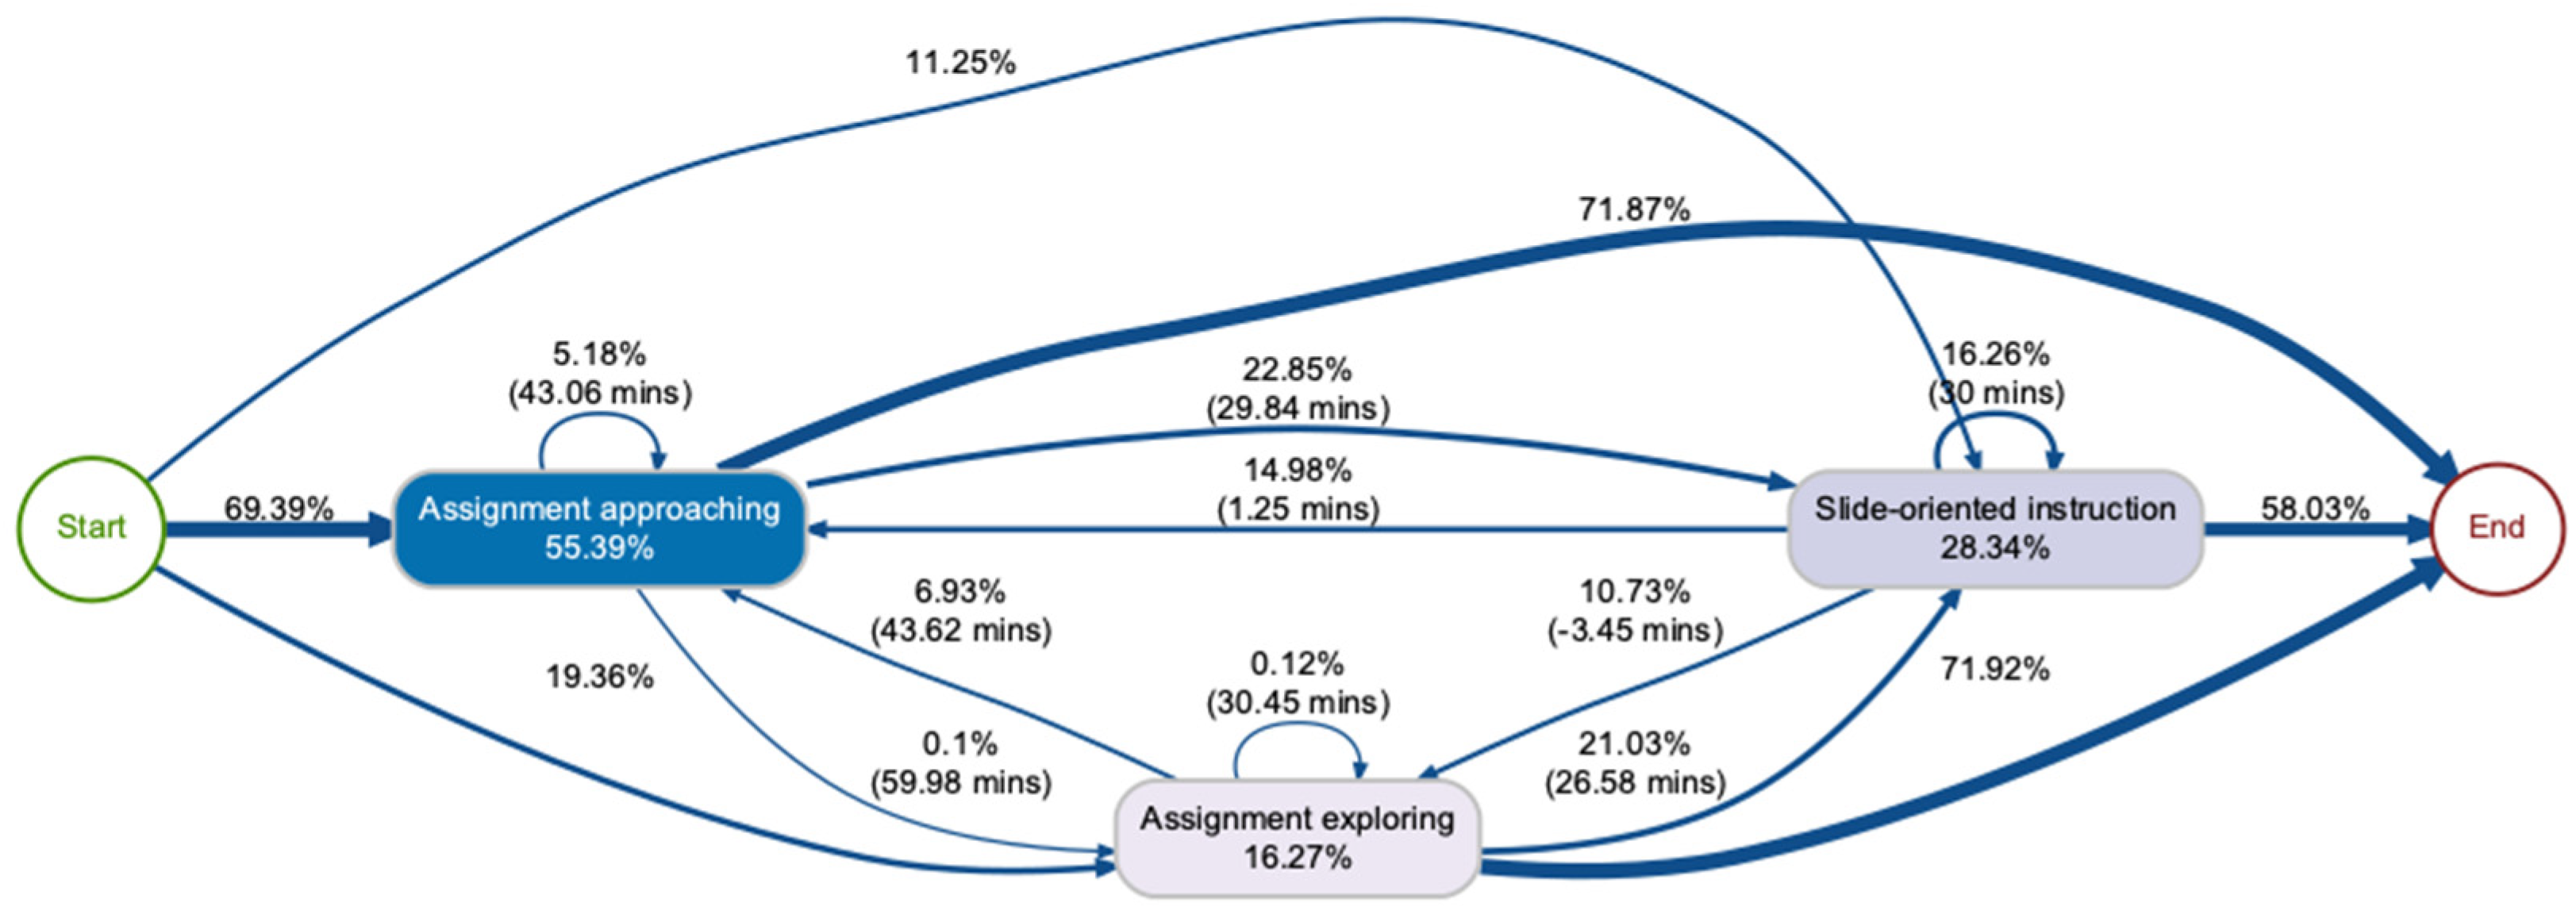
Figure 7 shows the process map of the sessions in which students succeeded in completing the assignments. These sessions usually started directly by using the automated assessment tool, often to work on the assignment actively (Assignment approaching, 69.4%), although sometimes just for exploration (Assignment exploring, 19.36%). Slide-oriented instruction was the only LMS-related learning tactic used in these sessions. Although only 11.3% of the sessions began this way, students resorted the slides at a later point in the learning session than in struggling sessions (almost half an hour after starting their assignment work, in median). One of the most interesting findings is that Help-seeking behavior was not present in this type of session, implying that the students resort to forums only when they are struggling with the assignments and rather use the slideshows instead as supporting material. Furthermore, Video-oriented instruction was again not among the frequent learning tactics applied by students, implying that students use videos mainly for self-instruction and not so much as supporting materials when they are completing the assignments.

4.3. Identification of Types of Learners According to Their Learning Strategies

In order to answer RQ2, we clustered students according to their learning strategies (i.e., the frequency with which they carried out each of the eight learning tactics identified in Section 4.2), which resulted in three distinct and cohesive groups of learners (silhouette value = 0.56). Figure 8 shows the mean normalized frequency of each of the learning tactics for each group. The three identified groups are as follows:
  • Determined (n = 27, 9.2%): Determined students are the ones who had a higher frequency of learning sessions both using the LMS and the automated assessment tool. They struggled with the assignments more often than the other two groups. However, the results also show that they are the group with the most sessions of the type Assignment approaching, meaning that they also had very productive working sessions in which they successfully solved the assignments. This group also shows an increased help-seeking behavior and made intensive use of the slideshows and videos, especially the latter.
  • Strategists (n = 148, 50.7%): The students in the strategists group had an intermediate number of learning sessions both using the LMS and the automated assessment tool. They only surpassed determined learners in two learning tactics Assignment exploring and Assignment succeeding, which were the shortest session types, indicating that they did not need as many working sessions to complete their assignments. Moreover, these learners seem to have used the slideshows as their go-to self-instruction tactic.
  • Low-effort (n = 117, 40.1%): Lastly, low-effort students had the fewest number of interactions with both the LMS and the automated assessment tool. The most common session type for these students was Assignment succeeding, which may suggest avoidance towards the use of the automated assessment tool. They manifested a low frequency of self-instruction, showing a slight preference for video-oriented tactics over slide-oriented ones.
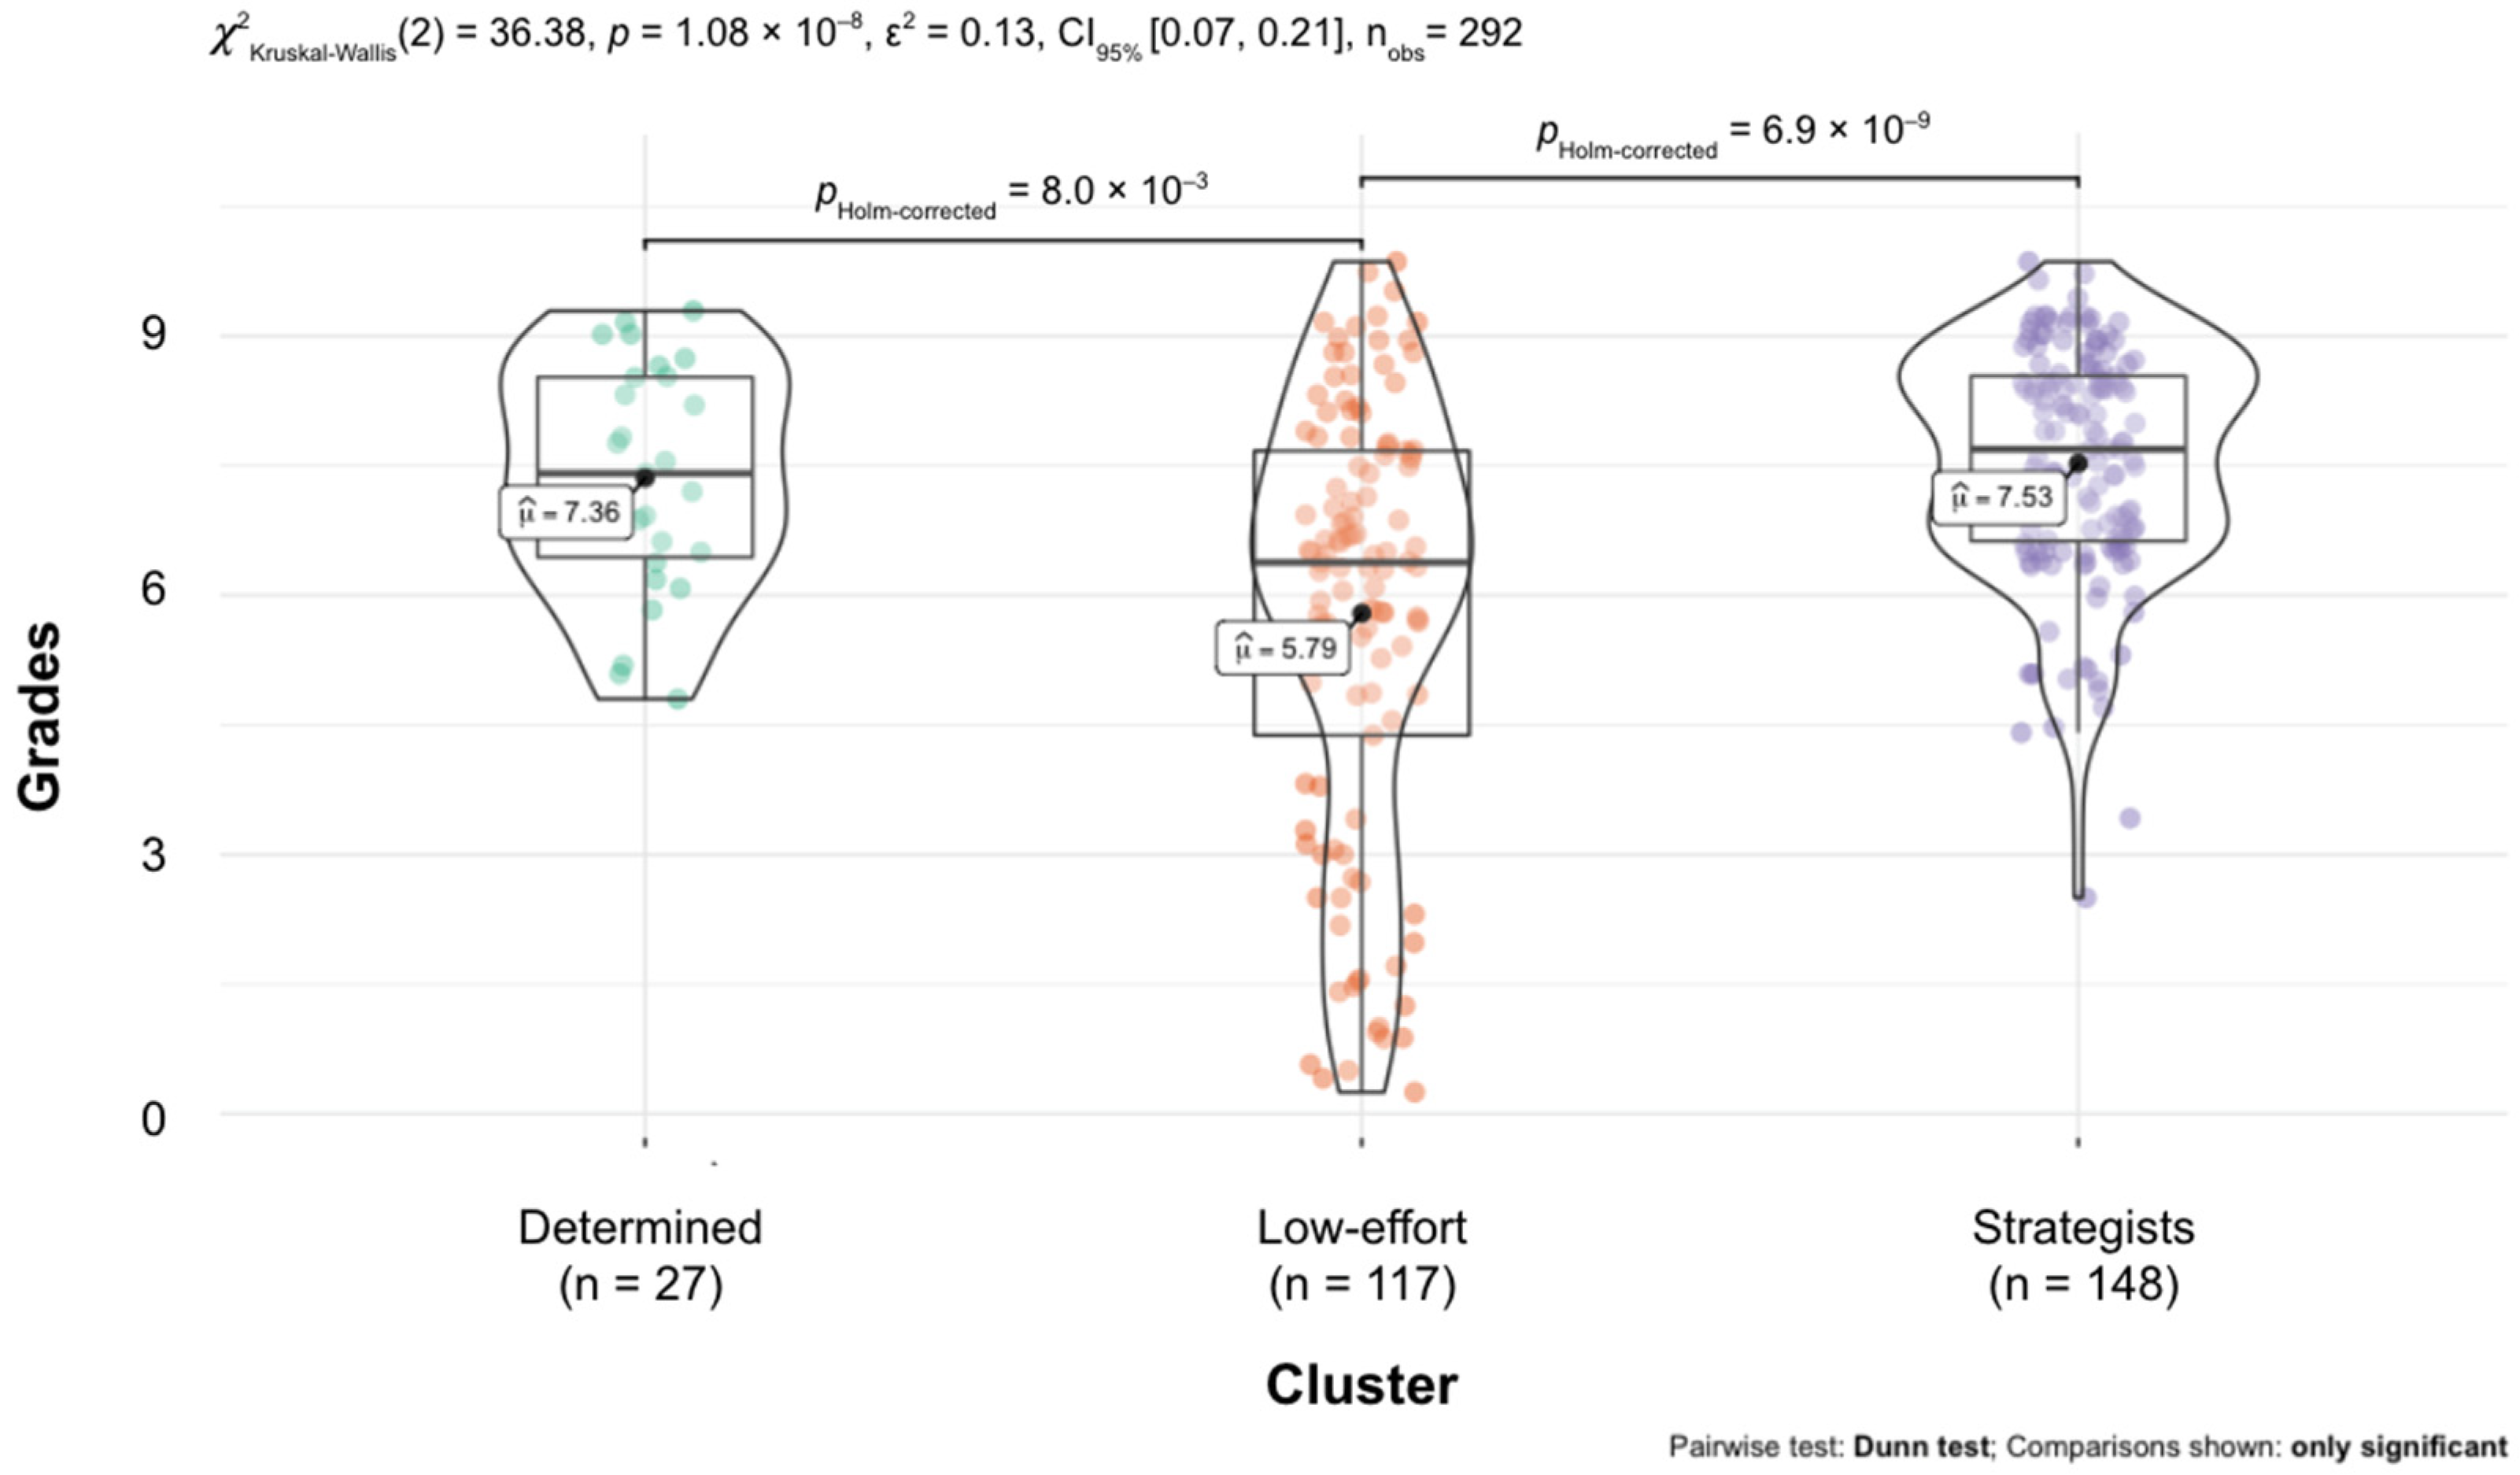
The results of the Kruskal–Wallis test (Figure 9) exhibit a significant (p < 0.0001) association between the identified learner groups and the students’ performance in the course final exam, which was graded on a scale of 0 to 10. The distribution of the grades for Determined learners was centered around a B score (7.36/10). In the case of the Strategists, the mean score was slightly higher (7.53/10), although the distribution of grades was also more disperse. Lastly, Low-effort students showed a varied distribution of grades, with students at both ends of the grading scale (centered at 5.79/10). The pairwise comparisons showed that grades of the Low-effort students were indeed significantly lower than those of the two other groups with a moderate effect size. However, there were no statistically significant differences between Strategists and Determined learners in terms of grades.

5. Discussion

The current study sought to analyze students’ approaches to learning programming in context, i.e., in the LMS and the automated assessment tool, using methods that account for frequency, sequence, and process with emphasis on how and when students learn, struggle, and get support during their learning process.
RQ1: How can learning analytics help understand students’ approaches to learning programming (i.e., when and how they struggle, seek help, and succeed)?
Using sequence and process mining has allowed us to establish that students choose slides as their preferred learning resource both for self-instruction and as a reference when working on the assignments. This finding may be explained by the fact that slideshows contained both theoretical explanations of programming concepts and code excerpts. Students can copy these code chunks and build on them to solve the assignments. What is more, students can perform a text search on the slides to quickly find any specific concept they might be looking for. In turn, video-oriented instruction was far less frequent. Students were more likely to watch videos in purely self-instruction sessions (i.e., in times they were not working on the assignment). To make videos more appealing to students while working on the assignments, a possible improvement might be adding bookmarks, links on the slides pointing to these bookmarks, and subtitles to make them both accessible and searchable [48,49].
During sessions in which the students struggled with the assignments, they were more likely to revisit the assignment instructions, resort to the slides for answers, and seek help in the course forums. However, the majority of students who sought help in the forums concluded their learning sessions by so doing, suggesting an inability to find a timely response for their query. What is more, the long sequence of forum browsing can be interpreted as protracted search for a solution.
Students’ reluctance to actively participate in the forum might be explained by their anxiety to publicly externalize their questions or needs, their skepticism about receiving a timely response, or their preference for other sources of information (e.g., course materials, a person, book, or a website). Similarly, the forums had few responses from the students (eventually teachers had to reply). Therefore, rewarding forum participation may be a good strategy to increase peer collaboration and support [50,51,52].
Our findings of students’ preferences in terms of learning materials are comparable to those of [12], who found programming students were more inclined towards being reading-oriented rather than video-oriented. Students’ preference for reading materials over videos does not seem to be an unique finding of programming education but rather applies to other areas of engineering as well [29,38]. However, in our study, synchronizing the logs and using process and sequence mining allowed us to contextualize students’ preferences while studying, solving or struggling with the programming assignments. Mapping the different scenarios helped us understand the different processes of learning, the various types of learning design needed in each process, as well as how to adapt support to the situation. Although Blikstein [18] successfully identified moments of greater difficulty during students’ programming work, analyzing data from the programming environment alone did not allow the author to determine which tactics students applied when struggling.
RQ2: How can learning analytics help understand different strategies of programming learners and how they relate to performance?
Three different groups of learners were identified according to their learning strategies. The group categorized as Determined showed repeated use of the automated assessment tool, the learning materials available on the LMS, as well as the forum. Students in this group achieved a satisfactory grade in the final exam, which was comparable to that of the Strategists who scored the highest. According to existing literature, these two strategies result in the highest academic achievement [29,53,54].
The group of Strategists had a lower frequency of study sessions, help-seeking, and struggling sessions compared to the Determined ones. However, they surpassed the Determined learners in Assignment succeeding and Assignment exploring. This may indicate that they had previous knowledge of the topics covered in the course or studied from external resources. However, it remains largely speculative how to justify this and it is an issue open for further research.
Lastly, Low-effort learners scored, on average, significantly lower than the other two groups [29] and showed much higher variance. As the name implies, their frequency of study sessions, help-seeking, and other working sessions was lower than that of the other groups.
Reporting distinct groups of programming learners is common in the learning analytics literature; however, there are significant differences among disciplines and cluster characteristics pertaining to the context [12,20,31,35,55]. By clustering students’ learning tactics, [12] found three distinct groups of learners (highly selective, strategic, intensive), with very similar profiles and performance to those found in this work. Conversely, [20] identified five distinct clusters of students according to the overall frequency of their learning actions (effective, high-effort, average, blind-trial, and low-effort) and found that early and on-time submissions were more highly associated with final grades than the number of assignment submissions. Lastly, [35] identified four different student profiles according to their programming patterns (quitters, approachers, knowers, and solvers), each presenting different performance levels.

6. Conclusions and Future Work

The current study makes a novel contribution to the body of literature by examining students’ behavior when learning programming ‘where it occurs’, using a combination of methods to gain an in-depth understanding of the programming learning. Combining data from more than one source and using process and sequence mining allowed us to identify that students prefer different resources at different stages of their learning process. Text-based resources seem to be the preferred resource overall, namely slides that support e.g., search as well as copy and paste. In turn, videos were not as frequently used by students, especially while working on the assignments. Furthermore, when students struggled to solve the assignments, they resorted to the course forums to seek help. However, they were less likely to find timely support from their peers and may have possibly sought help elsewhere. Lastly, three different groups of learners were identified in this work according to their learning strategies (Determined, Strategists, and Low-effort), whose profiles are in consensus with those found in previous works in the literature [12].
Several instructional improvements to the programming course design are suggested on the basis of the findings of this study. First, to help students gain a deeper understanding of the programming concepts, students should be encouraged to watch the videos while they work on the assignments by, e.g., adding subtitles to the videos to increase accessibility and enable text search [48,49]. Second, to embolden a culture of peer collaboration within the course, rewarding forum participation is suggested [50,51,52]. Further, the automated assessment tool could be improved by adding more granularity of the data recorded about students’ programming behavior (e.g., increments on code size and code quality). Lastly, to increase students’ awareness of their learning process, the design of learning dashboards, which were earlier found to be beneficial for academic success [14,56], should be considered. Such support tool could be integrated in the LMS.
The present study is not without limitations. First, although combining data from the LMS and the automated assessment tool provides much more accurate insights on students’ learning process than relying on a single data source, activities that might be relevant to this learning process but take place elsewhere are overlooked, e.g., instant messaging between peers or consulting public programming forums. Moreover, this study investigated a single programming course. Although the sample is moderate in size, investigating the replicability of our findings in a larger and more diverse sample is needed in order to produce generalizable conclusions.
The work conducted in this study opens several lines of future work. Adding more data sources to model students’ behavior (e.g., code quality and complexity) may allow extracting more useful insights about students’ learning of programming. That would allow us to improve course design and provide relevant interventions. Complementing programming course learning design with innovative teaching practices, (e.g., educational escape rooms [57,58] or gamification [52]) could help stimulate subgroups of students who are less motivated. Repeating this study after implementing the suggested changes to the course design (e.g., rewarding forum participation and enhancing the presentation of the videos) would add value to the field of learning analytics, since it would provide empirical proof of whether the findings of the methods adopted by the researchers in this increasingly growing field can truly fulfill their objective of improving learner support and teaching, e.g., in terms of improved course learning design to further support students and ultimately to improve their learning outcomes

Author Contributions

Conceptualization, S.L.-P., M.S., and O.V.; methodology, S.L.-P. and M.S.; software, S.L.-P. and M.S.; validation, S.L.-P., M.S., and O.V.; formal analysis, S.L.-P. and M.S.; investigation, S.L.-P., M.S., and O.V.; resources, S.L.-P., M.S., and O.V.; data curation, S.L-P; writing—original draft preparation, S.L.-P. and M.S.; writing—review and editing, S.L.-P., M.S., and O.V.; visualization, S.L.-P. and M.S.; supervision, M.S. and O.V.; project administration, S.L.-P.; funding acquisition, S.L.-P. and M.S. All authors have read and agreed to the published version of the manuscript.

Funding

This research received no external funding. The APC was funded by UEF.

Institutional Review Board Statement

Not applicable.

Informed Consent Statement

Informed consent was obtained from all subjects involved in the study.

Data Availability Statement

The data presented in this study are available on request from the corresponding author. The data are not publicly available due to privacy reasons.

Conflicts of Interest

The authors declare no conflict of interest. The funders had no role in the design of the study; in the collection, analyses, or interpretation of data; in the writing of the manuscript, or in the decision to publish the results.

References

  1. Luxton-Reilly, A.; Albluwi, I.; Becker, B.A.; Giannakos, M.; Kumar, A.N.; Ott, L.; Paterson, J.; Scott, M.J.; Sheard, J.; Szabo, C. Introductory Programming: A Systematic Literature Review. In Proceedings of the Proceedings Companion of the 23rd Annual ACM Conference on Innovation and Technology in Computer Science Education, Larnaca, Cyprus, 2–4 July 2018; Association for Computing Machinery: New York, NY, USA, 2018; pp. 55–106. [Google Scholar]
  2. Popat, S.; Starkey, L. Learning to code or coding to learn? A systematic review. Comput. Educ. 2019, 128, 365–376. [Google Scholar] [CrossRef]
  3. Bennedsen, J.; Caspersen, M.E. Failure rates in introductory programming. ACM Inroads 2019, 10, 30–36. [Google Scholar] [CrossRef] [Green Version]
  4. Watson, C.; Li, F.W.B. Failure rates in introductory programming revisited. In Proceedings of the 2014 Conference on Innovation & Technology in Computer Science Education (ITiCSE ’14), Uppsala, Sweden, 21–25 June 2014; ACM Press: New York, NY, USA, 2014; pp. 39–44. [Google Scholar]
  5. Piteira, M.; Costa, C. Learning Computer Programming: Study of Difficulties in Learning Programming. In Proceedings of the 2013 International Conference on Information Systems and Design of Communication, Lisboa, Portugal, 11 July 2013; Association for Computing Machinery: New York, NY, USA, 2013; pp. 75–80. [Google Scholar]
  6. Qian, Y.; Lehman, J. Students’ Misconceptions and Other Difficulties in Introductory Programming. Acm Trans. Comput. Educ. 2017, 18, 1–24. [Google Scholar] [CrossRef]
  7. Song, L.; Hill, J. A Conceptual Model for Understanding Self-Directed Learning in Online Environments. J. Interact. Online Learn. 2007, 6, 27–42. [Google Scholar]
  8. Kumar, V.; Winne, P.; Hadwin, A.; Nesbit, J.; Jamieson-Noel, D.; Calvert, T.; Samin, B. Effects of self-regulated learning in programming. In Proceedings of the Fifth IEEE International Conference on Advanced Learning Technologies (ICALT’05), Kaohsiung, Taiwan, 5–8 July 2005; pp. 383–387. [Google Scholar]
  9. Broadbent, J.; Poon, W.L. Self-regulated learning strategies & academic achievement in online higher education learning environments: A systematic review. Internet High. Educ. 2015, 27, 1–13. [Google Scholar] [CrossRef]
  10. Weinstein, C.E.; Husman, J.; Dierking, D.R. Self- regulation interventions with a focus on learning strategies. In Handbook of Self-Regulation; Academic Press: San Diego, CA, USA, 2000; pp. 727–747. [Google Scholar]
  11. Fincham, E.; Gašević, D.; Jovanović, J.; Pardo, A. From Study Tactics to Learning Strategies: An Analytical Method for Extracting Interpretable Representations. IEEE Trans. Learn. Technol. 2019, 12, 59–72. [Google Scholar] [CrossRef]
  12. Matcha, W.; Gašević, D.; Ahmad Uzir, N.; Jovanović, J.; Pardo, A.; Lim, L.; Maldonado-Mahauad, J.; Gentili, S.; Pérez-Sanagustín, M.; Tsai, Y.-S.; et al. Analytics of Learning Strategies: Role of Course Design and Delivery Modality. J. Learn. Anal. 2020, 7, 45–71. [Google Scholar] [CrossRef]
  13. Hamdan, K.M.; Al-Bashaireh, A.M.; Zahran, Z.; Al-Daghestani, A.; AL-Habashneh, S.; Shaheen, A.M. University students’ interaction, Internet self-efficacy, self-regulation and satisfaction with online education during pandemic crises of COVID-19 (SARS-CoV-2). Int. J. Educ. Manag. 2021. ahead-of-print. [Google Scholar] [CrossRef]
  14. Viberg, O.; Khalil, M.; Baars, M. Self-regulated learning and learning analytics in online learning environments. In Proceedings of the Tenth International Conference on Learning Analytics & Knowledge, Frankfurt, Germany, 23–27 March 2020; ACM: New York, NY, USA, 2020; pp. 524–533. [Google Scholar]
  15. UN General Assembly. Transforming Our World: The 2030 Agenda for Sustainable Development. 2015. Available online: https://www.un.org/ga/search/view_doc.asp?symbol=A/RES/70/1&Lang=E (accessed on 22 April 2021).
  16. Webb, S.; Holford, J.; Hodge, S.; Milana, M.; Waller, R. Lifelong learning for quality education: Exploring the neglected aspect of sustainable development goal 4. Int. J. Lifelong Educ. 2017, 36, 509–511. [Google Scholar] [CrossRef]
  17. Romero, C.; Ventura, S. Educational data mining and learning analytics: An updated survey. Wires Data Min. Knowl. Discov. 2020, 10, e1355. [Google Scholar] [CrossRef]
  18. Blikstein, P. Using Learning Analytics to Assess Students’ Behavior in Open-Ended Programming Tasks. In Proceedings of the 1st International Conference on Learning Analytics and Knowledge, Banff, Alberta, 27 February–1 March 2011; Association for Computing Machinery: New York, NY, USA, 2011; pp. 110–116. [Google Scholar]
  19. Azcona, D.; Hsiao, I.-H.; Smeaton, A.F. Detecting students-at-risk in computer programming classes with learning analytics from students’ digital footprints. User Modeling User Adapt. Interact. 2019, 29, 759–788. [Google Scholar] [CrossRef]
  20. Chen, H.-M.; Nguyen, B.-A.; Yan, Y.-X.; Dow, C.-R. Analysis of Learning Behavior in an Automated Programming Assessment Environment: A Code Quality Perspective. IEEE Access 2020, 8, 167341–167354. [Google Scholar] [CrossRef]
  21. Reimann, P. Time is precious: Variable- and event-centred approaches to process analysis in CSCL research. Int. J. Comput. Supported Collab. Learn. 2009, 4, 239–257. [Google Scholar] [CrossRef]
  22. Knight, S.; Friend Wise, A.; Chen, B. Time for Change: Why Learning Analytics Needs Temporal Analysis. J. Learn. Anal. 2017, 4, 7–17. [Google Scholar] [CrossRef] [Green Version]
  23. Saqr, M.; Nouri, J.; Fors, U. Time to focus on the temporal dimension of learning: A learning analytics study of the temporal patterns of students’ interactions and self-regulation. Int. J. Technol. Enhanc. Learn. 2019, 11, 398. [Google Scholar] [CrossRef]
  24. Burnette, J.L.; O’Boyle, E.H.; VanEpps, E.M.; Pollack, J.M.; Finkel, E.J. Mind-sets matter: A meta-analytic review of implicit theories and self-regulation. Psychol. Bull. 2013, 139, 655–701. [Google Scholar] [CrossRef] [Green Version]
  25. van der Aalst, W. Process Mining. Acm Trans. Manag. Inf. Syst. 2012, 3, 1–17. [Google Scholar] [CrossRef]
  26. Pechenizkiy, M.; Trcka, N.; Vasilyeva, E.; Aalst, W.; De Bra, P. Process Mining Online Assessment Data. In Proceedings of the Nuclear Engineering and Design—NUCL ENG DES, Cordoba, Spain, 1–3 July 2009; pp. 279–288. [Google Scholar]
  27. Uzir, N.A.; Gašević, D.; Jovanović, J.; Matcha, W.; Lim, L.-A.; Fudge, A. Analytics of time management and learning strategies for effective online learning in blended environments. In Proceedings of the Tenth International Conference on Learning Analytics & Knowledge, Frankfurt, Germany, 23–27 March 2020; ACM: New York, NY, USA, 2020; pp. 392–401. [Google Scholar]
  28. Gabadinho, A.; Ritschard, G.; Müller, N.S.; Studer, M. Analyzing and Visualizing State Sequences in R with TraMineR. J. Stat. Softw. 2011, 40, 1–37. [Google Scholar] [CrossRef] [Green Version]
  29. Matcha, W.; Gašević, D.; Uzir, N.A.; Jovanović, J.; Pardo, A. Analytics of Learning Strategies: Associations with Academic Performance and Feedback. In Proceedings of the 9th International Conference on Learning Analytics & Knowledge, Tempe, Arizona, 4–8 March 2019; Association for Computing Machinery: New York, NY, USA, 2019; pp. 461–470. [Google Scholar]
  30. Pereira, F.D.; Oliveira, E.H.T.; Oliveira, D.B.F.; Cristea, A.I.; Carvalho, L.S.G.; Fonseca, S.C.; Toda, A.; Isotani, S. Using learning analytics in the Amazonas: Understanding students’ behaviour in introductory programming. Br. J. Educ. Technol. 2020, 51, 955–972. [Google Scholar] [CrossRef]
  31. Filvà, D.A.; Forment, M.A.; García-Peñalvo, F.J.; Escudero, D.F.; Casañ, M.J. Clickstream for learning analytics to assess students’ behavior with Scratch. Future Gener. Comput. Syst. 2019, 93, 673–686. [Google Scholar] [CrossRef]
  32. Molenaar, I. Advances in temporal analysis in learning and instruction. Frontline Learn. Res. 2014, 2, 15–24. [Google Scholar] [CrossRef]
  33. Fields, D.A.; Quirke, L.; Amely, J.; Maughan, J. Combining Big Data and Thick Data Analyses for Understanding Youth Learning Trajectories in a Summer Coding Camp. In Proceedings of the 47th ACM Technical Symposium on Computing Science Education, Memphis, TN, USA, 2–5 March 2016; Association for Computing Machinery: New York, NY, USA, 2016; pp. 150–155. [Google Scholar]
  34. Watson, C.; Li, F.W.B.; Godwin, J.L. Predicting Performance in an Introductory Programming Course by Logging and Analyzing Student Programming Behavior. In Proceedings of the 2013 IEEE 13th International Conference on Advanced Learning Technologies, Beijing, China, 15–18 July 2013; IEEE: New York, NY, USA, 2013; pp. 319–323. [Google Scholar]
  35. Jiang, B.; Zhao, W.; Zhang, N.; Qiu, F. Programming trajectories analytics in block-based programming language learning. Interact. Learn. Environ. 2019, 1–14. [Google Scholar] [CrossRef]
  36. Quemada, J.; Barra, E.; Gordillo, A.; Pavon, S.; Salvachua, J.; Vazquez, I.; López-Pernas, S. AMMIL: A methodology for developing video-based learning courses. In Proceedings of the Proceedings of the 12th annual International Conference of Education, Research and Innovation (ICERI 2019), Seville, Spain, 11–13 November 2019; IATED: Seville, Spain, 2019; pp. 4893–4901. [Google Scholar]
  37. Barra, E.; López-Pernas, S.; Alonso, Á.; Sánchez-Rada, J.F.; Gordillo, A.; Quemada, J. Automated Assessment in Programming Courses: A Case Study during the COVID-19 Era. Sustainability 2020, 12, 7451. [Google Scholar] [CrossRef]
  38. Jovanović, J.; Gašević, D.; Dawson, S.; Pardo, A.; Mirriahi, N. Learning analytics to unveil learning strategies in a flipped classroom. Internet High. Educ. 2017, 33, 74–85. [Google Scholar] [CrossRef] [Green Version]
  39. Gašević, D.; Jovanović, J.; Pardo, A.; Dawson, S. Detecting Learning Strategies with Analytics: Links with Self-Reported Measures and Academic Performance. J. Learn. Anal. 2017, 4, 113–128. [Google Scholar] [CrossRef]
  40. Matcha, W.; Gašević, D.; Ahmad Uzir, N.; Jovanović, J.; Pardo, A.; Maldonado-Mahauad, J.; Pérez-Sanagustín, M. Detection of Learning Strategies: A Comparison of Process, Sequence and Network Analytic Approaches. In Lecture Notes in Computer Science; Scheffel, M., Broisin, J., Pammer-Schindler, V., Ioannou, A., Schneider, J., Eds.; Lecture Notes in Computer Science; Springer International Publishing: Cham, Switzerland, 2019; Volume 11722 LNCS, pp. 525–540. ISBN 9783030297350. [Google Scholar]
  41. Jovanovic, J.; Dawson, S.; Joksimovic, S.; Siemens, G. Supporting actionable intelligence: Reframing the analysis of observed study strategies. ACM Int. Conf. Proceeding Ser. 2020, 161–170. [Google Scholar] [CrossRef] [Green Version]
  42. Kovanović, V.; Gašević, D.; Joksimović, S.; Hatala, M.; Adesope, O. Analytics of communities of inquiry: Effects of learning technology use on cognitive presence in asynchronous online discussions. Internet High. Educ. 2015, 27, 74–89. [Google Scholar] [CrossRef] [Green Version]
  43. Peeters, W.; Saqr, M.; Viberg, O. Applying learning analytics to map students’ self-regulated learning tactics in an academic writing course. In Proceedings of the 28th International Conference on Computers in Education, Virtual conference on. 23–27 November 2020; Volume 1, pp. 245–254. [Google Scholar]
  44. Janssenswillen, G. bupaR: Business Process Analysis in R 2020. Available online: https://cran.r-project.org/package=bupaR (accessed on 1 April 2021).
  45. Mächler, M.; Rousseeuw, P.; Struyf, A.; Hubert, M.; Hornik, K. cluster: Cluster Analysis Basics and Extensions 2019. Available online: https://cran.r-project.org/package=cluster (accessed on 1 April 2021).
  46. Ostertagova, E.; Ostertag, O.; Kováč, J. Methodology and application of the Kruskal-Wallis test. Appl. Mech. Mater. 2014, 611, 115–120. [Google Scholar] [CrossRef]
  47. Holm, S. A Simple Sequentially Rejective Multiple Test Procedure. Scand. J. Stat. 1979, 6, 65–70. [Google Scholar]
  48. Gaur, E.; Saxena, V.; Singh, S.K. Video annotation tools: A Review. In Proceedings of the 2018 International Conference on Advances in Computing, Communication Control and Networking (ICACCCN), Greater Noida, India, 12–13 October 2018; pp. 911–914. [Google Scholar]
  49. Farhadi, B.; Ghaznavi-Ghoushchi, M.B. Creating a novel semantic video search engine through enrichment textual and temporal features of subtitled YouTube media fragments. In Proceedings of the International eConference on Computer and Knowledge Engineering (ICCKE 2013), Mashhad, Iran, 31 October–1 November 2013; pp. 64–72. [Google Scholar]
  50. Feng, Y.; Chen, D.; Chen, H.; Wan, C.; Xi, P. The assessment of the points reward mechanism in online course forum. In Proceedings of the 2016 International Conference on Progress in Informatics and Computing (PIC), Shanghai, China, 23–25 December 2016; pp. 722–727. [Google Scholar]
  51. Anderson, A.; Huttenlocher, D.; Kleinberg, J.; Leskovec, J. Engaging with Massive Online Courses. In Proceedings of the 23rd International Conference on World Wide Web, Seoul, Korea, 7–11 April 2014; Association for Computing Machinery: New York, NY, USA, 2014; pp. 687–698. [Google Scholar]
  52. Schöbel, S.; Janson, A.; Jahn, K.; Kordyaka, B.; Turetken, O.; Djafarova, N.; Saqr, M.; Wu, D.; Söllner, M.; Adam, M.; et al. A Research Agenda for the Why, What, and How of Gamification Designs—Results on an ECIS 2019 Panel. Commun. Assoc. Inf. Syst. 2020. [Google Scholar] [CrossRef]
  53. Chonkar, S.P.; Ha, T.C.; Chu, S.S.H.; Ng, A.X.; Lim, M.L.S.; Ee, T.X.; Ng, M.J.; Tan, K.H. The predominant learning approaches of medical students. BMC Med. Educ. 2018, 18, 17. [Google Scholar] [CrossRef] [Green Version]
  54. Zeegers, P. Approaches to learning in science: A longitudinal study. Br. J. Educ. Psychol. 2001, 71, 115–132. [Google Scholar] [CrossRef]
  55. Chen, J.; Wang, M.; Kirschner, P.A.; Tsai, C.-C. The Role of Collaboration, Computer Use, Learning Environments, and Supporting Strategies in CSCL: A Meta-Analysis. Rev. Educ. Res. 2018, 88, 799–843. [Google Scholar] [CrossRef]
  56. Matcha, W.; Uzir, N.A.; Gasevic, D.; Pardo, A. A Systematic Review of Empirical Studies on Learning Analytics Dashboards: A Self-Regulated Learning Perspective. IEEE Trans. Learn. Technol. 2020, 13, 226–245. [Google Scholar] [CrossRef]
  57. Lopez-Pernas, S.; Gordillo, A.; Barra, E.; Quemada, J. Analyzing Learning Effectiveness and Students’ Perceptions of an Educational Escape Room in a Programming Course in Higher Education. IEEE Access 2019, 7, 184221–184234. [Google Scholar] [CrossRef]
  58. Lopez-Pernas, S.; Gordillo, A.; Barra, E.; Quemada, J. Escapp: A Web Platform for Conducting Educational Escape Rooms. IEEE Access 2021, 9, 38062–38077. [Google Scholar] [CrossRef]
Figure 1. Overall sequence distribution plot of students’ learning actions in the LMS.
Sustainability 13 04825 g001
Figure 2. Sequence distribution plot of students’ learning actions in the LMS within each cluster.
Sustainability 13 04825 g002
Figure 3. Overall sequence distribution plot of students’ learning actions using the automated assessment tool.
Sustainability 13 04825 g003
Figure 4. Sequence distribution plot of students’ learning actions using the automated assessment tool within each cluster.
Sustainability 13 04825 g004
Figure 5. Process model for the learning sessions that did not include any assignment work.
Sustainability 13 04825 g005
Figure 6. Process model for the learning sessions that included at least one Assignment struggling session.
Sustainability 13 04825 g006
Figure 7. Process model for the learning sessions that included assignment work but no Assignment struggling sessions.
Sustainability 13 04825 g007
Figure 8. Mean frequency for each session type in each learner group.
Sustainability 13 04825 g008
Figure 9. Violin plot comparing the grades among the three learner groups through Kruskal–Wallis test and Dunn pairwise test.
Sustainability 13 04825 g009
Table 1. Description of the LMS logs.
Learning ActionDescription
View assignment instructionsView the written instructions of a programming assignment including the grading rubric
View course information View course instructions and planning
View forum post View a forum post related to the assignments
View sample exam View a solved exam from a previous academic year
View slideshow View lesson slides including explanations and code examples
Watch video Watch a video lesson
Write forum postWrite a forum post
Table 2. Description of the automated assessment tool logs.
Learning ActionDescription
Start assignment Download the assignment
Score FRun the tests and get a score under 5
Score CRun the tests and get a score between 5 and 7
Score BRun the tests and get a score between 7 and 10
Score ARun the tests and get a score of 10
Submit assignment Submit the assignment to the LMS
Table 3. Summary statistics by quartile of students’ learning actions both in the LMS and in the automated assessment tool
ContextLearning Action25%Median75%Total
LMSView assignment instructions21.0030.0040.009381
View course information7.0011.0015.003391
View forum post9.7523.0042.258744
View sample exam3.008.0014.002997
View slideshow17.0033.0050.0010,934
Watch video10.0017.0030.006375
Write forum post0.000.001.00224
Automated
assessment tool
Start assignment7.008.009.002336
Score A23.0032.0040.009405
Score B9.0018.0029.006848
Score C6.0013.0020.004770
Score F19.7536.5058.0012,903
Submit assignment11.0012.0014.003678
Publisher’s Note: MDPI stays neutral with regard to jurisdictional claims in published maps and institutional affiliations.