Abstract
The social network analysis has been actively applied in various tourist destinations, with a few studies on the tourism economic network structure of national parks. Taking the national parks in the Central Region of China as research objects, this study applies the modified gravity model to measure the strength of tourism economic connection. The social network analysis method (SNA) is used to analyze the network structure of tourism economic connection among national parks from the perspectives of overall network density, network centrality, and cohesive subgroups. The results show that the intensity of the tourism relationships among national parks in Central China is unbalanced in spatial distribution. The structure of tourism economic network presents a multi-core model. Lushan Mountain, Shaoshan, Wudang Mountain, and other national parks play a necessary role in the transmission of regional tourism economic elements. There are cohesive subgroups of connections among national parks, which are closely related to administrative divisions and regional cultural background. The subgroups of interior scenes in the same province are more closely related, and the degree of tourism integration still needs to be improved. The study advances the understanding of tourism economic network relationships among tourist attractions in a destination.
1. Introduction
Under the background of economic globalization and regional integration, various regions have launched in-depth cooperation in the development of tourism resources, tourism infrastructure, and other aspects. Regional tourism cooperation is the favorable choice to realize the tourism sustainable development. There are many forms of regional tourism cooperation, such as economic cooperation, resource sharing, talent cooperation, etc. Moreover, tourism economic cooperation is a form of tourism cooperation. As the carrier of tourism activities, the quantity and quality of tourist attractions have greatly affected the development level of the national and local tourism industry [1,2]. Especially, the national park is one of the most nationally representative tourist attractions that should grant power to the local communities and develop co-management systems [3,4]. Nevertheless, there is a vicious competition among various national parks [5]. Due to the lack of cooperation, it is tough to effectively utilize tourism resources, resulting in a serious waste of human, material, and financial resources. At present, the country is vigorously promoting the optimization and integration of tourism resources and accelerating the tourism development in the whole region. To that end, this study provides important practical implications for the academic circle regarding the tourism economic connection among cross-regional national parks.
Over the last few decades, tourism economic cooperation has attracted extensive attention. These studies mainly focus on the tourism economic connection among different levels of regions [6,7]. However, scholars have seldom analyzed the tourism economic cooperation between tourist attractions from the microscopic point of view [8]. The epistemology of tourist destination cooperation has been the subject of ongoing discussion and debate [9,10]. Voda et al. [11] emphasized the innovation diffusion importance for destination integration in transformative networks. The dispersion or cooperation of tourist attractions is a basic feature of the tourism industry [8,12]. Scholars pay more attention to embodying the cooperation from the tourist flow [13] and information flow [14] between scenic areas, to analyze and grasp the flow scale, flow direction, and flow mode of tourists in the inner region. However, scholars have failed to concentrate on tourism economic flows between tourist attractions, which can more objectively and comprehensively reflect the relationship and cooperation between tourist attractions. Therefore, describing the tourism economic connection of tourist attractions has become a significant research problem, which has enriched the academic understanding of this phenomenon to some extent.
Addressing this important research gap, the purpose of the current research is 2-fold: (i) To explore the network structure of tourism economic connection between national parks, and (ii) to put forward some proposals to facilitate the sustainable development of regional tourism. From the perspective of regional cooperation, this work builds a network model based on the national parks in the Central Region of China data and explores the spatial correlation of tourism economic using the social network analysis. By measuring network density and centrality indicators, this study analyzes the overall characteristics of the tourism economic connection network, the internal connections, and differences between national parks.
This study, therefore, makes substantial contributions in tourism literature. First, research on the tourism cooperation of tourist attractions has attracted substantial attention in the flow of tourists and information [15,16,17]. There is, however, a shortage of literature on the economic flow of tourism between tourist attractions. The most important theoretical contribution is to reflect the cooperation of national parks through economic flow for the first time, which helps better integrate regional tourism resources and improve the level of regional tourism economic development. Second, this study focuses on cross-border tourism cooperation and reveals the mechanism of cooperation, which is not based on a single region [8]. By studying the cross-border regions in the process of network evolution, this research has contributed to the tourism economic network literature in terms of cooperation. The work also enriches the research results of cross-border destinations to some extent. From a practical perspective, this study indicates that policymakers should establish and improve regional tourism cooperation mechanisms to realize the joint development of tourist attractions. At the same time, tourist attractions in other regions can also benefit from our findings.
The rest of the paper is organized as follows. In Section 2, we briefly elaborate on the literature review of existing research. In Section 3, we present the data and a rigorous description of the methodology used in the analysis. The empirical results are presented in Section 4, in which we describe the tourism economic network structure of national parks in the Central Region of China. Section 5 discusses the findings. Section 6 provides the conclusions of this work, practical recommendations for tourist destinations, and future research directions.
2. Literature Review
2.1. Network Analysis in Tourism
In recent years, the social network analysis has shown strong adaptability in tourism research. The research content mainly focuses on the tourism destination network, the tourism academic cooperation network, and the relationship network among tourism related groups. From the perspective of tourism supply, whereas the existing literature on the tourism destination network has generally concentrated on the characteristics and evolution of network structure [18,19], the influence of different network structures [20,21], and the influencing factors of network structure [22,23]. In the specific context of the tourism academic cooperation network, García-Lillo et al. [24] analyzed the existing literature on hospitality management from all the research papers published in The International Journal of Hospitality Management (IJHM) between 2008 and 2014 with SNA. Fan et al. [25] attempted to identify key scholars in the cooperative network from the two indicators of academic output and intermediary centrality and discussed the impact of changes in key scholars on the structure of the entire academic network. The research results of the tourism academic cooperation network have been relatively concentrated, which is conducive to understanding the knowledge cooperation among network members and the sharing degree of resources in the knowledge network. Tourism is the largest interpersonal activity in modern society. Hwang [21] believed that the closer the network between residents and community leaders, the more likely they are to be part of a community effort to promote tourism.
2.2. Network Analysis in Tourism Economic Cooperation
The tourism economic cooperation network is the kernel category of tourism destination network. With the advancement of economic globalization and regional economic integration, tourism economic relations have increasingly become the focus of academic research [26]. Tourism economic cooperation is produced in the process of tourism flow movement in tourism destinations. The tourism flow movement among multiple tourism destinations forms a complex tourism economic connection network. The tourism economic connection network is based on spatial region, tourism economic activities, and tourists as an intermediary [27]. It is an important part of spatial connection by connecting different tourism destinations through tourism elements transmission channels and transportation networks.
In the form of tourism economic spatial organization, Hajilo et al. [28] analyzed the spatial distribution characteristics of tourism enterprises in the eastern part of Gilan Province. Shih [16] empirically tested a sample of drive tourists taken from 16 destinations in Nantou, Taiwan, and analyzed the structural characteristics of their network locations on different tourism routes. In terms of the characteristics and internal laws of tourism economic networks, some scholars examined the process of tourism destination evolution and transformation [15]. In the aspect of research methods, some scholars applied the gravitation model [29], complexity theory analysis method, and gravity model [17] to study the regional economic connection network. In recent years, with the rapid development of tourism, a large number of researches on the tourism economic connection network using the social network analysis (SNA) have emerged [30,31,32]. In respect of the research perspective, it mainly focused on a comprehensive urban belt, urban agglomerations, and cross-border tourism areas [33,34].
2.3. Network Analysis in Tourist Attraction Cooperation
The cooperation of tourist attractions is an essential part of the regional tourism economic connection [35]. Hernández et al. [36] proved the efficiency of network analysis for tourist segmentation as it results in geographically connected clusters of attraction. Kirilenko et al. [37] used the network analysis to develop a methodology to identify the attraction clusters in a destination within vast territories. Capriello [38] analyzed rural England attractions, emphasizing the effectiveness of public policy on networks, advantages such as problem-solving, information expansion, and knowledge acquisition for its members.
In terms of research content, scholars mainly focused on tourist flow, information flow, and other aspects to reflect the cooperation of tourist attractions. Shih [16] empirically studied the drive tourists taken from 16 destinations in Nantou, Taiwan and reflected the connection between tourist destinations through the flow of tourists. Similarly, Hong et al. [39] tested the relationship between networks of tourism destinations and tourism flows in China, and concluded that the more connections a tourist destination has with other destinations, the greater its tourist flow. However, there are a few studies on the economic flow of tourism between tourist attractions. Most of the research methods are qualitative questionnaires and quantitative models. With the popularity of social network analysis, Dredge [40] took a scenic area in New South Wales, Australia as an example to explore and analyze the impact of the relationship network between the government and enterprises on the development of local tourism industry. Stienmetz [41] claimed that attraction clusters identification can be used for innovative destination design strategies. Hsu et al. [42] developed a decision support system for Taiwan tourist attractions. In respect of the research area, some scholars paid more attention to a single scenic area [8]. It seems that other purposes for which the findings have different profiles are not appropriate and the research is not typical. Cross border cooperation is an inevitable choice for the development of regional economic integration [43]. Nevertheless, there are few cross-border scenic areas as the research object to study the tourism economic relationship.
2.4. National Parks
Since the idea of natural protection appeared over a century ago, national parks have become a means to satisfy the needs of environmental protection and human entertainment. The concept of national park is only one type of area protection, alongside world heritages sites, wilderness areas, biosphere reserves, marine reserves, and nature 2000 reserves. National parks constitute distinctive tourist attractions, performing as economic development engines [3].
There are 1865 national parks in China, including National Forest Parks, National-level Scenic Areas, National Natural Reserves, National Geoparks, National Wetland Parks, National Mining Parks, and National Water Reserve Parks [5]. The term “National Park” has different meanings in China. If it does not refer to a single category, the word causes considerable confusion. Among them, National Forest Park is the National Park defined by the International Union for Conservation of Nature (IUCN) and managed by the State Forestry Administration (SFA). These national parks are mainly designed to provide education and entertainment opportunities for the public. For example, the Zhangjiajie National Forest Park was approved to be established in 1985, which is the first forest park in China. National Natural Reserves are intended to protect specific areas and are designed in strict accordance with IUCN standards. National-level Scenic Areas are labelled as “National Park of China” in the “Regulation for Scenic Areas”. These scenic areas are not necessarily designed for the purpose of protection, but for people to visit or carry out scientific and cultural activities. They are the most nationally representative tourist attraction. This study takes National Parks as the research object, which means the National-level Scenic Areas.
2.5. Research Topic
The relationship and cooperation of tourist attractions have a great influence on the promotion of interregional tourism economy, but the existing literature is more based on the perspective of tourist flow to analyze the relationship of tourist attractions. Therefore, it is surprising that little academic attention has been given to the spatial correlation structure of tourism economy among scenic spots, and economic ties can reflect a broader meaning, including tourist flow, information flow, etc. Simultaneously, little attention has been paid to the cross-border tourism economic contraction of tourist attractions. As such, our research focuses on the spatial structure of tourism economy between national parks. First of all, this study applies the modified gravity model to analyze the spatial network relationship of tourism economic development of national parks in Central China. Our research constructs the overall network spatial relationship matrix, in order to make up for the defects that most of the previous studies only focus on attribute data and single scenic area. Moreover, this paper uses the social network analysis method to analyze the spatial network structure of tourism economic development of national parks in Central China, and the UCINET software and ArcGIS software are applied to visualize it. Therefore, it can make clear the position of each national park in the interregional tourism economic association network, and expand the research content of the spatial network association structure of the tourism economy.
3. Research Methodology
3.1. Study Area
This research is conducted in six provinces in Central China, which include Shanxi Province, Anhui Province, Jiangxi Province, Henan Province, Hubei Province, and Hunan Province. The total area of the six central provinces is 1.028 million square kilometers, with a population of more than 368 million in 2017. In addition, the six central provinces are a popular tourist destination, famous for its historical and cultural landmarks, and their development is highly valued by the country. The implementation of “The Rise of Central China” has drawn up a blueprint for the development of the tourism economy in the central region. In 2017, the six provinces jointly signed the “Framework Agreement on Tourism Cooperation in the Six Provinces of Central China” to powerfully strengthen the tourism economic cooperation and vigorously develop the tourism industry. In 2017, the total domestic tourism revenue reached RMB 36,942.13 billion, and tourism foreign exchange earnings reached USD 778,573.77 million.
In China, tourist attractions are subjected to evaluation and grading by tourism authorities. In accordance with the national standard of the People’s Republic of China (GB50298-1999), the State Council prescribes the national park. In this study, 73 national parks in the six central provinces were selected as research objects (by the end of 2017). These tourist attractions have ornamental, cultural or scientific value, and can provide tourists with areas for sightseeing or scientific and cultural activities. According to the Ministry of Housing and Urban-Rural Development of the People’s Republic of China (2017) as shown in Figure 1 and Table 1, these samples include 5 national parks in Shanxi Province, 12 in Anhui province, 18 in Jiangxi province, 11 in Henan province, 8 in Hubei province, and 19 in Hunan province.
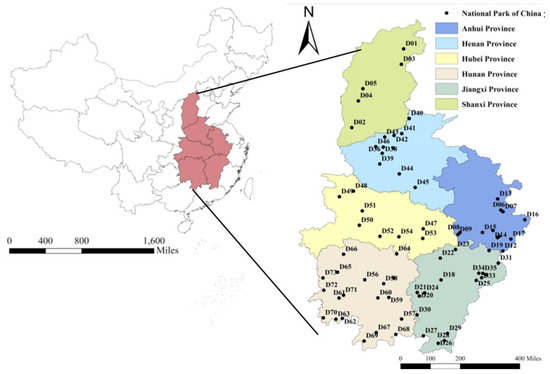
Figure 1.
Location map of national parks in the Central Region of China.

Table 1.
National parks in the study.
3.2. Research Methods
3.2.1. The Modified Gravity Model
The gravity model has been widely used in regional economic relations. It can describe the strength of the relationship between the two regions by integrating geographical distance, economic level, population size, etc. [44]. In this paper, we use the modified gravity model to explore the characteristics of the overall network and the individual national park’s characteristics in the network by the UCINET software. The national parks in the Central Region of China are taken as the network node, and the “line” between the two nodes in the associated network is defined as the spatial correlation between national parks. Therefore, the characterization of national parks’ “quality” should focus on measuring the level of tourism economic development. Considering that tourists are the main body of tourism economic activities, the number of tourists should also be one of the important indicators for measuring the “quality” of national parks. With the development of the tourism industry, the development scale of national parks has been continuously pushed deeper and horizontally, and its development level has an obvious correlation with the area of national parks. Combining the above studies, this research believes that the tourism economic connection between national parks is related to the number of tourists, the total revenue, and the area. Considering the unidirectionality and difference of economic attraction among different tourist attractions, the contribution of each scenic area to the economic gravity is different. In order to highlight the differences in tourism economic connection, this article uses the proportion of tourism revenue in the two national parks as a percentage of the total tourism revenue to modify the experience constant K. Therefore, the revised gravity model equation is:
where Pi, Pj respectively are the number of tourists in national park i and national park j; Gi, Gj mean the total revenue of national park i and national park j; Si and Sj are the areas of national park i and national park j; Kij means the contribution rate of tourism economic connection between the two national parks. Dij represents the spatial distance between national park i and national park j. The strength matrix of tourism economic connection between national parks in 2017 was calculated by Equation (1), and the data were binarized. The tourism economic connection quantity Ci of the national park is the sum of i and the tourism economic connection degree of all national parks in the region, and .
3.2.2. Social Network Analysis Model
- (1)
- Network density
The network density reflects the sparseness of the association connection between the nodes. The higher the network density, the stronger the network association. The formula is as follows:
where D means the network density; L represents the number of relationships owned; N × (N−1) means the maximum possible number of relationships.
- (2)
- Network efficiency
Network efficiency represents the connection efficiency between nodes. The higher the value, the more stable the regional network. The formula is as follows:
where E is the network efficiency, M is the number of redundant lines, and max (M) is the maximum number of possible redundant lines.
- (3)
- Network centrality
Centrality reflects the status and role of each node in the network, including degree centrality, closeness centrality, and betweenness centrality. Among them, degree centrality refers to the number of connections owned by network participants. If the value is higher, it means that the participant will be in a better position or will have more power. The formula is as follows:
where De means the degree centrality; n represents the number of directly related national parks; N represents the number of network nodes.
Closeness centrality reflects the degree to which a node is not controlled by other nodes. A higher value indicates that there are more direct spatial associations between national parks. The formula is as follows:
where means the closeness centrality; dij represents the shortest distance between two nodes.
Betweenness centrality represents the degree of control that one node has over other nodes. If the value is higher, the national park has a stronger ability to control the correlation between other national parks. The formula is as follows:
where means betweenness centrality; represents the ability to control network associations.
- (4)
- Cohesive Subgroup
Based on the amount of tourism economic connection of national parks in Central China, this article discusses the phenomenon of small group spatial agglomeration among national parks, and then provides the basis for the construction of tourism spatial structure in Central China.
3.3. Data Source
This paper takes 73 national parks in the six central provinces as the network points to empirically study the spatial correlation of tourism economy in 2017. In this research, a modified gravity model is first used to determine the spatial association. The required data mainly are the number of tourists in national park, the total revenue of national park, the areas of national park, and geographical distances between national parks. These data come from the “The Yearbook of China Tourism Statistic”, “The Yearbook of Shanxi Province Statistical”, “The Yearbook of Anhui Province Statistical”, “The Yearbook of Jiangxi Province Statistical”, “The Yearbook of Hubei Province Statistical”, “The Yearbook of Hunan Province Statistical”, and “The Yearbook of Henan Province Statistics”. The distance data come from the geographical distance between national parks retrieved using www.googlemap.cn (accessed on 2 January 2021) with the shortest distance as the restriction condition.
4. Results
4.1. Strength of Tourism Economic Connection
Based on the modified gravity model, this paper calculates the strength of tourism economic connection (STEC) among the national parks in the central region. STEC is an indicator reflecting the capital flow, information flow, and tourist flow among national parks in a region. It can objectively reflect the intensity of tourism exchanges and the radiation ability of national parks. In order to clearly illustrate the main features of spatial connection, the line that is higher than the average value of STEC (13.641) is displayed in the ArcGIS10.2 software. Figure 2 shows that each node indicates one tourist attraction, and the connecting line between the nodes expresses the interaction between two tourist attractions. The width of the connecting line means the degree of interaction. The tourism economic network structure of national parks is relatively dense. At the provincial level, Hunan Province has the highest tourism economic cooperation among national parks, which results from the large number of national parks in Hunan Province and its proximity to the national parks in the surrounding provinces, as well as convenient transportation facilities to promote their cooperation. Tourists can visit these famous national parks in a relatively small geographic radius, and these national parks with geographic proximity can satisfy tourists’ demand in a relatively short period of time. What is more, there is a close tourism economic connection between the internal national parks and the external national parks. The allocation efficiency of the tourism production factors rose, the tourism infrastructure gradually improved, and the level of tourism was continuously enhanced. These initiatives paved a road for the enhancement of tourism cooperation between national parks. While the tourism economic connection between national parks in Shanxi Province is the lowest, which is related to the level of economic development of Shanxi Province itself, and the low traffic accessibility brings inconvenience to the tourism economic cooperation between national parks.
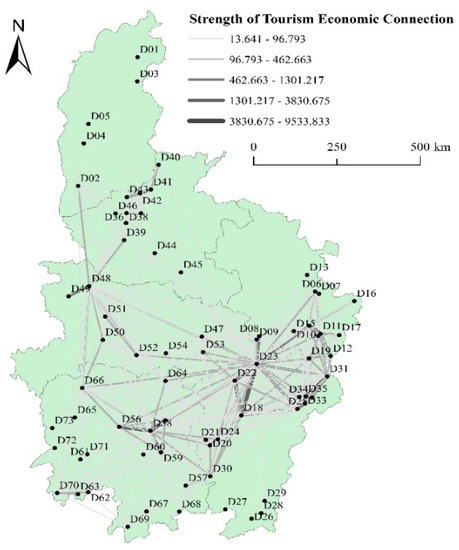
Figure 2.
Strength of tourism economic connection.
As Table 2 shows, the tourism economic cooperation between D23, D58, D18, D11, and other national parks are in the forefront, while those between D04, D05, D15, and other national parks are lower. Among them, D11 and D23 are close to the Yangtze River Delta with a superior geographical location, which has a large tourist market. Moreover, the design routes of travel agencies often include these national parks, which are also favored by tourists. D58 has some cultural attractiveness that other national parks do not have. However, D05, D15, and other national parks are relatively remote, with poor access to traffic, and poor information for tourists. Therefore, they have little tourism economic cooperation with other national parks.
Table 2.
The intensity of tourism economic cooperation between national parks.
4.2. Network Node Structure Characteristics
4.2.1. Structure Characteristics of the Overall Network
The indicators of the tourist attraction network are calculated by the social network analysis program, UCINET6.0. The number of economic relations related to tourism in national parks in the central region is 843. Therefore, it can be seen that the tourism economic relationship of various national parks is universal. Since the network density is directly related to the number of associations, the network density of tourism economic connection between national parks in the central region is 0.164, which reflects that the structure of tourism economic connection network is relatively low. In terms of network efficiency, the value is 0.732, which indicates that the spatial network structure of the tourism economy is unstable to a certain extent. Furthermore, the network hierarchy represents the degree of network dominance of the tourism economic connection between each node. The network hierarchy value is 0.621, which indicates that each national park can achieve tourism economic cooperation between other national parks through the overall network structure.
4.2.2. Structure Characteristics of the Individual Network
The degree centrality index shows that there are tourism agglomeration and radiation links between each national park and 11.822 other nodes on average. The variance of degree centrality index is large, which indicates that the structure of tourism economic network in national parks is imbalanced. From Table 3 above, D27, D26, D01, and other national parks have a relatively high out-degree, and the spillover effect on other national parks is more obvious. D23, D58, D18, and other national parks are not only higher in their in-degree than other national parks, but also much higher than their out-degree, benefiting more from the tourist economic network between national parks. This indicates that quite a few core national parks have attracted a large number of tourists, leading to the phenomenon of overflowing to the core area in the tourism economic cooperation network.
Table 3.
Descriptive statistics of the tourist economic network structure of national parks.
The closeness centrality index reflects that the patency of transfer and diffusion between nodes in the tourism economic cooperation network differs greatly, and the average values of in-closeness centrality and out-closeness centrality are 27.376 and 3.119, respectively. Among them, D23, D18, D22, and other national parks have relatively high accessibility, which indicates that these national parks have complete tourism infrastructure and convenient transportation networks. Nevertheless, D01, D02, D03, and other national parks are relatively close to each other, and these national parks are located in Shanxi Province. Due to the earlier development of national parks in Shanxi Province, the “spillover” effect is greater than the “polarization” effect.
The average value of betweenness centrality index is 56.178. The top six national parks of D48, D02, D23, D58, D11, and D30 are the key national parks in Hubei Province, Shanxi Province, Jiangxi Province, and Hunan Province, respectively. Two of them are located in Jiangxi Province. The above-mentioned national parks are important intermediaries to connect with other national parks. Other national parks are highly dependent on them, which has affected the communication and cooperation between other national parks in the province to a certain extent. The centrality of the national parks in Henan Province is relatively low, indicating that the interoperability between the tourist attractions is not strong. Among them, the betweenness centrality of tourism economic contact in 21 national parks is 0, and the centrality distribution of betweenness national parks has a polarization characteristic in the Central Region of China. A few core node national parks have become the main channel for controlling the tourism economic relations between tourist attractions.
On the whole, there is an imbalance in the network structure of tourism economy in the Central Region of China. D23, D58, D48, and other national parks are higher than other tourist nodes, and they are at the core of the tourism economic cooperation network. This not only benefits from its unique geographical location and convenient transportation facilities but also has an inseparable relationship with the local government’s vigorous publicity and the attraction itself. While these core national parks promote the development of tourism economy, they also promote the development of surrounding national parks and the coordinated development of tourism between regions. However, the comprehensive central index value of tourism economic connection network in Shanxi Province and Henan Province is relatively low. The possible reason is that they are on the edge of the tourism economic cooperation network, affected by geographical distance and other factors, such as inconvenient transportation and tourists’ lack of access to scenic areas. As a consequence, these factors lead to a poor economic and information exchange between the national parks in this province and other provinces.
The region proximity among major attractions in a destination is positively related to the attraction cooperation. In contrast, the distance between other tourist attractions causes a significant barrier effect. For example, D18 and D23 are both located in Jiangxi Province, which are geographically close to each other. Moreover, the joint ticket effect between national parks has a strong radiation effect on the surrounding national parks. As a result, it promotes mutual competition and cooperation among national parks in the network, and facilitates the network system to form an overall advantage. The distance between D23 and D04 is relatively far, which dramatically reduces their co-occurrence frequency.
4.3. Structural Holes
The structural hole indicator can effectively identify the nodes with advantages and disadvantages in the tourism economic network. Table 3 shows that D23 has the highest effective scale and efficiency, the least constraint, and the highest level of structural holes in the tourist economic cooperation network of national parks. Secondly, D18, D22, D48, D58, and other national parks are second only to D23, and they have certain advantages and competition. Its advantages are shown in two aspects. First, these national parks have a stronger information advantage than other national parks. These nodes can obtain information from multiple non-intersecting parts of the network earlier or more conveniently. The second is that for the overall network, these nodes can promote communication between different groups in the network, which can be expressed as tourist flow, information flow, material flow, and economic flow. However, D43, D35, D49, D63, and other national parks have relatively low levels of structural holes, which are in a disadvantaged position in the network structure. This shows that these national parks are less attractive to tourists and lack competitive advantages. They should strengthen cooperation with the surrounding national parks in an advantageous position. The local government should increase the publicity of the national parks and improve the level of tourism infrastructure construction and reception.
4.4. Cohesive Subgroups Analysis
Cohesive subgroups are composed of more direct and close nodes in the network, which reflect the substructure within the group. The cohesive subgroup analysis is based on the strength of the tourism economic connection between regions, thus reflecting the close relationship between regions.
Utilizing the CONCOR algorithm in UCINET, it is concluded that there are four agglomerate subgroups in the tourism economic connection network at the secondary level and eight agglomerate subgroups at the third level. As shown in Table 4, there are four groups in the Central Region of China at the secondary level, namely group 1 (composed of 14 national parks such as D01, D02, D03, D04, D05, and D42), group 2 (consisting of seven national parks such as D44, D45, D48, and D52), group 3 (composed of 22 national parks such as D06, D11, and D17), and group 4 (composed of 30 national parks including D20, D21, D26, D28, and D29). Table 5 indicates that in the third level, there are eight groups in the Central Region of China, namely group 1 (composed of six national parks such as D01, D03, D04, D05, and D39), group 2 (composed of eight national parks such as D02, D42, D43, and D46), group 3 (composed of D44, D45, and D49), group 4 (composed of D48, D50, D51, and D52), group 5 (composed of 15 national parks such as D06, D08, D17, and D47), group 6 (composed of seven national parks such as D11, D18, D23, and D25), group 7 (composed of D20, D30, D55, and D56), and group 8 (composed of 20 national parks such as D27, D28, and D53). The analysis found that the formation of these agglomerate subgroups is basically the same as the geographical distribution of national parks. The national parks in the same agglomerate subgroup have closer links, and the flow of resources, information, and other factors is more extensive.
Table 4.
The cohesive subgroups of tourism economic network.
Table 5.
Cohesive subgroups of the tourist economic network structure.
As apparent from Table 5 and Figure 3: (1) the agglomerated subgroups and small groups formed are basically the same with the geographical distribution of each city. The national parks in the same agglomerated subgroups are more closely related, the flow of resources, information and other elements is more frequent, and the cooperation and exchange are more extensive. For example, agglomerate subgroup 4 is located in Hubei Province, with obvious inter-provincial characteristics; (2) based on the study of related dialects, a certain correlation exists between the division of subgroups and local dialects. For example, the national parks within subgroups 7 and 8 basically belong to the same language. Subgroup 4 is located in Hubei Province, which shows that people are more inclined to local tourism consumption with their own common language background. The cultural customs and habits of these areas are interlinked with the region, and daily communication is more convenient. Therefore, the tourism economic cooperation between national parks with a common language and culture background are higher; (3) a general interaction exists among the agglomerating subgroups in the national parks. As the distance increases, the radiative force of the subgroup decreases gradually. Taking the agglomerated subgroup 4 composed of D48, D50, and D52 as an example, the maximum density value of its subgroup is 1.000, which has a strong radiative agglomeration of adjacent subgroup 3 (composed of D45, D49, and other national parks) with a density of 0.750. However, it has little influence on agglomerated subgroup 6 (composed of D18, D25, and other national parks) and subgroup 7 (composed of D20, D30, and other national parks).
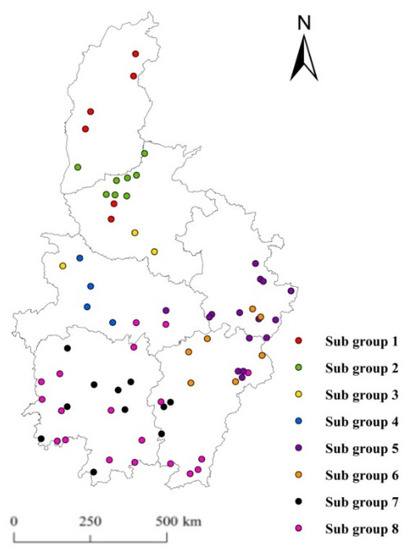
Figure 3.
The spatial visualization of tourism economic network in national parks.
5. Discussion and Implications
5.1. General Discussion
Previous literature has examined the tourism cooperation of tourist attractions in the flow of tourists and information [32,33,45,46,47]. However, little research has integrated the understanding of tourism economic flow between tourist attractions. To overcome this omission in the extant literature and acquire more insights into the tourism economic flow between national parks, this study not only measured the strength of tourism economic connection, but also examined the characteristics regarding the spatial network structure of tourism economy.
From the perspective of tourism economic connection strength, the geographical location, tourism market, and traffic accessibility have become important factors affecting the tourism economic connection strength between national parks, which is consistent with the research conclusions of Liu et al. [8]. D11 and D23 are close to the Yangtze River Delta, with a superior geographical location and huge tourism market. Travel agencies often design routes to include these national parks, which are very popular among tourists. However, there are few tourist economic links between D05 and D15 and other national parks. It may result from the remote location and low traffic access, which is in line with the distance–decay regularity [48].
With regards to the overall network structure, although the tourism authorities of the six central provinces have signed the “Six Central Province Tourism Cooperation Framework Agreement”, the national parks of the central region have shown the characteristics of loose and unstable spatial networks, which is congruent with the argument by Wang et al. [49] of the government’s excessive intervention in tourism economic cooperation, resulting in the market mechanism not playing a decisive role in tourism economic activities.
In terms of the structural characteristics of the individual network, D23, D58, and D48 show a strong centrality and are the core of the tourism economic cooperation network. These national parks have unique geographical locations and convenient transportation facilities. In addition, they have an inseparable relationship with the local government’s vigorous publicity and their own attractiveness, which is consistent with Peng’s [50] conclusion. Core national parks also promote the development of surrounding national parks and the coordinated development of tourism between regions, which is similar to the finding from the study conducted by Casanueva et al. [31].
With regards to the cohesive subgroup analysis, the spatial network structure of tourism economy among national parks in the central region is at the initial stage of block formation. The agglomerated subgroups and small groups formed are basically the same with the geographical distribution of each city. There is a general interaction among the agglomerating subgroups in the national parks. As the distance increases, the radiative force of the subgroup decreases gradually. To promote tourism economic integrations and connections, therefore, it is urgent to break the barrier of administration division among various plates. This finding broadly supports the evidence from Sun et al. [51].
5.2. Theoretical Implications
The current study makes several academic or theoretical implications. First, our research demonstrates the cooperation of national parks through tourism economic flows, which can more comprehensively and objectively reflect the situation. It is conducive to better integrate regional tourism resources and promote regional tourism economic development levels to reflect tourist attractions cooperation through tourism economic flow for the first time. Tourist attractions are based on the flow of tourists, and our research adds tourism economic flow to this.
Second, in terms of research methods, this study analyzes the network structural characteristics and nodes roles of national parks through tourism economic flows from the perspective of a “network” using the SNA method. Meanwhile, this research constructed the applicable and innovative method to measure the strength of tourism economic connection. The modified gravity model is used to obtain the strength of tourism economic connections between tourist attractions across the region. The number of tourists, tourism total income, and area of the scenic area is selected as the quality of tourism and the geographical space distance is used as the distance between the two scenic areas.
Third, there is extensive research regarding a single case study, but the study of cross-border tourism cooperation has been limited and merits further discussion. According to Milenković’s [52] study, the cross-border tourism areas have become a new focus of regional cooperation due to their huge development potential. By studying the network evolution process of cross-border regions, this research has made a contribution to the sustainable development of tourism economy.
5.3. Practical Implications
This study provides important practical implications to government officials, policymakers, and other stakeholders. Moreover, it provides a policy guidance for regional cooperation in Central China and provides a reference for other regions. First, managers are supposed to realize the importance of establishing coordination mechanisms among players in the destination (such as alliances). Furthermore, managers should establish and improve regional tourism cooperation mechanisms, and realize such cooperation mechanisms as joint development of tourist attractions, joint sharing of tourist information, and joint recommendation of tourist sources.
Second, the Central Region of China should give full play to the role of the core tourist attractions in the economic connection of tourism, as well as strengthen the economic connection and cooperation between the core regions and the edge regions. Therefore, it can improve the overall network efficiency of tourism economy. Lushan Mountain, Shaoshan Scenic Area, Wudang Mountain, and other national parks are in the core area, while Shennong Mountain, Damoushan Scenic Area, and other national parks are in the edge area. Managers should continue to play the role of tourism economic radiation of core tourist attractions and strengthen the transportation infrastructure.
Third, to break down the narrow local concepts and limits of administrative barriers and enhance tourism economic cooperation among national parks, it is necessary to make full use of the advantages of new media to further enhance the social influence of the tourism industry brand in the area [53,54]. Some new social-media should be established in order to accelerate the flow of tourism economic elements such as talents, technology, capital, and information.
6. Conclusions
We come to some interesting conclusions. First, the intensity of tourism economic cooperation between national parks in the Central Region of China is unbalanced in spatial distribution, which results from spatial distance, cultural distance, and social distance [55]. Second, the role of network nodes can be effectively judged by measuring the node-centrality indicators and structural hole indicators by conducting a node structure analysis [56]. The network-structure analysis is of great significance to the research of spatial network structural characteristics [57]. The empirical results indicate that the tourism economic connection network of each national park in the central region presents a multi-core model. D11, D23, D48, D58, and other national parks are all higher than other nodes in the core of the tourism economic cooperation network, which play a key role of “bridge” and “intermediary” in the transmission of regional tourism economic factors. However, D01, D02, D03, and other national parks are at the edge of the tourism economic contact network. Third, from the analysis of the aggregated subgroups, it can be seen that there are four subgroups in the network, including subgroups composed of national parks such as D48, D50, and D52. Agglomerating subgroups are the bridge between the individual and the network of national parks.
Despite several implications, our study has limitations that can be addressed in the future. First of all, the research in this paper reflects only a point in time. Through the horizontal study of time, it can better explain the dynamic evolution of tourism economic linkage and cooperation between regional scenic areas. Second, this study lacks the analysis of influencing factors on the structure of tourism economic contact network in the scenic areas. Future research can add influencing factor studies to more comprehensively display the characteristics of the structure of tourist economic connection networks.
Author Contributions
All authors had input into the conception and design of the research; K.W. proposed and designed the study; K.W., M.W., C.G. and Q.C. were accountable for data collecting and the interpretation of results; M.W. wrote the paper; M.V. was responsible for the further revision of this study. All authors have read and agreed to the published version of the manuscript.
Funding
The publication funds were provided by Dimitrie Cantemir University. This work was supported by the the National First-Class Discipline Construction Project of Geography in Hunan Province (No. 5010002).
Institutional Review Board Statement
Not applicable.
Informed Consent Statement
Not applicable.
Data Availability Statement
Not applicable.
Conflicts of Interest
The authors declare no conflict of interest.
References
- Jensen, Ø.; Li, Y.; Uysal, M. Visitors’ satisfaction at managed tourist attractions in Northern Norway: Do on-site factors matter? Tour. Manag. 2017, 63, 277–286. [Google Scholar] [CrossRef]
- Yeh, D.Y.; Cheng, C.H. Recommendation system for popular tourist attractions in Taiwan using Delphi panel and repertory grid techniques. Tour. Manag. 2015, 46, 164–176. [Google Scholar] [CrossRef]
- Mayer, M.; Müller, M.; Woltering, M.; Arnegger, J.; Job, H. The economic impact of tourism in six German national parks. Landsc. Urban Plan. 2010, 97, 73–82. [Google Scholar] [CrossRef]
- Wang, J.H.Z. National parks in China: Parks for people or for the nation? Land Use Policy 2019, 81, 825–833. [Google Scholar] [CrossRef]
- Wang, G.; Innes, J.L.; Wu, S.W.; Krzyzanowski, J.; Yin, Y.; Dai, S.; Zhang, X.; Liu, S. National park development in China: Conservation or commercialization? Ambio 2012, 41, 247–261. [Google Scholar] [CrossRef] [PubMed]
- Jesus, C.; Franco, M. Cooperation networks in tourism: A study of hotels and rural tourism establishments in an inland region of Portugal. J. Hosp. Tour. Res. 2016, 29, 165–175. [Google Scholar] [CrossRef]
- Luo, Q.; Zhong, D. Using social network analysis to explain communication characteristics of travel-related electronic word-of-mouth on social networking sites. Tour. Manag. 2015, 46, 274–282. [Google Scholar] [CrossRef]
- Liu, B.; Huang, S.S.; Fu, H. An application of network analysis on tourist attractions: The case of Xinjiang, China. Tour. Manag. 2017, 58, 132–141. [Google Scholar] [CrossRef]
- Chaabouni, S. China’s regional tourism efficiency: A two-stage double bootstrap data envelopment analysis. J. Destin. Mark. Manag. 2019, 11, 183–191. [Google Scholar] [CrossRef]
- Czernek-Marszałek, K. Social embeddedness and its benefits for cooperation in a tourism destination. J. Destin. Mark. Manag. 2020, 15, 100401. [Google Scholar] [CrossRef]
- Voda, M.; Montes, Y.S. Descending mountain routes future: The North Yungas and Fagaras Geosystem’s comparative study. Geographia Technica 2018, 13, 152–166. [Google Scholar] [CrossRef]
- Baggio, R. Collaboration and cooperation in a tourism destination: A network science approach. Curr. Issues Tour. 2011, 14, 183–189. [Google Scholar] [CrossRef]
- Gan, C.; Voda, M.; Wang, K. Spatial network structure of the tourism economy in urban agglomeration: A social network analysis. J. Hosp. Tour. Manag. 2021, 47, 124–133. [Google Scholar] [CrossRef]
- Huang, X.; Zhang, L.; Ding, Y. The Baidu Index: Uses in predicting tourism flows—A case study of the Forbidden City. Tour. Manag. 2017, 58, 301–306. [Google Scholar] [CrossRef]
- Pavlovich, K. The evolution and transformation of a tourism destination network: The Waitomo Caves, New Zealand. Tour. Manag. 2003, 24, 203–216. [Google Scholar] [CrossRef]
- Shih, H.Y. Network characteristics of drive tourism destinations: An application of network analysis in tourism. Tour. Manag. 2006, 27, 1029–1039. [Google Scholar] [CrossRef]
- Metulini, R.; Patuelli, R.; Griffith, D.A. A spatial-filtering zero-inflated approach to the estimation of the gravity model of trade. Econometrics 2018, 6, 9. [Google Scholar] [CrossRef]
- McLeod, M. Understanding knowledge flows within a tourism destination network. J. Hosp. Tour. Insights 2020, 3, 549–566. [Google Scholar] [CrossRef]
- Hartman, S.; Wielenga, B.; Heslinga, J.H. The future of tourism destination management: Building productive coalitions of actor networks for complex destination development. J. Tour. Futur. 2020, 6, 213–218. [Google Scholar] [CrossRef]
- Pulido-Fernández, J.I.; Merinero-Rodríguez, R. Destinations’ relational dynamic and tourism development. J. Destin. Mark. Manag. 2018, 7, 140–152. [Google Scholar] [CrossRef]
- Hwang, D.; Chi, S.H.; Lee, B. Collective Action That Influences Tourism: Social Structural Approach to Community Involvement. J. Hosp. Tour. Res. 2013, 40, 497–515. [Google Scholar] [CrossRef]
- Ying, T.; Norman, W.C. Personality Effects on the Social Network Structure of Boundary-Spanning Personnel in the Tourism Industry. J. Hosp. Tour. Res. 2017, 41, 515–538. [Google Scholar] [CrossRef]
- Aubke, F.; Wöber, K.; Scott, N.; Baggio, R. Knowledge sharing in revenue management teams: Antecedents and consequences of group cohesion. Int. J. Hosp. Manag. 2014, 41, 149–157. [Google Scholar] [CrossRef]
- García-Lillo, F.; Úbeda-García, M.; Marco-Lajara, B. The intellectual structure of research in hospitality management: A literature review using bibliometric methods of the journal International Journal of Hospitality Management. Int. J. Hosp. Manag. 2016, 52, 121–130. [Google Scholar] [CrossRef]
- Fan, W.; Li, G.; Law, R. Temporal Analysis of Tourism Research Collaboration Network. J. Hosp. Tour. Res. 2017, 41, 643–672. [Google Scholar] [CrossRef]
- Tu, J.; Zhang, D. Does tourism promote economic growth in Chinese ethnic minority areas? A nonlinear perspective. J. Destin. Mark. Manag. 2020, 18, 100473. [Google Scholar] [CrossRef]
- Hong, J.Y.; Jeon, J.Y. Exploring spatial relationships among soundscape variables in urban areas: A spatial statistical modelling approach. Landsc. Urban Plan. 2017, 157, 352–364. [Google Scholar] [CrossRef]
- Hajilo, M.; Masoom, M.G.; Motiee Langroudi, S.H. Spatial analysis of the distribution of small businesses in the eastern villages of Gilan province with emphasis on the tourism sector in mountainous regions. Sustainability 2017, 9, 2238. [Google Scholar] [CrossRef]
- Hu, X.; Yan, H.; Wang, D. A promotional construction approach for an urban three-dimensional compactness model-law-of-gravitation-based. Sustainability 2020, 12, 6777. [Google Scholar] [CrossRef]
- Tran, M.T.T.; Jeeva, A.S.; Pourabedin, Z. Social network analysis in tourism services distribution channels. Tour. Manag. Perspect. 2016, 18, 59–67. [Google Scholar] [CrossRef]
- Casanueva, C.; Gallego, Á.; García-Sánchez, M.R. Social network analysis in tourism. Curr. Issues Tour. 2016, 19, 1190–1209. [Google Scholar] [CrossRef]
- Kang, S.; Lee, G.; Kim, J. Identifying the spatial structure of the tourist attraction system in South Korea using GIS and network analysis: An application of anchor-point theory. J. Destin. Mark. Manag. 2018, 9, 358–370. [Google Scholar] [CrossRef]
- Chow, C.K.W.; Tsui, W.H.K. Cross-border tourism: Case study of inbound Russian visitor arrivals to China. Int. J. Tour. Res. 2019, 21, 693–711. [Google Scholar] [CrossRef]
- Makkonen, T. Cross-border shopping and tourism destination marketing: The case of Southern Jutland, Denmark. Tour. Manag. 2016, 16, 36–50. [Google Scholar] [CrossRef]
- Yang, Y. Understanding tourist attraction cooperation: An application of network analysis to the case of Shanghai, China. J. Destin. Mark. Manag. 2018, 8, 396–411. [Google Scholar] [CrossRef]
- Hernández, J.M.; Kirilenko, A.P.; Stepchenkova, S. Network approach to tourist segmentation via user generated content. Ann. Tour. Res. 2018, 73, 35–47. [Google Scholar] [CrossRef]
- Kirilenko, A.P.; Stepchenkova, S.O.; Hernandez, J.M. Comparative clustering of destination attractions for different origin markets with network and spatial analyses of online reviews. Tour. Manag. 2019, 72, 400–410. [Google Scholar] [CrossRef]
- Capriello, A.; Rotherham, I.D. Farm attractions, networks, and destination development: A case study of Sussex, England. Tour. Rev. 2008, 63, 59–71. [Google Scholar] [CrossRef]
- Hong, T.; Ma, T.; Huan, T.C.T.C. Network behavior as driving forces for tourism flows. J. Bus. Res. 2015, 68, 146–156. [Google Scholar] [CrossRef]
- Dredge, D. Policy networks and the local organisation of tourism. Tour. Manag. 2006, 27, 269–280. [Google Scholar] [CrossRef]
- Stienmetz, J.L.; Fesenmaier, D.R. Estimating value in Baltimore, Maryland: An attractions network analysis. Tour. Manag. 2015, 50, 238–252. [Google Scholar] [CrossRef]
- Hsu, F.M.; Lin, Y.T.; Ho, T.K. Design and implementation of an intelligent recommendation system for tourist attractions: The integration of EBM model, Bayesian network and Google Maps. Expert Syst. Appl. 2012, 39, 3257–3264. [Google Scholar] [CrossRef]
- Kozak, M.; Buhalis, D. Cross–border tourism destination marketing: Prerequisites and critical success factors. J. Destin. Mark. Manag. 2019, 14, 100392. [Google Scholar] [CrossRef]
- Bai, C.; Zhou, L.; Xia, M. Analysis of the spatial association network structure of China’s transportation carbon emissions and its driving factors. J. Environ. Manag. 2020, 253, 109765. [Google Scholar] [CrossRef]
- Song, H.; Xie, K.; Park, J. Impact of accommodation sharing on tourist attractions. Ann. Tour. Res. 2020, 80, 102820. [Google Scholar] [CrossRef]
- Liu, P.; Zhang, H.; Zhang, J. Spatial-temporal response patterns of tourist flow under impulse pre-trip information search: From online to arrival. Tour. Manag. 2019, 73, 105–114. [Google Scholar] [CrossRef]
- Makkonen, T.; Williams, A.M.; Weidenfeld, A. Cross-border knowledge transfer and innovation in the European neighbourhood: Tourism cooperation at the Finnish-Russian border. Tour. Manag. 2018, 68, 140–151. [Google Scholar] [CrossRef]
- Dejean, S. The role of distance and social networks in the geography of crowdfunding: Evidence from France. Reg. Stud. 2020, 54, 329–339. [Google Scholar] [CrossRef]
- Wang, D.; Niu, Y.; Qian, J. Evolution and optimization of China’s urban tourism spatial structure: A high speed rail perspective. Tour. Manag. 2018, 64, 218–232. [Google Scholar] [CrossRef]
- Peng, H.; Zhang, J.; Liu, Z.; Lu, L.; Yang, L. Network analysis of tourist flows: A cross-provincial boundary perspective. Tour. Geogr. 2016, 18, 561–586. [Google Scholar] [CrossRef]
- Sun, Q.; Tang, F.; Tang, Y. An economic tie network-structure analysis of urban agglomeration in the middle reaches of Changjiang River based on SNA. J. Geogr. Sci. 2015, 25, 739–755. [Google Scholar] [CrossRef]
- Milenković, M.M. Ecoregionalism—Factor Cross-Border Cooperation and Tourism Development. Procedia Soc. Behav. Sci. 2012, 44, 236–240. [Google Scholar] [CrossRef]
- Sharmin, F.; Sultan, M.T.; Badulescu, A.; Bac, D.P.; Li, B. Millennial tourists’ environmentally sustainable behavior towards a natural protected area: An integrative framework. Sustainability 2020, 12, 8545. [Google Scholar] [CrossRef]
- Sharmin, F.; Sultan, M.T.; Badulescu, D.; Badulescu, A.; Borma, A.; Li, B. Sustainable destination marketing ecosystem through smartphone-based social media: The consumers’ acceptance perspective. Sustainability 2021, 13, 2308. [Google Scholar] [CrossRef]
- Bianchi, P.; Cappelletti, G.M.; Mafrolla, E. Accessible tourism in natural park areas: A social network analysis to discard barriers and provide information for people with disabilities. Sustainability 2020, 12, 9915. [Google Scholar] [CrossRef]
- Casanueva, C.; Gallego, Á.; Sancho, M. Network resources and social capital in airline alliance portfolios. Tour. Manag. 2013, 36, 441–453. [Google Scholar] [CrossRef]
- Asero, V.; Gozzo, S.; Tomaselli, V. Building Tourism Networks through Tourist Mobility. J. Travel Res. 2016, 55, 751–763. [Google Scholar] [CrossRef]
Publisher’s Note: MDPI stays neutral with regard to jurisdictional claims in published maps and institutional affiliations. |
© 2021 by the authors. Licensee MDPI, Basel, Switzerland. This article is an open access article distributed under the terms and conditions of the Creative Commons Attribution (CC BY) license (https://creativecommons.org/licenses/by/4.0/).