Abstract
Carbon emission reductions and sustainable development have become hot issues in international conferences. As the most direct instrument for carbon emission reductions, the carbon tax has not been favored by policymakers because of its negative effect on the economy. To achieve low-carbon sustainable development, we use a computable general equilibrium (CGE) model to simulate carbon tax recycling under different energy transfer efficiency improvements to achieve triple dividends of carbon emission reductions and social welfare improvement. This paper contributes to the literature on recycling carbon tax for triple dividends in China. The simulation has three main findings: (i) the carbon tax revenue recycling toward reducing the resident income tax rate yields triple dividends without any energy transfer efficiency improvement; (ii) the losses of GDP and social welfare are exaggerated. Meanwhile, the carbon tax brings down carbon emissions and total carbon intensity of GDP with a mild impact on the Chinese economy; (iii) the improvement of energy transfer efficiency demonstrates the advantages of recycling carbon tax and is essential for achieving triple dividends. Thus, we propose the following policy recommendations: (i) the pilot carbon tax mechanism should be launched in high-carbon sectors (such as coal) and then implemented in other industries gradually; (ii) the government should strongly support the technological improvement of energy transfer efficiency in order to achieve sustainable development.
1. Introduction
Energy is the driving force for the rapid development of an industrial economy. However, massive energy consumption, especially fossil fuel burning, also triggers excessive carbon emissions, endangering the environment on which humans depend. It has become an indisputable fact that, previously, China’s rapid economic growth was at the expense of environmental quality. Among the many pollutants, greenhouse gas emissions have attracted much attention. Recently, with the improvement of China’s economy, the need for an excellent ecological environment has increased gradually. Meanwhile, the international community has also recognized the crucial role of China in global environmental governance, and to develop carbon control policies [1], carbon-based border tax adjustments [2], and other policies [3,4] to limit China’s carbon emissions. The domestic and foreign pressures have forced the Chinese economy to transform into a sustainable development model, in which social–economic systems and natural ecosystems coexist harmoniously [5,6]. To achieve green low-carbon and sustainable economic development, China has implemented environmental regulations successively, such as “the Cleaner Production Promotion Law of the People’s Republic of China”, “the Circular Economy Promotion Law of the People’s Republic of China”, and “the Environmental Protection Tax Law of the People’s Republic of China”. In 2015, China nationally decided to achieve the peak of carbon dioxide emissions around 2030 at the Conference of the Parties to the Paris Convention. At the General Debate of the 75th Session of the United Nations General Assembly of 2020, President Xi proposed that “China will increase nationally determined contributions, adopt more effective policies and measures, strive to reach the peak of carbon dioxide emissions by 2030, and achieve carbon neutrality by 2060”. China has made positive contributions to regional and global climate change measures with practical actions.
However, China is still the greatest emitter of carbon dioxide in the world (https://www.eia.gov/ (accessed on 20 March 2021). In addition, fossil energy consumption accounts for a relatively large proportion, which is not conducive to carbon emission reduction. In 2019, coal consumption as part of China’s total energy consumption accounted for 58%, followed by oil and other liquids at 20%, hydropower at 8%, natural gas at 8%, nuclear power at 2%, and other renewable energy at nearly 5%. Oil consumption growth accounted for approximately 66.7% of global oil consumption growth (https://www.bp.com/ (accessed on 20 March 2021)). To achieve the peak of carbon emission before 2030 and make a positive contribution to global climate change measures, China must adhere to a green and low-carbon sustainable development model. A carbon tax is levied on fossil fuels’ carbon content (mainly coal, petroleum gas) and is the most direct price tool to reduce carbon emissions. Levying a carbon tax will increase the price of energy factors. On one hand, it will reduce energy use and promote fossil fuel conversion to clean energy; on the other hand, it will encourage enterprises to develop green and low-carbon technologies (low consumption, low emissions, and high efficiency). However, rising energy prices have increased consumers’ purchase costs and the production costs of enterprises. These increased costs are not conducive to social welfare and economic growth. There is conflict among carbon emission reduction, economic growth, and social welfare improvement. In whether a carbon tax can produce triple dividends (economic growth, carbon reduction, social welfare improvement) and achieve sustainable development, the recycling methods of carbon tax revenue play a decisive role. There are two main carbon tax recovery methods: revenue-neutral and revenue-positive methods [7,8]. When the carbon tax is introduced in the revenue-neutral type, other taxes are canceled or reduced to maintain revenue neutrality. In the revenue-positive type, the government returns carbon tax revenue to households or enterprises to increase their income.
Recent studies have mainly focused on exploring double dividends (carbon reduction and economic growth) [9,10]. Nevertheless, social welfare is an important indicator reflecting the quality of life of residents, and it is necessary to consider it when exploring the policy effects of the carbon tax. Therefore, to achieve the sustainable development of low-carbon economic growth and social welfare improvement, our research constructs a computable general equilibrium model (CGE). Based on the revenue-neutral type, we simulate scenarios of reducing residential income tax, corporate income tax, and indirect tax, exploring carbon emission reduction options that achieve triple dividends. In addition, energy transfer efficiency improvement means that energy is more fully utilized, and the production of per unit GDP requires less energy input [11]. Energy transfer efficiency improvement is a cleaner and cost-effective way to promote triple dividends [12]. Therefore, we also explored the path to achieve triple dividends under different energy transfer efficiencies.
This paper’s structure is organized as follows: Section 2 is a literature review; Section 3 constructs the CGE model, the social accounting matrix (SAM) table used in this paper, and policy scenarios; Section 4 presents our simulation results and discussion. Finally, Section 5 summarizes the conclusion and policy implications.
2. Literature Review
Carbon emission governance is the key to achieving sustainable development. Reliable carbon emission measurement is a considerable prerequisite for implementing carbon emission reduction policies [13,14]. Identifying the source of pollutants is essential for adopting appropriate methods to reduce pollutant emissions [15,16]. Additionally, carbon emission governance is closely related to economic entities such as consumers, enterprises, and governments. Consumers promote low-carbon development by changing their consumption patterns, reducing the impact on the environment, such as purchasing green-labeled products [17] and sustainable products [18]. Companies introduce environmental management systems, high-performance materials, and sustainable consumption–production to promote the circular economy [19,20,21]. The government provides policy support for low-carbon development. It is common to consider two policy strategies of reducing carbon dioxide emissions, known as command–control regulation and market incentives. The market incentives are divided into the total amount control method and price control method. The emission trading scheme (ETS) represents the total control method, alleviating carbon emissions reduction’s adverse economic effect by the carbon trading market [22]. The carbon tax represents the pricing control method, which internalizes carbon emissions’ external costs, increasing the energy consumption cost directly. The above market incentive strategies are widely used in various countries and are hot topics related to the environmental economy in research [23]. Command–control regulation is less effective than the market incentives as it leads to an economic contraction [24]. Theoretically, the ETS mechanism is better than the carbon tax mechanism. Undoubtedly, an ETS is the most appropriate instrument for economic impacts and political feasibility in the Mexican power sector [25]. However, in terms of implementation and understanding, the carbon tax mechanism is more comfortable than the ETS mechanism in China [26]. Regarding the effects on the environment, energy, and economy, the carbon tax mechanism is more suitable for the Chinese market after considering various invisible costs of establishing a new carbon trading market [27]. Based on China’s national circumstances, development stage, sustainable development strategy, and previous studies [28,29,30,31], a carbon tax strategy is selected in our study. However, the levy of the carbon tax will increase commodity prices and decrease real wages, which are not conducive to economic growth and social welfare [32]. Therefore, to achieve triple dividends, the carbon tax policies play a significant constructive role.
The input–output and CGE models are major methods for policy simulation, widely used in environmental protection and economic development research. By employing the input–output model and nonlinear autoregressive distributed lag models, Sadik-Zada [33] addresses the production linkages and employment effects between the petroleum sector and the rest of the Azerbaijani economy, emphasizing the importance of the petroleum sector. This conclusion also applies to Kazakhstan [34]. However, the input–output model cannot reflect changes of supply–demand and substitution effects caused by price variations because it is a linear equation system. Additionally, the relationship between various departments is a fixed proportional relationship. Moreover, it cannot reflect the complicated fund accounts [35]. The CGE model makes up for this defect. Due to its nonlinear function elasticity, when we appropriately adjust endogenous and exogenous variables, the new equilibrium state of exogenous price changes can be simulated [36]. In our research, the option of recycling carbon tax revenue is complicated, so the CGE model is more suitable.
Empirical studies explore the effect of different tax revenue recycling by using the CGE model in many countries. Maxim et al. [37] used a static CGE model, based on the Australian economy, to simulate different green tax reform policies for triple dividends, indicating that reduction of goods and services tax has the optimal triple dividends. Kirchner et al. [38] found that most recycling schemes could achieve double dividends using a macroeconomic model (DYNK) in Austria. Gupta et al. [39] indicated that a reasonable carbon tax rate effectively reduced CO2 emissions from road passenger transport in India. Meanwhile, the carbon tax revenue could optimize this effect. Scholars have done a few studies on carbon tax recovery for China. Zhang et al. [40] proved that double dividends of carbon tax recovery exist in China by recursive dynamic CGE. Liu et al. [10] used the CASIPM-GE model, analyzing the economic impact of a carbon tax and different carbon tax revenue recycling types in China. Simulation results show that a production tax deduction is more effective than a consumption tax deduction, emphasizing the importance of a carbon tax recovery plan. Sun et al. [41] showed that the optimized carbon taxation scheme based on the CGE model could optimize the green energy structure with lower carbon intensity. Zhang et al. [42] developed the new multi-country CGE model, pointing out that mixed policies are more conducive to China’s carbon tax performance. In addition, from a meta-regression analysis perspective, researchers have analyzed the existing literature on carbon tax recovery. Freire [43] analyzed 69 different simulations from 40 studies, pointing out that 55% of simulations achieved double dividends by a statistical and a meta-regression analysis. Alvarez [44] also hinted at the importance of designing a socially desired environmental policy.
These studies remind us that suitable carbon tax recovery policies can achieve double dividends. However, there is little literature on China’s triple dividends. Furthermore, based on carbon tax recovery, fewer studies have explored the triple dividend realization path. Based on the green economic recovery situation, our paper contributes to the previous study in three aspects: firstly, we analyze the carbon tax effect more comprehensively by introducing social welfare indicators into the carbon tax policy goals. Secondly, we explore the possibility of triple dividends by reducing the resident income tax, the corporate income tax, and indirect tax, while imposing a carbon tax. Thirdly, we simulate changes in economic growth, carbon emission intensity, and social welfare under different energy transfer efficiencies, exploring the path to achieve triple dividends.
3. CGE model Structure and Data
3.1. CGE Model Structure
For evaluating the economic, environmental, and social welfare effects of the carbon tax and recycling carbon tax revenue, a single-country, multi-sectoral, neoclassical-type, comparative static CGE model is constructed. We have expanded the standard CGE model by introducing the carbon emissions, carbon tax module, and social welfare module. The model widely used in previous studies describes the national economic system’s framework [45,46,47] and can be summarized in three parts: supply, demand, and supply–demand relation. In the supply part, the model mainly describes how producers follow the principle of minimizing production costs to produce. In the demand part, the model describes the principle of maximizing the utility of consumers’ behavior. Finally, the supply and demand relation describes the multimarket equilibrium through market connection.
Our model mainly includes the production module, trade module, consumption module, equilibrium module, social welfare module, carbon emissions, carbon tax module, and closure. In the production module, the top nesting constant elasticity of substitution (CES) function describes the substitution structure of the capital–energy–labor composite and the non-energy intermediate inputs. In addition to the use of non-fossil energy intermediate inputs in the Leontief function, other nested functions such as the energy–capital–labor composite and the energy composite all use CES functions (Figure 1). In the trade module, the constant elasticity of transformation (CET) function is used to allocate domestically produced products for export and domestic sales. The Armington function is used to capture substitution possibilities between domestically produced and imported goods. Both the CET function and the Armington function follow the imperfect substitution.
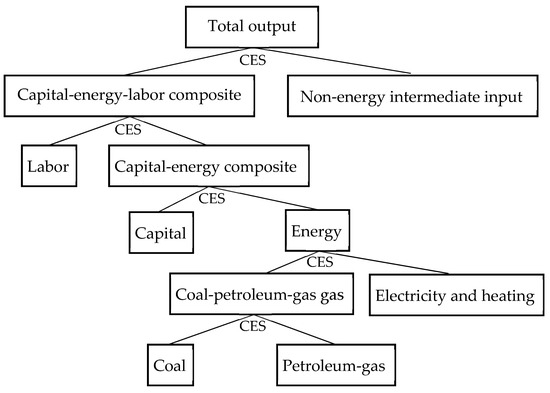
Figure 1.
Production module architecture diagram.
The consumption module mainly includes the resident module, enterprise module, and government module. The resident module maximizes utility subject to income and price, and the consumption function is modeled through the linear expenditure system (LES). Enterprises follow cost minimization, pay taxes to the government, and transfer payments to residents. Furthermore, government revenue comes from the resident income tax, the corporate income tax, the corporate indirect tax, the carbon tax, and trade tariffs. Government expenditure is on the consumption of goods and services, which transfers to households and enterprises. The equilibrium module mainly includes the product market equilibrium, factor market equilibrium, savings–investment equilibrium, and international market equilibrium.
In the social welfare module, we introduce the Hicks’ equivalent variation (EV) to judge residents’ social welfare level when the policy shocks are implemented [48,49]. Under the price keeps the initial price unchanged, measures how much the variation in income is equivalent to the variation in the effect brought about by the price change. Referring to previous studies [50,51], measures variation in social welfare in our research, defined as follows:
where is the Hicks’ equivalent variation in judging residents’ social welfare; refers to the consumer price of the i-th commodity before the policy shocks; indicates the residents’ utility after the policy shocks; indicates the residents’ utility before the policy shocks; indicates the expenditure function after the policy shocks; indicates the expenditure function before the policy shocks; is the residents’ demand for commodity i after the policy shocks; is the residents’ demand vector for commodity i before the policy shocks. As variables are obtained from the simulation, can be calculated. The change rate of social welfare can be calculated by: .
In the carbon emission and carbon tax module, CO2 emissions, which are calculated by multiplying relevant CO2 emission coefficients by the sector’s fossil energy consumption, are derived from fossil energy burning. The total CO2 emissions generated in the economy include the cumulative emissions over the intermediate input sectors and the cumulative emissions across coal and petroleum gas sources in the final demand. Carbon taxes are levied on CO2 emissions emitted by fossil energy consumption. In this study, since energy consumption in the final demand sector accounts for a small proportion of total demand and is difficult to implement, we assumed that carbon tax is not levied on final demand and only taxed on the intermediate input. A sector’s carbon tax can be achieved from the carbon tax rate multiplied by CO2 emissions, as shown in Equation (2). Carbon tax on certain fossil energy types can be obtained by multiplying the carbon tax rate by the total CO2 emissions of that fossil energy, as shown in Equation (3). Summing across sectors or fossil energies, we get the total carbon tax revenue, which is recycled to reduce other taxes. The carbon tax levied on certain fossil energy types is divided by the domestic demand value of that fossil energy. We can get the ad valorem tax rate of certain fossil energy types, as shown in Equation (4). A carbon tax is translated into a price increase for each fossil energy type, with the price increasing to . This will directly affect the cost of using fossil energy inputs in the production function. In addition, because coal and petroleum gas are important intermediate inputs, the rise in their prices will inevitably raise other commodities’ prices indirectly, especially electricity and heating.
where is the amount of carbon tax levied by sector i; indicates a carbon tax of fossil energy j, levied per ton of carbon dioxide emissions; refers to the consumption of fossil energy j in sector i; refers to the fixed CO2 emission coefficients of unit fossil energy j; is the amount of carbon tax levied on the intermediate input of fossil energy j; indicates the ad valorem tax rate of fossil energy j; is the price of domestic demand for fossil energy j; refers to domestic demand for fossil energy j; j refers to coal and petroleum gas.
Lastly, our model follows a neoclassical macroscopic closure. According to neoclassical theory, both factor prices and commodity prices are determined endogenously by the model. Labor and capital factors can be fully adjusted to achieve market clearing when impacted by economic policies.
3.2. Data
To construct the SAM table for our model, we use China’s 2017 input–output table. In this paper, 149 original production sectors are classified into agriculture, light industry, heavy industry, building and construction, transportation industry, services, coal industry, petroleum and gas industry, electric and heating. In building the SAM table, the data on tariffs, resident income taxes, indirect taxes, and direct taxes are derived from the China Financial Yearbook (2018) (https://www.epsnet.com.cn/ (accessed on 20 March 2021)). The data on capital and balance of payments transfer are derived from the China Statistical Yearbook (2018) (http://www.stats.gov.cn/tjsj/ndsj/ (accessed on 20 March 2021). The SAM table calculates the share parameters used in the model. The elasticities of demand and supply equations used in the model are adopted from Cui et al. (2020) and Mu et al. (2018) [52,53]. The CET function and the Armington function’s elasticities are adopted from Bao et al. (2013) [2]. The fixed CO2 coefficient of certain energy types is measured by the ratio of CO2 emissions to the actual consumption. Further, the related data come from International Energy Statistics (https://www.eia.gov/ (accessed on 20 March 2021).
3.3. Definition of Scenarios
3.3.1. Business-as-Usual (BAU) Scenario
The BAU scenario is the reference scenario for the following policy scenarios. Under the absence of the policy scenarios (carbon tax collection and tax revenue recycling), the baseline scenario measures the factors. Based on the research of Ojha et al. (2020) [54], total factor productivity and energy transfer efficiency parameters are assumed to be 1 per annum in the baseline scenario (https://www.eia.gov/ (accessed on 20 March 2021)).
3.3.2. Policy Scenarios
By International Energy Statistics, we obtained China’s annual carbon dioxide emissions from 2005 to 2018 and calculated the annual growth rate of carbon dioxide emissions since 2005 (Figure 2). Therefore, we find that the arithmetic means of the CO2 emission growth rate is 4.4%, and the growth rate of CO2 emissions has a recent upward trend. According to Enhanced Actions on Climate Change: China’s Intended Nationally Determined Contributions, China has nationally determined its actions to peaking carbon dioxide emissions around 2030 and making an effort to peak early. In accordance with the upward trend and the Convention, we set a 4.4% carbon mitigation goal as a carbon shock in this paper. We are concerned about the impact of the carbon tax and carbon tax revenue recovery on carbon emission intensity, social welfare, and economic growth. We also explore changes in carbon tax rates under different simulation scenarios. Additionally, to explore the effect of energy efficiency conversion, three energy transfer efficiency levels, low (1%), medium (5%), high (10%), for nine sectors are tested under all of the following policy scenarios.
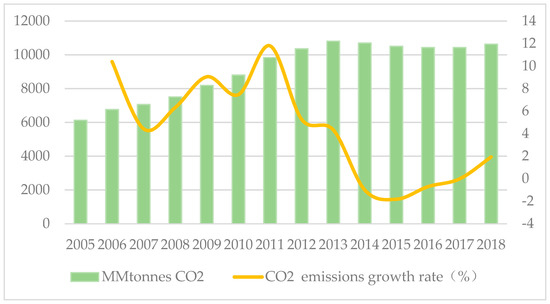
Figure 2.
In 2005–2018, annual carbon dioxide emissions and change rate.
(1) Policy scenario 1 (CT levy): In this scenario, the carbon tax is levied only on intermediate energy input in the production sector, while no carbon tax will be levied on the final demand sector. Meanwhile, carbon tax will not recycle.
(2) Policy scenario 2 (Inv-RIT): The carbon tax revenue is recycled toward reducing the resident income tax rate in different sectors with the revenue-neutral method. In this scenario, government revenue remains unchanged, and the resident income tax rate becomes an endogenous variable.
(3) Policy scenario 3 (Inv-CIT): The carbon tax revenue is recycled toward reducing the corporate income tax rate in different sectors with the revenue-neutral method. At the same time, government transfer payments and coefficients of consumption and savings remain unchanged. In this scenario, government revenue remains unchanged, and the corporate income tax rate becomes an endogenous variable.
(4) Policy scenario 4 (Inv-CIDT): The carbon tax revenue is recycled toward reducing the corporate indirect tax rate with the same allocation proportions in different sectors. The other assumptions are the same as in policy scenario 3.
4. Results and Discussion
The carbon tax rates in all scenarios were obtained by running the model, that is, by making the carbon tax rates endogenous for 4.4% carbon reductions in total CO2 emissions relative to the baseline. After calculating the carbon tax of certain fossil energy types, a carbon tax rate is converted into an ad valorem tax rate.
The carbon tax is levied on the carbon content of the respective fossil fuels. Thus, the higher the fossil fuel’s carbon content, the greater the price increase. The price of coal increases is larger than that of petroleum gas because coal has a relatively high carbon content. On the one hand, the increase in fossil energy prices causes an overall reduction in energy consumption. On the other hand, due to fossil energy price increases, producers respond by switching from coal and petroleum gas to clean energies as an energy source. To sum up, carbon emissions are reduced. In the static CGE model, since energy transfer efficiency is constant and low, the reducing effect dominates over the switching effect. Therefore, carbon taxes tend to result in GDP losses. However, the recycling of carbon tax revenue to reduce the distorted tax rate and energy transfer efficiency improvements will boost the economy and achieve sustainable development.
4.1. Results and Discussion: Policy Scenario 1 (CT Levy)
Scenario 1 is an independent policy of carbon tax without any revenue recycling. In the CT levy, both the GDP and social welfare are lower than in the BAU scenario (Table 1). When a 4.4% carbon mitigation goal is set, the total CO2 intensity of GDP decreased by 4.3909%. The decline in total CO2 intensity of GDP occurs due to the reducing effect and the switching effect caused by the increased energy price. Without energy transfer efficiency improvement, the carbon tax rate obtained by running the model is RMB 18.8221 per ton of CO2. While the total emissions decline by 4.4%, GDP declines by only 0.0096%. The social welfare declines by 0.1912%. Although, briefly speaking, neither triple dividends nor double dividends have been realized in the CT levy, the decline of GDP and social welfare is smaller than the decline of carbon emissions. That is to say, the GDP and social welfare losses caused by carbon taxes have been exaggerated. In addition, the improvement of energy transfer efficiency will effectively improve the situation. In a CT levy with low (1%) energy transfer efficiency, although social welfare is below the benchmark, GDP increases by 0.0038%. Environmental dividends and economic growth will be realized. The triple dividends will be realized in a CT levy with medium (5%) and high (10%) energy transfer efficiency.

Table 1.
Changes in key variables in policy scenario 1: CT levy relative to BAU.
4.2. Results and Discussion: Policy Scenario 2 (Inv-RIT)
Scenario 2 describes the recovery of carbon tax revenue to reduce the resident income tax rate under different energy transfer efficiencies. In Inv-RIT, the GDP increases by 0.0106% and the social welfare increases by 0.343% relative to the BAU scenario (Table 2). This is mainly because the carbon tax revenue is recycled toward reducing the resident income tax rate, reducing the burden on residents and increasing the level of residents’ consumption. The total CO2 intensity of GDP is lower by 4.4101%. Briefly, triple dividends (carbon reduction, economic growth, and social welfare improvement) have been realized without improving energy transfer efficiency. Additionally, the carbon tax is RMB 19.018 per ton of CO2. With the improvement of energy transfer efficiency, the total CO2 intensity of GDP and carbon tax gradually decrease, while the GDP and social welfare increase. In Inv-RIT with high (10%) energy transfer efficiency, the GDP increases by 0.1303%, and the social welfare increases by 1.3939%. The total CO2 intensity of GDP decreases by 4.5244%, and the carbon tax is RMB 17.4029 per ton of CO2. Generally, triple dividends are strengthened when energy transfer efficiency improves.
Table 2.
Changes in key variables in policy scenario 2: Inv-RIT relative to BAU.
4.3. Results and Discussion: Policy Scenario 3 (Inv-CIT)
Scenario 3 simulates changes in the main variables under carbon tax revenue recycling to reduce the corporate income tax rate (Table 3). Without energy transfer efficiency improvements, the carbon tax revenue recycling toward the corporate income tax rate has not improved adverse effects. The GDP goes down by 0.0042%. Social welfare decreases by 0.2378%, much lower than scenario 1. This is mainly because reducing the corporate income tax rate has not alleviated the carbon tax impact on production links, and then the price of capital falls. The total CO2 intensity of GDP is lower by 4.396% relative to the BAU scenario, and the carbon tax rate is RMB 19.5756 per ton of CO2. Thus, we find that there are neither double dividends nor triple dividends in Inv-CIT. However, as energy transfer efficiency improves, double dividends are achieved in Inv-CIT with low (1%) energy transfer efficiency. The triple dividends are reached with medium (5%) and high (10%) energy transfer efficiency.
Table 3.
Changes in key variables in policy scenario 2: Inv-CIT relative to BAU.
4.4. Results and Discussion: Policy Scenario 4 (Inv-CIDT)
Our last simulation explores the carbon tax recycling’s dividend effect on reducing direct corporate taxes (Table 4). Due to the reduction of indirect tax rates, capital income has declined. Therefore, the GDP goes down by 0.2701%. Indirect taxes only occur in the distribution of domestic products. Enterprises transfer the tax burden to consumers and then affect the demand and prices of domestically produced products. Residents’ capital income and government transfer payments to residents have both declined. Therefore, social welfare decreases by 0.0472%. The total CO2 intensity of GDP is lower by 4.1411%, and the carbon tax rate is RMB 21.3451 per ton of CO2 in Inv-CIDT. In general, there are no double dividends. With the improvement of energy transfer efficiency, social welfare has improved. Although GDP has improved, it is still a negative growth. Under the improvement of energy transfer efficiency, policy scenario 4 will accomplish double dividends but cannot achieve triple dividends.
Table 4.
Changes in key variables in policy scenario 2: Inv-CIDT relative to BAU.
4.5. Overview of Results Across the Policy Scenarios
Effects on environment-related indicators reveal the commonalities and differences in policy scenarios (Table 5 and Appendix A). Without energy transfer efficiency, only the Inv-RIT scenario can accomplish triple dividends. The total CO2 intensity of GDP declines in four policy scenarios relative to the BAU. The other three policy scenarios all bring down GDP and social welfare by different amounts. Whether there is a carbon tax recovery or not, a carbon tax levy will increase energy prices and decrease consumption. In the CT levy, the carbon tax rate is RMB 18.8221 per ton. The coal ad valorem tax is 6.6154% for a higher carbon content, which is higher than that of petroleum gas at 1.7%. Correspondingly, coal price and petroleum gas price increases by 1.5945% and 0.3743%. The consumption of coal and petroleum gas declines by 5.074% and 1.7425%, respectively. In addition, coal is the primary intermediate input for electricity and heating in China. Therefore, the price of electricity and heating rises 1.9135%. The consumption of electricity and heating decreases by 2.5256%. A carbon tax is imposed, and government revenue increases, so investment increases by 0.0403%. The government’s transfer payments to residents also increases, so residents’ income increases by 0.0399%. The carbon tax increases the price of goods, so the ratio of residents’ consumption to GDP falls by 0.1817%. The above conditions will be alleviated with the improvement of energy transfer efficiency.
Table 5.
Changes in macroeconomic variables in policy scenarios without energy transfer efficiency improvement relative to BAU.
Using GDP, social welfare, the total CO2 intensity, and carbon tax rate as the core differentiators, we compare policy scenarios with different energy transfer efficiencies (Figure 3, Figure 4, Figure 5 and Figure 6). Firstly, four policy scenarios show a lower total CO2 intensity of GDP than BAU under a 4.4% carbon mitigation. The total CO2 intensity of GDP decreases as energy transfer efficiency increases. Secondly, energy transfer efficiency improvement will alleviate the carbon tax’s adverse effects on GDP and social welfare. Without any energy transfer efficiency improvement (0%), only policy scenario 2 achieves triple dividends. When energy transfer efficiency increases by 1%, the GDP relative to BAU is positive in the CT levy and Inv-CIT scenarios. Social welfare is positive in the Inv-CIDT scenario. They all achieve double dividends. When energy transfer efficiency increases by 5%, the CT levy and Inv-CIT scenario reach triple dividends. Additionally, the carbon tax rate declines as energy transfer efficiency improves. Therefore, the improvement of energy transfer efficiency is essential to achieve triple dividends. Lastly, policy scenario 2 is the best choice to attain triple dividends and sustainability development from policy simulation effects. Energy transfer efficiency improvements will strengthen the triple dividends of policy scenario 2.
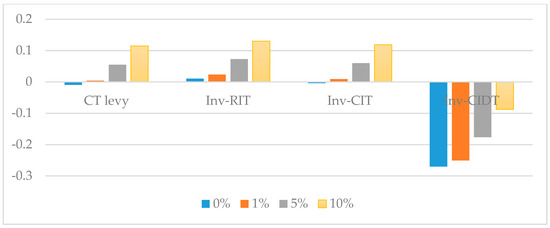
Figure 3.
Percent change in GDP relative to BAU with different energy transfer efficiency improvements.
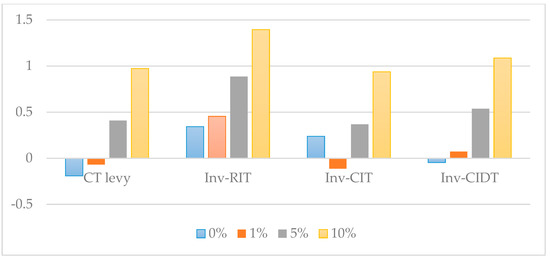
Figure 4.
Change in social welfare relative to BAU with different energy transfer efficiency improvements.
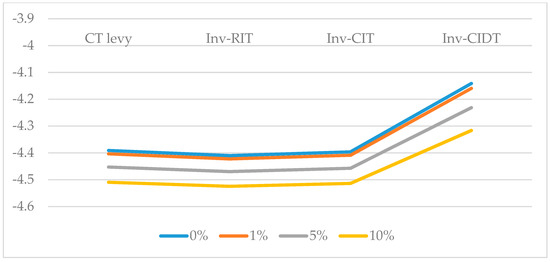
Figure 5.
Percent change in total CO2 intensity of GDP relative to BAU with different energy transfer efficiency improvements.
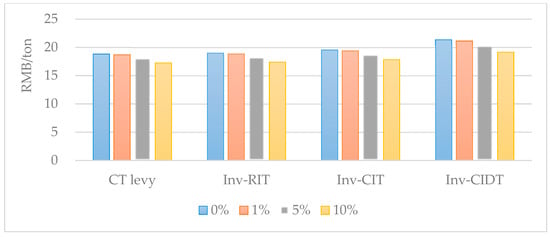
Figure 6.
Carbon tax rate with different energy transfer efficiency improvements.
5. Conclusions and Policy Implications
Carbon emissions have become a significant issue in the international community. Meanwhile, many countries, China included, have made commitments in many climate negotiations. As the most direct price tool for carbon emission governance, the carbon tax has not been favored by policymakers in emerging economies because of its adverse effects on the economy and social welfare. The recycling method of a carbon tax is significant in balancing the economy and the environment to achieve sustainable development. However, there is less literature on accomplishing triple dividends in China through a combination of carbon tax recovery and energy efficiency improvement. This paper set up four policy scenarios, providing clarity about the tradeoffs between economic growth, carbon reduction, and social welfare improvement. Our research provides an essential reference for China’s sustainable development. The three key lessons learned from our scenario simulations give us a clear understanding of policy choices.
Firstly, without improving energy transfer efficiency, levying a carbon tax alone is not conducive to economic growth and social welfare. However, an effective carbon tax recovery method can achieve triple dividends and achieve sustainable development. Policy scenario 2, which is to recycle the carbon tax toward reducing residents’ income tax, is the method to attain triple dividends. From a macroeconomic perspective, triple dividend realization promotes sustainable economic development, so policymakers should choose policy scenario 2.
Secondly, concerns about the loss of GDP and social welfare caused by the carbon tax are exaggerated. Without carbon tax recovery, GDP dropped by 0.0096% and social welfare dropped by 0.1912%, far less than the 4.4% reduction in carbon emissions. When the carbon tax revenue was used toward reducing the corporate indirect tax, the GDP declined by 0.2701%. Additionally, the social welfare declined by 0.0472%. To sum up, policy scenarios show that it is possible to significantly bring down total emissions and the total CO2 intensity of GDP while bearing a minor loss in GDP and social welfare.
The third lesson is that energy transfer efficiency improvement, which fully demonstrates the advantages of recycling carbon tax, is critical to achieving triple dividends. It reduces the carbon tax and alleviates the adverse effect of rising energy prices on energy consumption. In other words, with the improvement of energy transfer efficiency, the fuel-switching effect is gradually strengthened, exceeding the fuel-reducing effect of a carbon tax, further boosting the economy.
Thus, we propose the following policy recommendations to achieve triple dividends and promote sustainable development. Firstly, through this paper’s analysis, we find that a carbon tax’s adverse effects on economic growth and social welfare improvement are exaggerated. Recycling carbon tax revenues to reduce resident income tax can achieve triple dividends and promote sustainable development. Therefore, the government should pay attention to a carbon tax’s important role in carbon emission reduction. The carbon emission inventory could be used to establish a pilot carbon tax mechanism for industries with high carbon emission intensity and prominent air pollution issues (such as coal), and a carbon tax mechanism could be gradually implemented in other industries. Additionally, fossil fuels account for a relatively large proportion of China’s energy structure. The carbon tax mechanism will force changes in the energy consumption structure. China has adopted relevant policies, such as “the Circular Economy Promotion Law of the People’s Republic of China”, “the Cleaner Production Promotion Law of the People’s Republic of China”, and “the Environmental Protection Tax Law of the People’s Republic of China”. These laws have made a significant contribution to promoting green and sustainable development. However, there is still a lack of regulations aimed at carbon emission control. The Chinese government should formulate corresponding supporting policies to ensure the carbon tax pilot mechanism’s orderly implementation.
Secondly, the improvement of energy transfer efficiency is an important way to realize triple dividends. Economic growth and social welfare are found to improve as energy transfer efficiency reduces the adverse effect caused by the carbon tax. The improvement of energy transfer efficiency should be emphasized when the carbon tax is imposed. In policy scenarios 1–4, the carbon tax rates decrease as energy transfer efficiency improves. This mechanism will also reduce manufacturers’ production costs and promote the advancement of energy transfer technology. Therefore, the Chinese government should pay attention to energy transfer technology investment when imposing a carbon tax. Thirdly, we will implement special financial support policies for green and low-carbon development from the policy support’s perspective and set up carbon emission reduction tools. Simultaneously, a large-scale greening of the country will be carried out to enhance the ecosystem’s carbon sink capacity.
Our model can be applied to analyze other policy recovery or pollution rights trading and other emerging markets. Of course, our research still has limitations. A limitation is that we used a static CGE model, which was thus unable to explore the accretions in capital stocks resulting from the intertemporal investments. The static model cannot simulate the specific peak time of CO2 emissions. In a future study, we will use the dynamic CGE model to simulate the national- and industry-level carbon peak time.
Author Contributions
W.L. contributed to the design of the policy scenarios and provided advice on the discussion and policy implications. T.L. set the model, ran the model results, wrote most of the manuscript, and edited the paper. Y.L. constructed the SAM table based on the 2017 input–output table, collecting and analyzing the survey data. M.L. is responsible for proofreading and revising the text and charts of the article. All authors have read and agreed to the published version of the manuscript.
Funding
This research was funded by the Key Research Base project for Humanities and Social Sciences of the Ministry of Education of China (16JJD790015).
Institutional Review Board Statement
Not applicable.
Informed Consent Statement
Not applicable.
Data Availability Statement
The raw/processed data required to reproduce these findings cannot be shared at this time as the data also forms part of an ongoing study.
Conflicts of Interest
The authors declare no conflict of interest.
Appendix A
Table A1.
Changes in macroeconomic variables in policy scenario with low (1%) energy transfer efficiency improvement relative to BAU.
Table A1.
Changes in macroeconomic variables in policy scenario with low (1%) energy transfer efficiency improvement relative to BAU.
| Variables | CT Levy | Inv-RIT | Inv-CIT | Inv-CIDT |
|---|---|---|---|---|
| Real GDP (%) | 0.0693 | 0.0675 | 0.0755 | 0.0844 |
| GDP (%) | 0.0038 | 0.0235 | 0.009 | −0.2508 |
| Social welfare (%) | −0.0682 | 0.4546 | −0.1138 | 0.0727 |
| Total CO2 intensity of GDP (%) | −4.4036 | −4.4224 | −4.4087 | −4.1596 |
| Carbon tax (RMB/ton) | 18.6817 | 18.8729 | 19.4162 | 21.1394 |
| Ad valorem rate of coal (%) | 6.5898 | 6.655 | 6.8451 | 7.4773 |
| Ad valorem rate of petroleum gas (%) | 1.6904 | 1.7074 | 1.7567 | 1.9221 |
| Price of coal (%) | 1.2276 | 1.2633 | 1.2849 | 0.9505 |
| Price of petroleum gas (%) | 0.1899 | 0.209 | 0.2016 | −0.295 |
| Price of electricity and heating (%) | 1.1032 | 1.1391 | 1.1734 | 0.9809 |
| Consumption of coal (%) | −5.105 | −5.1063 | −5.1387 | −5.1918 |
| Consumption of petroleum gas (%) | −1.6206 | −1.6154 | −1.4878 | −1.2784 |
| Consumption of electricity and heating (%) | −2.369 | −2.3284 | −2.3435 | −2.2344 |
| Total investment (%) | 0.0723 | 0.003 | 0.5059 | 0.0039 |
| Residents’ income (%) | 0.0649 | 0.0592 | 0.0247 | −0.0002 |
| Residents’ consumption/GDP ratio (%) | −0.072 | 0.431 | −0.1229 | 0.3243 |
Table A2.
Changes in macroeconomic variables in policy scenario with medium (5%) energy transfer efficiency improvement relative to BAU.
Table A2.
Changes in macroeconomic variables in policy scenario with medium (5%) energy transfer efficiency improvement relative to BAU.
| Variables | CT Levy | Inv-RIT | Inv-CIT | Inv-CIDT |
|---|---|---|---|---|
| Real GDP (%) | 0.6033 | 0.6018 | 0.6097 | 0.6176 |
| GDP (%) | 0.055 | 0.0729 | 0.0599 | −0.1761 |
| Social welfare (%) | 0.4086 | 0.8858 | 0.3671 | 0.5375 |
| Total CO2 intensity of GDP (%) | −4.4526 | −4.4697 | −4.4572 | −4.2314 |
| Carbon tax (RMB/ton) | 18.0797 | 18.2524 | 18.7396 | 20.2821 |
| Ad valorem rate of coal (%) | 6.4677 | 6.5274 | 6.7003 | 7.2737 |
| Ad valorem rate of petroleum gas (%) | 1.6476 | 1.6631 | 1.7076 | 1.8565 |
| Price of coal (%) | −0.184 | −0.152 | −0.1329 | −0.4332 |
| Price of petroleum gas (%) | −0.5211 | −0.5038 | −0.5108 | −0.9586 |
| Price of electricity and heating (%) | −1.9612 | −1.9296 | −1.9 | −2.0703 |
| Consumption of coal (%) | −5.2215 | −5.2227 | −5.2522 | −5.3008 |
| Consumption of petroleum gas (%) | −1.1612 | −1.1563 | −1.0399 | −0.8485 |
| Consumption of electricity and heating (%) | −1.7643 | −1.7265 | −1.7409 | −1.6409 |
| Total investment (%) | 0.1956 | 0.1325 | 0.5896 | 0.1333 |
| Residents’ income (%) | 0.161 | 0.1559 | 0.1246 | 0.102 |
| Residents’ consumption/GDP ratio (%) | 0.3534 | 0.8123 | 0.3071 | 0.7148 |
Table A3.
Changes in macroeconomic variables in policy scenario with high (1%) energy transfer efficiency improvement relative to BAU.
Table A3.
Changes in macroeconomic variables in policy scenario with high (1%) energy transfer efficiency improvement relative to BAU.
| Variables | CT Levy | Inv-RIT | Inv-CIT | Inv-CIDT |
|---|---|---|---|---|
| Real GDP (%) | 1.2349 | 1.2338 | 1.2413 | 1.248 |
| GDP (%) | 0.1146 | 0.1303 | 0.1189 | −0.0875 |
| Social welfare (%) | 0.9738 | 1.3939 | 0.9373 | 1.0876 |
| Total CO2 intensity of GDP (%) | −4.5094 | −4.5244 | −4.5136 | −4.3163 |
| Carbon tax (RMB/ton) | 17.2529 | 17.4029 | 17.8228 | 19.1498 |
| Ad valorem rate of coal (%) | 6.2755 | 6.3283 | 6.48 | 6.9809 |
| Ad valorem rate of petroleum gas (%) | 1.5856 | 1.5991 | 1.6378 | 1.7667 |
| Price of coal (%) | −1.8323 | −1.8048 | −1.7886 | −2.0479 |
| Price of petroleum gas (%) | −1.3545 | −1.3394 | −1.3457 | −1.7344 |
| Price of electricity and heating (%) | −5.4355 | −5.4088 | −5.3846 | −5.5291 |
| Consumption of coal (%) | −5.3524 | −5.3535 | −5.3795 | −5.4222 |
| Consumption of petroleum gas (%) | −0.6449 | −0.6405 | −0.5381 | −0.3693 |
| Consumption of electricity and heating (%) | −1.0539 | −1.0198 | −1.0332 | −0.9446 |
| Total investment (%) | 0.3396 | 0.2844 | 0.6848 | 0.285 |
| Residents’ income (%) | 0.273 | 0.2685 | 0.2412 | 0.2214 |
| Residents’ consumption/GDP ratio (%) | −0.258 | 1.262 | 0.8175 | 1.1761 |
References
- Xu, J.; Liu, Y.; Yang, L. A comparative study of the role of China and India in sustainable textile competition in the US market under green trade barriers. Sustainability 2018, 10, 1348. [Google Scholar] [CrossRef]
- Bao, Q.; Tang, L.; Zhang, Z.X. Impacts of border carbon adjustments on China’s sectoral emissions: Simulations with a dynamic computable general equilibrium model. China Econ. Rev. 2013, 24, 77–94. [Google Scholar] [CrossRef]
- Dissou, Y.; Eyland, T. Carbon control policies, competitiveness, and border tax adjustments. Energy Econ. 2011, 33, 556–564. [Google Scholar] [CrossRef]
- Zhou, P.; Zhang, L.; Zhou, D.Q. Modeling economic performance of interprovincial CO2 emission reduction quota trading in China. Appl. Energy 2013, 112, 1518–1528. [Google Scholar] [CrossRef]
- Marrucci, L.; Daddi, T.; Iraldo, F. The integration of circular economy with sustainable consumption and production tools: Systematic review and future research agenda. J. Clean. Prod. 2019, 240, 118268. [Google Scholar] [CrossRef]
- Zhijun, F.; Nailing, Y. Putting a circular economy into practice in China. Sustain. Sci. 2007, 2, 95–101. [Google Scholar] [CrossRef]
- Pereda, P.C.; Lucchesi, A.; Garcia, C.P.; Palialol, B.T. Neutral carbon tax and environmental targets in Brazil. Econ. Syst. Res. 2019, 31, 70–91. [Google Scholar] [CrossRef]
- Pal, B.D.; Ojha, V.P.; Pohit, S.; Roy, J. GHG Emissions and Economic Growth: A Computable General Equilibrium Model Based Analysis for India; Springer: Berlin/Heidelberg, Germany, 2014. [Google Scholar]
- Allan, G.; Lecca, P.; McGregor, P.; Swales, K. The economic and environmental impact of a carbon tax for Scotland: A computable general equilibrium analysis. Ecol. Econ. 2014, 100, 40–50. [Google Scholar] [CrossRef]
- Liu, Y.; Lu, Y. The economic impact of different carbon tax revenue recycling schemes in China: A model-based scenario analysis. Appl. Energy 2015, 141, 96–105. [Google Scholar] [CrossRef]
- Zhou, Y.; Ma, M.; Kong, F.; Wang, K.; Bi, J. Capturing the co-benefits of energy efficiency in China—A perspective from the water-energy nexus. Resour. Conserv. Recycl. 2018, 132, 93–101. [Google Scholar] [CrossRef]
- Mahmood, A.; Marpaung, C.O. Carbon pricing and energy efficiency improvement—Why to miss the interaction for developing economies? An illustrative CGE based application to the Pakistan case. Energy Policy 2014, 67, 87–103. [Google Scholar] [CrossRef]
- Khan, Z.; Ali, S.; Umar, M.; Kirikkaleli, D.; Jiao, Z. Consumption-based carbon emissions and international trade in G7 countries: The role of environmental innovation and renewable energy. Sci. Total Environ. 2020, 730, 138945. [Google Scholar] [CrossRef] [PubMed]
- Ma, X.; Wang, C.; Dong, B.; Gu, G.; Chen, R.; Li, Y.; Li, Q. Carbon emissions from energy consumption in China: Its measurement and driving factors. Sci. Total Environ. 2019, 648, 1411–1420. [Google Scholar] [CrossRef] [PubMed]
- Roman, M.; Roman, K.; Roman, M. Spatial Variation in Particulate Emission Resulting from Animal Farming in Poland. Agriculture 2021, 11, 168. [Google Scholar] [CrossRef]
- Van Fan, Y.; Perry, S.; Klemeš, J.J.; Lee, C.T. A review on air emissions assessment: Transportation. J. Clean. Prod. 2018, 194, 673–684. [Google Scholar] [CrossRef]
- Marrucci, L.; Iraldo, F.; Daddi, T. Investigating the management challenges of the EU Ecolabel through multi-stakeholder surveys. Int. J. Life Cycle Assess. 2021, 26, 575–590. [Google Scholar] [CrossRef]
- Gilg, A.; Barr, S.; Ford, N. Green consumption or sustainable lifestyles? Identifying the sustainable consumer. Futures 2005, 37, 481–504. [Google Scholar] [CrossRef]
- Marrucci, L.; Marchi, M.; Daddi, T. Improving the carbon footprint of food and packaging waste management in a supermarket of the Italian retail sector. Waste Manag. 2020, 105, 594–603. [Google Scholar] [CrossRef]
- Kwon, H.J.; Woo, S.W.; Lee, Y.J.; Kim, J.Y.; Lee, S.M. Achieving High-Performance Spherical Natural Graphite Anode through a Modified Carbon Coating for Lithium-Ion Batteries. Energies 2021, 14, 1946. [Google Scholar] [CrossRef]
- Li, W.; Jia, Z. The impact of emission trading scheme and the ratio of free quota: A dynamic recursive CGE model in China. Appl. Energy 2016, 174, 1–14. [Google Scholar] [CrossRef]
- Zhang, K.; Xue, M.M.; Feng, K.; Liang, Q.M. The economic effects of carbon tax on China’s provinces. J. Policy Model. 2019, 41, 784–802. [Google Scholar] [CrossRef]
- Yahoo, M.; Othman, J.B. Employing a CGE model in analysing the environmental and economy-wide impacts of CO2 emission abatement policies in Malaysia. Sci. Total Environ. 2017, 584, 234–243. [Google Scholar] [CrossRef]
- Barragán-Beaud, C.; Pizarro-Alonso, A.; Xylia, M.; Syri, S.; Silveira, S. Carbon tax or emissions trading? An analysis of economic and political feasibility of policy mechanisms for greenhouse gas emissions reduction in the Mexican power sector. Energy Policy 2018, 122, 287–299. [Google Scholar] [CrossRef]
- Lin, B.; Jia, Z. The energy, environmental and economic impacts of carbon tax rate and taxation industry: A CGE based study in China. Energy 2018, 159, 558–568. [Google Scholar] [CrossRef]
- Jia, Z.; Lin, B. Rethinking the choice of carbon tax and carbon trading in China. Technol. Forecast Soc. 2020, 159, 120187. [Google Scholar] [CrossRef]
- Dorsey-Palmateer, R.; Niu, B. The effect of carbon taxation on cross-border competition and energy efficiency investments. Energy Econ. 2019, 85, 104602. [Google Scholar] [CrossRef]
- Yuan, Y.; Duan, H.; Tsvetanov, T.G. Synergizing China’s energy and carbon mitigation goals: General equilibrium modeling and policy assessment. Energy Econ. 2020, 89, 104787. [Google Scholar] [CrossRef]
- Tran, T.M.; Siriwardana, M.; Meng, S.; Nong, D. Impact of an emissions trading scheme on Australian households: A computable general equilibrium analysis. J. Clean. Prod. 2019, 221, 439–456. [Google Scholar] [CrossRef]
- Rivera, G.L.; Reynès, F.; Cortes, I.I.; Bellocq, F.X.; Grazi, F. Towards a low carbon growth in Mexico: Is a double dividend possible? A dynamic general equilibrium assessment. Energy Policy 2016, 96, 314–327. [Google Scholar] [CrossRef]
- Nasirov, S.; O’Ryan, R.; Osorio, H. Decarbonization tradeoffs: A dynamic general equilibrium modeling analysis for the Chilean power sector. Sustainability 2020, 12, 8248. [Google Scholar] [CrossRef]
- Goulder, L.H. Climate change policy’s interactions with the tax system. Energy Econ. 2013, 40, S3–S11. [Google Scholar] [CrossRef]
- Sadik-Zada, E.R.; Loewenstein, W.; Hasanli, Y. Production linkages and dynamic fiscal employment effects of the extractive industries: Input-output and nonlinear ARDL analyses of Azerbaijani economy. Miner. Econ. 2021, 34, 3–18. [Google Scholar] [CrossRef]
- Sadik-Zada, E.R. Addressing the growth and employment effects of the extractive industries: White and black box illustrations from Kazakhstan. Post-Communist Econ. 2020, 1–33. [Google Scholar] [CrossRef]
- Jorgenson, D.W. Stability of a dynamic input-output system. Rev. Econ. Stud. 1961, 28, 105–116. [Google Scholar] [CrossRef]
- Johansen, L.A. Multi-Sectoral Study of Economic Growth; North-Holland Publishing Company: Amsterdam, The Netherlands, 1960. [Google Scholar]
- Maxim, M.; Zander, K. Green Tax reform in Australia in the presence of improved environment-induced productivity gain: Does it offer sustainable recovery from a Post-COVID-19 recession? Sustainability 2020, 12, 6514. [Google Scholar] [CrossRef]
- Kirchner, M.; Sommer, M.; Kratena, K.; Kletzan-Slamanig, D.; Kettner-Marx, C. CO2 taxes, equity and the double dividend-Macroeconomic model simulations for Austria. Energy Policy 2019, 126, 295–314. [Google Scholar] [CrossRef]
- Gupta, M.; Bandyopadhyay, K.R.; Singh, S.K. Measuring effectiveness of carbon tax on Indian road passenger transport: A system dynamics approach. Energy Econ. 2019, 81, 341–354. [Google Scholar] [CrossRef]
- Zhang, Z.X. Macroeconomic effects of CO2 emission limits: A computable general equilibrium analysis for China. J. Policy Model. 1998, 20, 213–250. [Google Scholar] [CrossRef]
- Sun, Y.; Mao, X.; Liu, G.; Yin, X.; Zhao, Y. Greener economic development via carbon taxation scheme optimization. J. Clean. Prod. 2020, 275, 124100. [Google Scholar] [CrossRef]
- Zhang, Z.; Zhang, A.; Wang, D.; Li, A.; Song, H. How to improve the performance of carbon tax in china? J. Clean. Prod. 2017, 142, 2060–2072. [Google Scholar] [CrossRef]
- Freire-González, J. Environmental taxation and the double dividend hypothesis in CGE modelling literature: A critical review. J. Policy Model. 2018, 40, 194–223. [Google Scholar] [CrossRef]
- Alvarez, M. Distributional effects of environmental taxation: An approximation with a meta-regression analysis. Econ. Anal. Policy 2019, 62, 382–401. [Google Scholar] [CrossRef]
- Fraser, I.; Waschik, R. The double dividend hypothesis in a CGE model: Specific factors and the carbon base. Energy Econ. 2013, 39, 283–295. [Google Scholar] [CrossRef]
- Speck, S. Energy and carbon taxes and their distributional implications. Energy Policy 1999, 27, 659–667. [Google Scholar] [CrossRef]
- Brenner, M.; Riddle, M.; Boyce, J.K. A Chinese sky trust?: Distributional impacts of carbon charges and revenue recycling in China. Energy Policy 2007, 35, 1771–1784. [Google Scholar] [CrossRef]
- Mas-Colell, A.; Whinston, M.D.; Green, J.R. Microeconomic Theory; Oxford University Press: New York, NY, USA, 1995; Volume 1. [Google Scholar]
- Varian, H.R. Intermediate microeconomics. Economics 1995, 002, 3070. [Google Scholar]
- Xiao, K.; Li, F.; Dong, C.; Cai, Y.; Li, Y.; Ye, P.; Zhang, J. Unraveling effects of coal output cut policy on air pollution abatement in China using a CGE model. J. Clean. Prod. 2020, 269, 122369. [Google Scholar] [CrossRef]
- Jia, Z.; Lin, B. The impact of removing cross-subsidies in electric power industry in China: Welfare, economy, and CO2 emission. Energy Policy 2021, 148, 111994. [Google Scholar] [CrossRef]
- Cui, Q.; Liu, Y.; Ali, T.; Gao, J.; Chen, H. Economic and climate impacts of reducing China’s renewable electricity curtailment: A comparison between CGE models with alternative nesting structures of electricity. Energy Econ. 2020, 91, 104892. [Google Scholar] [CrossRef]
- Mu, Y.; Cai, W.; Evans, S.; Wang, C.; Roland-Holst, D. Employment impacts of renewable energy policies in China: A decomposition analysis based on a CGE modeling framework. Appl. Energy 2018, 210, 256–267. [Google Scholar] [CrossRef]
- Ojha, V.P.; Pohit, S.; Ghosh, J. Recycling carbon tax for inclusive green growth: A CGE analysis of India. Energy Policy 2020, 144, 111708. [Google Scholar] [CrossRef]


Publisher’s Note: MDPI stays neutral with regard to jurisdictional claims in published maps and institutional affiliations. |
© 2021 by the authors. Licensee MDPI, Basel, Switzerland. This article is an open access article distributed under the terms and conditions of the Creative Commons Attribution (CC BY) license (https://creativecommons.org/licenses/by/4.0/).