Article

Effect of Ultrafiltration Operating Conditions for Separation of Ferulic Acid from Arabinoxylans in Corn Fibre Alkaline Extract

1
UCIBIO-REQUIMTE, FCT, Universidade NOVA de Lisboa, Lisbon 2829-516, Caparica, Portugal
2
LAQV-REQUIMTE, FCT, Universidade NOVA de Lisboa, Lisbon 2829-516, Caparica, Portugal
*
Author to whom correspondence should be addressed.
Sustainability 2021, 13(9), 4682; https://doi.org/10.3390/su13094682
Submission received: 22 February 2021 / Revised: 31 March 2021 / Accepted: 20 April 2021 / Published: 22 April 2021
(This article belongs to the Special Issue Sustainable Food Waste Valorisation by Membrane Technology)

Abstract

:
Corn fibre, a co-product of the starch industry, is rich in compounds with high added value, such as ferulic acid and arabinoxylans, which are released during alkaline extraction. This work aims to optimise an efficient separation method for the recovery of these two compounds from a corn fibre alkaline extract, allowing an efficient valorisation of this co-product. Ultrafiltration was selected as separation method, due to its potential to fractionate these compounds. In order to minimise the loss of membrane permeance, due to mass transfer limitations caused by the high arabinoxylan viscosity, the impact of relevant ultrafiltration operating parameters (membrane molecular weight cut-off, fluid dynamics conditions, transmembrane pressure, and operating temperature) were evaluated. A Nadir UP 150 membrane was found to be an adequate choice, allowing for an efficient separation of ferulic acid from arabinoxylans, with null rejection of ferulic acid, a high estimated rejection of arabinoxylans 98.0% ± 1.7%, and the highest permeance of all tested membranes. A response surface methodology (RSM) was used to infer the effect of ultrafiltration conditions (crossflow velocity, transmembrane pressure and operating temperature) on the rejection of ferulic acid, retention of arabinoxylans (assessed through apparent viscosity of the retentate stream), and permeance. Through mathematical modelling it was possible to determine that the best conditions are the highest operating temperature and initial crossflow velocity tested (66 °C and 1.06 m.s−1, respectively), and the lowest transmembrane pressure tested (0.7 bar).

1. Introduction

The most abundant low-value co-product (used for animal feed) of the corn wet milling process is corn fibre [1], which contains a significant fraction of valuable phenolic compounds, mainly ferulic acid. Corn fibre contains between 1.5 and 3% of ferulic acid (Wtotal ferulic acid/Wdry corn fibre) [2,3,4,5]. Ferulic acid presents several recognised benefits, namely antioxidant, anti-inflammatory, antiatherogenic, antidiabetic, antiaging, neuroprotective, radioprotective, hepatoprotective, and antiproliferative properties [6,7,8], which make this compound widely used in the food, cosmetics, and pharmaceutical industries. It can also be used as a crosslinking agent for the preparation of films [9,10] and as precursor of bio-vanillin production [11,12]. Ferulic acid in corn fibre is mainly covalently linked by ester bonds to arabinoxylans. Arabinoxylans, also designated as corn fibre gum, are valuable non-starch cereal polysaccharides [13], with many recognized health benefits, such as a prebiotic, for the control of diabetes, immunomodulatory activity, and a cholesterol lowering effect [14,15,16]. They also have a functional application in edible film forming [17,18] and as an emulsifier for oil-in-water emulsion systems [19].
Alkaline extraction is the most commonly reported method for releasing ferulic acid [20,21,22,23,24] from agro-industrial by-products; however, alkaline extraction also releases arabinoxylans [25,26,27]. It is not possible to use a sequential two-step extraction process, using different operating conditions, for the release of ferulic acid and then of arabinoxylans. Hence, in order to achieve an efficient recovery of these two compounds for their use in different applications, an efficient separation is required. This separation is quite challenging, due to the high viscosity of the alkaline extract caused by the presence of arabinoxylans [22]. In fact, the high viscosity of arabinoxylans makes it difficult to use adsorption to purify ferulic acid in an alkaline extract [22].
Therefore, the development of a process able to efficiently separate these two compounds is very important for the valorisation of corn fibre extracts and the future use of both compounds. Ultrafiltration seems to be a suitable option for the separation of ferulic acid from arabinoxylans, due to the high molecular mass difference between the two compounds. Although the molecular mass of arabinoxylans is not constant (it fluctuates depending on the raw material and on the alkaline extraction conditions [25]), high molecular masses in the range of 244 to 491 kDa have been reported for arabinoxylans extracted from corn fibre [28]. This range of masses makes possible the use of ultrafiltration to separate arabinoxylans from ferulic acid, which has a molecular mass of 194 Da. Ultrafiltration has already been reported as a method to separate arabinoxylans from ferulic acid and other compounds present in different extracts (e.g., alkaline-alcohol extract from corn bran [22], alkaline-alcohol extract from wheat bran [29], and alkaline extract from wheat bran [26,30,31]).
However, the high viscosity of arabinoxylans can also influence the ultrafiltration process, leading to poor fluid dynamic conditions and, ultimately, causing membrane fouling, due to the formation of a gel layer on the membrane surface [29]. In order to overcome the viscosity problem of arabinoxylans, strategies have been reported involving the addition of ethanol during alkaline extraction, which decreases the viscosity of the extracts [22,29], and the use of dia-ultrafiltration [26]. However, the use of ethanol during the alkaline extraction decreases the ferulic acid released from the biomass [22], so the use of this organic solvent should be avoided. Dia-ultrafiltration allows to maintain a constant viscosity in the retentate stream by addition of a solvent (at the same flow rate as the permeate is removed), but a diluted permeate stream is obtained requiring further concentration of ferulic acid, which is expensive (a reverse osmosis or thermal process will be required for that purpose). Aiming at recovering not only the arabinoxylans, but also the ferulic acid, and since ferulic acid is not expected to be rejected by the ultrafiltration membrane, an ultrafiltration process was selected instead of dia-ultrafiltration. The loss of ferulic acid in the retentate by processing the corn fibre extract by ultrafiltration is minimised by operating until achieving a high concentration factor. Although dia-ultrafiltration may minimise ferulic acid losses, it would also lead to very diluted permeates, requiring the removal of water, which would be costly. In fact, dia-ultrafiltration has only been reported in the literature for the purification of arabinoxylans without recovery of other valuable compounds, such as ferulic acid from the permeate [26].
The purification of ferulic acid by ultrafiltration from alkaline extracts was reported, not using alkaline extracts from corn fibre, but from wheat bran [29] and from corn bran [22]. Also, in the reported cases, ethanol was used to decrease the viscosity of the extracts.
The purification of arabinoxylans from alkaline extracts (or from a steam explosion extract [32]) was reported, using wheat bran [26], wheat bran and wheat straw [30], and barley husks [32] as feedstocks. The purification of arabinoxylans was performed by ultrafiltration [30,33], by ultrafiltration operated in a diafiltration mode (dia-ultrafiltration) [26], or by ultrafiltration followed by dia-ultrafiltration [32].
The main innovation of the present work relies on the purification of both ferulic acid and of arabinoxylans using corn fibre alkaline extract, where no solvent, such as ethanol, was added (in order to decrease the viscosity of the extracts) and where the optimisation of the process involved the use of a design of experiments approach, considering the main operating conditions of ultrafiltration (operating temperature, initial crossflow velocity and transmembrane pressure). Consequently, increasing the overall sustainability of the corn wet milling process through the efficient, and also sustainable, valorisation of corn fibre.
Therefore, this work evaluates the use of ultrafiltration for the separation of ferulic acid from arabinoxylans in alkaline extracts from corn fibre rich in ferulic acid. In order to minimise the loss of membrane permeance induced by the high arabinoxylan viscosity, the most relevant ultrafiltration operating parameters were studied: membrane molecular weight cut-off, crossflow velocity of the feed stream, transmembrane pressure, and operating temperature. First, the type of membrane was evaluated by analysing the behaviour of each membrane in a dead-end configuration cell, in terms of ferulic acid rejection, arabinoxylans retention (assessed through the apparent viscosity of the retentate and rejection of the sugar constituents of arabinoxylans), and permeance.
The most suitable membrane was selected and was then used to set the other operating parameters (crossflow velocity, transmembrane pressure, and operating temperature), using a response surface methodology (RSM). Response surface methodology (RSM) is a multivariate regression tool based on statistical analysis, which allows the factors and response variables to be correlated using regression models that are optimised for each response studied [34,35]. RSM is combined with design of experiments (DoE) to find an optimal response. DoE introduces variation in the independent factors that directly affect the variation of responses and allows a reduction in the number of experiments required to develop a model [35]. In this work, this statistical method was used to establish the correlation between the factors (operating temperature, crossflow velocity, and transmembrane pressure), and the responses (rejection of ferulic acid, retention of arabinoxylans, measured through the viscosity of retentate stream, and permeance), in order to define the best ultrafiltration conditions for an efficient separation of ferulic acid from arabinoxylans, while maintaining a good permeance.

2. Materials and Methods

2.1. Materials

The extracts were obtained by a mild alkaline extraction under the following optimised conditions: 0.25 M NaOH, at 30 °C, for 7 h, using a liquid-to-solid ratio of 10 gsolvent.gdry fibre−1, using wet corn supplied by Copam, Companhia Portuguesa De Amidos, S.A. (São João da Talha, Portugal), after the wet milling process (data not shown). The alkaline extracts were then centrifuged at 9174× g for 15 min.
Four membranes with different molecular weight cut-offs and materials were selected. Since corn fibre arabinoxylans have a molecular weight ranging from 244 to 491 kDa [28], membranes with a molecular weight cut-off ranging from 50 to 150 kDa were selected to ensure the retention of these compounds. Membranes with good stability at high operating temperature and pH were chosen. High operating temperature allows for reducing the viscosity of the streams containing arabinoxylans during membrane processing, increasing permeance. Regarding the material, it was decided to test membranes made of different materials to cover a good range of hydrophobicity/hydrophilicity.
Their main characteristics are summarised in Table 1.

2.2. Methods

2.2.1. Screening of Ultrafiltration Membranes

Ultrafiltration experiments for membrane selection were performed in dead-end mode under controlled transmembrane pressure conditions (METCell, Membrane Extraction Technology, Hessen, Germany) (Figure 1), using flat sheet membranes with an effective membrane area of 51.4 cm2. The feed reservoir was filled with 230 g of alkaline extract (the same lot for all membrane experiments) with an apparent viscosity of 3.13 ± 0.05 mPa.s (measured at 20 °C).
Membrane filtrations were carried out at constant transmembrane pressure (the difference between the pressure at the feed compartment, 0.7 bar relative pressure, obtained using a gas pressurizing unit, and the pressure at the permeate compartment, 0.0 bar relative pressure). Stirring was done via magnetic-stirring, with a cross-head magnetic bar, set at 250 rpm. The control of operating temperature at 50 °C (maximum operating temperature for Millipore membranes) in the cell was carried out by immersing the membrane module in a controlled temperature bath. The permeate was collected and its mass was recorded continuously with an electronic balance (Kern 572, Kern, Balingen, Germany) connected to a computer for data acquisition. The concentration factor, CF, was calculated for each membrane ultrafiltration experiment, using the following equation:
C F = m 0 ( m 0 m p e r m e a t e )
where, m0 (g) is the mass of feed at the beginning of the experiment and mpermeate (g) is the mass of permeate recovered up to a given instant. The concentration factor at the end of each experiment was 7.
In each experiment, the initial and final feed (final retentate) solutions, and the final cumulative permeate solution, were characterised in terms of content of ferulic acid and arabinoxylans. The content of the arabinoxylans in the samples was analysed through the quantification of the four main neutral sugars that make up the structure of arabinoxylans (arabinose, xylose, glucose, and galactose) [26,38], which were obtained by acid hydrolysis.
The global rejection of each compound i, Ri (%), was calculated using the following equation:
R i ( % ) = 1 C p e r m , o v e r a l l , i ( t = t f i n a l ) C f e e d , i ( t = t f i n a l ) × 100
where C p e r m , o v e r a l l , i ( t = t f i n a l ) (g.kg−1 of extract) and C f e e d , i ( t = t f i n a l )   (g.kg−1 of extract), are the final cumulative concentration in the permeate and the final feed (final retentate) concentration of compound i, respectively.
In order to assess membrane fouling phenomena, the adsorption of each compound i (%) in each experiment was calculated using the following equation:
A d s o r p t i o n , i   ( % ) = 1 m f e e d , i ( t = t f i n a l ) + m p e r m , i ( t = t f i n a l ) m f e e d ,   i ( t = 0 ) × 100
where m f e e d , i ( t = t f i n a l ) (g) is the mass of the compound i in the final retentate, m p e r m , i ( t = t f i n a l ) (g) is the cumulative mass of compound i in the permeate at the end of each experiment and m f e e d ,   i ( t = 0 ) (g) is the mass of compound i in the initial feed stream.
The rejection and adsorption of all arabinoxylans were estimated by the average of rejections (Equation (2)) and of adsorptions (Equation (3)) of the neutral sugars that constitute the structure of arabinoxylans (arabinose, xylose, glucose, and galactose), respectively.
The apparent viscosity was measured at 20 °C at the end of each ultrafiltration experiment. It was measured in the retentate for all experiments. Since arabinoxylans may be considered the only compounds in corn fibre extracts/fractions relevant to contribute for the viscosity of the solutions, the viscosity of the retentate and the permeate solutions in these experiments were related to the concentration of the arabinoxylans in these streams [22,27]. High viscosity of the retentate and low viscosity in permeate mean that the membrane is efficiently retaining the arabinoxylans.
The permeance P (L.m−2.h−1.bar−1) was calculated using the following equation:
P = V p e r m A × t × Δ p
where V p e r m   (L) is the permeate volume, t (h) the time of permeation, A (m2) the membrane effective area, and Δp (bar) the transmembrane pressure.
The average permeance P ¯ (L.m−2.h−1.bar−1) was calculated through Equation (4) considering V p e r m (L) as the total permeated volume and t (h) as the total time of permeation.
Membrane selection was based on rejection of ferulic acid, retention of arabinoxylans (measured by the viscosity of the retentate and by the rejection of the sugars constituents of arabinoxylans), and permeance.

2.2.2. Operating Conditions and Design of Experiments (DoE)

In order to study the effect of the operating temperature, the initial crossflow velocity (as crossflow velocity varies during each experiment because the retentate viscosity increases during each experiment) and transmembrane pressure, the ultrafiltration experiments were performed in a GE-Sepa CF crossflow module (GE Osmonics, Twin Lakes, WI USA) connected to a feed pump (Hydra-cell model G13, Wanner Engineering Inc., Minneapolis, MN, USA). The membrane had an effective membrane area of 140 cm2. The permeate mass was measured continuously with a Kern 572 balance connected to a computer to record the data. Figure 2 illustrates the experimental set-up of the crossflow.
Each experiment started with 2 L of alkaline extract with an apparent viscosity of 6.97 ± 0.133 mPa.s at 20 °C. Variation of the feedstock corn fibre, from different geographic origins, results in variations of the viscosity of the natural extracts. In order to minimise this constrain, the same lot was used for all crossflow experiments. The extract was then concentrated to the minimum volume possible (the dead volume of the membrane unit), achieving a final concentration factor of 3.5.
For the experimental design, three independent factors were considered: the operating temperature (°C), the initial crossflow velocity (m.s−1), and the transmembrane pressure (bar). A design of experiments methodology was applied using a full factorial design with 2 replicas of the central point. This experimental design allowed the 3 factors to be correlated at two levels (minimum and maximum values of the 3 factors) using 10 experiments (Table 2). The minimum and the maximum values of the 3 factors selected were: operating temperature of 30 °C and 70 °C, initial crossflow velocity of 0.60 m.s−1 and 1.07 m.s−1, and transmembrane pressure of 0.7 bar and 3 bar. The minimum temperature was selected, taking in account the operating temperature used during the previous step of the process, alkaline extraction at 30 °C. Although the membranes selected allowed a maximum operating temperature higher than 70 °C, this value was selected due to possible constrains at real scale, because large membrane modules comprising these membranes refer commonly to 80 °C as the maximum operating temperature.
The initial crossflow velocity and the transmembrane pressure are set independently but, when using a high crossflow velocity, the minimum achievable transmembrane pressure (with the retentate valve totally open) was higher than 0.7 bar. The increase of crossflow velocity will increase pressure in the feed channel, with all potentially negative impacts that higher transmembrane pressures may imply (higher risk of severe fouling and potential loss of membrane selectivity, due to fouling). Therefore, in these experiments it was selected a maximum velocity of 1.07 m.s−1, to avoid the increase of the transmembrane pressure. Using this rational, the minimum transmembrane pressure was set at 0.7 bar. Above a transmembrane pressure of 3 bar, we anticipate a fast and significant fouling of the membrane.
When required, the transmembrane pressure was adjusted on the retentate side with a needle valve and measured with a pressure gauge. The operating temperature of the feed was controlled with a temperature-controlled bath (FP50, Julabo, Allentown, PA, USA) connected to the jacketed feed vessel. The initial crossflow velocity in the feed compartment of the membrane element was controlled by adjusting the pump speed and measuring the flow rate.
In order to ascertain the optimal conditions, three responses were analysed: the rejection of ferulic acid, the viscosity of the retentate solution (used as measure of the concentration of arabinoxylans), and membrane permeance. For the response surface methodology (RSM), a partial least squares regression (PLS) model was used to assess each factor individually, as well as analysing the linear interactions between factors. The DoE and data analysis were performed using the MODDE Go 12.1 software. The statistical parameters used to evaluate the quality of the model (R2, Q2, Model validity and reproducibility) were calculated using the software, as defined in the User Guide to MODDE [39].

2.3. Analytical Methods

The concentration of ferulic acid was determined using high performance liquid chromatography (Alliance e2695, Waters, Milford, MA, USA) with a Nova-Pak® C18 3.9 mm × 150 mm column (particle diameter of 4 mm) and a guard column, using a UV detector at 280 nm. The injection volume of each sample was 20 µL, and the column temperature was 30 °C. Ferulic acid was analysed with a gradient elution program at the flow rate of 0.5 mL.min−1. The mobile phase used a mixture of two eluents: eluent (A) contained 10% (v/v) methanol and 2% (v/v) acetic acid in Milli-Q water; eluent (B) contained 90% methanol and 2% acetic acid in Milli-Q water. The gradient elution program was 0% B (0–10 min), from 0% to 15% B (10–25 min), from 15% to 50% B (25–35 min) and from 50% to 0% B (35–38 min).
The neutral sugar content in the arabinoxylans was determined based on the acid hydrolyses of polysaccharides, as described in Carvajal-Millan et al. 2005 [38]. Briefly, the hydrolysis was performed by using 5 mg of dry sample suspended in 5 mL of deionised water and adding 0.1 mL of TFA (Trifluoroacetic acid) at 120 °C during 2 h. The reaction was stopped by submerging the sample in ice and the neutral sugars were analysed using a HPLC (Dionex, Thermofisher scientfic, Sunnyvale, CA, USA) equipped with an amperometric detector and a CarboPac PA10 column. The analysis was performed at 30 °C with an aqueous sodium hydroxide (NaOH 18 mM) as the eluent, at a flow rate of 1 mL min−1.
The apparent viscosity of the extracts was measured at 20 °C using a digital viscometer (FungiLab Alpha Series, Barcelona, Spain) at different rotational speeds in the interval of 100 to 0.3 rpm, with 16 mL of each sample. All samples exhibited a Newtonian behaviour.

3. Results and Discussion

3.1. Selection of Ultrafiltration Membranes

The aim of fractionation is to obtain a permeate rich in ferulic acid and a retentate with the maximum concentration of arabinoxylans. Membrane selection was accomplished with a first set of experiments, performed in a dead-end cell. Since corn fibre arabinoxylans have a molecular weight from 244 to 491 kDa [28], membranes of different materials with a molecular weight cut-off ranging from 50 to 150 kDa were evaluated in order to characterise their behaviour concerning the rejection of ferulic acid (targeting as low as possible values) and their permeance for ferulic acid (targeting high values). Regarding the arabinoxylans, the viscosity of the final retentate and the estimated rejection of arabinoxylans needed to be high, as the main objective was the effective separation between arabinoxylans and ferulic acid.
The first set of membrane experiments was performed at 0.7 bar and 50 °C using 230 mL of alkaline extract with an apparent viscosity of 3.13 ± 0.05 mPa.s at 20 °C. The main results obtained are shown in Table 3, Figure 3 and Figure 4. Table 3 shows the rejection of ferulic acid and of the four sugars that compose arabinoxylans and the estimated rejection of arabinoxylans; it also shows the viscosity of the permeate and the retentate at the end of each membrane experiment.
Under the acidic hydrolysis conditions, required to determine the neutral sugar content in the arabinoxylans, some sugars may be converted into hydroxymethylfurfural (HMF), which might lead to deviations in their measurements. Additionally, the arabinoxylans present in the feed may have different sugar compositions and be rejected slightly differently by the membrane, thus, an average rejection was calculated based on all monomers.
As shown in Table 3, all membranes proved to be efficient in separating ferulic acid from arabinoxylans. For all membranes tested, no rejection of ferulic acid was observed (represented as 0% in this work), meaning that ferulic acid concentration in the final permeate and in final retentate is the same (Equation (2)). Ferulic acid passes freely through the membrane, due to its low molecular weight (194 Da). The rejection of arabinoxylans measured as sugar monomers and the estimated rejection of arabinoxylans (based on the average of the global rejection of neutral sugars) was higher than 94% and the viscosity of the retentates (85.54–158.54 mPa.s) was much higher than the permeates (1.30–1.37 mPa.s), indicating the efficient separation of the arabinoxylans from ferulic acid. The viscosity of the retentate (PL < Nadir US 100 < Nadir UP 150 < Nadir UH 50) follows the same order as the rejection of the 4 sugar monomers, indicating that high viscosity in the retentate means a high rejection of arabinoxylans, as expected.
More hydrophilic membranes, such as US (made of polysulfone with a hydrophilic treatment) and PL (made of regenerated cellulose), exhibited slightly lower rejection of arabinoxylans (which can be seen from the results obtained for the sugar monomers) and their retentates presented lower viscosities, as expected. On the other hand, the more hydrophobic polyethersulfone-based membranes, either with hydrophilic treatment (UH 50) or without (UP 150), presented a slightly better performance as they rejected the arabinoxylans, presenting an average rejection of these compounds of 98.7% ± 1.1% and 98.0% ± 1.7%, respectively.
Figure 3 shows the permeance in relation to the concentration factor for each membrane, as well as the average permeance. 
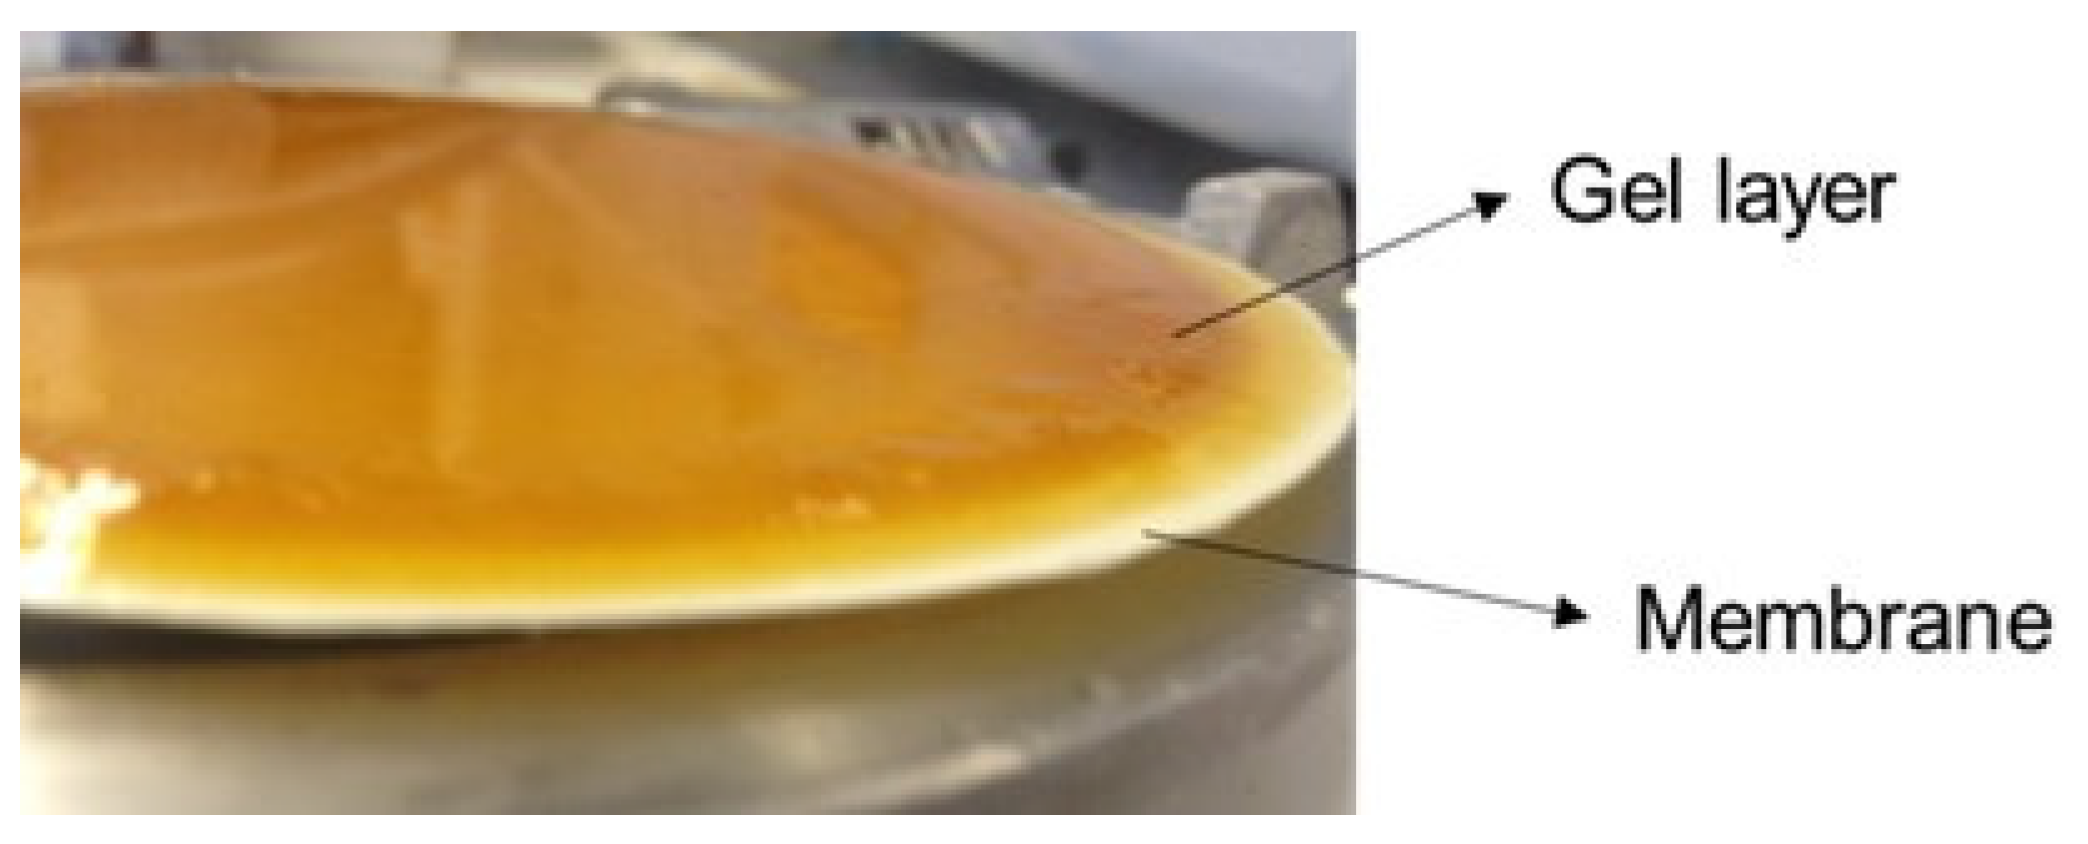
Figure 4 shows membrane UP150 after the experiments (the other membranes exhibited the same behaviour, data not shown). 
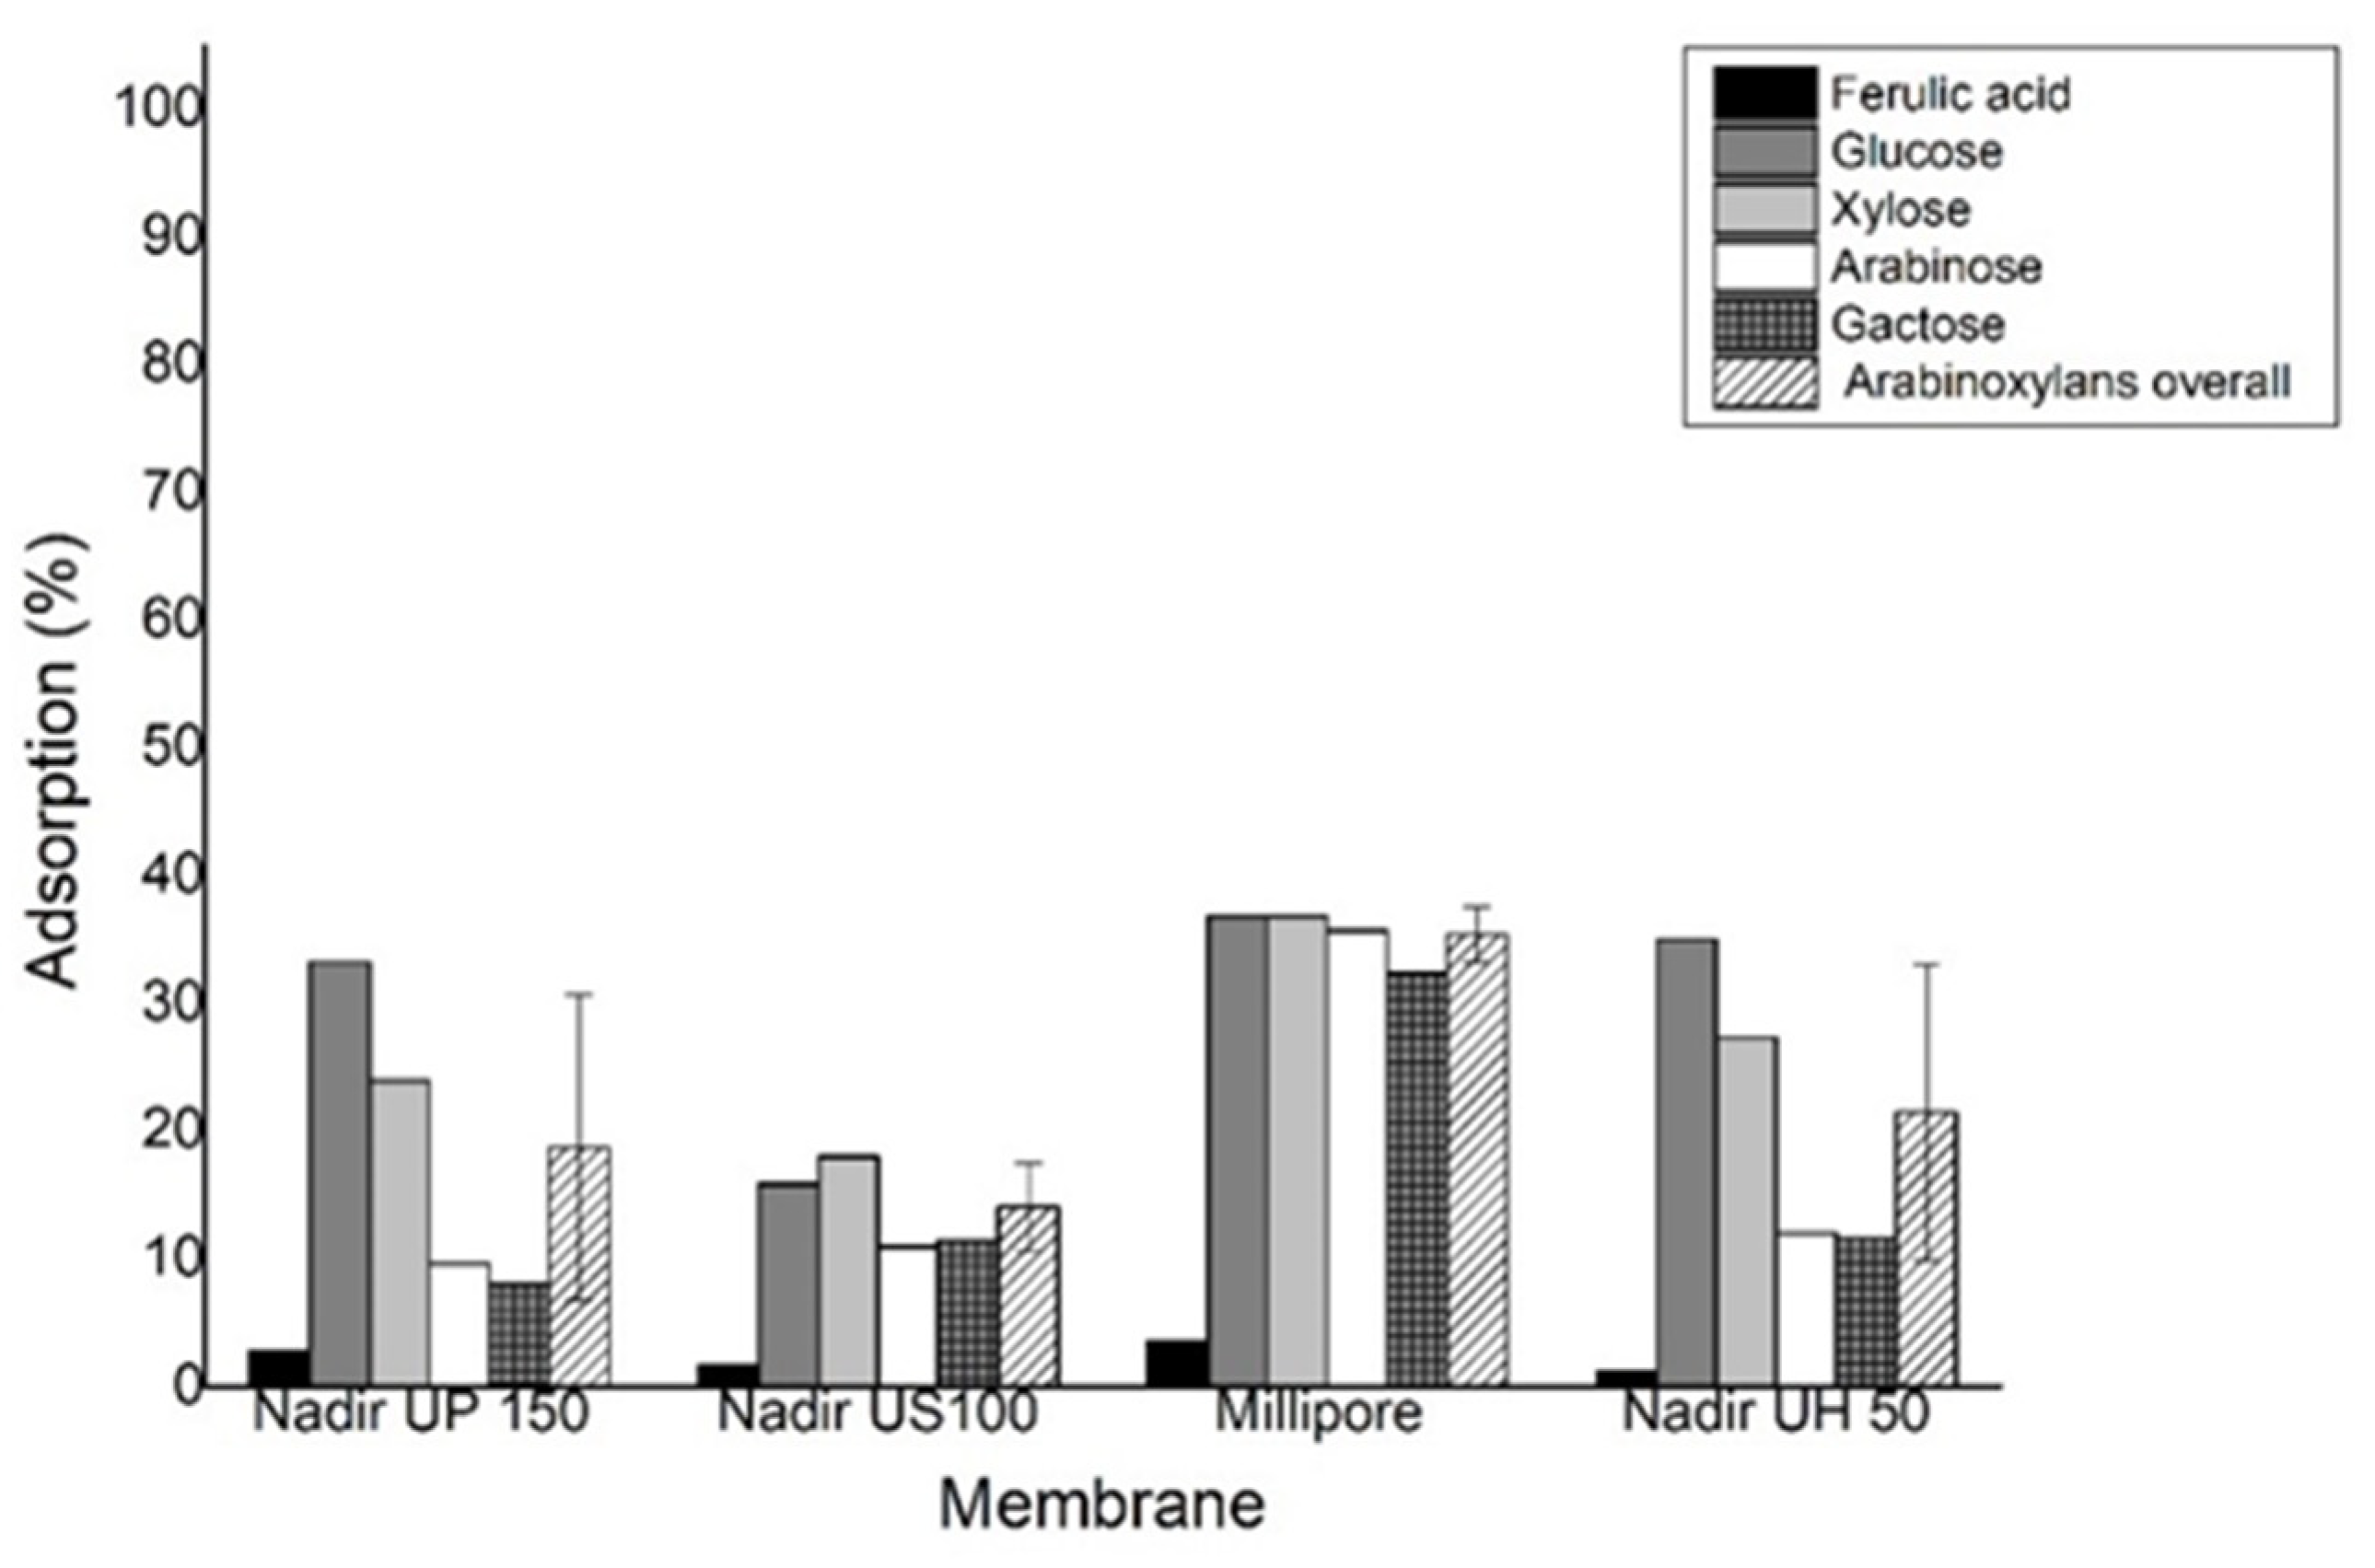
Figure 5 represents the adsorption of ferulic acid and arabinoxylans on the membrane.
As shown in Figure 3, it was possible to achieve a concentration factor of 7, which corresponds to a rather good recovery value of 85% for ferulic acid in the permeate. The average permeance obtained for all membranes was modest for an ultrafiltration process. This can be explained by the formation of a gel layer on the membrane surface, induced by the relatively poor mass transfer conditions near the membrane surface, due to the high viscosity of the media containing arabinoxylan, which was observed at the end of each experiment. The formation of a gel layer was more pronounced, due to the use of a dead-end cell, where a process of frontal filtration takes place. The accumulation of the rejected arabinoxylans occurred near the membrane surface, promoting membrane fouling and affecting permeance. Relatively high values of arabinoxylan adsorption were detected for all membranes (Figure 5), indicating the presence of membrane fouling phenomena. Nevertheless, the formation of a gel layer did not affect the rejection of ferulic acid, since all membranes presented no rejection of ferulic acid (0%) (Figure 4 and Table 3) and only a slight adsorption of ferulic acid was detected (Figure 5).
All membranes allowed to achieve the main objective of this work—an efficient separation of ferulic acid from arabinoxylans (low ferulic acid rejection and high arabinoxylan rejection). The UP 150 membrane was selected as the best performing membrane, because it exhibits the second highest arabinoxylan rejection (98.0% ± 1.7%) and the highest average permeance (2.35 L.m2.h−1.bar−1).

3.2. Evaluation of the Effect of Operating Temperature, Crossflow Velocity and Transmembrane Pressure Using Design of Experiments (DoE)

After selecting the membrane, the effect of the operating conditions (operating temperature, initial crossflow velocity, and transmembrane pressure) in the filtration performance was analysed in a crossflow cell. The 10 DoE experiments (Table 2) were carried out, though with slight deviations between the values imposed and the ones selected to be set, due to practical operating circumstances. Temperature deviations were mainly due to differences between the set-point in the control and the temperature actually measured inside the feed vessel. The initial crossflow velocity and the transmembrane pressure were independent factors but when using a high crossflow velocity, the minimum achievable transmembrane pressure (with the valve totally open) was higher than 0.7 bar. Therefore, some adjustments were required to operate the equipment for the conditions selected. Table 4 shows the value of the parameters actually used in the DoE, as well as that of the responses obtained (global rejection of ferulic acid (%), retention of arabinoxylans measured by retentate viscosity (mPa.s), and the average permeance (L.m−2.h−1.bar−1). As discussed above, the retention of arabinoxylans was related with the retentates’ apparent viscosity, which was measured at the end of each experiment at 20 °C.
From the analysis of the responses obtained (Table 4), it was found that there was no rejection of ferulic acid (0%) for all cases, indicating that the conditions tested had no influence (in the range of study) on the rejection of ferulic acid. Therefore, RSM was only applied to the other two responses, retention of arabinoxylans measured by apparent viscosity of retentate and average permeance, in order to find the models capable of correlating each of them with the factors.
An increase of the feed operating temperature and initial crossflow velocity, in spite of some negative impact on the energy needed for the separation process, had a positive significant impact on the performance of the process, reflected on an increase of the average permeance. Particularly, an increase of the operating temperature from 30 to 66 °C, led to an increase of the average permeance by 58% in experiments 1 and 2, and to an increase of the average permeance by 65% in experiments 7 and 8. Also, an increase of the initial crossflow velocity from 0.69 to 1.02 m.s−1, led to an increase of the average permeance of 17% in experiments 5 and 7.
The multilinear models were optimised removing the factors and/or the interaction between factors that were insignificant for each response. The effect of the significant factors (and interactions between factors) on retention of arabinoxylans (assessed through the apparent viscosity of the retentate) and on permeance can be shown in Figure 6, where the coefficients are normalised in order to compare the input weights.
The optimised models show that retention of arabinoxylans (measured by the viscosity of the retentate at 20 °C in the final of each experiment), is only affected by the initial crossflow velocity and by the transmembrane pressure. The operating temperature of the ultrafiltration (in the range tested) did not effluence the retention of the arabinoxylans.
The initial crossflow velocity is the most significant term, as it had a positive impact on fluid dynamics in the feed/retentate circuit, leading to better mass transfer conditions that improve the retention of arabinoxylans, which translates into an higher apparent viscosity of the retentate (high crossflow velocity increases the retentate’s apparent viscosity). In the opposite direction, operating with higher transmembrane pressure, increases the convective transport of solutes towards the membrane surface and, ultimately, facilitating fouling with a direct negative impact on the arabinoxylans present in the solution (Figure 6a).
Regarding the permeance, the most significant term is the transmembrane pressure applied, which has a large negative impact, followed by operating temperature, which has a positive impact on permeance, and by the interaction between pressure and operating temperature (Figure 6b). The negative impact of pressure has been reported by Lui and Wang (2002) in a study on the purification of ferulic acid from wheat bran alkaline-alcohol extract by ultrafiltration [29], where an increase of transmembrane pressure led to the quicker formation of a gel layer, resulting in a faster membrane flux decline. The operating temperature, as expected, has a positive impact, since the viscosity of the retentate solution decreased during the experiment as the operating temperature increased and consequently increased the permeance.
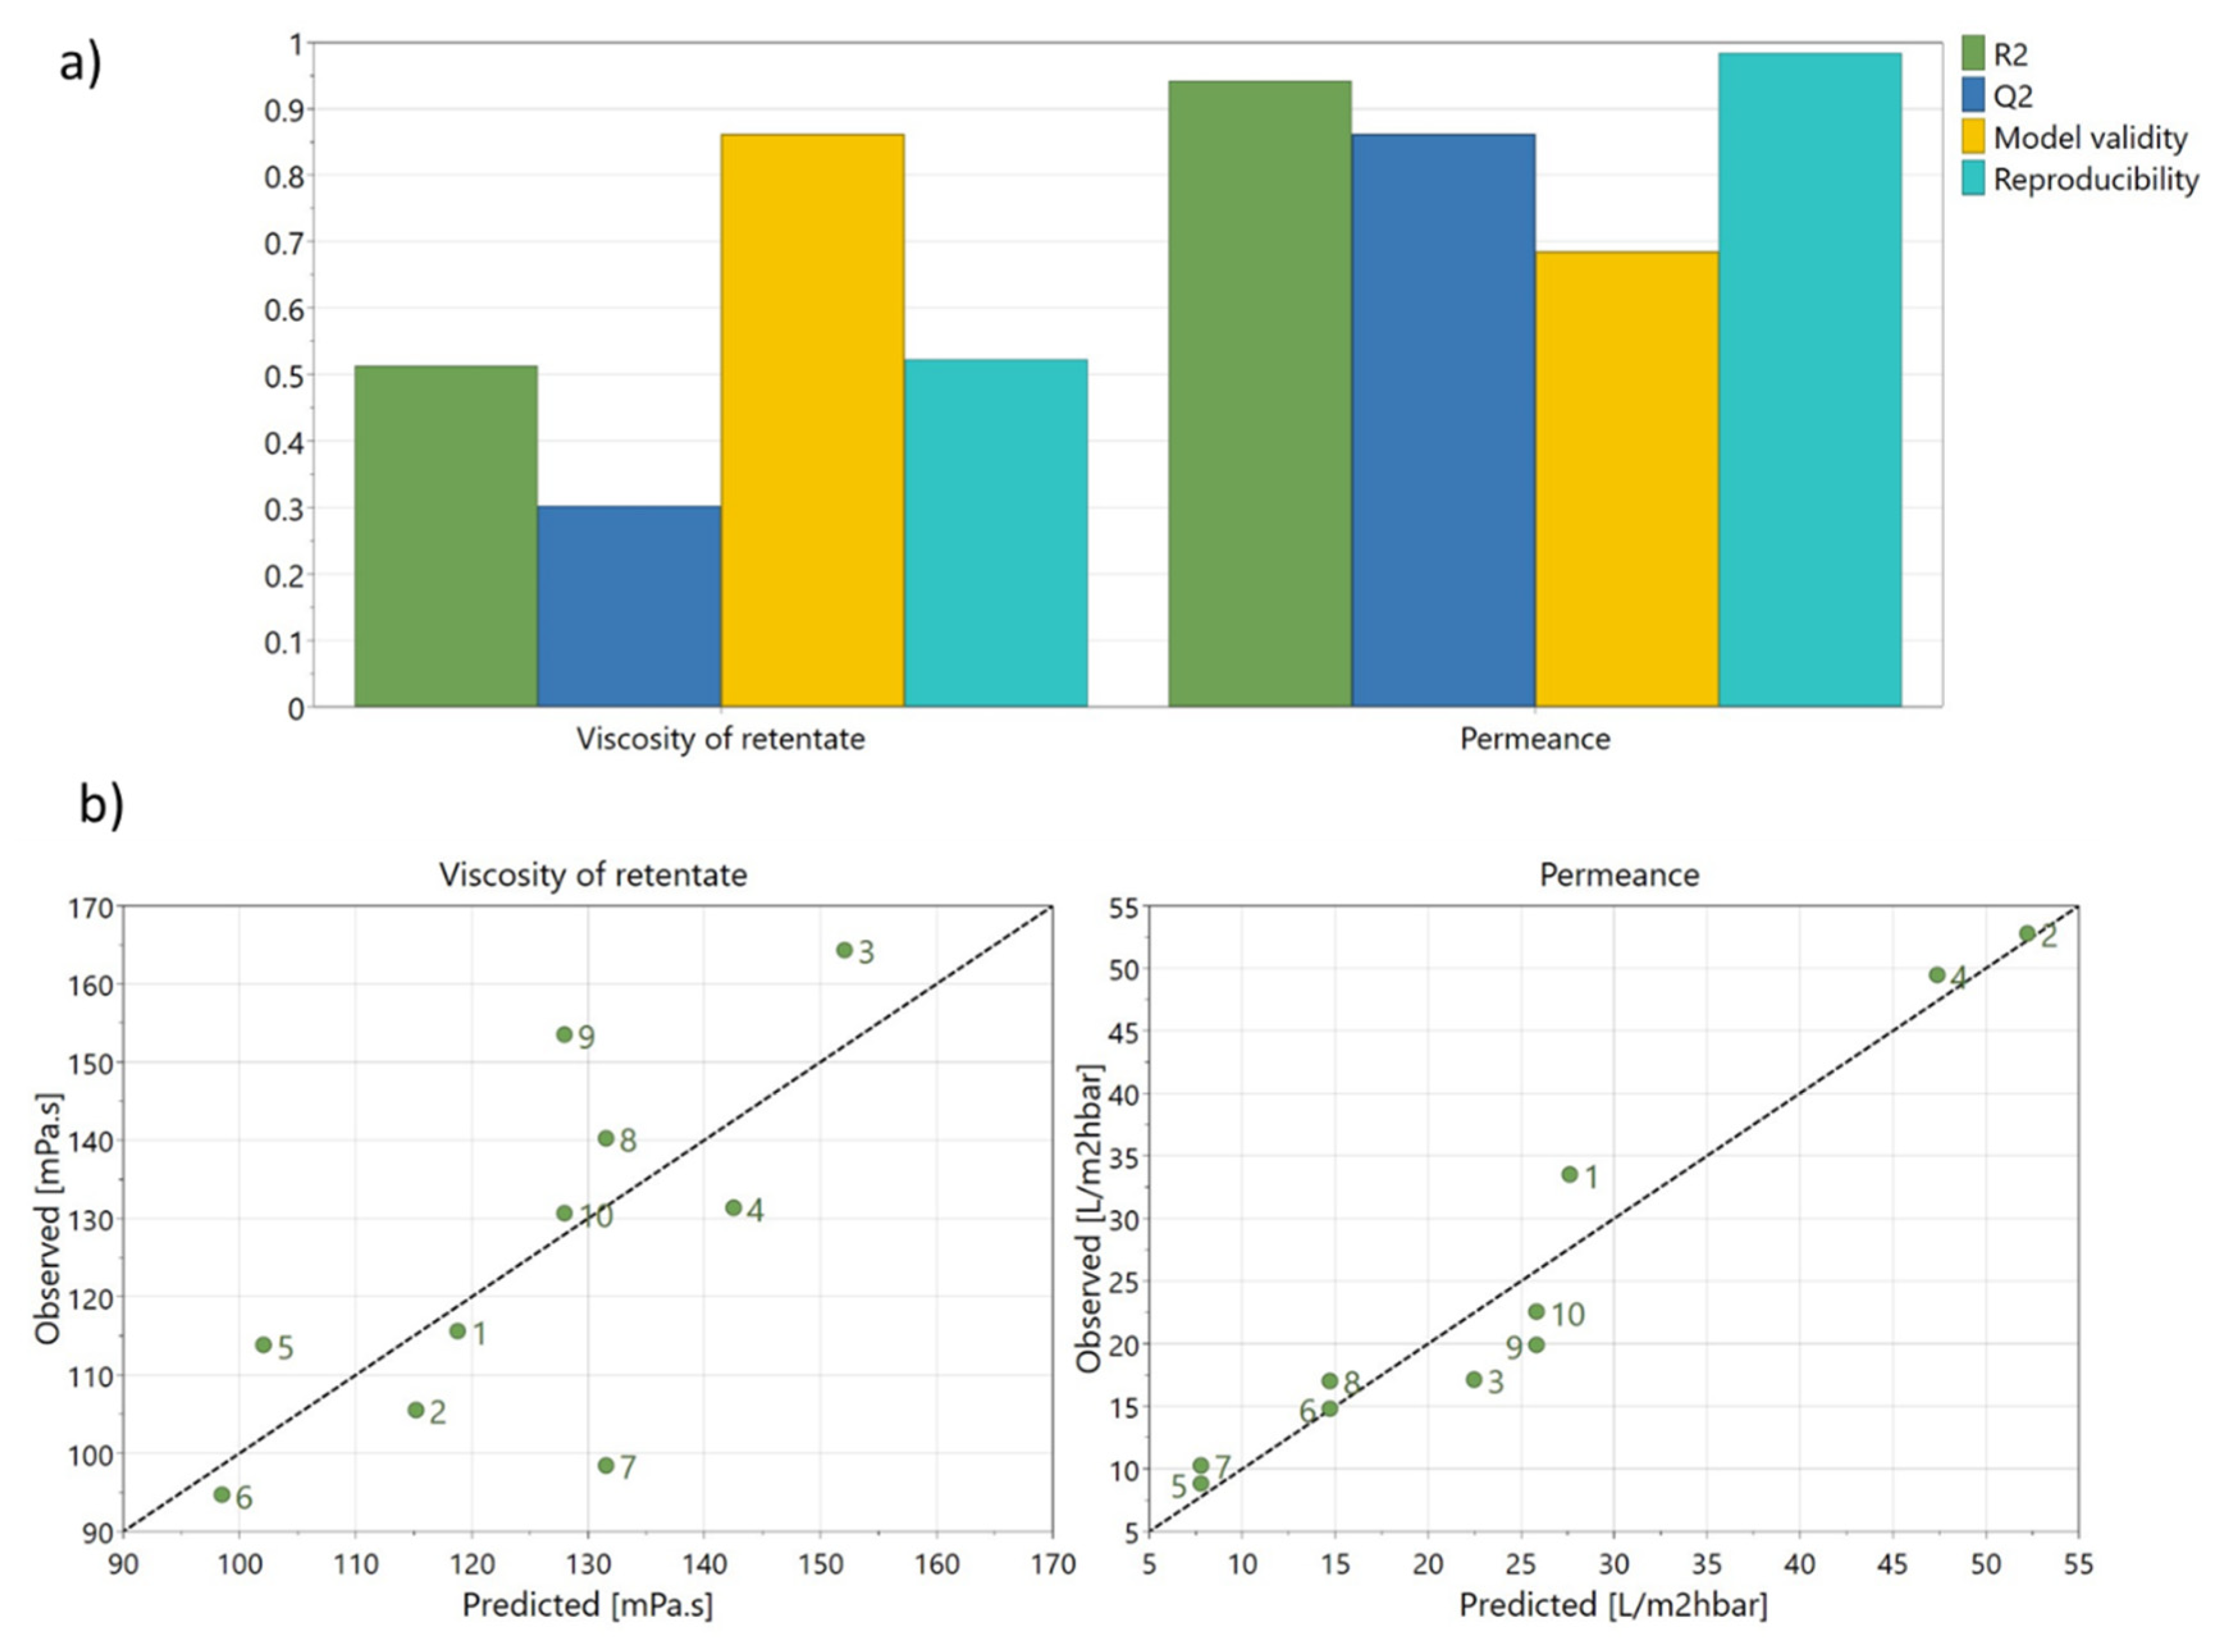
Figure 7a exhibits the statistical parameters of the model (Q2, R2, model validity, and reproducibility) provided by the software (MODDE Go 12.1). Figure 7b represents the observed values for permeance and rejection of arabinoxylans, measured by the apparent viscosity of retentate versus the values predicted by the model. These two figures allow the model to be evaluated.
According to the MODDE software, parameter R2 shows how the model fits the data and should be higher than 0.5 to be significant (showing a true correlation), Q2 estimates the prediction precision, and should be higher than 0.1 for a significant model and higher than 0.5 for a good model [39]. Model validity should be higher than 0.25, to exclude statistically significant problems, such as the high presence of outliers, an incorrect model, or a transformation problem [39]. Reproducibility, defined as the variation of the replicated experience compared to overall variability, should be above 0.5 [39]. Thus, by analysing the statistical parameters of each model individually (Figure 7a), we can see that the permeance model can be considered a very good model (R2 = 0.93, Q2 = 0.86, reproducibility = 0.99, and model validity of 0.69). Furthermore, the fitting between predicted and observed values for the permeance model is good (Figure 7b), also indicating a good model.
By analysing the statistical parameters for the viscosity model (Figure 7a), we can see that the values of R2, Q2, and reproducibility were low (0.51, 0.32, and 0.52, respectively). However, the model can be considered a significant model since R2 was higher than 0.5, Q2 was higher than 0.1, and the reproducibility was higher than 0.5. Additionally, the model validity was much higher at 0.86, indicating there are no statistically significant problems. In Figure 7b, showing predicted and observed values for the viscosity, it is possible to observe some data dispersion. The exclusion of experiment 7 from the model was assessed, and it resulted in a better model, with R2 increasing from 0.51 to 0.80, Q2 from 0.32 to 0.72, and model validity from 0.86 to 0.95. However, as it is not recommended to exclude experiments [39], the initial model, with all data, was used.
Therefore, the final equations that translate the models achieved and that can be used for estimation of viscosity (µretentate) and permeance ( P ¯ ) when varying the crossflow velocity ( v ), transmembrane pressure (Δp), and temperature (T), within the range studied, are:
µ r e t e n t a t e ( m P a . s ) = 89.592 v 7.2752 Δ p + 62.042
P ¯ ( L . m 2 . h 1 . b a r 1 ) = 0.88338 T 2.2063 Δ p × T + 8.6267

3.3. Optimal Operating Conditions

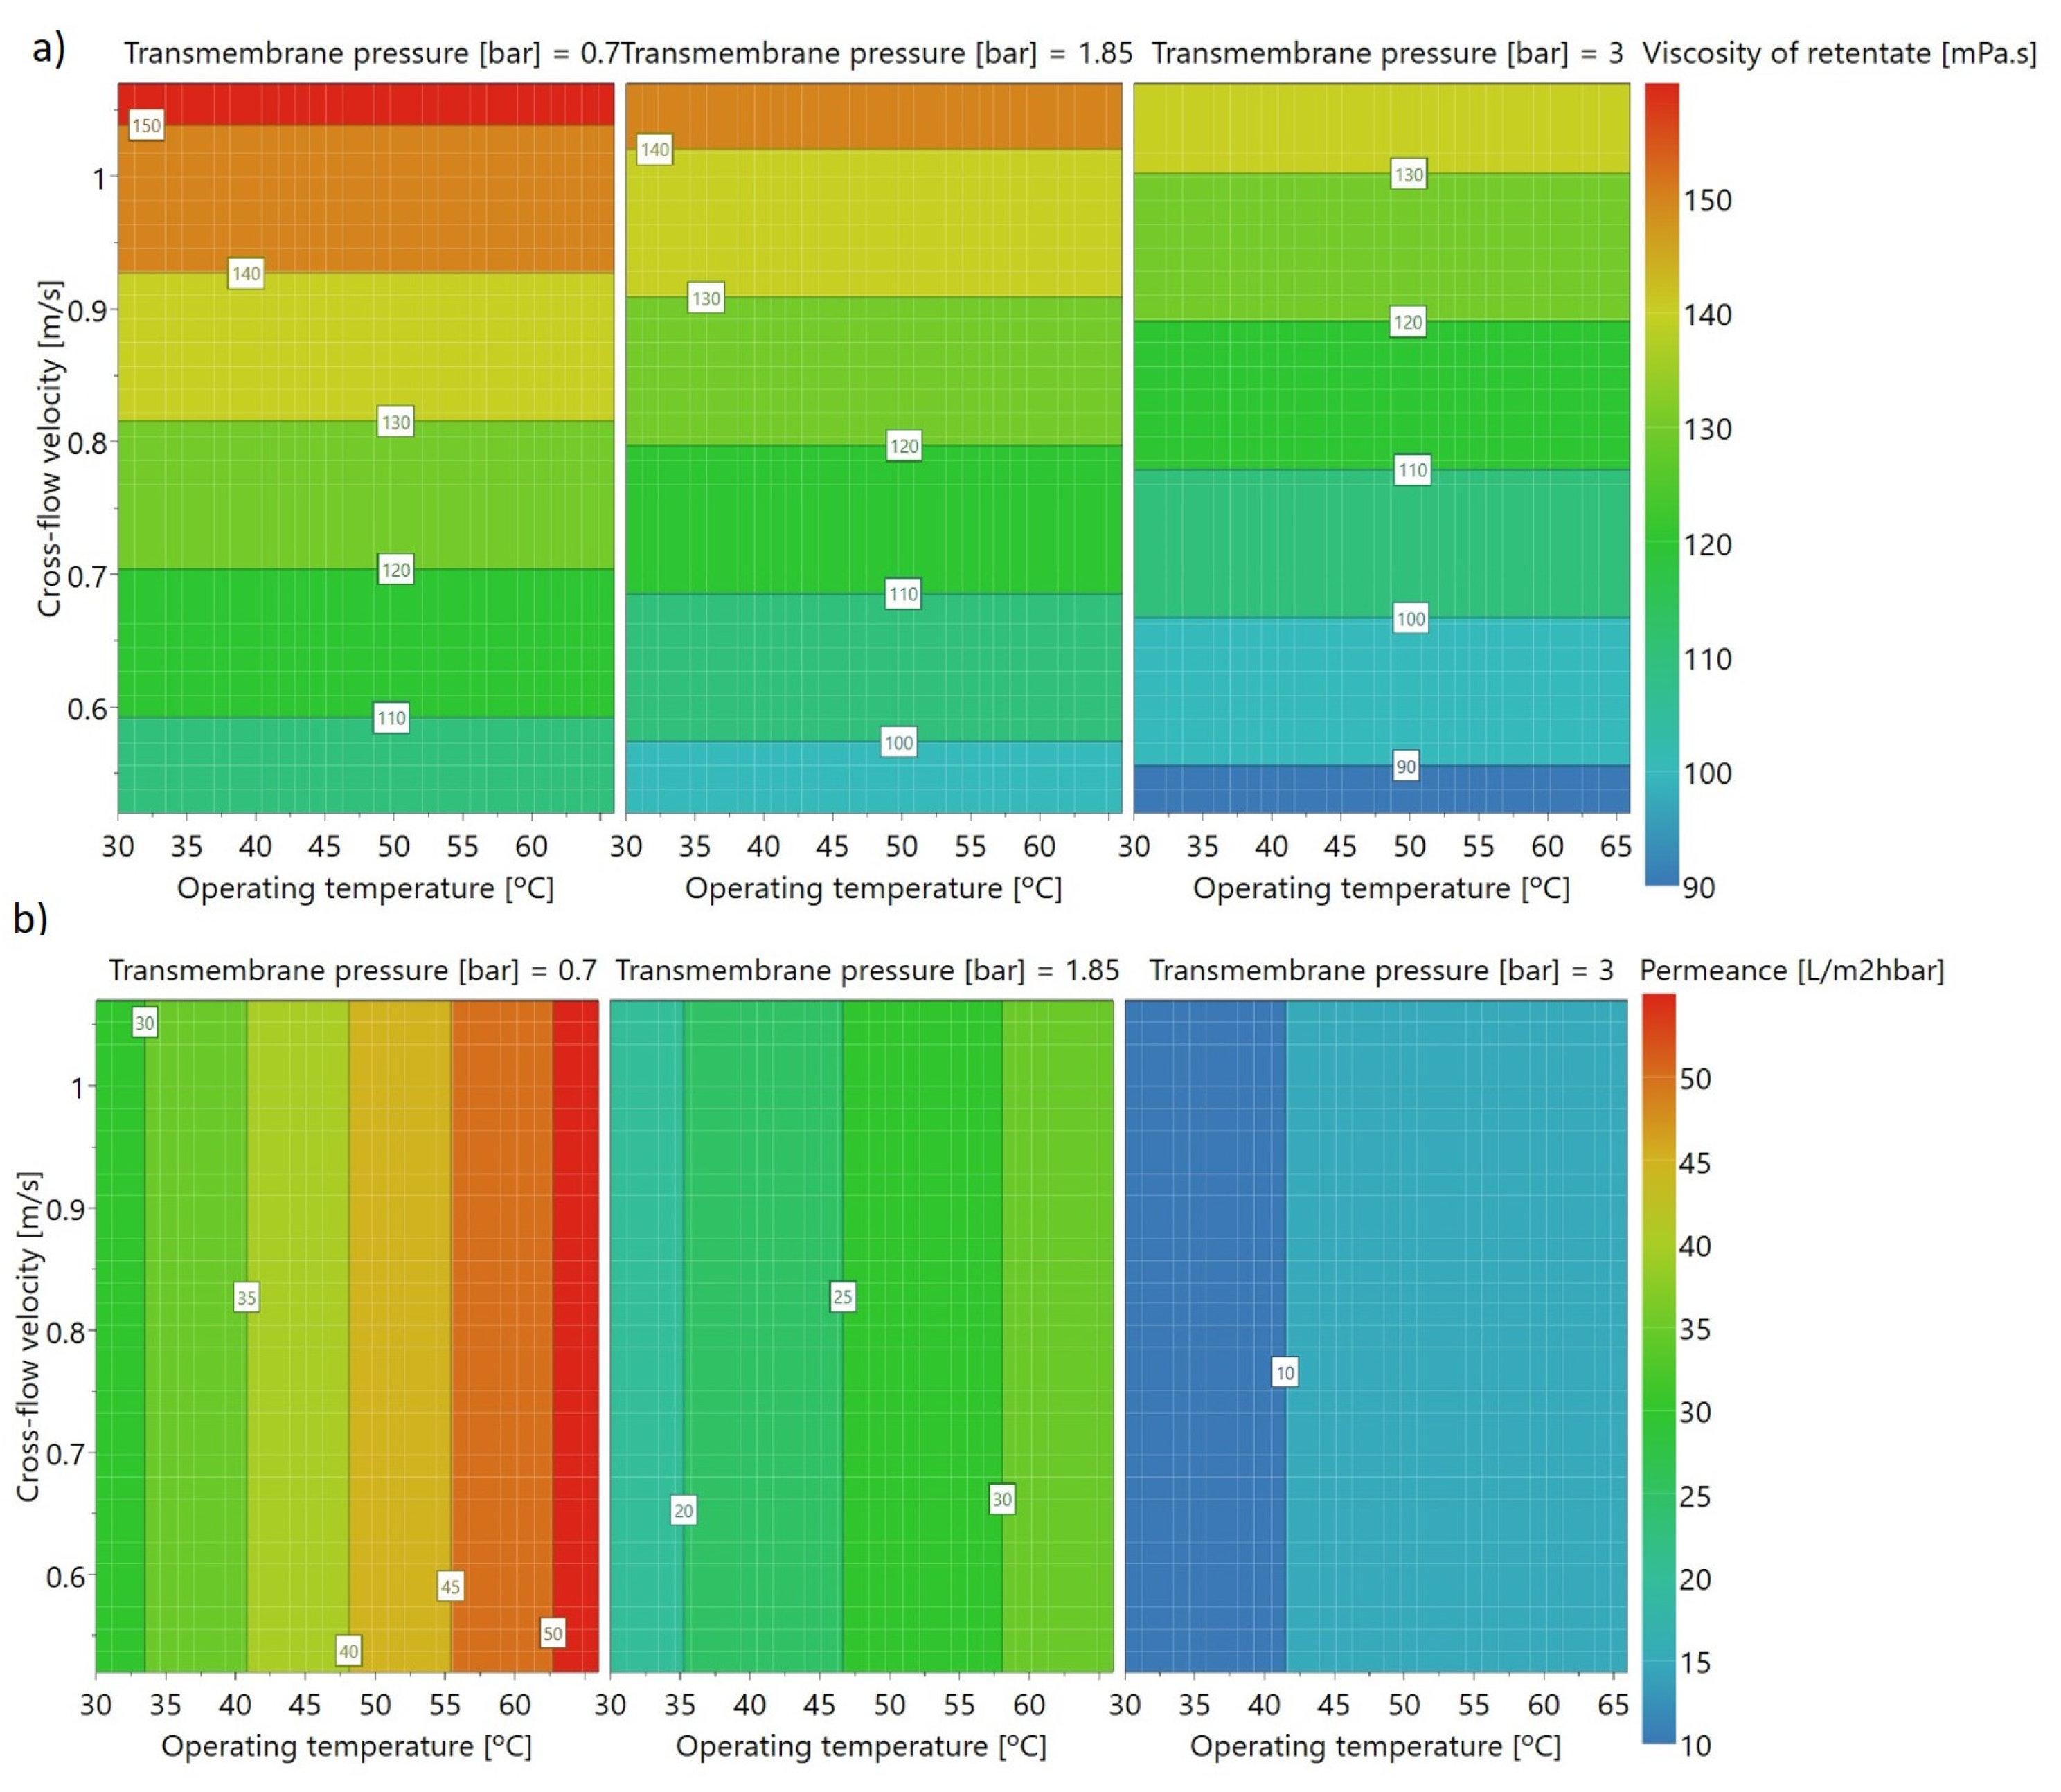
A visual evaluation of the model equations shows which ultrafiltration conditions lead to a higher permeance and a higher retentate viscosity (related to the concentration of arabinoxylans). Figure 8 shows contour plots for each model for different pressures. The contour plots show the interaction between the factors in each model and the predicted response.
As shown in the contour plots for apparent viscosity (in Figure 8a), a high final viscosity of the retentate (measured in the final of each experiment at 20 °C, and used as a measurement of the retention of arabinoxylans) is achieved with low transmembrane pressure and high initial crossflow velocity, independently of the operating temperature used during ultrafiltration (within the range of study), as also shown in Figure 6a. The contour plot for permeance shows that high permeance is achieved with high operating temperature and low transmembrane pressure, and it is independent of velocity (in the study range). These graphs allow us to conclude that the best conditions (high permeance and high retentate viscosity) are: high operating temperature (66 °C), high initial crossflow velocity (1.06 m.s−1), and low transmembrane pressure (0.7 bar). This result was confirmed by using the optimiser function of the MODDE software, set up to maximise these two factors, simultaneously. With this function it was possible to conclude that the transmembrane pressure is the main factor in achieving best conditions (46.3%), followed by the crossflow velocity (30.0%), and operating temperature (23.7%). As mentioned before, in this ultrafiltration system it was not possible to work in best conditions, as at high velocity the transmembrane pressure is higher than 0.7 bar. In the model, the transmembrane pressure had more impact than velocity, so a compromise has to be made between both the parameters, working at high velocity without much increase to the transmembrane pressure.
Furthermore, the same best conditions were shown using the two models assessed for viscosity (with and without experiment 7), showing that despite the dispersion of data obtained (which resulted in a lower quality model), the tendency is well described by the models, even when an experiment is excluded.

3.4. Model Validation

In order to validate the final model and ensure that its predictions were accurate, an additional experiment was performed at a temperature of 52 °C, an initial crossflow rate of 1.06 m.s−1, and a transmembrane pressure of 1.4 bar. Table 5 shows the model predictions, which were generated using the prediction function of the MODDE software, and values obtained for this experiment.
The models predict an apparent viscosity of retentate (µretentate) of 146.8 mPa.s and an average permeance of 33.3 m−2.h−1.bar−1 for the conditions used in this experiment. However, due to the errors associated with the experiments (shown through duplicates, experiments 9 and 10) plus the error associated with models fitting, the software used estimates each value within an interval (corresponding to an estimation error for each model), where the experimental observation should be (Table 5). Therefore, the results obtained experimentally are within the range of values predicted by the model in Table 5, proving the accuracy of the model.

4. Conclusions

With the aim of optimising the conditions needed to fractionate an alkaline extract from corn fibre, we assessed the most relevant operating parameters of an ultrafiltration process—membrane molecular weight cut-off, operating temperature, crossflow velocity, and transmembrane pressure. Out of the membranes tested, Nadir UP 150 (polyethersulfone with MWCO of 150 kDa) was found to be the best in terms of permeance, presenting no rejection of ferulic acid and a high estimated rejection of arabinoxylans (98.0% ± 1.7%). A response surface methodology (RSM) was used to infer the effect of temperature, crossflow velocity, and transmembrane pressure on the rejection of ferulic acid, retention of arabinoxylans (assessed through the retentate viscosity), and permeance. It was found that the ultrafiltration conditions (in the range tested) do not influence the global rejection of ferulic acid. The increase of transmembrane pressure showed a negative impact on the permeance and on the retention of arabinoxylans, while the temperature and crossflow velocity showed a positive impact on the permeance and on the retention of arabinoxylans retention, respectively.
Analysis of the two mathematical models developed to describe the retention of arabinoxylans (measured by apparent viscosity of retentate in the final of ultrafiltration) and permeance shows that it is possible to achieve the best conditions for ultrafiltration using the membrane Nadir UP 150, with an operating temperature of 66 °C, an initial crossflow velocity of 1.06 m.s−1, and a transmembrane pressure of 0.7 bar. This study allowed us to determine the best conditions for an efficient separation of ferulic acid from arabinoxylans and obtain a fraction rich in ferulic acid with low viscosity, due to the removal of the arabinoxylans, facilitating a further step for purification and concentration of ferulic acid through adsorption or by nanofiltration, for use in bio-vanillin production. A fraction with a high concentration of arabinoxylans was also produced, which could be used, for example, as a material for edible films [17,18] and emulsifier for oil-in-waters emulsion systems [19].
Therefore, the present work shows how to optimise an efficient separation method, based on ultrafiltration, for the recovery of both ferulic acid and arabinoxylans from a corn fibre alkaline extract, allowing an efficient valorisation of this co-product, increasing the overall sustainability of the corn wet milling process.

Author Contributions

Conceptualization, J.G.C., C.F.G. and C.B.; Formal analysis, R.V.; Investigation, R.V.; Methodology, R.V. and C.F.G.; Supervision, J.G.C. and C.B.; Visualization, C.F.G.; Writing—original draft, R.V.; Writing—review & editing, J.G.C., C.F.G. and C.B. All authors have read and agreed to the published version of the manuscript.

Funding

This research was funded by the Applied Molecular Biosciences Unit—UCIBIO, which is financed by national funds from FCT/MCTES, Portugal, (grants UIDP/04378/2020 and UIDB/04378/2020), by the Associate Laboratory for Green Chemistry—LAQV, which is financed by national funds from FCT/MCTES, Portugal, (grants UIDB/50006/2020 and UIDP/50006/2020) and by FCT/MCTES, Portugal, and COPAM—Companhia Portuguesa de Amidos, S.A. (Portugal), through PhD Fellow grant PD/BDE/113543/2015 (Rita Valério).

Acknowledgments

COPAM—Companhia Portuguesa de Amidos, S.A. (Portugal), is also acknowledged for providing the raw material (corn fibre).

Conflicts of Interest

The authors declare that they have no conflict of interest.

References

  1. Yadav, M.P.; Moreau, R.A.; Hicks, K.B. Phenolic Acids, Lipids, and Proteins Associated with Purified Corn Fiber Arabinoxylans. J. Agric. Food Chem. 2007, 55, 943–947. [Google Scholar] [CrossRef]
  2. Saha, B.C. Hemicellulose Bioconversion. J. Ind. Microbiol. Biotechnol. 2003, 30, 279–291. [Google Scholar] [CrossRef]
  3. Van Eylen, D.; van Dongen, F.; Kabel, M.; de Bont, J. Corn Fiber, Cobs and Stover: Enzyme-Aided Saccharification and Co-Fermentation after Dilute Acid Pretreatment. Bioresour. Technol. 2011, 102, 5995–6004. [Google Scholar] [CrossRef] [PubMed]
  4. Shin, H.-D.; McClendon, S.; Le, T.; Taylor, F.; Chen, R.R. A Complete Enzymatic Recovery of Ferulic Acid from Corn Residues with Extracellular Enzymes from Neosartorya Spinosa NRRL185. Biotechnol. Bioeng. 2006, 95, 1108–1115. [Google Scholar] [CrossRef]
  5. Akin, D.E.; Rigsby, L.L. Corn Fiber: Structure, Composition, and Response to Enzymes for Fermentable Sugars and Coproducts. Appl. Biochem. Biotechnol. 2008, 144, 59–68. [Google Scholar] [CrossRef]
  6. Srinivasan, M.; Sudheer, A.R.; Menon, V.P. Ferulic Acid: Therapeutic Potential Through Its Antioxidant Property. J. Clin. Biochem. Nutr. 2007, 40, 92–100. [Google Scholar] [CrossRef] [Green Version]
  7. Ou, S.; Kwok, K.C. Ferulic Acid: Pharmaceutical Functions, Preparation and Applications in Foods. J. Sci. Food Agric. 2004, 84, 1261–1269. [Google Scholar] [CrossRef]
  8. ElKhazendar, M.; Chalak, J.; El-Huneidi, W.; Vinod, A.; Abdel-Rahman, W.M.; Abu-Gharbieh, E. Antiproliferative and Proapoptotic Activities of Ferulic Acid in Breast and Liver Cancer Cell Lines. Trop. J. Pharm. Res. 2019, 18, 2571–2576. [Google Scholar] [CrossRef]
  9. Mathew, S.; Abraham, T.E. Characterisation of Ferulic Acid Incorporated Starch–Chitosan Blend Films. Food Hydrocoll. 2008, 22, 826–835. [Google Scholar] [CrossRef]
  10. Cao, N.; Fu, Y.; He, J. Mechanical Properties of Gelatin Films Cross-Linked, Respectively, by Ferulic Acid and Tannin Acid. Food Hydrocoll. 2007, 21, 575–584. [Google Scholar] [CrossRef]
  11. Gallage, N.J.; Møller, B.L. Vanillin–Bioconversion and Bioengineering of the Most Popular Plant Flavor and Its De Novo Biosynthesis in the Vanilla Orchid. Mol. Plant 2015, 8, 40–57. [Google Scholar] [CrossRef] [Green Version]
  12. Priefert, H.; Rabenshorst, J.; Steinbuchel, A. Biotechnological Production of Vanillin. Appl. Microbiol. Biotechnol. 2001, 56, 296–314. [Google Scholar] [CrossRef]
  13. Damásio, A.R.; Braga, C.M.; Brenelli, L.B.; Citadini, A.P.; Mandelli, F.; Cota, J.; De Almeida, R.F.; Salvador, V.H.; Paixao, D.A.; Segato, F.; et al. Biomass-to-Bio-Products Application of Feruloyl Esterase from Aspergillus Clavatus. Biotechonogically Relev. Enzym. Proteins 2013, 97, 6759–6767. [Google Scholar] [CrossRef]
  14. Lu, Z.X.; Walker, K.Z.; Muir, J.G.; Dea, K.O. Arabinoxylan Fibre Improves Metabolic Control in People with Type II Diabetes. Eur. J. Clin. Nutr. 2004, 4, 621–628. [Google Scholar] [CrossRef] [Green Version]
  15. Mendis, M.; Simsek, S. Arabinoxylans and Human Health. Food Hydrocoll. 2014, 42, 239–243. [Google Scholar] [CrossRef]
  16. Rose, D.J.; Patterson, J.A.; Hamaker, B.R. Structural Differences among Alkali-Soluble Arabinoxylans from Maize (Zea Mays), Rice (Oryza Sativa), and Wheat (Triticum Aestivum) Brans Influence Human Fecal Fermentation Profiles. J. Agric. Food Chem. 2010, 58, 493–499. [Google Scholar] [CrossRef]
  17. Péroval, C.; Debeaufort, F.; Despré, D.; Voilley, A. Edible Arabinoxylan-Based Films. 1. Effects of Lipid Type on Water Vapor Permeability, Film Structure, and Other Physical Characteristics. J. Agric. Food Chem. 2002, 50, 3977–3983. [Google Scholar] [CrossRef] [PubMed]
  18. Serra, M.; Weng, V.; Coelhoso, I.M.; Alves, V.D.; Brazinha, C. Purification of Arabinoxylans from Corn Fiber and Preparation of Bioactive Films for Food Packaging. Membranes 2020, 10, 95. [Google Scholar] [CrossRef] [PubMed]
  19. Cirre, J.; Al-Assaf, S.; Phillips, G.O.; Yadav, M.P.; Hicks, K.B. Improved Emulsification Performance of Corn Fibre Gum Following Maturation Treatment. Food Hydrocoll. 2014, 35, 122–128. [Google Scholar] [CrossRef]
  20. Torre, P.; Aliakbarian, B.; Rivas, B.; Domínguez, J.M.; Converti, A. Release of Ferulic Acid from Corn Cobs by Alkaline Hydrolysis. Biochem. Eng. J. 2008, 40, 500–506. [Google Scholar] [CrossRef]
  21. Tilay, A.; Bule, M.; Kishenkumar, J.; Annapure, U. Preparation of Ferulic Acid from Agricultural Wastes: Its Improved Extraction and Purification. J. Agric. Food Chem. 2008, 56, 7644–7648. [Google Scholar] [CrossRef]
  22. Zhao, S.; Yao, S.; Ou, S.; Lin, J.; Wang, Y.; Peng, X.; Li, A.; Yu, B. Preparation of Ferulic Acid from Corn Bran: Its Improved Extraction and Purification by Membrane Separation. Food Bioprod. Process. 2014, 92, 309–313. [Google Scholar] [CrossRef]
  23. Bauer, J.L.; Harbaum-Piayda, B.; Schwarz, K. Phenolic Compounds from Hydrolyzed and Extracted Fiber-Rich by-Products. LWT Food Sci. Technol. 2012, 47, 246–254. [Google Scholar] [CrossRef]
  24. Linh, T.N.; Fujita, H.; Sakoda, A. Release Kinetics of Esterified P-Coumaric Acid and Ferulic Acid from Rice Straw in Mild Alkaline Solution. Bioresour. Technol. 2017, 232, 192–203. [Google Scholar] [CrossRef]
  25. Ayala-Soto, F.E.; Serna-Saldívar, S.O.; Welti-Chanes, J. Effect of Processing Time, Temperature and Alkali Concentration on Yield Extraction, Structure and Gelling Properties of Corn Fiber Arabinoxylans. Food Hydrocoll. 2016, 60, 21–28. [Google Scholar] [CrossRef]
  26. Aguedo, M.; Fougnies, C.; Dermience, M.; Richel, A. Extraction by Three Processes of Arabinoxylans from Wheat Bran and Characterization of the Fractions Obtained. Carbohydr. Polym. 2014, 105, 317–324. [Google Scholar] [CrossRef]
  27. Kale, M.S.; Hamaker, B.R.; Campanella, O.H. Alkaline Extraction Conditions Determine Gelling Properties of Corn Bran Arabinoxylans. Food Hydrocoll. 2013, 31, 121–126. [Google Scholar] [CrossRef]
  28. Yadav, M.P.; Fishman, M.L.; Chau, H.K.; Johnston, D.B.; Hicks, K.B. Molecular Characteristics of Corn Fiber Gum and Their Influence on CFG Emulsifying Properties. Cereal Chem. 2007, 84, 175–180. [Google Scholar] [CrossRef] [Green Version]
  29. Liu, S.; Wang, B. Purification of Ferulic Acid from Wheat by Ultrafiltration Technology. Adv. Mater. Res. 2012, 527, 2294–2297. [Google Scholar] [CrossRef]
  30. Jorda, J.; Marechal, P.; Rigal, L.; Pontalier, P.Y. Biopolymer Purification by Ultrafiltration. Desalination 2002, 148, 187–191. [Google Scholar] [CrossRef]
  31. Jacquemin, L.; Mogni, A.; Zeitoun, R.; Guinot, C.; Sablayrolles, C.; Saulnier, L.; Pontalier, P.Y. Performance Evaluation of a Semi-Industrial Production Process of Arabinoxylans from Wheat Bran. Process Biochem. 2015, 50, 605–613. [Google Scholar] [CrossRef] [Green Version]
  32. Krawczyk, H.; Persson, T.; Andersson, A.; Jönsson, A.S. Isolation of Hemicelluloses from Barley Husks. Food Bioprod. Process. 2008, 86, 31–36. [Google Scholar] [CrossRef]
  33. Jacquemin, L.; Zeitoun, R.; Sablayrolles, C.; Pontalier, P.Y.; Rigal, L. Evaluation of the Technical and Environmental Performances of Extraction and Purification Processes of Arabinoxylans from Wheat Straw and Bran. Process. Biochem. 2012, 47, 373–380. [Google Scholar] [CrossRef] [Green Version]
  34. Kikhavani, T.; Ashrafizadeh, S.N.; Van Der Bruggen, B. Identification of Optimum Synthesis Conditions for a Novel Anion Exchange Membrane by Response Surface Methodology. J. Appl. Polym. Sci. 2014, 131, 1–16. [Google Scholar] [CrossRef]
  35. Pessoa Lopes, M.; Galinha, F.C.; Crespo, J.G.; Velizarov, S. Optimisation of Arsenate Removal from Water by an Integrated Ion-Exchange Membrane Process Coupled with Fe Co-Precipitation. Sep. Purif. Technol. 2020, 246. [Google Scholar] [CrossRef]
  36. Microdyn Nadir Nadir Catalogue. Available online: https://www.lenntech.com/Data-sheets/Microdyn-Product-catalogue-L.pdf (accessed on 21 April 2021).
  37. Merck KGaA Ultrafiltration Membranes. Available online: https://www.sigmaaldrich.com/content/dam/sigma-aldrich/docs/Sigma-Aldrich/General_Information/3/p99101w-ug-mk.pdf (accessed on 21 April 2021).
  38. Carvajal-Millan, E.; Landillon, V.; Morel, M.H.; Rouau, X.; Doublier, J.L.; Micard, V. Arabinoxylan Gels: Impact of the Feruloylation Degree on Their Structure and Properties. Biomacromolecules 2005, 6, 309–317. [Google Scholar] [CrossRef] [PubMed]
  39. Analytics, S.D. User Guide to MODDE, Version 12. Available online: https://blog.umetrics.com/hubfs/Download Files/MODDE 12.0.1 User Guide.pdf (accessed on 21 April 2021).
Figure 1. Experimental ultrafiltration (UF) set-up with a dead-end module.
Sustainability 13 04682 g001
Figure 2. Experimental ultrafiltration (UF) set-up of the crossflow rig. PI and FI refer to pressure transducer and flow rate sensor, respectively.
Sustainability 13 04682 g002
Figure 3. Evolution of permeance versus concentration factor (CF) for four different ultrafiltration membranes at 50 °C, pressure of 0.7 bar until a concentration factor of 7.
Sustainability 13 04682 g003
Figure 4. Image of the UP150 membrane at the end of the experiment at 50 °C, pressure of 0.7 bar until a concentration factor of 7 (all membranes present a similar gel layer).
Sustainability 13 04682 g004
Figure 5. Adsorption of ferulic acid and the main sugars (glucose, xylose, arabinose, and galactose) that constitute the structure of arabinoxylans for four different ultrafiltration membranes at 50 °C, pressure of 0.7 bar until a concentration factor of 7.
Sustainability 13 04682 g005
Figure 6. Regression coefficients (scaled and centred) of the model for (a) retention of arabinoxylans measured by the apparent viscosity of retentate and (b) average permeance ( P ¯ ), where the factors are operating temperature (Temp), transmembrane pressure (Pre), crossflow velocity (vel), and temperature multiplied by transmembrane pressure (Temp*Pre).
Sustainability 13 04682 g006
Figure 7. Model evaluation: (a) Summary statistics presented as four parameters (R2, Q2, Model validity, and Reproducibility) for the model of retention of arabinoxylans, measured by the apparent viscosity, and for permeance (b) observed data versus predicted values of apparent viscosity and permeance (experiments numbered as in Table 4).
Sustainability 13 04682 g007
Figure 8. Response contour plots of the model for (a) apparent retentate viscosity (as a measure of retention of arabinoxylans) (b) average permeance (in the range of 0.7 to 3 bar).
Sustainability 13 04682 g008
Table 1. Summary of membrane properties tested in this work, according to membrane suppliers.
MembraneManufacturerMaterialMWCO (kDa)Max.
Temperature
(°C)
pH
UP150Microdyn-Nadir [36]PES a150950–14
US100Microdyn-Nadir [36]PSH b100951–14
UH50Microdyn-Nadir [36]PESH c50950–14
PL seriesMerk-Millipore [37]RC d100502–13
a Polyethersulfone. b Hydrophilic Polysulfone. c Hydrophilic Polyethersulfone. d Regenerated Cellulose.
Table 2. Design of experiments (DoE)—full factorial design matrix, T (°C) is operating temperature, v i n i t i a l is the initial crossflow velocity (m.s−1), and Δp (bar) the transmembrane pressure.
Exp.T
(°C)
v i n i t i a l
(m.s−1)
Δp
(bar)
1300.600.7
2700.600.7
3301.070.7
4701.070.7
5300.603.0
6700.603.0
7301.073.0
8701.073.0
9500.801.9
10500.801.9
Table 3. Rejection of ferulic acid and of the four sugars present in arabinoxylans, estimated rejection of arabinoxylans and apparent viscosity of permeate and retentate, at the end of each experiment performed by dead-end ultrafiltration at 50 °C, pressure of 0.7 bar until a concentration factor of 7.
MembraneRferulic acid (%)Rglucose (%)Rxylose
(%)
Rarabinose
(%)
Rgactose
(%)
Raveragea
(%)
µretentate
(mPa.s)
µpermeate
(mPa.s)
UH50097.199.499.498.998.7 ± 1.1158.541.37
UP150095.699.299.198.198.0 ± 1.7126.51.35
US 100089.596.496.794.994.4 ± 3.3115.261.30
PL087.397.096.594.793.9 ± 4.585.541.34
a estimated rejection of arabinoxylans calculated by the averages of the rejections of the neutral sugars that constitute arabinoxylans.
Table 4. Design of experiments (DoE)—full factorial design matrix and the responses: global rejection of ferulic acid (Rferulic acid (%)), retention of arabinoxylans measured by apparent viscosity of retentate (µretentate (mPa.s)) and average permeance (L.m−2. h−1.bar−1).
Design of Experiments Responses
ExpT
(°C)
v i n i t i a l
(m.s−1)
Δp
(bar)
Rferulic acid (%)µretentate
(mPa.s)
P ¯
(L.m−2.h−1.bar−1)
1300.690.70115.733.5
2660.650.70105.552.8
3301.111.30164.317.2
4660.981.00131.349.5
5300.693.00113.98.8
6660.653.0094.614.8
7301.023.0098.410.3
8661.023.00140.317.0
9500.891.90153.519.9
10500.891.90130.722.7
Table 5. Model predictions (with estimation error) and values obtained experimentally for 52 °C, 1.06 m.s−1, and 1.4 bar.
µretentate
(mPa.s)
P ¯
(L.m−2.h−1.bar−1)
Model prediction146.8 ± 23.633.3 ± 4.2
Obtained experimentally123.829.7
Publisher’s Note: MDPI stays neutral with regard to jurisdictional claims in published maps and institutional affiliations.

