Article

Moving Consumers along the Innovation Adoption Curve: A New Approach to Accelerate the Shift toward a More Sustainable Diet

1
Nofima AS, N-1431 Ås, Norway
2
NORSUS, N-1671 Kråkerøy, Norway
3
Consumption Research Norway (SIFO), Oslo Metropolitan University, N-0130 Oslo, Norway
4
Faculty of Health Science, Oslo Metropolitan University, N-0130 Oslo, Norway
*
Author to whom correspondence should be addressed.
Sustainability 2021, 13(8), 4477; https://doi.org/10.3390/su13084477
Submission received: 3 March 2021 / Revised: 9 April 2021 / Accepted: 13 April 2021 / Published: 16 April 2021
(This article belongs to the Section Sustainable Food)

Abstract

:
Unsustainable food production and consumption contribute to greenhouse gas emissions and global warming. Adopting a more plant-based diet has been identified as a necessary change toward a more sustainable food system. In response to the call for transdisciplinary research on the sustainability of food consumption, this exploratory study combined consumer science, nutrition and health, sustainability research, and innovation to develop a new approach that can accelerate the shift toward a more sustainable diet. Quantitative data on the eating habits and attitudes of 1785 consumers was combined with data on environmental impacts via a life cycle assessment for different consumer segments. We studied the sustainable dietary shift using the diffusion of innovation theory, as well as qualitative and quantitative approaches. We identified and characterized seven consumer segments and related habits and attitudes toward an increase in plant-based foods and meat reduction. The nutritional quality and the environmental footprint of the segments’ dinners showed large differences. The results indicate that moving consumers along the innovation adoption curve with targeted interventions can reduce the environmental footprint of people’s diets and improve dietary health. We also discussed the value of user-centric innovation tools for the translation of insights into interventions by working with personas.

1. Introduction

The food value chain—from production, processing, distribution, and retail to consumption—is among the largest drivers of global environmental change [1]. Food production contributes up to 20–30% of the global climate change, and constitutes 26% of the primary energy consumption [2,3]. Efforts to reduce the environmental effects of animal husbandry and food systems include shifting to more environment-friendly agriculture, shortening food supply chains, and encouraging people to eat more plant-based foods. Norway has committed to reducing greenhouse gas (GHG) emissions by 40% by 2030 under the Paris Agreement. In its Klimakur 2030 report, the Norwegian Environment Agency [4] suggested reducing the intake of red meat and increasing the consumption of plant-based foods and fish; this dietary transition could reduce CO2 equivalents by 2.9 million tons between 2021 and 2030.
Consumers play a vital role in this transition, as their food choices determine consumption and production patterns, which in turn influence humans’ environmental footprint. However, changing people’s eating behavior is difficult because food is embedded in personal and social values, family tradition, individual knowledge, tastes and preferences, and other multifaceted barriers to and motivations for change [5,6]. Food-related practices cross disciplinary boundaries and call for integrated approaches [5]. No one-size-fits-all approach will increase people’s consumption of plant-based foods. To successfully develop interventions for changing food-related behavior, the consumers’ characteristics must be considered, for instance, by segmenting consumers according to certain values and attributes [7].
Recent studies have focused on the system level of change (transition theory), on individual behaviors (behavioral theory), or on dietary/nutritional interventions [8,9,10]. We need to understand how interventions and innovations can be developed to target specific consumer segments and improve compliance with dietary advice and behavioral changes. Most scientific articles on transitioning to a more plant-based diet omit the human-centric innovation perspective. The present study used the diffusion of innovation theory [11] to illustrate how knowledge of different consumer segments’ characteristics could increase adoption of plant-based food. This approach was exemplified through method triangulation within a case study research design. We used the characteristics of the innovation adopter categories defined by Rogers [11], supported by qualitative consumer insights to construct and develop representative consumers (i.e., personas). We verified these personas through a cluster analysis of quantitative consumer survey data to identify the characteristics of different Norwegian consumer segments (i.e., their eating habits and attitudes toward a sustainable diet) and to calculate the nutritional quality and environmental footprint of their preferred diets. This inductive and explorative work aims to present and apply a new concept for developing interventions and innovations that accelerate the adoption of a plant-based diet. Its conceptual framework is based on the diffusion of innovation theory and empathic consumer understanding.

1.1. Consumer-Centric Innovation and Diffusion of Innovation

Asking people what they want will not lead to deep insights or specific innovations [12]. This is why consumer-centric methodologies in research and innovation are gaining popularity; they help researchers not only understand patterns and behaviors, but also develop solutions that can improve people’s lives [13,14]. Personas are an important tool for human-centric innovations because they are characters synthesized from qualitative insights to represent groups of people with similar needs, habits, values, and perspectives; often, they are used to support innovation activities [15]. They originated in user-centered design [16] but are also frequently used in marketing to target specific segments or communicate certain images [17,18]. Personas can summarize and structure consumer insights and communicate research results empathically, helping product developers understand their target group [19].
Consumers adapt differently to new technologies or trends. The diffusion of innovation theory explains the process by which innovations, new ideas, or practices (such as new eating patterns) spread in social systems [11]. For an innovation to be self-sustaining, it must be widely adopted in a community. The present study investigated “the adoption of a plant-based diet and the reduction of meat consumption” as an innovation. Diffusion of innovation is assumed to follow a normal distribution, with the following five adopter categories, or classifications, of individuals within a social system based on their innovativeness: innovator, early adopter, early majority, late majority, and laggards [11].
Targeted communication and other interventions can accelerate the diffusion of innovation and achieve a higher adoption rate among people who are normally late to adopt a new idea [20] (see Figure 1). With this backdrop, we studied the progressive adoption of plant-protein-rich diets through the diffusion of innovation theory, and proposed a new approach for accelerating the innovation adoption of plant-based diets.
Because many food companies want to launch new plant-based products successfully, the diffusion of innovation can provide a valuable tool for targeting specific segments with tailored products and messages. However, some scholars have highlighted the absence of studies on the diffusion of innovation as a segmentation approach to transition to more sustainable food systems. Szejda et al. [21] stated that using the diffusion of innovation framework to develop comprehensive profiles of early adopter and early majority segments would be especially helpful for targeting groups most open to change.

1.2. Consumer Attitudes, Barriers, and Motivations Concerning a More Sustainable Diet

Research on the success of innovation has shown that consumers do not adopt over 67% of innovative offers; also, even if an idea is innovative, it fails during market diffusion and adoption [22]. Specifically, consumers’ acceptance of food innovations can be linked to the perceived value, risk, or innovation [23]. Plant-based foods are new and innovative for many consumers and the acceptance is influenced by environmental expectations, the perception of naturalness, functional and economic values, and social risks [24].
In Norway, interest in reducing meat consumption and increasing the intake of vegetarian food has increased among women since 2013 and among men since 2015 [25]. The identified facilitators for a transition to a diet with less meat and more plant-based foods are positive health effects, awareness of the environmental impact of meat consumption, concern for animal welfare, concern for the provenance and traceability of meat, knowledge of meat alternatives, and perceived ease of cooking and availability of plant-based foods [26,27]. However, Austgulen et al. [28] found that many Norwegian consumers are hesitant to change their diet for environmental reasons. De Boer et al. [29] and Graça et al. [24] also highlighted that large segments of consumers globally do not want to include more plant-based foods in their diets because they are attached to meat and unwilling to change their habits.
Consumer segments differ in their willingness to change their eating habits or behaviors [30]. Consumers who resist dietary changes may have strong views, ingrained habits, or low food interest; they are difficult to reach with information or strategies aimed at behavioral change [31,32]. However, consumers who embrace dietary changes are generally open to new ideas, are in a period of transition, or have high food interest and are more receptive to nudges and changes to their dietary practices [33,34]. Lately, in addition to price, taste, convenience, and health, sustainability has increased in importance as a factor for consumers’ food choices [35,36,37]. The importance of these factors for food behavior varies between consumer segments.
A good strategy for changing food practices in the population is to approach groups that are more likely to change, thus shifting the weight (of practices, attention, and acceptability) in the desired direction [38]. Changing practices among responsive consumer segments (i.e., early adopters and early majority) requires knowing which motivators and barriers are particular to these segments. Verain et al. [7] suggested three consumer segments based on their review of 16 studies: green, potential green, and non-green. These three segments differ in personality characteristics, food-related lifestyles, and behavioral variables. This segmentation is of relatively low resolution, and better information about Norwegian consumers is needed to develop targeted interventions.

1.3. Diet and Environmental Sustainability

Although many sustainability studies on food products and meals have been undertaken, studies of diets provide a more holistic picture of the environmental impact of foods since we do not eat only a food product or a meal, but an entire diet. Scarborough et al. [39] studied the effect of vegan, vegetarian, pescatarian, and meat-based diets on the climate. They found the climate impact to vary between 2.9 kg CO2-eq/day for vegetarians and 5.6 kg CO2-eq/day for regular meat eaters. A review of 21 studies confirmed this trend while also uncovering regional variances [40]. The average American, Northern European, and Western European diets were found to have high impacts on the climate, whereas Mediterranean and Atlantic diets were found to have low impacts and high nutritional content. Regional plant-rich diets (e.g., Indian and Peruvian diets) showed low climate impact. The study concluded that decreased consumption of ruminant meats and dairy products and increased consumption of plant foods could significantly reduce human diets’ environmental impacts. Pork and poultry have lower impacts than ruminant meat and could be good alternatives. Similar tendencies in land and water use, two important environmental parameters when comparing the impact of different diets, were found [41]. In addition to the abovementioned diets, the so-called new Nordic diet, based on local fresh food from Nordic countries in Europe, showed approximately 10% lower impact on the climate than the average diet. Other strategies to reduce impacts on the climate included partially replacing meat with dairy products, which slightly reduced GHG emissions; following health guidelines; and further optimizing a diet. However, generalizations must be avoided. Rosi et al. [42] found high variability between consumer groups, and some vegetarians and vegans had diets with higher environmental impacts than some meat eaters. The study, however, was based on 153 subjects only.
A study of 10,000 consumers [43] identified the following seven groups based on their reported daily diets: vegan, vegetarian, pescatarian, omnivorous, and diets excluding either red meat, beef, or pork. The no-pork group had the highest impact on the climate (3.2 kg CO2-eq/FU), followed by the omnivorous (2.3 kg CO2-eq/FU), pescatarian (1.4 kg CO2-eq/FU), no-beef (1.3 kg CO2-eq/FU), no-red-meat (1.2 kg CO2-eq/FU), vegetarian (1.0 kg CO2-eq/FU), and vegan (0.96 kg CO2-eq/FU) groups. The functional unit (FU) is the amount of food containing 837 kcal; thus, the collected data were corrected so that each individual consumed food with similar total energy content.
One important outcome of existing studies is that different food products (or meals or diets) often have different environmental impacts while fulfilling the same nutritional function. This highlights the need to quantify the function of food (e.g., through nutrient scores) before comparing products, meals, or diets. Our study provides the actual environmental impact of dinner diets for segments of Norwegian consumers and suggests possible interventions.

2. Materials and Methods

This study’s overall approach and conceptual framework is illustrated in Figure 2. We combined qualitative and quantitative consumer insights, developed consumer segments, and analyzed each segment’s diet, environmental impact, and attitudes toward and barriers against eating more plant-based food and less meat. We placed each segment along the innovation adoption curve and suggested segment-specific interventions. This is further explained in Section 2.1, Section 2.2, Section 2.3, Section 2.4 and Section 2.5.

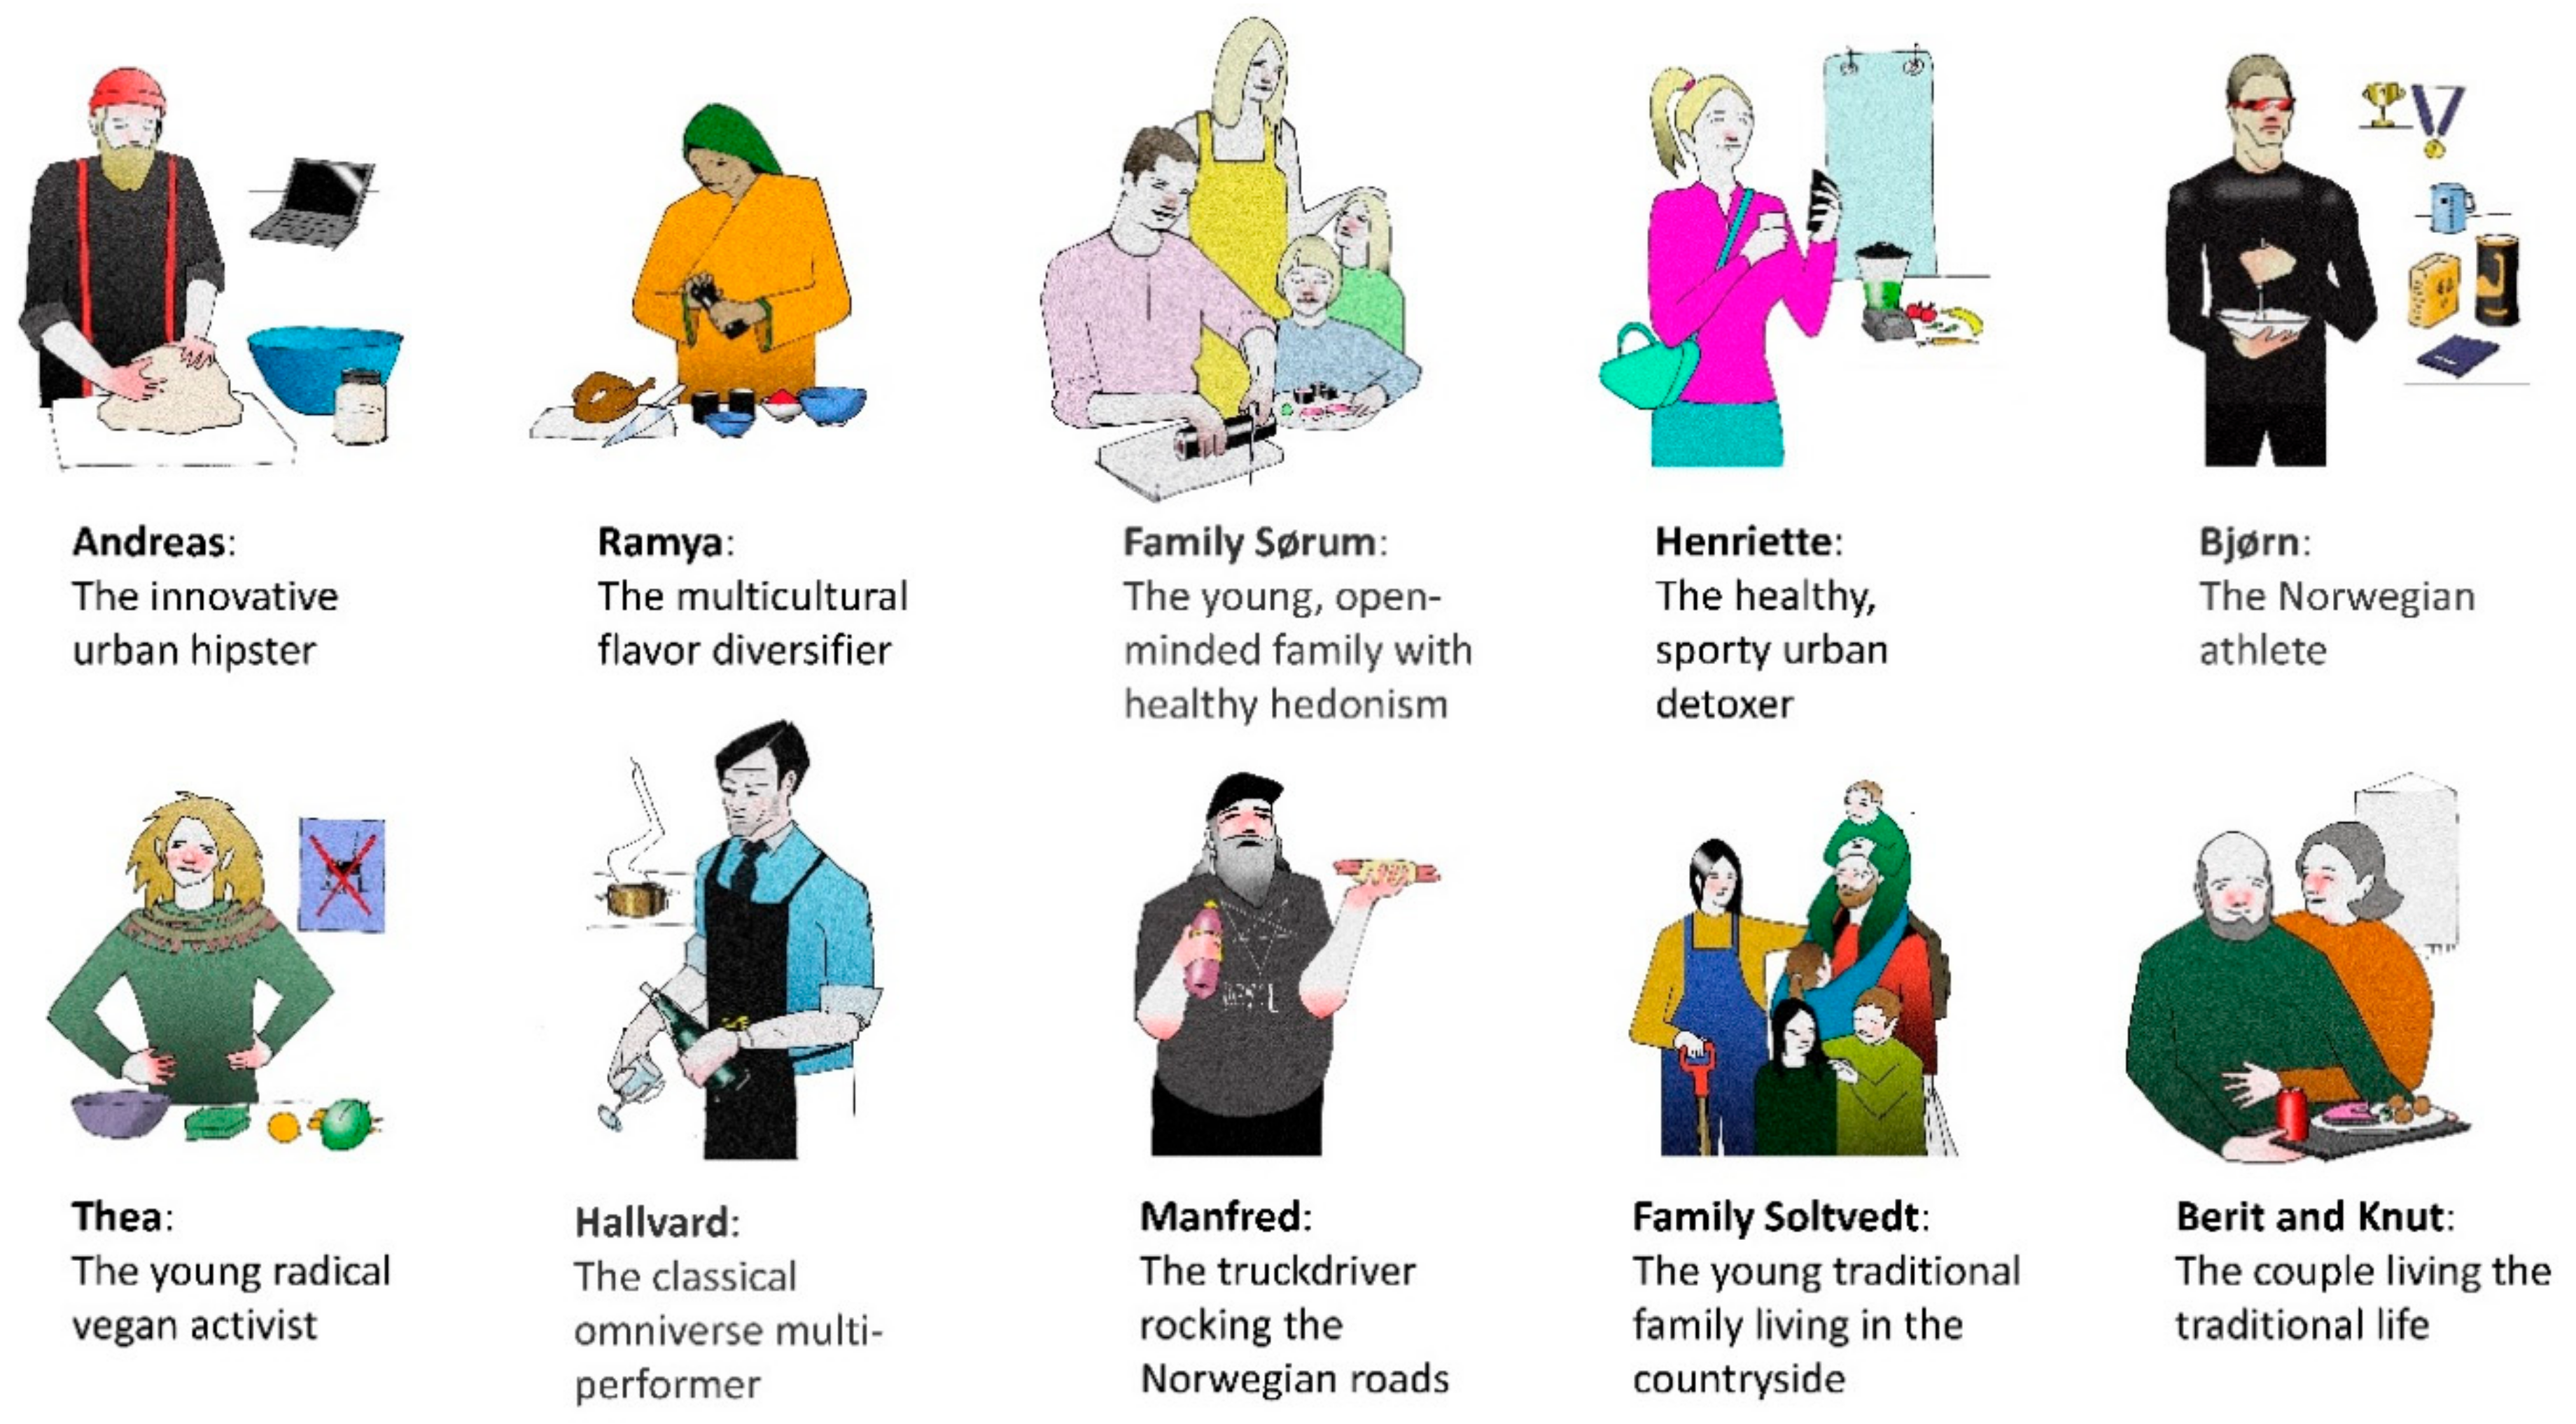
2.1. Development of the Personas and Innovation Workshops

The personas were developed in the Norwegian project FoodProFuture, whose goal is the increased production and utilization of plant protein bioresources that will lead to a desirable shift to more healthy and sustainable plant-based diets. Between the summer of 2017 and the fall of 2019, we collected, evaluated, and combined data from focus groups, consumer observations, expert interviews, literature review, and desk research (e.g., market studies and reports). The following elements were incorporated into the personas: demographics (age, education, family, geography, income); personal values; attitudes toward sustainability, health, and meat consumption; cultural heritage; openness to innovation; and everyday needs and challenges. Existing Norwegian consumer value segments [25] and Schwartz’s theory of basic values [44] were also incorporated. Each persona was first described in text and by a mood board, and then transformed into an illustration by a professional designer (Figure 3). Empathy maps [16] were used to discuss the emotional level, needs, and barriers for each persona, and their descriptions were revised. The work was carried out in four co-creative workshops with innovation researchers, designers, consumer researchers, food scientists, and technologists. We deliberately developed the personas to represent a broad spectrum of consumers and their characteristics along the innovation adoption curve [11].

2.2. Consumer Survey

A quantitative web-based survey was used to investigate consumers’ characteristics, attitudes, barriers, and motivations concerning the reduction of meat consumption and the increase in plant protein consumption. The consumer survey was developed by SIFO (Consumption Research Norway) and administered, controlled, and adjusted by Norstat (a Norwegian market research agency). Norstat does not practice self-recruitment. The data from 1785 respondents were collected in May 2018, and the response rate was 24%. Seven outliers were removed during the analysis. The respondent selection was approximately representative for Norway, and the data were weighted for gender, age (18–34, 35–49, 50–64, and 65–79 years), and region (north, middle, west, east, south, and Oslo) to correct for sample deviation (see the comprehensive table of survey statistics in Appendix A, Table A2). The details of the survey and the results were published in a Norwegian report [45]; segmentation analysis was not part of that report. The variables selected for this paper were demographic characteristics, food frequencies for main food groups used for dinner in Norway, statements on perception, liking and purchase of foods, reasons for increasing or decreasing food groups (health, environmental, animal welfare), and environmental concerns. In the context of this study, dinner is the most relevant meal to study from analytical and empirical perspectives, as meat is the main component of dinners in Norway, and dinner is the main meal [46].

2.3. Segmentation of Consumer Groups

A k-means cluster analysis based on food-related aspects was used to identify consumer segments in the study population. As the aim of the survey was related to understanding meat and plant protein consumption, this is reflected in the variables selected for analysis. Because the dataset contained numerous variables of interest, many of which could be multicollinear, we first performed a factor analysis (maximum likelihood, direct oblimin) to merge similar variables to use in the cluster analysis [47]. Five out of nine factors from the factor analysis were carefully selected as input variables for the cluster analysis, together with six single variables (Appendix A, Table A1). After thoroughly analyzing the clusters, we formed seven clusters, which gave the most meaningful and distinct clusters of k = 6–10. The z-scores were calculated for each variable to standardize the results and for ease of interpretation [48]. Next, a one-way analysis of variance and cross tables were used to profile and describe the clusters (IBM SPSS Statistics, Version 26).

2.4. Diet Composition

We estimated the composition of each consumer segment’s diet based on food frequency intakes of food groups normally used for dinner in Norway. Data were collected for the intake of beef, pork, lamb/mutton, poultry, seafood, fruits/vegetables, beans, chickpeas, and lentils (never, less often, 1–2 days a week, 3–4 days a week, 5–7 days a week). Since food intake was not reported as portions or in grams, we had to estimate weekly intake based on average serving sizes of these foods in Norway: for meat and fish, the serving size was 150 g; for beans, chickpeas, and lentils, it was 80 g [49].

2.5. Life Cycle Assessment

The environmental impact of the food consumed for dinner was analyzed using life cycle assessment (LCA) results from Svanes [50], who conducted the LCA of food from the production to the primary processing plant. The assessment was expanded into a full cradle-to-grave study by including product waste in the value chain. Impacts of transporting, storing (by retailers, wholesalers, and consumers), and preparing the food were excluded because they were assumed to be similar for different products. Impacts from packaging and secondary processing were also excluded because the large number of products made inclusion impossible. The diet composition was normalized according to energy content by adjusting the intake for all clusters in the following way:
Normalized food amount (cluster i) = original amount × normalization factor (cluster i).
Normalization factor (cluster i) = total dinner energy intake (average)/total dinner energy intake (cluster i)
This way, the overall energy intake was equal in all clusters. Results are expressed as impact per week. This calculation does not reflect the nutritional content of each cluster’s diet. To account for that, results were divided by a factor representing the nutrient content of the diets. We used NRF12.3mass, a modified version of the nutrient index 9.3 as described by Drewnowski [51]. The NRF12.3mass index is calculated in the same way as NRF9.3 but contains the following nutrients in addition to NRF9.3mass: iodine, vitamin D, and folate. Furthermore, it is based on 100 g of product, rather than on the amount of product containing 100 kcal, as used in NRF9.3.

3. Results and Discussion

The results presented and discussed in this section exemplify how the conceptual framework allows the understanding of complex aspects that are important in reducing meat consumption and increasing the intake of plant-based food, as well as in implementing new strategies for innovation adoption purposes.

3.1. Consumer Segments

We identified seven consumer segments based on the cluster analysis. The segments had different food intakes and attitudes and were named to reflect their characteristics (Table 1). The smallest segment was the Flexitarians (6%), characterized by consumers who often ate vegetarian meals, seldom ate meat and fish, and were concerned about the environment and animal welfare. The segment Open to vegetarian foods (16%) had an average intake of meat and fish but were also concerned with the environment and animal welfare and were willing to reduce their meat intake, confirming other studies’ results [36]. The Piscivores (11%) consumed fish most often and were most concerned with nutrition. The Processed food eaters (18%) had a low vegetable intake and ate more processed foods but were interested in reducing meat and dairy for environmental and animal welfare reasons. The Omnivores (18%) consumed the most meat and fish but did not stand out in other aspects. The Conservatives (18%) were the least interested in vegetarian foods and in reducing meat and fish for environmental reasons. Finally, the Carnivores (14%) consumed meat most often and had the least interest in vegetarian foods, nutrition, or reducing meat for environmental or animal welfare reasons.
Further analysis of the segments showed that they had significantly different demographic characteristics, such as sex, age, education, household, and geographical affiliation (for detailed results, see Appendix A, Table A2). Females dominated the Flexitarians (79%) and Open to vegetarian foods (62%) segments, while males dominated in Carnivores segment (69%). The older age groups (50+) were overrepresented in Piscivores the (78%) and Conservatives (68%). Single households were underrepresented among Piscivores (20%) and Conservatives (21%), while Flexitarians (38%) and Carnivores (35%) had the highest representation of singles. The Flexitarians lived mostly in urban areas (62%), whereas Carnivores lived in small towns or rural areas (66%).
All segments selected taste most often as a reason for food purchase (78%; see Figure 4); otherwise, they differed significantly when choosing which aspects they considered important when buying food, confirming the results of Parry and Mitchell [52]. The variable “organically produced” was least selected (11%), although 40% of the Flexitarians selected it. The Processed food eaters, Omnivores, and Conservatives did not score highest or lowest on any of the variables. The Flexitarians and Carnivores were opposites regarding what is important when buying food and scored highest or lowest on almost all variables. The Open to vegetarian foods and Piscivores were similar to the Flexitarians, whereas the Conservatives were more like the Carnivores.
Elements of high importance for food purchase offer an intervention point for promoting plant-based diets. The results showed that price was an important motivator for the Open to vegetarian foods, Processed food eaters, Omnivores, and Carnivores segments; easy and fast preparation was important for the Processed and Carnivores segments; and familiarity was important for all except the Flexitarians and Open segments. Product freshness was a motivator for the Open, Piscivores, Omnivores, and Conservatives segments. Organic production was of low importance for all segments, particularly for the Carnivores, although the Flexitarians and Open segments seemed more interested in it. The environment, animal welfare, and new and exciting flavors were not important for the Conservatives and Carnivores.
Some respondents stated they would decrease their beef or pork intake, and we asked them to indicate why. Most mentioned their own health as the main reason (mean 74%), followed by environmental reasons (mean 49%) and animal welfare (mean 34%). This is in line with the findings of Verain et al. [53]. The Flexitarian and Open segments cited the environment (84% and 73%, respectively) and animal welfare (82% and 52%, respectively) more than the other segments.
There were significant differences between the segments when the respondents were asked whether they exchanged some meat with vegetables (p < 0.001, Pearson chi-square 547.378, df = 24) or grains (p < 0.001, Pearson chi-square 387.815, df = 24) when they prepared dishes. Similarly, there were significant differences between the segments when asked whether they bought meatballs (p < 0.001, Pearson chi-square 297.645, df = 24) or stews (p < 0.001, Pearson chi-square 280.154, df = 24) where some meat was exchanged with vegetables. In all instances, the Flexitarians exchanged meat most often, followed by the Open and Piscivores segments. When asked whether they had tried new vegetarian alternatives, 76% of the Flexitarians had done so several times, and only 4% had never tried. On the other hand, only 3% of the Conservatives had tried several times, and 73% had never tried (p < 0.001, Pearson chi-square 468.852, df = 24).

3.2. Comparison of the Segments with Personas and the Innovation Adoption Curve

We placed the segments along the innovation adoption curve [11] according to the segment characteristics presented in Table 1 and Figure 4. The following items were considered: actual meat consumption, interest in plant-based food, wish to reduce meat and dairy intake for environmental reasons, preference for familiar products, preference for new and exciting flavors, wish to reduce intake of beef, wish to increase intake of legumes, and adoption of vegetarian alternatives. Figure 5 shows that the segment sizes correspond approximately with the adopter categories. The Flexitarians aligned best with the innovator categories, while the Open to vegetarian foods segment aligned with the early adopters. Both segments considered new and exciting flavors, animal welfare, health and nutrition, and the environment as important factors when choosing food. The Open to vegetarian foods segment, however, was more concerned about prices. The Piscivores and Processed food eaters segments aligned with the early majority group, while the Omnivores and Conservatives segments aligned with the late majority group. The Carnivores matched with the laggards with regard to adopting plant-based food.
The personas best describing the segments are Andreas and Thea, who matched the Flexitarians; Henrikke, who matched the Open segment; Berit and Knut, who matched the Conservatives; and Manfred, who matched the Carnivores. However, the segments and the personas did not completely overlap. The segments were based only on food-related aspects, whereas the personas included other characteristics, such as cultural background and personal lifestyle. Thus, the original personas should be modified in the next step to include information that represents the segments better. New personas can be developed to describe the segments more appropriately; they can be used as improved versions for innovation activities. This highlights the iterative character of our approach and the value of combining qualitative and quantitative data to understand consumers and develop innovation opportunities that accelerate adoption.

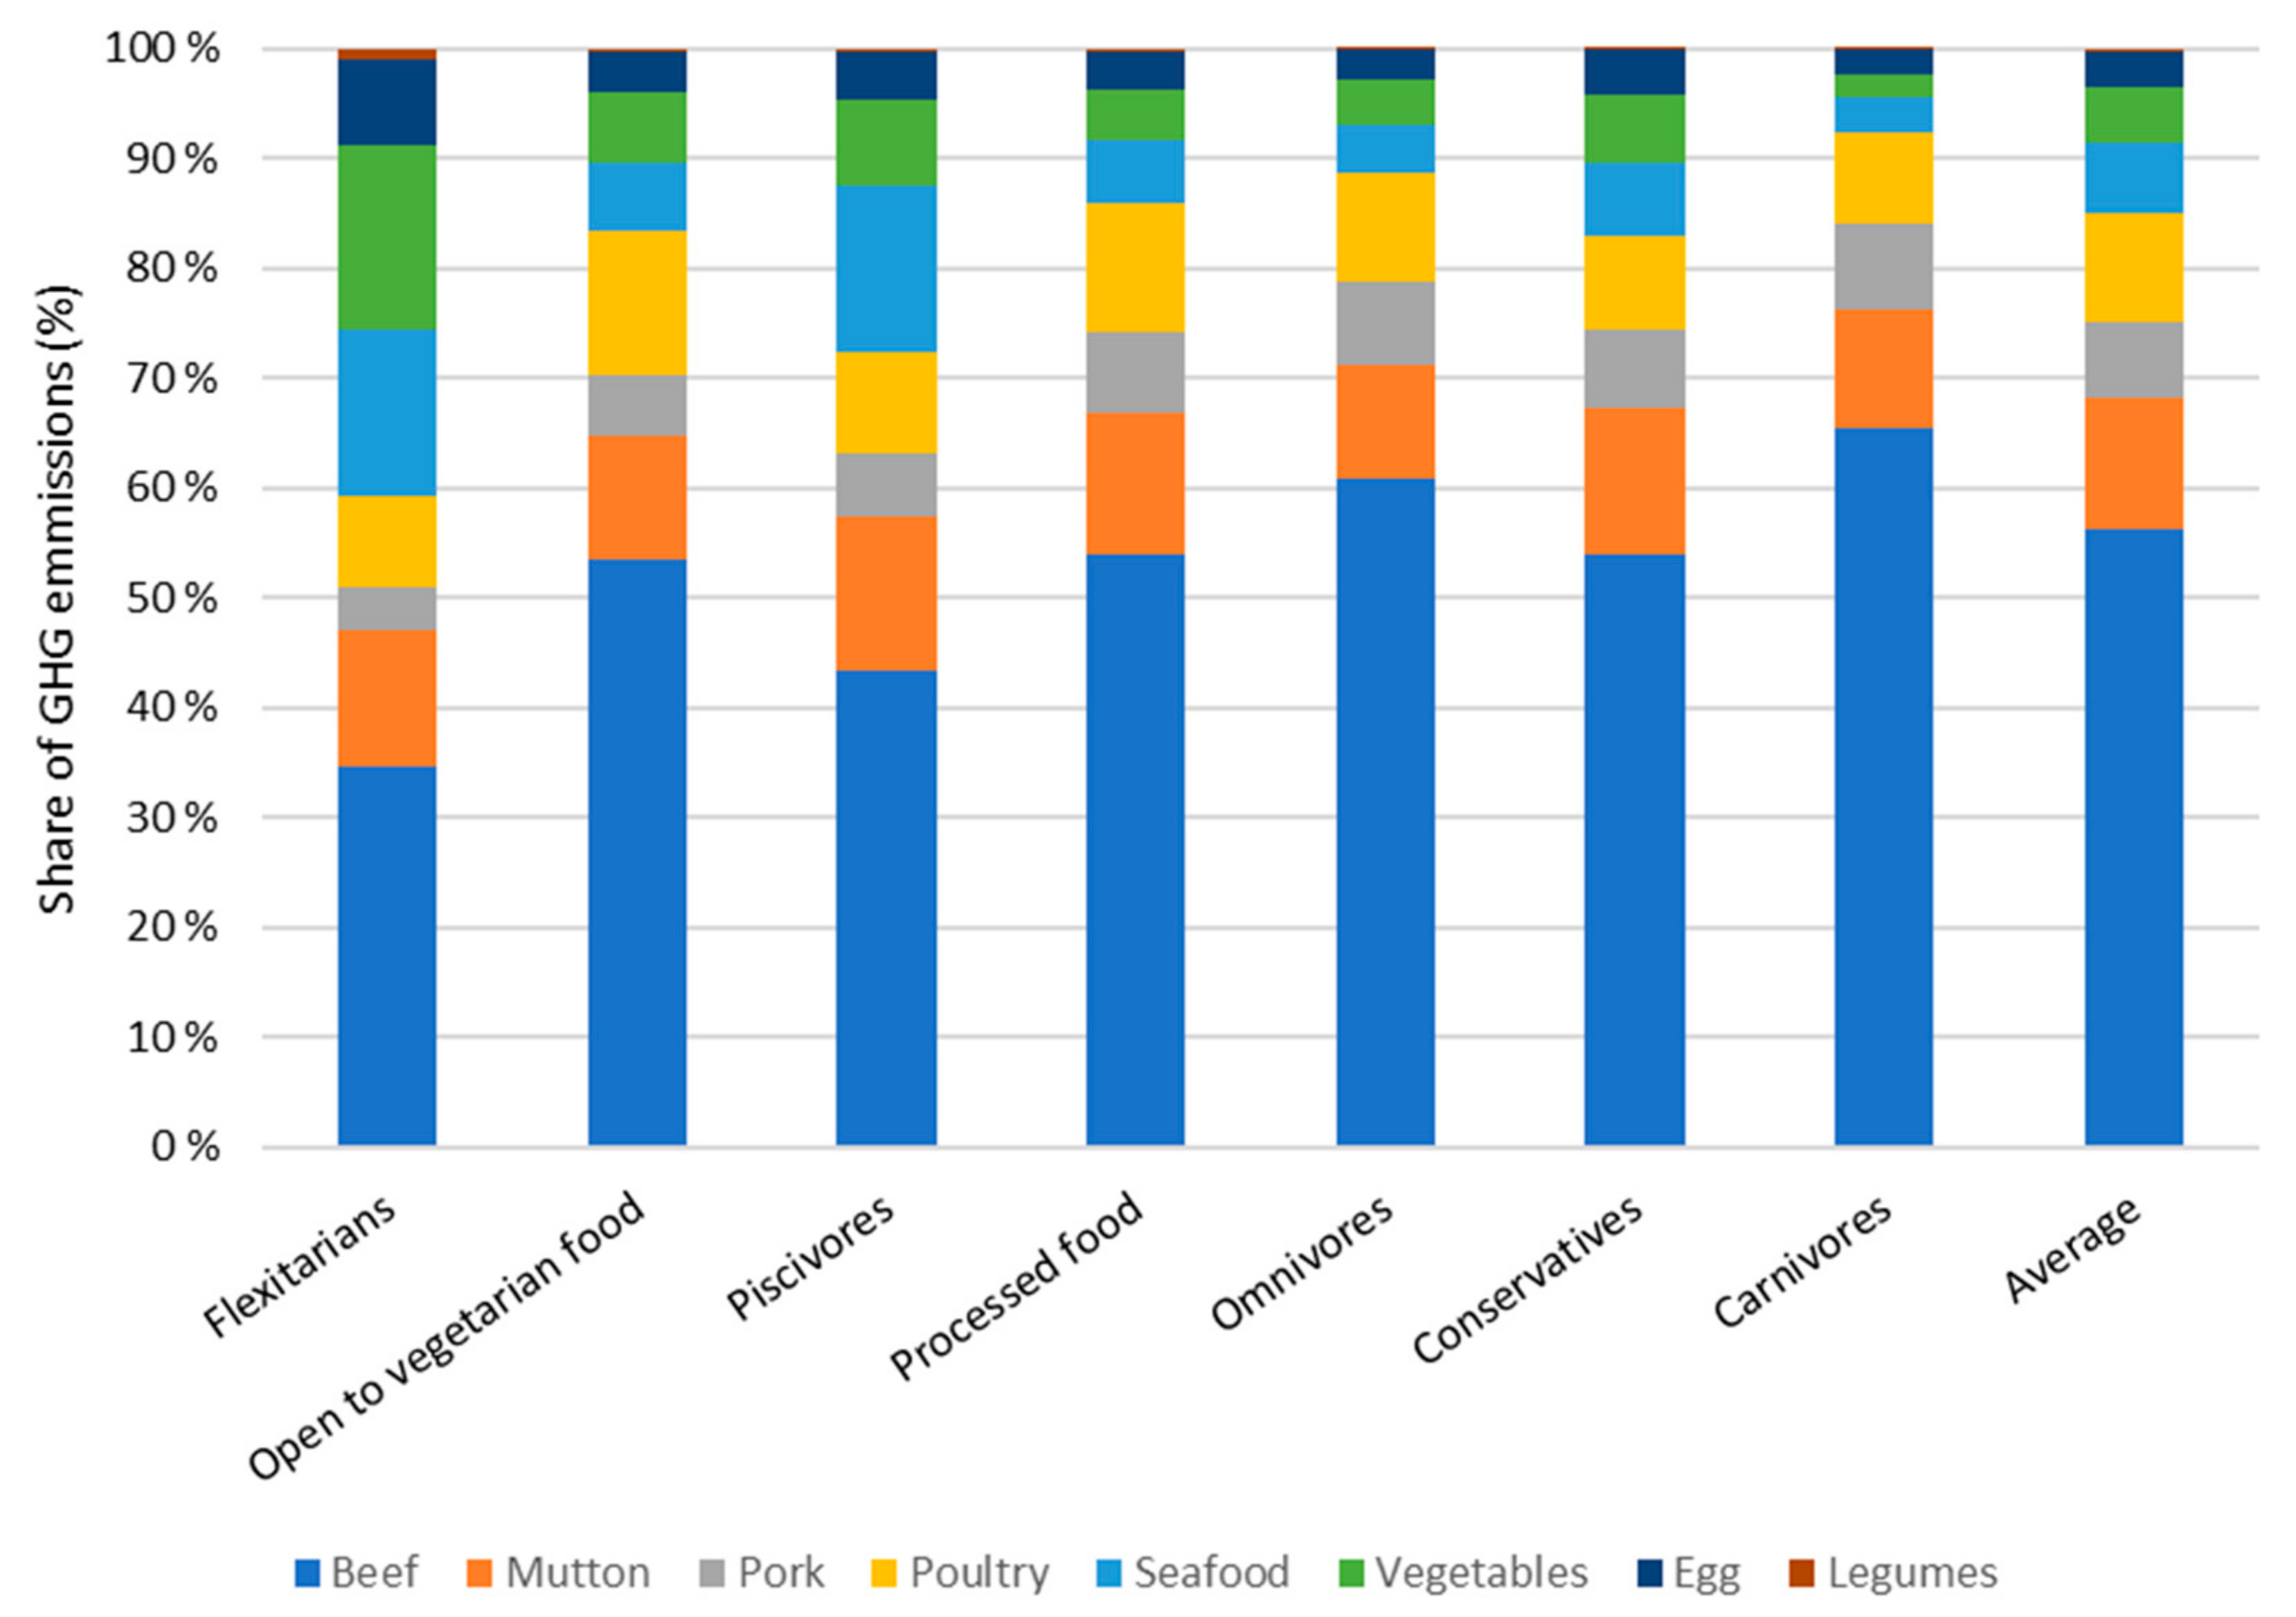
3.3. Dietary Patterns and Environmental Footprint

Figure 6 shows the impacts of each segment’s dietary pattern, exemplified by GHG emissions per capita per week. The results ranged from 7.2 to 17.0 CO2-eq/person * dinner * week. The dietary patterns were normalized according to energy content, as shown in Section 2. Figure 6 shows a clear tendency; impacts increase in the following order: Flexitarians < Piscivores < Open to vegetarian foods < Conservatives < Processed food eaters < Omnivores < Carnivores. The segments in the following figures were sorted from left (innovators) to right (laggards) according to the innovation adoption curve.
A similar pattern was found for other environmental impact factors (e.g., eutrophication and energy demand), but the differences were more pronounced for global warming. Figure 7 shows the source of GHG emissions: For the Omnivores and Carnivores, meat dominated the emissions, with approximately 90% of the total emissions. For the Flexitarians, meat accounted for approximately 60% of all GHG emissions. The Open to vegetarian foods segment still ate a lot of meat, and meat was responsible for 83% of their total GHG emissions—roughly similar to the Conservatives and slightly less than the Processed food eaters segments. Meat accounted for 72% of the Piscivores’ GHG emissions, and the Flexitarians’ GHG emissions for seafood were roughly the same as those of Piscivores.
Beef was the most important contributor to climate impact. When similar calculations were done for other impact categories, the results followed the same pattern. For eutrophication, meat dominated the emissions, but the contribution from nonruminant meat (pork and poultry), seafood, and eggs relative to ruminant meat is higher than the GHG emissions.
The nutrient content was calculated to balance the environmental impacts with the health benefits and to check whether the dinner diets were nutritionally equivalent. We calculated the nutrient indexes NRF12.3mass based on the normalized food intake and found some differences in nutrient content. The segment with the lowest nutrient density (Carnivores) had 38% lower content than the segment with the highest nutrient density (Flexitarians). Because the nutrient content correlates with the function of food, the environmental impacts were divided by the nutrient index for the segments to compensate for the differences in nutrient content. We observed the same pattern shown in Figure 6 and Figure 7, indicating that normalizing for nutrient content does not change the ranking of the segments in terms of environmental impact. This is important because diets with low environmental impacts are often claimed to have lower quality and nutrient content.
The Conservatives stood out from neighboring groups because they were laggards in terms of adopting plant-based food but still had a low environmental impact. This could be explained by their more traditional diet of potatoes, cereals, dairy, and fish, which corresponds with the typical Norwegian diet from 40 years ago (this segment had the oldest average age) [54]. With a relatively low GHG impact and averse to change, this segment should not be targeted by measures for decreasing food’s environmental impact. The Open to vegetarian foods group also stood out because it embraced plant-based foods but still ate a lot of meat. This group had low beef consumption and high poultry consumption, which resulted in lower GHG emissions vs. Omnivores and Carnivores. A shift toward plant-based foods could be achieved through facilitation and knowledge (Table 2).
The potential GHG impact of shifting consumer segments along the innovation adoption curve toward more plant-based foods was shown to be high. We tested how moving Carnivores to the same diet as the Open to vegetarian foods segment would affect environmental impacts, and we found that all impacts would be reduced. The Carnivores segment represents 14% of the population (roughly 761,000 people) based on the latest population figures for Norway [55]. For climate impacts, the change would reduce emissions by 4.8 kg CO2-eq per person per week, or 251 kg per person per year; this would be roughly 191,000 tons of CO2-eq/year. Assuming an average direct emission of 160 g CO2-eq/km and an average annual driving distance of 16,000 km, this reduction would be equal to the annual direct emissions of 75,000 cars. The emission cut could be a significant contribution toward fulfilling Norway’s climate obligations under the Paris Agreement [56]. The Norwegian agricultural sector has agreed to cut emissions by 5 million tons of CO2-eq over a 10-year period ending in 2030; the emission reduction illustrated by our example would provide almost half of that. The emission cuts per the Paris Agreement concern only emissions in Norway within the primary production sectors (e.g., combustion of fuels), and production of fertilizers and imported feeds, for example, are not included. In contrast, the emission cuts calculated in this study cover all associated emissions, no matter where they take place. Thus, the emission cuts could be significant in fulfilling Norway’s climate goals, as seen in the calculations of the Klimakur 2030 report [4], where dietary changes to reduce meat consumption and increase fruit and vegetable intake would reduce emissions by 2.9 million tons CO2-eq over a 10-year period.
Table 2. Examples of possible interventions to accelerate the adoption of plant-based food for selected consumer segments represented by personas.
Consumer segment Characteristics and PersonaInnovation AttributeIntervention to Accelerate Adoption
Open to vegetarian foods
(early adopter)
Sustainability 13 04477 i001
Demographics:
-
62% female
-
High education
-
Younger population
Consumption:
-
Eat more poultry than average
-
Like legumes
-
Reduce meat for environmental and animal welfare reasons
-
Interested in vegetarian food
Purchase factors:
-
Price, freshness, health, nutrition
-
New and exciting flavors
Relative advantage
-
Information and products that improve social status and influence
-
Health and well-being benefits
Compatibility
-
Supporting desire to change with new and exciting dishes/recipes
Complexity
-
Showing relation to norms and values accepted in society
-
Sharing scientific information about plant-based food
Trialability
-
Restaurant offers
-
Recipes in blogs, magazines, etc.
-
Affordable products (or cooking from scratch with fresh ingredients)
Observability
-
Using segments as active ambassadors
Processed food eaters
(early majority)
Demographics:
-
Single household
-
Lower education
Consumption:
-
Eat less fruits/vegetables and fish vs. average
-
Some want to increase fish and poultry
-
Little interest in vegetarian food
Purchase factors:
-
Price, familiarity
-
Easy and fast preparation
-
Nutrition, health, freshness not important
Relative advantage
-
Doing something good for health without changing habits
-
Offering products with the same functions, tastes, and satiation
-
New products/offers with price advantages
Compatibility
-
Familiar products/meals
-
Easy and fast to prepare
-
Possibly via fish and poultry (?)
Complexity
-
Low knowledge of and interest in food
-
Simple “show, don’t tell” initiatives
Trialability
-
Interventions where no new skills are required
-
Ready-to-eat or intermediate products
-
Canteens or “on-the-go” (i.e., gas station) offers
Observability
-
Showing and communicating positive experiences of others (e.g., Flexitarians)
Omnivores
(late majority)
Sustainability 13 04477 i002
Demographics:
-
Average on age, gender, education, urban/rural
Consumption:
-
Eat more meat than average
-
Want to increase fish
-
Low interest in legumes
Purchase factors:
-
Price, familiarity, freshness
-
Easy to cook with meat
-
Health and animal welfare as reasons to decrease meat, climate not important
Relative advantage
-
Highlighting the health benefits of plant-based diets
Compatibility
-
Familiar products (e.g., plant-based burgers, minced meat, sausages)
-
Showing negative attitudes of other members of the society toward late adoption (peer pressure)
Complexity
-
Showing examples of information on why the change is needed (simple graphic information)
Trialability
-
Showing economic benefits
-
In-store taste samples
Observability
-
Showing the new norm through the wide presence of products in respective “meat categories” in stores
Carnivores
(laggards)
Sustainability 13 04477 i003
Demographics:
-
69% male
-
Lower education
Consumption:
-
High meat consumption
-
Least fish, fruits/vegetable consumption
-
Lowest liking of legumes
-
Least interested in vegetarian food
-
Animal welfare, environment, and climate are least important
Purchase factors:
-
Price, familiarity
-
Easy preparation, ready-to-eat
Relative advantage
-
Fast, cheap, and convenient solutions for the “on the road” lifestyle
Compatibility
-
Offering familiar products based on modified recipes
-
Supporting a “manly” image
-
Avoiding “vegan/vegetarian” in product names
Complexity
-
Communicating that adoption is possible in relation to lifestyle
Trialability
-
Partially replacing meat with, for example, vegetables in fast food places, restaurants, and canteens
-
RTE and semi-finished products, easy-to-prepare products
-
Nudging strategies: placement—making the healthy choice the easy choice; pricing—making the healthy choice most affordable; prompting—providing signals that get attention [57]
Observability
-
Showing the new norm through the wide presence of products in respective “meat categories” in stores

3.4. Suggestions for Segment-Specific Opportunities and Innovation Acceleration

For an innovation to be adopted, it must fulfill the following attributes to convince a consumer that the change is worthwhile [11]: (1) Relative advantage—If the idea is better than current solutions, certain individuals will perceive an advantage, and adoption will increase. (2) Compatibility—If the idea is highly compatible with the individual’s existing values, experience, and needs, the chances for adoption are generally higher. (3) Complexity—New ideas that are easy to comprehend are more easily adopted. (4) Trialability—Trying out an innovation leads to less uncertainty, and learning by doing increases the chances for adoption. (5) Observability—The more visible the innovation is to consumers, the more likely it is to be adopted. By using the perceived attributes of innovation, we analyzed possible accelerators for shifting to more plant-based food. Innovations with greater relative advantage, compatibility, trialability, observability, and less complexity will be adopted more rapidly. Table 2 shows how plant-based food can be promoted based on the segments’ characteristics and innovation attributes. We selected the segments Open to vegetarian foods, Processed food eaters, Omnivores, and Carnivores to represent a broad spectrum on the innovation adoption curve. This included the early adopters and early majority groups that are most open to change and could be influenced toward increased adoption [21]. We also used the guidelines developed by Banytė and Salickaitė [22] to develop specific ideas on which information to emphasize when communicating with specific segments. Personas were used to stimulate the human-centric way of thinking. This is not intended to be understood as an exhaustive list of interventions, but rather as an illustration and starting point for tailoring interventions to certain segments.

3.5. Limitations of the Study

The study provides a new conceptual approach of combining and triangulating data from different sources and disciplines toward a holistic approach. As this is an exploratory research design, we acknowledge its limitations, which should be addressed in future research. One limitation is that the survey data contained only data for dinner intake. In Norway, dinner is the main meal and is usually a warm dish. If the whole diet is considered, the ranking of segments is expected to stay the same as the amount of meat consumed in other meals is very small [46,54]. Another limitation is that the primary data only contained eating frequencies for the different food types, and average portion sizes were used to calculate the food amounts. We minimized the potential difference by normalizing and compensating for the nutrient content. The carbon footprint calculated in this study demonstrates only one aspect of the environmental impact of the segments’ diets. However, the calculations in our example show the merit of including this aspect in a framework to investigate the rewards for moving consumer segments along the innovation adoption curve. Further, the study did not evaluate differences in access to plant-based food in the analysis of the segments, which can be important for changing food choice. In the intervention examples, we have included aspects of trialability and observability as drivers for adoption to account for better accessibility (Table 2).

3.6. Direction for Future Research

While the concept of innovation adoption is generalizable, the results regarding consumer diets and GHG emissions in Norway are not generalizable to other geographic regions. Further research is recommended to expand the data to other geographies. Further research should also develop and increase the accuracy of this framework and show its applicability to other innovation cases, for example, increasing consumption of organic food, or increasing use of electric vehicles or production of solar power. When designing consumer surveys and linking them to the framework of innovation adoption, future research should include specific questions about innovativeness in relation to the specific innovation and the adopter categories. Whole diets should be studied with more precise food intake measurements. To improve the precision of LCA, the product’s country of origin should be considered to a larger extent. Finally, including more food groups (e.g., dairy products, bread, nuts, beverages, and processed food) will increase the accuracy of the results. For further innovation activities, the personas should be adjusted according to the segmentation data; they can also be adapted to specific geographies and cultures so they can be applied to future innovation cases and help further develop this approach on a theoretical level. The suggested intervention examples linked to consumer segments and innovation attributes should be tested and validated in practice.

4. Conclusions

This paper makes a significant contribution to the emerging literature on transdisciplinary research approaches for the transition toward food sustainability. It will enable other researchers, policy makers, and companies to reapply and learn from our work. This study offers a new concept of a transdisciplinary approach exemplified by the case of accelerating the adoption of plant-based foods within the framework of diffusion of innovation and consumer empathy. We have operationalized the concept of innovation adoption in a case study and generated empirical data that supports the usefulness and validity of the approach and exemplifies one way of applying the framework. Following the call for integrated approaches for food-related changes, we used the characteristics of the innovation adopter categories supported by qualitative consumer insights to “construct and develop” representative consumers (personas). Seven consumer segments were identified based on quantitative data, and the climate footprints of their diets were calculated. We exemplified how GHG emissions can be significantly reduced by accelerating plant-based food adoption. With the increased diffusion of innovation, consumers in several segments will probably reduce their meat intake and eat more plant foods in the future. The magnitude of the shift is difficult to predict. We identified mechanisms for accelerating the adoption of innovation by using segment characteristics, personas, and perceived attributes of innovation identifying targeted interventions rather than one-size-fits-all interventions. We closed the research gap stated by Szejda et al. [21], who encouraged the use of the diffusion of innovations framework to develop comprehensive profiles of the early adopter and early majority groups and to target those most open to change. Both the segment characterization and the personas provide a good starting point for developing interventions and accelerating plant food adoption.
In terms of managerial implications, this explorative case study provides a new approach for combining qualitative and quantitative consumer data from different research disciplines. Looking at individual consumer segments, we see habits and attitudes that can be used to target measures for increasing the intake of plant-based foods and reducing meat consumption. Consumers in the early adopter and early majority segments are easier to reach with interventions. The descriptions of the segments and the developed personas offer a unique starting point for practitioners to develop need-driven interventions. Through workshops in the food industry, we have already shown that the developed personas can foster empathy, creativity, and innovativeness. Therefore, they can help create products and services and communicate ideas that are adopted faster because they meet the consumers’ actual needs. Our proposed approach is also very useful to policymakers and can be applied to develop specific and targeted interventions for the shift to a more plant-based diet. Other researchers can reapply the proposed approach for different types of innovation and research questions where the adoption or acceleration of an innovation is central.

Author Contributions

The six authors (A.G., E.S., A.B.B., M.M.H., K.-M.P., Ø.U.) co-designed the research. Conceptualization, A.G., E.S., A.B.B., K.-M.P. and Ø.U.; methodology, A.G., E.S., A.B.B., M.M.H., K.-M.P. and Ø.U.; formal analysis, E.S. and M.M.H.; writing—original draft preparation, A.G., E.S. and Ø.U.; writing—review and editing, A.G., E.S., A.B.B., M.M.H., K.-M.P. and Ø.U.; visualization, A.G., E.S. and K.-M-P.; supervision, A.G. and Ø.U.; project administration, A.G. All authors have read and agreed to the published version of the manuscript.

Funding

This research was funded by the Norwegian Research Council through the project FoodProFuture (267858), and by the Norwegian Fund for Research Fees for Agricultural Products (FFL) through the projects InnoFood (262303), FoodSMaCK (262308), and FoodForFuture (314318).

Data Availability Statement

The data presented in this study are available in the article (Table 1 and Table 2 and Figure 4, Figure 6 and Figure 7, and Table A1 and Table A2).

Conflicts of Interest

The authors declare no conflict of interest.

Appendix A

Table A1. Variables used in the cluster analysis.
Variables Used in the Cluster AnalysisVariables Merged to form the Factor
Q: How often do you eat dinner with the following ingredients?
-
Beef
-
Pork
-
Poultry (chicken, turkey)
-
Fish/Seafood (shellfish, clams)
-
Vegetables/Fruits
Factor 2: How much do you agree or disagree with the following statement? Q: I am interested in vegetarian food.
Factor 3: A dinner needs meat or fish to be tasty, healthy, nutritious, complete, and filling Q: A dinner needs meat or fish to be:
-
tasty
-
healthy
-
nutritious
-
complete
-
filling
Factor 4: Concerned with nutritional contentQ: To what degree are you concerned with the following nutritional content in the food you eat?
-
Vegetable fat
-
Animal fat
-
Carbohydrates
-
Sugar—Protein
-
Salt
-
Vitamins and minerals
Factor 5: Liking and frequency eating beans (canned), chickpeas, lentilsQ: How well do you like the taste of:
-
canned beans
-
lentils
-
chickpeas
Q: How often do you eat?
-
canned beans
-
lentils
-
chickpeas
Factor 7: I think it is important to reduce meat/dairy because of environment/climate and animal welfareQ: I think it is important to reduce the intake of meat/dairy because of the environment/climate.
Q: I think it is important to reduce the intake of meat/dairy because of animal welfare.
Factor 8: Like buying processed foods and seldom cooking dinners from scratchQ: I often make dinners from scratch (reversed).
Q: I like to buy ready-made products, such as meatballs and fish balls, for dinner.
Q: I like to buy ready-made dishes, such as frozen pizza, lasagne, pie, and casserole, for dinner.
Table A2. Demographic characteristics of the clusters and survey statistics. Norwegian population statistics for comparison from ssb.no (statistics Norway).
Variable Flexitarians
n = 86 (%)
Open
n = 270 (%)
Piscivores
n = 211 (%)
Processed
n = 311 (%)
Omnivores
n= 311 (%)
Conservatives
n = 340 (%)
Carnivores
n = 248 (%)
Total
Survey
n = 1778 (%)
Chi Square
p
Norw.
Pop. %
SexMale20.938.145.554.354.050.968.750.585.0
< 0.001
50.2
Female79.161.954.545.746.049.131.349.549.8
Age<3024.430.49.024.125.17.732.721.5291.5
< 0.001
17.0
30–3927.918.96.222.220.67.423.017.117.8
40–4915.117.87.119.323.516.818.117.517.3
>5032.633.077.734.330.968.126.243.947.9
Civil statusSingle38.429.619.532.821.218.834.526.5116.3
< 0.001
39.4
Partnership w/children 16.325.918.128.034.320.925.725.425.4
Partnership no children35.033.355.724.834.050.026.937.024.1
Other/no answer9.311.16.714.510.610.312.911.111.1
Highest educationPrimary/high school18.627.423.242.133.440.652.036.1103.9
< 0.001
65.0
Uni./College < 3 years39.525.628.424.433.829.726.628.824.2
Uni./College > 3 years37.242.242.730.930.224.716.531.010.3
Other4.74.85.72.62.65.04.84.20.6
Place of living>50,000 residents62.153.942.244.342.738.233.843.538.5
< 0.001
59.5
<50,000 residents37.946.157.755.757.261.966.356.540.5

References

  1. Willett, W.; Rockström, J.; Loken, B.; Springmann, M.; Lang, T.; Vermeulen, S.; Garnett, T.; Tilman, D.; DeClerck, F.; Wood, A.; et al. Food in the Anthropocene: The EAT–Lancet Commission on healthy diets from sustainable food systems. Lancet 2019, 393, 447–492. [Google Scholar] [CrossRef]
  2. Guinée, J.; Heijungs, R.; De Koning, A.; Van, L.; Geerken, T.; Van Holderbeke, M.; Vito, B.J.; Eder, P.; Delgado, L. Environmental Impact of Products (EIPRO) Analysis of the Life Cycle Environmental Impacts Related to the Final Consumption of the EU25; Technical Report EUR 22284 EN; European Commission Joint Research Centre (DG JRC) Institute for Prospective Technological Studies: Seville, Spain, 2006. [Google Scholar]
  3. Motola, V.; Banja, M.; Scarlat, N.; Medarac, H.; Castellazzi, L.; Labanca, N.; Bertoldi, P.; Pennington, D. Energy Use in the EU Food Sector: State of Play and Opportunities for Improvement. JRC Science and Policy Report; Monforti-Ferrario, F., Pascua, I.P., Eds.; Publications Office of the European Union: Luxembourg, 2015. [Google Scholar]
  4. Norwegian Environment Agency. Klimakur 2030: Tiltak og Virkemidler Mot 2030; Norwegian Envirinment Agency: Oslo, Norway, 2020. [Google Scholar]
  5. Atkins, L.; Michie, S. Changing eating behaviour: What can we learn from behavioural science? Nutr. Bull. 2013, 38, 30–35. [Google Scholar] [CrossRef]
  6. Van Otterloo, A.H. Healthy, safe and sustainable: Consumers and the public debate on food in Europe and the Netherlands since 1945. In Food Practices in Transition; Routledge: New York, NY, USA, 2013; pp. 80–105. [Google Scholar]
  7. Verain, M.C.; Bartels, J.; Dagevos, H.; Sijtsema, S.J.; Onwezen, M.C.; Antonides, G. Segments of sustainable food consumers: A literature review. Int. J. Consum. Stud. 2012, 36, 123–132. [Google Scholar] [CrossRef]
  8. Graça, J.; Godinho, C.A.; Truninger, M. Reducing meat consumption and following plant-based diets: Current evidence and future directions to inform integrated transitions. Trends Food Sci. Technol. 2019, 91, 380–390. [Google Scholar] [CrossRef] [Green Version]
  9. Michie, S.; Van Stralen, M.M.; West, R. The behaviour change wheel: A new method for characterising and designing behaviour change interventions. Implement. Sci. 2011, 6, 42. [Google Scholar] [CrossRef] [Green Version]
  10. Weibel, C.; Ohnmacht, T.; Schaffner, D.; Kossmann, K. Reducing individual meat consumption: An integrated phase model approach. Food Qual. Prefer. 2019, 73, 8–18. [Google Scholar] [CrossRef]
  11. Rogers, E.M. Diffusion of Innovations, 5th ed.; Simon and Schuster Free Press: New York, NY, USA, 2003. [Google Scholar]
  12. Ulwick, A.W. Turn customer input into innovation. Harv. Bus. Rev. 2002, 80, 91–98. [Google Scholar]
  13. Fenko, A.; Van Rompay, T.J. Consumer-driven product design. In Methods in Consumer Research; Ares, G., Varela, P., Eds.; Woodhead Publishing: Cambridge, UK, 2018; Volume 2, pp. 427–462. [Google Scholar] [CrossRef]
  14. Schifferstein, H.N. Employing consumer research for creating new and engaging food experiences in a changing world. Curr. Opin. Food Sci. 2015, 3, 27–32. [Google Scholar] [CrossRef]
  15. Stickdorn, M.; Schneider, J. This Is Service Design Thinking: Basics, Tools, Cases; Wiley: Hoboken, NJ, USA, 2012. [Google Scholar]
  16. Curedale, R. Design Thinking Process & Methods, 5th ed.; Design Community College: Los Angeles, CA, USA, 2019. [Google Scholar]
  17. Cruz, A.; Karatzas, S. Understanding your buyer persona. In Digital and Social Media Marketing; Heinze, G.F.A., Rashid, T., Cruz, A., Eds.; Taylor and Francis: New York, USA, 2017; pp. 69–93. [Google Scholar]
  18. Vaccaro, V.L.; Cohn, D.Y. Green Marketing Strategies, Diffusion of Innovation, and Global Consumer Values for Sustainability. In Proceedings of the Northeast Business & Economics Association, Morristown, NJ, USA, 30 September–2 October 2010; pp. 596–598. [Google Scholar]
  19. Miaskiewicz, T.; Kozar, K.A. Personas and user-centered design: How can personas benefit product design processes? Des. Stud. 2011, 32, 417–430. [Google Scholar] [CrossRef]
  20. Dearing, J.W. Applying Diffusion of Innovation Theory to Intervention Development. Res. Soc. Work. Pr. 2009, 19, 503–518. [Google Scholar] [CrossRef] [PubMed] [Green Version]
  21. Szejda, K.; Urbanovich, T.; Wilks, M. Accelerating Consumer Adoption of Plant-Based Meat: An Evidence-Based Guide for Effective Practice. Five Working Papers; The Good Food Institute: Washington, DC, USA, 2020. [Google Scholar]
  22. Banytė, J.; Salickaitė, R. Successful diffusion and adoption of innovation as a means to increase competitiveness of enterprises. Eng. Econ. 2008, 56, 48–56. [Google Scholar]
  23. Albertsen, L.; Wiedmann, K.-P.; Schmidt, S. The impact of innovation-related perception on consumer acceptance of food innovations—Development of an integrated framework of the consumer acceptance process. Food Qual. Prefer. 2020, 84, e103958. [Google Scholar] [CrossRef]
  24. Graça, J.; Oliveira, A.; Calheiros, M.M. Meat, beyond the plate. Data-driven hypotheses for understanding consumer willingness to adopt a more plant-based diet. Appetite 2015, 90, 80–90. [Google Scholar] [CrossRef] [PubMed]
  25. IPSOS. Norske Spisefakta. 2018. Available online: https://www.ipsos.com/nb-no/norske-spisefakta (accessed on 9 April 2021).
  26. Reipurth, M.F.; Hørby, L.; Gregersen, C.G.; Bonke, A.; Cueto, F.J.P. Barriers and facilitators towards adopting a more plant-based diet in a sample of Danish consumers. Food Qual. Prefer. 2019, 73, 288–292. [Google Scholar] [CrossRef]
  27. Stubbs, R.J.; Scott, S.E.; Duarte, C. Responding to food, environment and health challenges by changing meat consumption behaviours in consumers. Nutr. Bull. 2018, 43, 125–134. [Google Scholar] [CrossRef]
  28. Austgulen, M.H.; Skuland, S.E.; Schjøll, A.; Alfnes, F. Consumer Readiness to Reduce Meat Consumption for the Purpose of Environmental Sustainability: Insights from Norway. Sustainability 2018, 10, 3058. [Google Scholar] [CrossRef] [Green Version]
  29. De Boer, J.; De Witt, A.; Aiking, H. Help the climate, change your diet: A cross-sectional study on how to involve consumers in a transition to a low-carbon society. Appetite 2016, 98, 19–27. [Google Scholar] [CrossRef]
  30. Peschel, A.O.; Grebitus, C.; Steiner, B.; Veeman, M. How does consumer knowledge affect environmentally sustainable choices? Evidence from a cross-country latent class analysis of food labels. Appetite 2016, 106, 78–91. [Google Scholar] [CrossRef] [Green Version]
  31. MacKenzie, M.; Shanahan, L. Attitudes to meatless meals. Nutr. Food Sci. 2018, 48, 858–872. [Google Scholar] [CrossRef]
  32. Murtagh, N.; Gatersleben, B.; Uzzell, D. Self-identity threat and resistance to change: Evidence from regular travel behaviour. J. Environ. Psychol. 2012, 32, 318–326. [Google Scholar] [CrossRef] [Green Version]
  33. Cliceri, D.; Spinelli, S.; Dinnella, C.; Prescott, J.; Monteleone, E. The influence of psychological traits, beliefs and taste responsiveness on implicit attitudes toward plant- and animal-based dishes among vegetarians, flexitarians and omnivores. Food Qual. Prefer. 2018, 68, 276–291. [Google Scholar] [CrossRef]
  34. Van Loo, E.J.; Hoefkens, C.; Verbeke, W. Healthy, sustainable and plant-based eating: Perceived (mis)match and involvement-based consumer segments as targets for future policy. Food Policy 2017, 69, 46–57. [Google Scholar] [CrossRef]
  35. Apostolidis, C.; McLeay, F. To meat or not to meat? Comparing empowered meat consumers’ and anti-consumers’ preferences for sustainability labels. Food Qual. Prefer. 2019, 77, 109–122. [Google Scholar] [CrossRef]
  36. Sanchez-Sabate, R.; Sabaté, J. Consumer Attitudes Towards Environmental Concerns of Meat Consumption: A Systematic Review. Int. J. Environ. Res. Public Health 2019, 16, 1220. [Google Scholar] [CrossRef] [Green Version]
  37. Schösler, H.; De Boer, J. Towards more sustainable diets: Insights from the food philosophies of “gourmets” and their relevance for policy strategies. Appetite 2018, 127, 59–68. [Google Scholar] [CrossRef]
  38. Mørk, T.; Lähteenmäki, L.; Grunert, K.G. Determinants of intention to reduce salt intake and willingness to purchase salt-reduced food products: Evidence from a web survey. Appetite 2019, 139, 110–118. [Google Scholar] [CrossRef]
  39. Scarborough, P.; Appleby, P.N.; Mizdrak, A.; Briggs, A.D.M.; Travis, R.C.; Bradbury, K.E.; Key, T.J. Dietary greenhouse gas emissions of meat-eaters, fish-eaters, vegetarians and vegans in the UK. Clim. Chang. 2014, 125, 179–192. [Google Scholar] [CrossRef] [Green Version]
  40. González-García, S.; Esteve-Llorens, X.; Moreira, M.T.; Feijoo, G. Carbon footprint and nutritional quality of different human dietary choices. Sci. Total. Environ. 2018, 644, 77–94. [Google Scholar] [CrossRef]
  41. Aleksandrowicz, L.; Green, R.; Joy, E.J.M.; Smith, P.; Haines, A. The Impacts of Dietary Change on Greenhouse Gas Emissions, Land Use, Water Use, and Health: A Systematic Review. PLoS ONE 2016, 11, e0165797. [Google Scholar] [CrossRef] [Green Version]
  42. Rosi, A.; Mena, P.; Pellegrini, N.; Turroni, S.; Neviani, E.; Ferrocino, I.; Di Cagno, R.; Ruini, L.; Ciati, R.; Angelino, D.; et al. Environmental impact of omnivorous, ovo-lacto-vegetarian, and vegan diet. Sci. Rep. 2017, 7. [Google Scholar] [CrossRef] [Green Version]
  43. Veeramani, A.; Dias, G.M.; Kirkpatrick, S.I. Carbon footprint of dietary patterns in Ontario, Canada: A case study based on actual food consumption. J. Clean. Prod. 2017, 162, 1398–1406. [Google Scholar] [CrossRef]
  44. Schwartz, S.H.; Bilsky, W. Toward a theory of the universal content and structure of values: Extensions and cross-cultural replications. Journal Personal. Soc. Psychol. 1990, 58, 878. [Google Scholar] [CrossRef]
  45. Bugge, A.; Alfnes, F. Meatless Eating Habits—CONSUMERS’ View. [Kjøttfrie Spisevaner—Hva Tenker Forbrukerne?]; OsloMet: Oslo, Norway, 2018. [Google Scholar]
  46. Gronow, J.; Holm, L. Everyday Eating in Denmark, Finland, Norway and Sweden: A Comparative Study of Meal Patterns 1997–2012; Bloomsbury Academic: London, UK, 2019. [Google Scholar]
  47. Field, A. Discovering Statistics Using IBM SPSS Statistics; SAGE Publishing: New Delhi, India, 2013. [Google Scholar]
  48. Hair, J.F. Multivariate data analysis: Pearson new international edition; Pearson Education: Harlow, UK, 2014. [Google Scholar]
  49. Dalane, J.Ø.; Bergvatn, T.M.; Kielland, E.; Carlsen, M.H. Mål, vekt og Porsjonsstørrelser for Matvarer. [Weights, Measures and Portion Sizes for Foods]; Wittusen&Jensen: Oslo, Norway, 2015. (In Norwegian) [Google Scholar]
  50. Svanes, E. Life Cycle Assessment of the Existing Protein Consumption in Norway; NORSUS: Fredrikstad, Norway, 2019. [Google Scholar]
  51. Drewnowski, A. The Nutrient Rich Foods Index helps to identify healthy, affordable foods. Am. J. Clin. Nutr. 2010, 91, 1095–1101. [Google Scholar] [CrossRef] [PubMed]
  52. Parry, J.; Mitchell, R. Assessing the General Population’s Implicit Perceptions of the Plant-Based Food Category; M. International: Brighton, UK, 2019. [Google Scholar]
  53. Verain, M.C.D.; Sijtsema, S.J.; Dagevos, H.; Antonides, G. Attribute Segmentation and Communication Effects on Healthy and Sustainable Consumer Diet Intentions. Sustainability 2017, 9, 743. [Google Scholar] [CrossRef] [Green Version]
  54. Bugge, A. Fattigmenn, Tilslørte Bondepiker og Rike Riddere: Mat og Spisevaner i Norge fra 1500-Tallett til vår Tid; Cappelen Damm Akademisk: Oslo, Norway, 2019. [Google Scholar]
  55. SSB. 2020. Available online: https://www.ssb.no/en/befolkning/statistikker/folkemengde (accessed on 17 September 2020).
  56. United Nations Framework Convention on Climate Change. Report of the Conference of the Parties. In Proceedings of the 21st Conference of the Parties Session, Paris, France, 30 November–13 December 2015.
  57. Thaler, R.; Sunstein, C. Nudge: Improving Decisions about Health, Wealth, and Happiness; Yale University Press: New Haven, CT, USA, 2008. [Google Scholar]
Figure 1. Innovation adoption curve with adopter categories and the concept of accelerated adoption (drawing by authors with inspiration from [11,20]).
Sustainability 13 04477 g001
Figure 2. Conceptual framework of the study.
Sustainability 13 04477 g002
Figure 3. Personas: Norwegian consumer representatives (drawings by Einar Lukerstuen).
Sustainability 13 04477 g003
Figure 4. Aspects considered important by each consumer segment when purchasing food.
Sustainability 13 04477 g004
Figure 5. Positioning of consumer segments and personas along the innovation adoption curve.
Sustainability 13 04477 g005
Figure 6. Greenhouse gas emissions (CO2-eq) for Norwegian consumer segments.
Sustainability 13 04477 g006
Figure 7. Distribution of the greenhouse gas emissions of different foods for each segment.
Sustainability 13 04477 g007
Table 1. Final clusters. Results from the cluster analysis for the variables used to form the clusters in z-scores. N = 1778.
Variables *Cluster
FlexitariansOpen to Vegetarian FoodsPiscivoresProcessed Food EatersOmnivoresConservativesCarnivores
N weighted86270211311311340248
Percent5%15%12%18%18%19%14%
Final Cluster Centers, z-scores
How often do you eat dinner with the following ingredients?
Beef−1.50.0−0.6−0.30.8−0.20.6
Pork−1.5−0.3−0.5−0.20.8−0.10.6
Poultry (chicken, turkey)−1.40.5−0.40.00.6−0.40.1
Fish/seafood (shellfish, shells)−0.40.01.2−0.40.20.0−0.6
Vegetables/fruit 0.60.60.5−0.60.40.2−1.2
How much do you agree or disagree with the following statements?
I am interested in vegetarian food. 1.71.10.20.2−0.1−0.9−0.8
A dinner needs meat or fish to be tasty, healthy, nutritious, complete, and filling (factor 2).−1.6−1.00.1−0.20.50.50.4
Concerned with nutritional content (factor 4). 0.20.40.6−0.10.3−0.2−1.0
Liking and frequency of eating beans (canned), chickpeas, and lentils (factor 5).1.20.60.40.00.3−0.6−0.9
I think it is important to reduce meat/dairy because of environment/climate and animal welfare (factor 7).1.30.80.10.40.1−0.9−0.8
Often buying processed foods, seldom cooking dinners from scratch (factor 8).−0.5−0.4−0.80.80.1−0.50.9
* All variables measured on a five-point ordinal or Likert scale.
Publisher’s Note: MDPI stays neutral with regard to jurisdictional claims in published maps and institutional affiliations.

