Article

Influence of Environmental Values on the Typhoon Risk Perceptions of High School Students: A Case Study in Ningbo, China

1
School of Political Science and Public Administration, East China University of Political Science and Law, Shanghai 201620, China
2
Zhejiang Institute of Administration, Hangzhou 311121, China
3
School of Public Administration, Zhejiang University of Finance & Economics, Hangzhou 310018, China
4
Nottingham University Business School China, University of Nottingham Ningbo China, Ningbo 315100, China
*
Author to whom correspondence should be addressed.
Sustainability 2021, 13(8), 4145; https://doi.org/10.3390/su13084145
Submission received: 1 March 2021 / Revised: 25 March 2021 / Accepted: 26 March 2021 / Published: 8 April 2021
(This article belongs to the Section Hazards and Sustainability)

Abstract

:
Typhoons are a severe form of natural disaster that can impose huge economic losses and casualties on society. High school students are more vulnerable compared with adults during typhoons. Improving risk perceptions of typhoons can help high school students to effectively respond to typhoons and reduce related losses. Environmental values play an important role in human perceptions and actions. Although typhoons are caused by environmental factors, few studies have investigated the influence of environmental factors on typhoon risk perceptions of high school students. This study investigates the typhoon risk perceptions of high school students in Ningbo, China, and further analyzes the influence of environmental values on these perceptions with the structural equations model. The results reveal that environmental values have significantly positive impacts on typhoon risk perceptions. The findings also demonstrate that disaster threats and the disaster management ability of the government have significant positive impacts on typhoon risk perceptions. This study proposes suggestions and measures to improve typhoon risk perceptions among high school students and provides a reference for typhoon prevention and reduction education in China.

1. Introduction

Typhoons (hurricanes) are formed on tropical and subtropical ocean surfaces. Typhoons are characterized by their strong and deep cyclonic vortices, strong winds, and heavy rainfalls, all of which may lead to storm surges, floods, landslides, debris flows, and other natural disasters. Typhoons account for 41% of all deaths caused by the 10 most major natural disasters in the world [1]. China is seriously threatened by typhoons and relevant secondary disasters due to its long coastline, adjacent oceans, and climate conditions. The Emergency Events Database (EM-DAT) reveals that from 2000 to 2020, an average of 10 typhoon-related tropical cyclones were registered in China per year, which resulted in an average of 255 deaths, an average of 19,146,179 people impacted per cyclone, and average annual economic losses of USD 44,304.55 million [2]. China’s southeast coastal cities (e.g., Ningbo) are located near the Pacific Ocean, with developed economies and dense populations, which are more likely to face serious losses due to typhoons [3]. For example, Typhoon Fitow caused serious waterlogging in many parts of Ningbo, and long-term and large-scale interruptions of traffic and power [4]. Ningbo suffered economic losses of more than CNY 33.3 billion, and the affected population reached 2.48 million [4]. Chinese governments at all levels have prepared prewarning protocols and set up emergency plans for typhoons such as the timely release of early warning information, public promotion of typhoon prevention technical measures, storage of disaster relief materials, opening of emergency shelters, and relocation of personnel in dangerous areas [5]. Although the public are highly aware of the typhoon outbreaks, they do not have necessary precautionary actions [6]. Adam et al. and Miceli et al. have found that there is a positive relationship between risk perception and an effective response of the public [7,8]. Therefore, in order to effectively prepare for and mitigate against typhoons, public perception of typhoons should be investigated and improved.
School students are more vulnerable compared with adults during disasters [9]. Each time a disaster occurs, masses of school students are affected, with some affected in severe ways [10]. For example, a total of 5335 students were killed or missing following the Wenchuan earthquake. Compared with earthquakes, typhoons are more predictable and have fewer casualties. However, students still face high risks of post-traumatic stress disorder (PTSD), depression disorder, and other health problems after typhoons [9,11]. Severe levels of PTSD and depressive reactions were found among adolescents in the two most heavily affected cities after Hurricane Mitch [12]. Yang et al. found that the prevalence of PTSD related to Typhoon Morakot was 25.8% after investigating 271 adolescents in Taiwan [13]. Tang et al. further found that PTSD has a direct influence on the suicide risks of adolescents who have experienced typhoons [11]. Although junior school students are also vulnerable, they do not effectively perceive typhoon risks due to having immature disaster perceptions and less disaster training. High school students obtain disaster prevention and mitigation knowledge and skills from school education, which can not only shape their own effective perceptions of disaster but also play a crucial role in shaping the attitudes of people in their family or communities [14,15]. Adaption to typhoon risks is crucial for the livelihood of the vulnerable people living near the sea [16], especially for students in typhoon prone areas, who will contribute to future emergency actions to mitigate against typhoons. Therefore, in order to reduce the negative impacts of typhoons, high school students should develop effective risk perceptions and understand more about these disasters to boost their prevention and mitigation efforts [15,17].
Previous studies have discussed the relationship between typhoon risk perceptions and their influencing factors such as age, gender, education, knowledge [18,19], typhoon characteristics [20,21], trust [22], and threats [23]. However, no studies have considered the influence of environmental values on risk perceptions of typhoons. Values provide a sense of worth that gives a clear orientation to individuals and helps them to make decisions [24]. As an element that supports rational thinking and a value judgment of the environment among individuals or groups, environmental values reflect the public’s views towards and concepts of the environment [25]. Environmental values play an important role in human motivations and actions [26]. Dutcher et al. thought that environmental values derive from a sense of connectivity with natural hazards [27]. For people who think that a risk situation is serious and who are willing to consider the environmental damage that the situation could cause, their acceptance of all kinds of risks is relatively low [28]. Leiserowitz found that environmental values may explain the relationship between climate change risk events and public perceptions of risk consequences [29]. Although the increases in the intensity of typhoons as a result of climate change have been demonstrated through historical data studies and theory [30], no studies have systematically designed and investigated the influence of environmental values on risk perceptions of typhoons.
The risk perception of typhoons among high school students is still confusing, and the relationship between environmental values and risk perception of typhoons needs to be explored. Therefore, this study aims to analyze the risk perception of typhoons among high school students and its relationship with environmental values. The rest of this paper is organized as follows: Section 2 reviews relevant existing studies of typhoon risk perception and environmental values and provides a basis for this research. Section 3 introduces the research method, which includes the research hypothesis, model construction, research design, and data analysis. Section 4 presents the findings of this research. Lastly, Section 5 provides an in-depth discussion and proposes relevant suggestions. Section 6 concludes the research results and proposes the limitation of the paper.

2. Literature Review

2.1. Typhoon Risk Perception and Its Influencing Factors

Risk perception refers to how people judge risks [31]. When people perceive an event to be risky, they develop an intuitive judgment that describes their social attitudes and general assessment of such risks [31,32]. Therefore, individuals’ self-perception of external risks is an important part of understanding risk [33]. Three main theoretical paradigms have been developed to investigate risk perception. First, the psychological measurement paradigm mainly uses individuals’ subjective risk assessment to quantify and predict their risk perception. These studies are mainly based on the theory of “personality”, which assigns “personality characteristics” to certain risk events and quantifies the risk according to their controllability and familiarity [32]. A scale has been designed to measure risks, wherein individuals assign a score according to their subjective feelings and use such scores as the basis to evaluate the risk perception [34]. Second, the social and cultural paradigm defines the occurrence of cognitive risk events as a type of “social and cultural construction” and argues that social and cultural factors can influence individuals’ risk perceptions. Renn and Rohrmann, inspired by culturalism theory, explored the impacts of social group norms and value systems on risk perception from the perspective of macrosociology [35]. Third, social risk amplification considers that in a society, risk is integrated in the social system, culture, and individual psychology to a certain extent. Social risk amplification is observed in the transmission of risk information and the response of social mechanisms [36]. In this slow and continuous process, the risk perception of the public can be strengthened or weakened, which in turn affects their risk response behavior.
The typhoon risk perception is affected by various factors. As for individual factors, age, gender, education, income, attitude and knowledge are related with the risk perception of typhoons [18]. Shen et al. found that the age of respondents positively affects the risk perception of typhoons, while the education level and the income negatively affect risk perception of typhoon [19]. Walter et al. found that females and minorities have higher levels of perceived typhoon risk [37], but Shen et al. found that there is no significant influence between gender and typhoon risk perception [19]. In addition, the previous disaster experience of the public can affect their typhoon risk perception [38]. Experience with evacuation, financial loss, or emotional impacts heightened negative affective risk perceptions of typhoon [39]. People focus more on the losses caused by risk events than on the probability of disaster occurrence. Public with disaster experience have higher risk perception than people without disaster experience [39,40]. However, Walter et al. revealed that reported hurricane experience and reported hurricane knowledge seem to have no impact on hurricane perceptions when investigating Florida’s single family homeowners [37]. Moreover, trust of respondents in authorities and experts has a substantial impact on risk perception of flood and typhoons [22].
Objective risks or characteristics of typhoons are also good predictors of victims’ risk perception toward typhoons [20]. People gradually believe that the risks in their environment increase with more exposure. Shao, Gardezi, and Xian found that hurricane risks and land area exposed to historical storm surge flooding positively affect risk perceptions [21]. In addition, the public pays attention to the damages caused by typhoons, and the risk information they obtain from typhoons increases their risk perception. For instance, the information that a tourist receives about hurricane characteristics, such as storm intensity, the track of the storm, the time to landfall, and landfall location, strongly influences their risk perceptions [41]. Moreover, the degree of risk threat can directly affect the public’s typhoon risk perception and subsequently influence their risk response behavior [18,23]. However, age can reduce the positive influence of threat on typhoon risk perception as the elders know that, even if the typhoon has an impact on their lives, the government will provide subsidies in time [19]. That means the governments may play important roles in mitigating public risk perception. The government and relevant departments are well equipped for predisaster prevention and mitigation work, thereby substantially influencing the risk perception of the public and assisting them to perceive and avoid future losses [42].
Overall, most previous studies have focused on the influence of demographic characteristics [19], personal experience [38], trust [22], threat [23] and risk features [20] on risk perception of typhoons. Few studies have investigated the influence of environmental values on risk perception of typhoons. Additionally, most studies focus on the typhoon risk perception of adults [18,19,38]—no study has paid attention to the typhoon risk perception of high school students.

2.2. Environmental Values and Its Influence on Risk Perception

Environmental values essentially involve the value judgment of individuals or groups and the relationship between human beings and the natural environment [43,44]. These values are mainly used to explain how individuals or the public view their environment and to check whether their environmental behaviors are desirable [44]. Environmental values can be used as references for individuals or social organizations as types of supportive behaviors that refer to the concern and responsibility of the public to their environment [45,46]. Scholars have measured environmental values in different dimensions. One of the most widely applied environmental values scales is the New Environmental paradigm (NEP), which was originally constructed by Dunalp and Van [47]. For example, Albrecht et al. used the revised new environmental paradigm scale to measure environmental views and summarized this scale into three dimensions via principal component analysis (PCA)—namely, human influence on the balance of nature, growth limit, and human control over nature [48]. Kim et al. applied the NEP scale to explore the impact of environmental values on tourism motivation [49]. Although the NEP scale has been widely used to measure people’s environmental concerns, its dimensionality remains debatable. Stern et al. found that the NEP scale measures perception of human environmental action rather than environmental values [43]. Additionally, the degree to which the original NEP scale remains a valid and reliable measurement tool is open to discussion [50]. Due to the limited ability to predict proenvironmental behaviors, Liu and Chen examined the validity of the Two Major Environmental Values (2-MEV), which were considered in two dimensions (preservation and utilization) [51]. Moreover, 2-MEV has developed and successfully explored the environmental values of children in Western Europe and South Asia by using questionnaires [52].
Scholars have conducted many studies on environmental values, which play certain roles in specific situations [53,54,55]. When individuals face certain situations, their altruistic concerns are triggered. When individuals’ altruistic goals are inconsistent with natural goals, environmental values produce a unique impact [56]. A close relationship exists between environmental values and behaviors. Environmental values can significantly affect environmentally friendly behaviors when the tendency of individuals is in considerable conflict with their situation [26]. Stedman et al. took environmental values as sociological statistical features and applied them in a study of climate change risk perception [53]. A strong correlation may exist between environmental values and public perception of climate change risk events, risk sources, and risk consequences [29,57]. Other scholars have confirmed that emotional factors affect public perception toward various environmental risks, including nuclear energy, nuclear waste, and global warming [54,55]. Environmental risk perception is affected by emotions related to environmental perception and by irrelevant emotions and implicit associations. Therefore, environmental values, to an extent, affect public risk perception. However, no studies have investigated the influence of environmental values on risk perception of typhoons.

3. Research Method

3.1. Hypotheses

Previous studies have found that the threats of a typhoon [18], individual characteristics and governmental disaster management ability can directly affect the risk perception of typhoons [19,42]. Specially, the threat of typhoon disaster will affect the public’s perception of typhoon risk. Some scholars pointed out that the higher the threat degree of typhoon disaster felt by the public, the higher their typhoon risk perception would be [23,41]. Threats will also affect the perception and judgment of risk for high school students, who are more vulnerable than adults. In addition, the government’s disaster management ability also has an impact on the public’s perception of typhoon disaster risk. The government’s grasp of disaster information and the government’s control of a disaster will affect the public’s cognitive level of risk [58]. A great disaster management ability of the government corresponds to the low awareness of the public about typhoon disaster risks [19,59]. Moreover, environmental values may explain the relationship between typhoons and risk perception [29]. Each person holds a unique set of environmental values, different environmental values of high school students will lead to different levels of perception of typhoon risk. As a result, this research proposes the following research hypotheses.
Hypotheses 1 (H1).
Typhoon disaster threat level positively affects the risk perception of high school students.
Hypotheses 2 (H2).
The disaster management ability of the government negatively affects the risk perception of high school students.
Hypotheses 3 (H3).
Environmental values positively affect the risk perception of high school students.

3.2. Variable Measurement
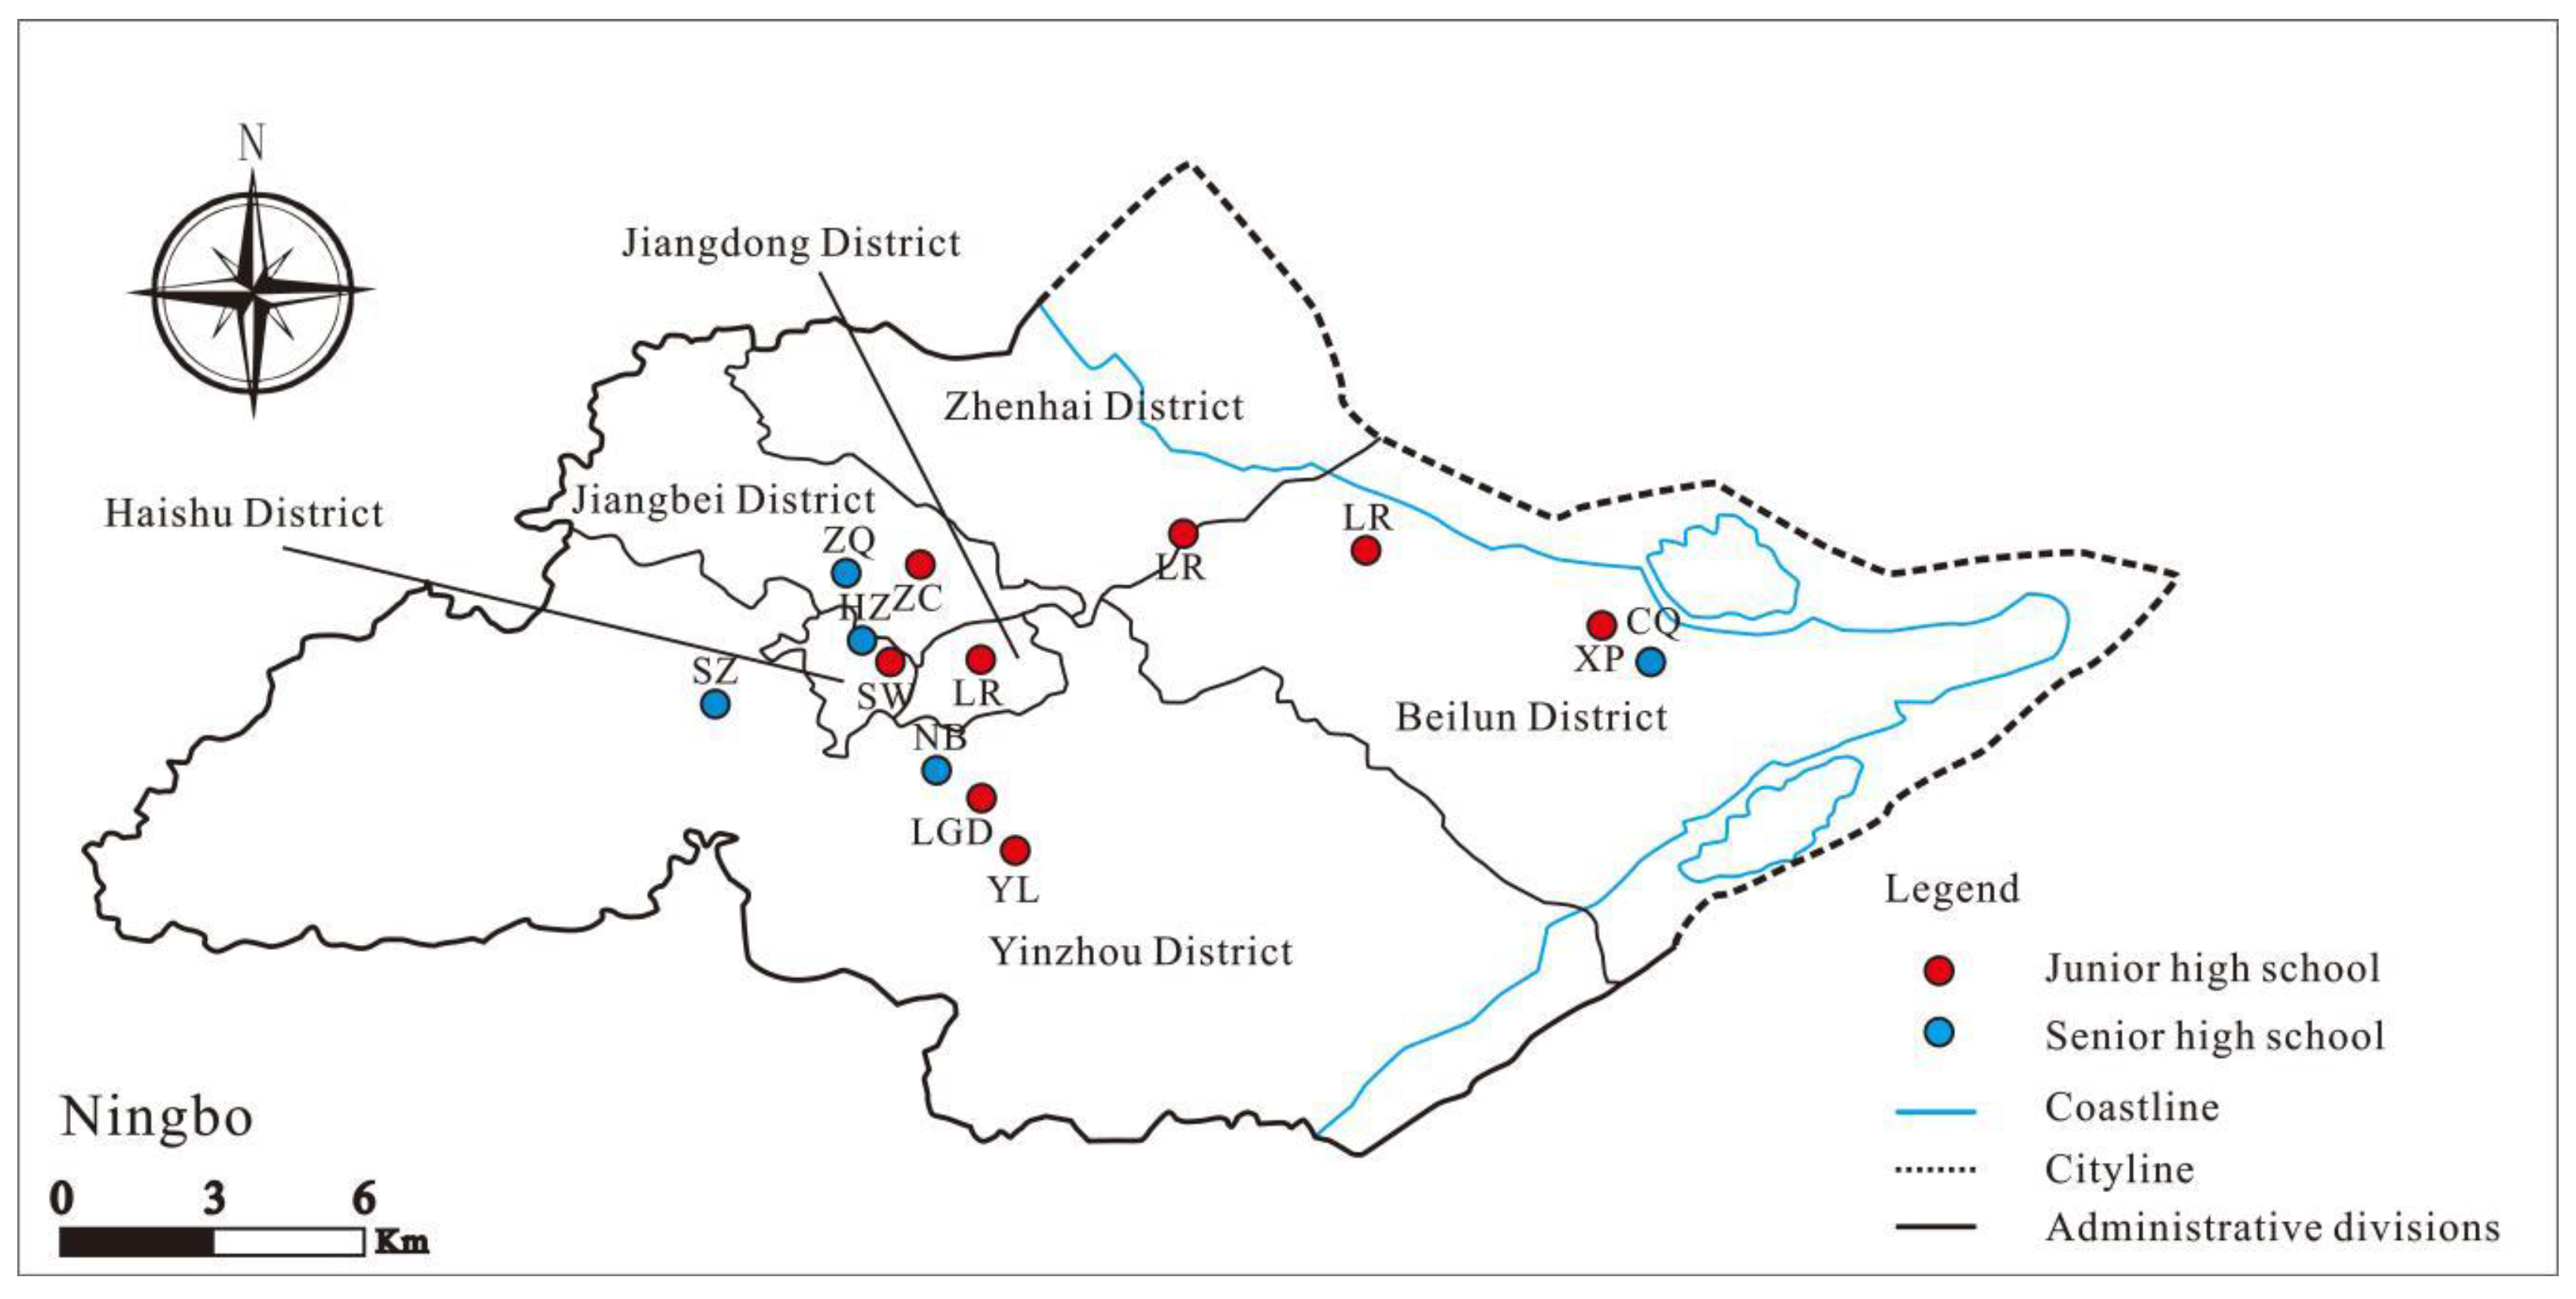
This study investigates risk perception of typhoon disaster from perceiving its influences in terms of economic, liability, personal and environmental perspectives. The relevant indicators were extracted from existing studies. The severity of perceived risk was determined by directly asking respondents to rate the level (1–5) of different typhoon risks. Based on the previous research results, the characteristics of the typhoon itself, and interviews with relevant experts, this paper divides typhoon risk perception into four categories: perception of economic risk, liability risk, personal risk, and environmental risk.
Among these indicators, the measurement of economic risk, personal risk and environmental risks is taken from literature, news reports and interviews. The indicators of economic risk perception are derived from the research of Acosta on the losses and damages caused by floods and landslides caused by typhoons in the Philippines [60], Wang et al. on direct and indirect economics loss assessments of typhoon disasters [61], and Bouwer‘s on disaster losses and anthropogenic climate change [62]. The personal risk index is based on the study of typhoon risk perception of rural residents in Zhejiang by Zhang et al. [18]. Indicators of environmental risk perception are based on Dalisay [63]. These indicators were further solicited through interviews with meteorological experts, government staff, high school leaders in Ningbo and some teachers in March 2018. Based on the public’s climate change risk perception and the actual situation of high school students in Ningbo, China, several indicators of liability risk were developed. These indicators were then revised according to the primary pilot study of the high school students in Ningbo, which was conducted from 2nd to 3rd April, 2018. The measurement of disaster threat is based on the works of Basolo et al. and Zhang et al. [18,23]. The establishment of government disaster management capability index is mainly based on Lei et al.’s research on adaptive governance to typhoon disasters for coastal sustainability [64], Blanco and Vicencie’s research on disaster governance in the Philippines [65], and Fan’s research on disaster governance and community resilience [66]. In order to improve the representativeness and reliability of the indicators, the indicators were rated by experts for three rounds, and the following indicators were finally determined. A five-point Likert scale was used to quantify the risk perception indicators, with the scores 1 and 5 indicating the weak and strong subjective feelings of the respondents, respectively. The finalized measurement items of risk perception of typhoon disaster are demonstrated in Table 1.
Environmental values are measured by revising the NEP scale developed by Dunlap and Van Mere [47], which is the most authoritative and representative scale used in the existing literature. Items in the NEP scale mainly reflect the views of respondents toward natural balance and the control of humans over nature. The respondents assigned values from 1 to 5 to each item to indicate their strong disagreement and strong agreement with each statement, respectively. The NEP scale was revised by Dunlap and Van Mere in 2000 to include five additional aspects, such as the relationship between humans and the environment, thereby resulting in a total of 15 items [67]. The revised NEP scale shows improved reliability and validity compared with its previous version. This study divides environmental values into two parts that are suitable for high school students—namely, the overall coordination and management science views. The overall coordination focuses on the view of partial and overall interests, whereas the management science pays attention to the relationship between immediate and long-term interests, as well as the view of management tools and objectives. A total of 10 measurement indicators are employed and measured using a five-point Likert scale, in which 1, 2, 3, 4, and 5 denote “strongly disagree”, “disagree”, “unclear”, “basic agreement” and “strongly agree”, respectively. The finalized measurement items of environmental value are demonstrated in Table 1.
The general influencing factors include disaster threat and disaster management ability of the government. Disaster threat is measured by estimating the threat degree of typhoon disaster and the secondary disaster brought to life and daily life. A five-point Likert scale was used to quantify the disaster threat, with scores of 1 and 5 indicating weak and strong, respectively. The disaster management capacity of local governments was measured by assessing the government’s ability to conduct disaster mitigation, preparedness, response and recovery. A five-point Likert scale was used to quantify the disaster threat, with scores of 1 and 5 indicating weak and strong, respectively.

3.3. Participants

This study takes high school students in Ningbo as the research subjects. Ningbo is a municipality under the jurisdiction of the Zhejiang Province, located along the southeast coast of China with a total area of 9365.58 km2. The specific location of Ningbo City is shown in Figure 1. As a coastal city, Ningbo has an average of 4.6 typhoons affecting the city all the year round, and 3.1 typhoons obviously affect the city. Since 2007, Ningbo has been continuously hit by strong typhoons, which bring severe challenges to flood and typhoon emergency management, and also bring great losses to industrial and agricultural production and people’s lives. Big data from China Weather Network shows that typhoon landfall sites are mainly concentrated in the central and southern coastal cities [68]. Ningbo was the landfall site six times, ranking second in Zhejiang [68]. In 1956, the most destructive typhoon (Wanda) in China’s history made landfall in Ningbo, which caused serious damage. In Zhejiang Province, 4925 people died and more than 150,000 were injured, 2573 houses collapsed and 196,648 houses partially collapsed, 400,000 hectares of farmland became flooded, and more than 100 ships sank [69].
The object of this study is high school students in Ningbo. High school in China is divided into junior high school students (Grade 7–9) and senior high school students (Grade 10–12), who almost aged between twelves and nineteen. Adolescents gradually form mature perceptions in high school, which allow them to make basic judgments on potential risks. High school students are not only easily affected by disasters but are also important participants in implementing disaster prevention and mitigation measures. Therefore, it is necessary to ensure high school students have the correct understanding of typhoon and typhoon prevention and mitigation. Ningbo has 2058 schools of various levels, including 85 senior high schools, 42 secondary vocational schools, and 208 junior high schools, of which 84 junior high schools and colleges are located in urban areas [70]. The student population in this area comprises 68,764 junior and 28,911 senior high school students, among which 29,961 and 13,556 come from urban areas, respectively [70]. The distribution statistics of high schools in urban areas of Ningbo are shown in Table 2 below.
A stratified random sampling method with grade-level and school distribution stratification was adopted for the sample selection. Stratified sampling is a method of randomly sampling (individuals) in a population which can be divided into different subpopulations (or layers) according to the specified proportion [71]. The advantage of stratified random sampling is that the sample is representative and the sampling error is small [71,72]. The questionnaire was developed based on the specified variable measurement. A pilot study was conducted to collect questionnaires from 15 April to 15 May 2018. In order to make the sample representative, this study selected schools in the administrative regions originally divided by Ningbo City for the questionnaire survey. The distribution of schools and geographical locations investigated in this study are shown in Figure 2.
Since the objects of this study are Chinese high school students, the authors conducted the survey in Chinese in the questionnaire survey stage. In the paper writing stage, the Chinese indicators in the questionnaire were translated into English [73]. The principals or teachers of the participating schools sent out the questionnaires during afternoon self-study and evening self-study. Students had enough time to fill in the questionnaires during these periods and further ensure the quality of the data collected. In the questionnaire survey stage, this paper set up a special research team to provide detailed answers to the questions the interviewees encountered in the questionnaire survey to ensure the authenticity and effectiveness of the questionnaire. Teachers supervised and answered questions about the filling process to the high school students. Apart from conducting the questionnaire survey, certain teachers were interviewed to verify the background knowledge of the participating students, understand the present education situation of their schools, and examine the effects of typhoons and other natural disasters on education in these schools. A total of 1200 questionnaires were distributed, among which 824 valid questionnaires were returned, thereby achieving an effective recovery rate of 68.67%. The questionnaire survey in this study follows the wishes of high school students and was carried under the condition of high school students’ willingness.
Table 3 reveals the basic information of the respondents. The number of valid questionnaires collected for this paper is equal, with 50% males and 50% females, but this is not intentional. The distribution of respondents in grades is relatively balanced. The number of respondents in grade three is relatively small due to the heavy academic pressure. Most of the high school students surveyed live in Ningbo all year round.

3.4. Data Analysis Method

Analyses were conducted in two stages. The first stage is the primary analysis, including the reliability test of the questionnaire and descriptive statistics of the survey results. This stage provides a foundation for the next stage of empirical analysis. SPSS 22.0 was used for this phase of analysis and validation.
The second stage mainly verifies the influencing factors of high school students’ risk perception of typhoon disaster and their mutual relationships. The general linear regression or Logit regression method cannot effectively explain the relationship among factors when many factors are given. Thus, the structural equation modeling (SEM) approach was selected to test the proposed model. AMOS 24.0 was employed to estimate parameters. Analysis was based on the raw data, and the maximum likelihood (ML) method was employed. When the ML estimation method is adopted, the minimum sample size should not be lower than 200. The present study had a sufficient number of samples for the SEM analysis. From the perspective of application analysis, this study used confirmatory factor analysis. Model fitting, validation, parameter estimation, and hypothesis testing are included in this stage.

4. Results

4.1. Primary Analysis

The Cronbach’s alpha coefficient estimation method was used to test the internal consistency of typhoon disaster risk perception and the risk perception influencing factor [74]. Table 4 shows the test results. With regard to latent variable of risk perception, the Cronbach’s alpha values for economic risk, liability risk, personal risk and environmental risk are all greater than 0.8. With regard to latent variable of influence factors, the Cronbach’s alpha values for threat, disaster management ability, and environmental values are greater than 0.65. Nunnally and Bernstein pointed out that a Cronbach’s alpha coefficient that is greater than 0.6 is feasible for exploratory research [75]. The results of the reliability analysis reveal that the reliability of the data collected through questionnaires reached an acceptable level.
Then, the typhoon disaster risk perceptions and influence factors of high school students in Ningbo were explored. Table 5 presents the results of risk perception and influence factors collected in this research. Table 5 indicates that the average risk perception level of high school students for environmental risk perception is 3.711, which is the highest score among all risk perception indexes. By contrast, personal risk perception is the lowest average score—that is, given that high school students in Ningbo experience several typhoons every year, a typhoon disaster has minimal negative effects on their mental health. The average level of economic risk perception is slightly lower than that of the overall risk perception. The average perception level of liability risk perception is close to that of the overall risk perception. Among the influence factors, disaster management ability is the highest average score. Environmental values have the lowest average score, which implies that high school students need to improve their environmental values.
Individuals’ different scores for each index show different judgments and perceptions of their environments. The statistical analysis reveals that the identification degree of high school students on the view that “the limited disaster-bearing capacity of Ningbo cannot bear the typhoon disaster trauma” (EV01) is mainly distributed between relative disagreement and general disagreement. Most of the participating high school students do not agree with the view that “people are the most important players and that nature serves human beings” (EV02). The proportion of participants who strongly disagree with these items is 55.9%. The degree of agreement with the view that “a typhoon disaster likely disrupts the balance of nature” (EV03) is mainly concentrated between generally agree and slightly disagree, thereby indicating that high school students are highly confident in the balance of nature. More than half of the students do not agree with the view that “economic development is more important than environmental protection” (EV04), for which the lowest mean value was obtained. In addition, 39.9% of the students strongly agree with the statement “human beings are abusing and destroying the environment” (EV05), with an average value of 3.812. Nearly half of the participating students agree that “environmental rights take precedence over economic efficiency in the long run” (EV06). Moreover, approximately 40% of the participants agree with the view that “the management factor is more important than the technical factor” (EV07) and “the human destruction of nature often leads to disastrous consequences” (EV08). The degree of agreement of the participants with the views that “although human beings can cope with disasters, they continue to be subject to the laws of nature” (EV09) and “if we do not improve our active responses to typhoon, we will become vulnerable to such disasters” (EV10) is mainly concentrated between relatively agree and strongly agree. Table 6 presents the results in detail.

4.2. Hypothesis Testing

The measurement and structural models constitute a unified model. Therefore, special attention should be paid to the execution order of these two models in the actual operational analysis. A two-stage strategy is most commonly adopted. In the first stage, the factor structure of the model fitting is determined. In the second stage, the setting of the structural model is added and its fit is evaluated without changing the measurement model. In evaluating latent variables, the two-stage strategy is more appropriate than the one-time parameter estimation analysis. Therefore, the two-stage model analysis method was adopted for the parameter estimation and model analysis in this study. This method standardizes the path coefficients in the model during the model analysis to enable a direct comparison of the standardized path coefficients (or standardized load coefficients) of different variables. After analyzing and adjusting the model, the estimation results of the adjusted model path coefficient are presented in Table 7, and the model fitting conditions are shown in Table 8.
Blunch argued that if all fitting indexes meet the requirements of judgment values in Table 7 [76], then the model has a good degree of fit. According to the model fitting data shown in Table 8, all models reached their ideal standards. Therefore, the fitting degree of the modified model greatly improved compared with the original model. The estimated values of all parameters in the path diagram are substituted into the model to obtain the path diagram of high school students’ typhoon disaster risk perceptions, as depicted in Figure 3.
The path analysis results presented in Figure 3 and Table 7 reveal that the path coefficient of threat to risk perception is 0.725 (p = 0.000), thereby suggesting that the greater the threat a typhoon poses to the daily life and surrounding environment of high school students, the higher the risk perception level of these students. Therefore, H1 is supported. The path coefficient of government management’s risk perception is 0.08 (p = 0.024), thereby indicating that the management ability of the government positively affects the risk perception of typhoons among high school students. Therefore, H2 is not supported. The path coefficient of environmental values on risk perception is 0.161 (p = 0.000), revealing that the environmental values of high school students have positive and significant impacts on their typhoon disaster risk perception. A high level of environmental value corresponds to a high level of typhoon disaster risk perception. Therefore, H3 is supported.

5. Discussion

Environmental values have significant positive impacts on typhoon disaster risk perception. This finding is consistent with what has been found in other environmental risks such as global warming, nuclear energy, and nuclear waste [54,55]. High school students have a high level of understanding of the scientific management concept based on the descriptive statistics of environmental values. According to the above analysis, the scores of EV05 (human beings are abusing and destroying the environment) and EV06 (environmental rights take precedence over economic efficiency in the long run) are relatively high, indicating that immediate and long-term interest is the indicator with the highest score, thereby suggesting that high school students focus on the relationship between immediate and long-term environment interests. Most of the large typhoon disasters cause different degrees of collapse of seawalls in coastal areas and the flooding of sea water. The students who have high scores for environmental values can perceive the damage of typhoons to urban environment and ecosystem. As a result, these students are highly aware of environmental protection initiatives and have a high level of risk perception. These students have a good understanding of existing environmental management tools and management objectives.
Disaster threat is the most important factor influencing the risk perception of typhoons among high school students. Typhoons cause extremely large damages to the environment, including public facilities and buildings, thereby posing large threats to high school students with varying degrees of economic losses [61,77]. Secondary disasters caused by typhoons can bring certain losses to the society and the environment [62]. In addition, students can learn about such a threat by referring to news reports and various information channels. Therefore, when a typhoon disaster occurs, the threat felt by high school students is relatively straightforward and strong. This is echoed by existing studies. For instance, Basolo, Steinberg, and Gant, 2017, also found that threat can directly affect the public’s typhoon risk perception when investigating the hurricane risk perception of households in Florida [23]. It is necessary for both adults, adolescents and children to learn more about typhoons and reduce the threats of typhoons.
A literature review reveals that the disaster management ability of the government negatively affects the risk perception level of individuals [19,78]. However, the findings of this study reveal that such an ability has a positive and significant impact on the typhoon disaster risk perception of high school students. This difference can be ascribed to the target participants of these studies. Previous studies have focused on the general public from different age groups, types of work, typhoon experiences with highly distributed demographic differences [23,42]. Yet, this study takes high school students as its research subject with relatively similar ages, disaster experiences, and identities. High school students do not have enough social experiences and have a high degree of trust in their parents, schools, societies, and government agencies. In most cases, these students follow the command and guidance of external authorities. When government departments organize disaster preparedness and mitigation activities, relevant media report on these initiatives. High school students can learn about the disaster preparation and mitigation activities of the government by referring to different information channels, thereby stimulating their information processing and risk perception. Therefore, the disaster management ability of the government has a positive and significant influence on the risk cognition level of high school students.
This work proposes further countermeasures for typhoon disaster prevention and mitigation from the perspective of risk perception based on the research results. First, the risk perception of typhoon prevention among high school students must be enhanced through disaster education and training. Knowledge on the precursors of typhoon must be disseminated, which can effectively reduce the typhoon threats of students. Through the field survey, this study found that the popularization of typhoon disaster prevention and mitigation education in Ningbo is not as good as other disasters, such as earthquakes and fires. Only eight schools have typhoon disaster education in the disaster education system, and the other four schools have not carried out typhoon education. Through the interview, we know that Ningbo high school students can understand the characteristics of all kinds of disasters through disaster education and understand the basic skills of preventing and avoiding disasters, but their practical ability needs to be further improved. Most of the schools do not train disaster coping behaviors specifically for typhoon; only one school carried out typhoon coping training. The process, mechanism, and consequences popularize the methods of disaster prevention and effective measures of disaster prevention and reduction. These measures can assist high school students to correctly understand the threats posed by typhoon and raise the level of risk awareness of typhoons, which is beneficial for them in terms of dealing with typhoon threats.
Second, good guidance in the construction of high school students’ environmental values is necessary. Great importance should be placed on typhoon prevention, including coordination and dealing with the relationships between population, resources, and the environment; the vigorous development of the ecological and the green economy; and the promotion of the sustainable development of social economy. Responsibility for the environment and society among high school students must be cultivated based on the concept of sustainable development, which leads to good behavior habits and lifestyles in students and harmony among individuals, society, and the environment. Disaster education should be integrated into daily life, so that when high school students encounter a typhoon, they can fully consider the environment and the situation they encounter to deal with typhoon according to the knowledge they have learned. Moreover, typhoon disaster prevention and reduction training should be actively performed. Schools should combine with social resources to provide students with access to off-campus typhoon knowledge to enrich disaster education and assist students to master practical skills. The school can organize students to go to the disaster area to truly understand the losses caused by the typhoon disaster and the real environment after a typhoon. The spot experience of disaster can make up for the deficiency of classroom teaching and improve the enthusiasm of students to learn about disasters. In addition, the school can also organize teachers and students to go to the typhoon experience hall to carry out on-site teaching, so that students can systematically learn about typhoons and deepen their impression of typhoon environments.
In addition, strengthening the risk awareness of typhoons among high school students can improve the trust of the public in the disaster management ability of the government, enhance the confidence of high school students in dealing with other disasters, and assist the government in carrying out effective disaster reduction actions. Additionally, it is necessary to combine information communication technology to strengthen students’ simulation experiences. Students can play different roles in typhoon emergency action such as government officers, social rescuers, and victims, which can help them truly experience the situation when disasters occur. In view of the existence of students in school, on the way to and from school, vacation and other states, the school needs to strengthen the practical training of different scenes in the simulation of disaster education. Typhoon simulation training can also relieve their tension and other psychological problems in time. The school can apply the information interaction platform to collect the data of the disaster drill and summarize the experience of the previous drill.

6. Conclusions

This paper investigated the influence of environmental values on risk perception of typhoons among high school students. After a pilot study to finalize the questionnaire, the formal survey was conducted among high school students in Ningbo who were selected via stratified sampling. SEM was also employed to analyze the influence of various factors on the risk perception of typhoons among high school students to verify the proposed theoretical model and to test the hypotheses. The results reveal that environmental values have significantly positive impacts on the risk perception of typhoons, disaster threats have significantly positive impacts on the risk perception of typhoons, and the disaster management ability of the government has a significant positive impact on the risk perception of typhoons.
Several limitations exist in the current study. The measurement of variables in this study was developed from existing studies, which usually take the general public as the research subject. Future efforts should be conducted to design more suitable measurements for high school students and analyze more socio-economic factors. In addition, this study merely focuses on high school students in Ningbo City, which does not cover the other cities affected by typhoons. In the future research, the scope of research objects can be expanded to make the research more comprehensive and more universal. In addition, this research focuses on high school students and overlooks other vulnerable groups. Future studies can investigate the influence of environmental values on risk perception of typhoons for the elderly and the disabled as they are also vulnerable.

Author Contributions

Conceptualization, J.S., S.J. and X.G.; Data curation, F.Z.; Formal analysis, L.Y.; Investigation, F.Z.; Methodology, J.S., S.J. and X.G.; Software, L.Y.; Validation, F.Z.; Writing–original draft, J.S., X.G., and L.Y.; Writing—review and editing, X.G., S.J., F.Z. and L.Y. All authors have read and agreed to the published version of the manuscript.

Funding

This research was jointly supported by the Science and Technology Innovation Plan for College Students in Zhejiang Province in 2020 (grant number 2020R414036), Soft Science Research in Zhejiang Province (grant number 2020C35061), and Urban Emergency Management Research Innovation Team of Zhejiang University of Finance and Economics.

Institutional Review Board Statement

Not applicable.

Informed Consent Statement

Not applicable.

Data Availability Statement

The data presented in this study are available on request from the corresponding author. The data are not publicly available due to research privacy.

Acknowledgments

The authors appreciate the suggestions provided by Yi Peng. Ningbo high school students and teachers are also acknowledged for providing investigation support for this research.

Conflicts of Interest

The authors declare no conflict of interest.

References

  1. IPCC. Climate Change 2007: The Scientific Basis; Cambridge University Press: Cambridge, UK, 2007. [Google Scholar]
  2. EM-DAT. The International Disaster Database. 2020. Available online: http://www.emdat.be/database (accessed on 25 December 2020).
  3. Yin, J.; Yin, Z.; Xu, S. Composite risk assessment of typhoon-induced disaster for china’s coastal area. Nat. Hazards 2013, 69, 1423–1434. [Google Scholar] [CrossRef]
  4. People.cn. Strong Typhoon “Fitow” Hit Ningbo. 2014. Available online: http://nb.people.com.cn/BIG5/n/2013/1227/c206131-20251202.html (accessed on 20 March 2021).
  5. Ministry of Emergency Management of the People’s Republic of China. 2018. Available online: http://www.mem.gov.cn/xw/yjyw/201809/t20180916_229948.shtml (accessed on 5 April 2021).
  6. Jiang, L.P.; Yao, L.; Bond, E.F.; Wang, Y.L.; Huang, L.Q. Risk perceptions and preparedness of typhoon disaster on coastal inhabitants in china. Am. J. Disaster Med. 2011, 6, 119–126. [Google Scholar] [CrossRef]
  7. Kalkstein, A.J.; Sheridan, S.C. The social impacts of the heat–health watch/warning system in Phoenix, Arizona: Assessing the perceived risk and response of the public. Int. J. Biometeorol. 2007, 52, 43–55. [Google Scholar] [CrossRef]
  8. Miceli, R.; Sotgiu, I.; Settanni, M. Disaster preparedness and perception of flood risk: A study in an alpine valley in Italy. J. Environ. Psychol. 2008, 28, 164–173. [Google Scholar] [CrossRef]
  9. David, C.C.; Monterola, S.L.C.; Paguirigan, A., Jr.; Legara, E.F.T.; Tarun, A.B.; Batac, R.C.; Osorio, J.P. School hazard vulnerability and student learning. Int. J. Educ. Res. 2018, 92, 20–29. [Google Scholar] [CrossRef]
  10. Tuladhar, G.; Yatabe, R.; Dahal, R.K.; Bhandary, N.P. Knowledge of disaster risk reduction among school students in Nepal. Geomat. Nat. Hazards Risk 2014, 5, 190–207. [Google Scholar] [CrossRef] [Green Version]
  11. Tang, T.C.; Yen, C.F.; Cheng, C.P.; Yang, P.; Chen, C.S.; Yang, R.C.; Huang, M.S.; Jong, Y.J.; Yu, H.S. Suicide risk and its correlate in adolescents who experienced typhoon-induced mudslides: A structural equation model. Depress. Anxiety 2010, 27, 1143–1148. [Google Scholar] [CrossRef]
  12. Goenjian, A.K.; Molina, L.; Steinberg, A.M.; Fairbanks, L.A.; Alvarez, M.L.; Goenjian, H.A.; Pynoos, R.S. Posttraumatic stress and depressive reactions among Nicaraguan adolescents after hurricane mitch. Am. J. Psychiatry 2001, 158, 788–794. [Google Scholar] [CrossRef]
  13. Yang, P.; Yen, C.F.; Tang, T.C.; Chen, C.S.; Yu, H.S. Posttraumatic stress disorder in adolescents after typhoon Morakot-associated mudslides. J. Anxiety Disord. 2011, 25, 362–368. [Google Scholar] [CrossRef]
  14. Mutarak, R.; Lutz, W. Is education a key to reducing vulnerability to natural disasters and hence unavoidable climate change? Ecol. Soc. 2014, 19, 42. [Google Scholar] [CrossRef] [Green Version]
  15. Wu, W.; Zheng, J.; Fang, Q. How a typhoon event transforms public risk perception of climate change: A study in china. J. Clean. Prod. 2020, 261, 121163. [Google Scholar] [CrossRef]
  16. Uy, N.; Takeuchi, Y.; Shaw, R. Local adaptation for livelihood resilience in Albay, Philippines. Environ. Hazards 2011, 10, 139–153. [Google Scholar] [CrossRef]
  17. Bandecchi, A.E.; Pazzi, V.; Morelli, S.; Valori, L.; Casagli, N. Geo-hydrological and seismic risk awareness at school: Emergency preparedness and risk perception evaluation. Int. J. Disaster Risk Reduct. 2019, 40, 101280. [Google Scholar] [CrossRef]
  18. Zhang, W.; Wang, W.; Lin, J.; Zhang, Y.; Shang, X.; Wang, X.; Huang, M.; Liu, S.; Ma, W. Perception, knowledge and behaviors related to typhoon: A cross sectional study among rural residents in Zhejiang, China. Int. J. Environ. Res. Public Health 2017, 14, 492. [Google Scholar] [CrossRef] [Green Version]
  19. Shen, Y.; Lou, S.; Zhao, X.; Ip, K.P.; Xu, H.; Zhang, J. Factors impacting risk perception under typhoon disaster in Macao SAR, China. Int. J. Environ. Res. Public Health 2020, 17, 7357. [Google Scholar] [CrossRef] [PubMed]
  20. Costas, S.; Ferreira, O.; Martinez, G. Why do we decide to live with risk at the coast? Ocean Coast. Manag. 2015, 118, 1–11. [Google Scholar] [CrossRef]
  21. Shao, W.; Gardezi, M.; Xian, S. Examining the effects of objective hurricane risks and community resilience on risk perceptions of hurricanes at the county level in the US Gulf Coast: An innovative approach. Ann. Am. Assoc. Geogr. 2018, 108, 1389–1405. [Google Scholar] [CrossRef] [Green Version]
  22. Wachinger, G.; Renn, O.; Begg, C.; Kuhlicke, C. The risk perception paradox-implications for governance and communication of natural hazards. Risk Anal. 2013, 33, 1049–1065. [Google Scholar] [CrossRef] [PubMed]
  23. Basolo, V.; Steinberg, L.J.; Gant, S. Hurricane threat in Florida: Examining household perceptions, beliefs, and actions. Environ. Hazards 2017, 16, 253–275. [Google Scholar] [CrossRef]
  24. Dietz, T. Environmental values. Handbook of value: Perspectives from economics, neuroscience, philosophy. Psychol. Sociol. 2015, 39, 330–351. [Google Scholar]
  25. Stern, P.C.; Dietz, T.; Abel, T.; Guagnano, G.A.; Kalof, L. Avalue belief norm theory of support for social movements: The case of environmental concern. Hum. Ecol. Rev. 1999, 6, 1–97. [Google Scholar]
  26. Corraliza, J.A.; Berenguer, J. Environmental values, beliefs, and actions: A situational approach. Environ. Behav. 2000, 32, 832–848. [Google Scholar] [CrossRef]
  27. Dutcher, D.D.; Finley, J.C.; Luloff, A.E.; Johnson, J.B. Connectivity with nature as a measure of environmental values. Environ. Behav. 2007, 39, 474–493. [Google Scholar] [CrossRef]
  28. Willis, H.H.; DeKay, M.L. The roles of group membership, beliefs, and norms in ecological risk perception. Risk Anal. 2007, 27, 1365–1380. [Google Scholar] [CrossRef]
  29. Leiserowitz, A. Climate change risk perception and policy preferences: The role of affect, imagery, and values. Clim. Chang. 2006, 77, 45–72. [Google Scholar] [CrossRef] [Green Version]
  30. Tsuboki, K.; Yoshioka, M.K.; Shinoda, T.; Kato, M.; Kitoh, A. Future increase of supertyphoon intensity associated with climate change: Increase of super-typhoon intensity. Geophys. Res. Lett. 2014, 42, 646–652. [Google Scholar] [CrossRef]
  31. Slovic, P. Perception of risk. Science 1987, 236, 280. [Google Scholar] [CrossRef] [PubMed]
  32. Slovic, P. Perceived risk, trust, and democracy. Risk Anal. 1993, 13, 675–682. [Google Scholar] [CrossRef] [Green Version]
  33. Lieske, D.J.; Wade, T.; Roness, L.A. Climate change awareness and strategies for communicating the risk of coastal flooding: A canadian maritime case example. Estuar. Coast. Shelf Sci. 2014, 140, 83–94. [Google Scholar] [CrossRef]
  34. Stedman, R.C. Toward a social psychology of place: Predicting behavior from place-based cognitions, attitude and identity. Environ. Behav. 2002, 34, 561–581. [Google Scholar] [CrossRef]
  35. Renn, O.; Rohrmann, B. (Eds.) Cross-Cultural Risk Perception: A Survey of Empirical Studies; Springer Science & Business Media: Berlin/Heidelberg, Germany, 2000; Volume 13. [Google Scholar]
  36. Kasperson, R.E.; Renn, O.; Slovic, P.; Brown, H.S.; Emel, J.; Goble, R.; Kasperson, J.X.; Ratick, S. The social amplification of risk: A conceptual framework. Risk Anal. 1988, 8, 177–187. [Google Scholar] [CrossRef] [Green Version]
  37. Peacock, W.G.; Brody, S.D.; Highfield, W. Hurricane risk perceptions among Florida’s single family homeowners. Landsc. Urban Plan. 2005, 73, 120–135. [Google Scholar] [CrossRef]
  38. Sun, Y.; Han, Z. Climate change risk perception in Taiwan: Correlation with individual and societal factors. Int. J. Environ. Res. Public Health 2018, 15, 91. [Google Scholar] [CrossRef] [PubMed] [Green Version]
  39. Demuth, J.L.; Morss, R.E.; Lazo, J.K.; Trumbo, C. The effects of past hurricane experiences on evacuation intentions through risk perception and efficacy beliefs: A mediation analysis. Weather Clim. Soc. 2016, 8, 327–344. [Google Scholar] [CrossRef]
  40. Lujala, P.; Lein, H.; Rød, J.K. Climate change, natural hazards, and risk perception: The role of proximity and personal experience. Local Environ. 2014, 20, 489–509. [Google Scholar] [CrossRef] [Green Version]
  41. Matyas, C.; Srinivasan, S.; Cahyanto, I.; Thapa, B.; Pennington-Gray, L.; Villegas, J. Risk perception and evacuation decisions of florida tourists under hurricane threats: A stated preference analysis. Nat. Hazards 2011, 59, 871–890. [Google Scholar] [CrossRef]
  42. Stein, R.; Buzcu-Guven, B.; Duefias-Osorio, L.; Subramanian, D.; Kahle, D. How risk perceptions influence evacuations from hurricanes and compliance with government directives. Policy Stud. J. 2013, 41, 319–342. [Google Scholar] [CrossRef]
  43. Stern, P.C.; Dietz, T.; Guagnano, G.A. The new ecological paradigm in social-psychological context. Environ. Behav. 1995, 27, 723–743. [Google Scholar] [CrossRef]
  44. Whitfield, S.C.; Rosa, E.A.; Dan, A.; Dietz, T. The future of nuclear power: Value orientations and risk perception. Risk Anal. 2010, 29, 425–437. [Google Scholar] [CrossRef] [PubMed]
  45. Guerrier, Y.; Alexander, N.; Chase, J.; O’Brien, M. Values and the environment: A social science perspective. Organ. Behav. Hotels Restaur. Int. Perspect. 1995, 5, 279–282. [Google Scholar]
  46. Schwartz, S.H. Rethinking the concept and measurement of societal culture in light of empirical findings. J. Cross-Cult. Psychol. 2014, 45, 5–13. [Google Scholar] [CrossRef]
  47. Dunlap, R.E.; Van Liere, K.D. The “New Environmental Paradigm”: A proposed measuring instrument and preliminary results. J. Environ. Educ. 1978, 9, 10–19. [Google Scholar] [CrossRef]
  48. Albrecht, D.; Bultena, G.; Hoiberg, E.; Nowak, P. Measuring environmental concern: The new environmental paradigm scale. J. Environ. Educ. 2010, 13, 39–43. [Google Scholar] [CrossRef]
  49. Kim, H.; Borges, M.C.; Chon, J. Impacts of environmental values on tourism motivation: The case of Fica, Brazil. Tour. Manag. 2006, 27, 957–967. [Google Scholar] [CrossRef]
  50. Lalonde, R.; Jackson, E.L. The new environmental paradigm scale: Has it outlived its usefulness? J. Environ. Educ. 2002, 33, 28–36. [Google Scholar] [CrossRef]
  51. Liu, W.; Chen, J. Modified two major environmental values scale for measuring Chinese children’s environmental attitudes. Environ. Educ. Res. 2019, 26, 130–147. [Google Scholar] [CrossRef]
  52. Regmi, S.; Johnson, B.; Dahal, B.M. Analysing the environmental values and attitudes of rural Nepalese children by validating the 2-mev model. Sustainability 2019, 12, 164. [Google Scholar] [CrossRef] [Green Version]
  53. Stedman, R.C.; Davidson, D.J.; Wellstead, A. Risk and climate change: Perceptions of key policy actors in Canada. Risk Anal. 2004, 24, 1395–1406. [Google Scholar] [CrossRef]
  54. Sjöberg, L. Emotions and risk perception. Risk Manag. 2007, 9, 223–237. [Google Scholar] [CrossRef]
  55. Bourassa, M.; Doraty, K.; Berdahl, L.; Fried, J.; Bell, S. Support, opposition, emotion and contentious issue risk perception. Int. J. Public Sect. Manag. 2016, 29, 201–216. [Google Scholar] [CrossRef]
  56. Niemeijer, D.; Groot, R.S.D. Framing environmental indicators: Moving from causal chains to causal networks. Environ. Dev. Sustain. 2008, 10, 89–106. [Google Scholar] [CrossRef]
  57. Carlton, S.J.; Jacobson, S.K. Climate change and coastal environmental risk perceptions in Florida. J. Environ. Manag. 2013, 130, 32–39. [Google Scholar] [CrossRef]
  58. Erdozain, M.S.; Allen, K.J.; Morley, K.A.; Powell, D.A. Failures in sprouts-related risk communication. Food Control 2013, 30, 649–656. [Google Scholar] [CrossRef] [Green Version]
  59. Ross, V.L.; Fielding, K.S.; Louis, W.R. Social trust, risk perceptions and public acceptance of recycled water: Testing a social-psychological model. J. Environ. Manag. 2014, 137, 61–68. [Google Scholar] [CrossRef] [PubMed]
  60. Acosta, L.A.; Eugenio, E.A.; Macandog, P.B.M.; Magcale-Macandog, D.B.; Lin, E.K.H.; Abucay, E.R.; Cura, A.L.; Primavera, M.G. Loss and damage from typhoon-induced floods and landslides in the Philippines: Community perceptions on climate impacts and adaptation options. Int. J. Glob. Warm. 2016, 9, 33–65. [Google Scholar] [CrossRef]
  61. Wang, G.; Chen, R.; Chen, J. Direct and indirect economic loss assessment of typhoon disasters based on ec and io joint model. Nat. Hazards 2017, 87, 1751–1764. [Google Scholar] [CrossRef]
  62. Bouwer, L.M. Have disaster losses increased due to anthropogenic climate change? Bull. Am. Meteorol. Soc. 2011, 92, 39–46. [Google Scholar] [CrossRef] [Green Version]
  63. Dalisay, S.N.; De Guzman, M.T. Risk and culture: The case of typhoon Haiyan in the Philippines. Disaster Prev. Manag. Int. J. 2016, 25, 701–714. [Google Scholar] [CrossRef]
  64. Lei, Y.; Liu, C.; Zhang, L.; Wan, J.; Li, D.; Yue, Q.; Guo, Y. Adaptive governance to typhoon disasters for coastal sustainability: A case study in Guangdong, China. Environ. Sci. Policy 2015, 54, 281–286. [Google Scholar] [CrossRef]
  65. Blanco, D.V. Disaster governance in the Philippines: Issues, lessons learned, and future directions in the post-Yolanda super typhoon aftermath. Int. J. Public Adm. 2015, 38, 743–756. [Google Scholar] [CrossRef]
  66. Fan, M.F. Disaster governance and community resilience: Reflections on typhoon Morakot in Taiwan. J. Environ. Plan. Manag. 2015, 58, 24–38. [Google Scholar] [CrossRef]
  67. Dunlap, R.E.; Van Liere, K.D.; Mertig, A.G.; Emmet Jones, R. Measuring endorsement of the new ecological paradigm: A revised nep scale. J. Soc. Issues 2000, 56, 425–442. [Google Scholar] [CrossRef]
  68. China Weather Network. 2020. Available online: https://www.tianqi.com/zhuanti/zhejiangtaifeng/#lishi (accessed on 5 April 2021).
  69. Tencent News. The Most Destructive Typhoon in Chinese History. 2021. Available online: https://new.qq.com/omn/20210127/20210127A0G9WN00.html (accessed on 5 April 2021).
  70. Ningbo Yearbook. 2017. Available online: http://vod.ningbo.gov.cn:88/nbtjj/tjnj/2017nbnj/indexch.htm (accessed on 5 April 2021).
  71. Kadilar, C.; Cingi, H. Ratio estimators in stratified random sampling. Biom. J. 2010, 45, 218–225. [Google Scholar] [CrossRef]
  72. Stehman, S.V. Estimating the kappa coefficient and its variance under stratified random sampling. Photogramm. Eng. Remote Sens. 1996, 62, 401–407. [Google Scholar]
  73. Peng, Y.; Zhang, F.; Jiang, S.; Huang, L.; Wang, Z.; Xu, Y. Analysis of farmers’ satisfaction towards concentrated rural settlement development after the Wenchuan earthquake. Int. J. Disaster Risk Reduct. 2018, 31, 160–169. [Google Scholar] [CrossRef]
  74. Peng, Y.; Gu, X.; Zhu, X.; Zhang, F.; Song, Y. Recovery evaluation of villages reconstructed with concentrated rural settlement after the Wenchuan earthquake. Nat. Hazards 2020. [Google Scholar] [CrossRef]
  75. Nunnally, J.C.; Bernstein, I.H. Psychometric Theory, 3rd ed.; McGraw-Hill: New York, NY, USA, 1994. [Google Scholar]
  76. Blunch, N. Introduction to Structural Equation Modeling Using IBM SPSS Statistics and AMOS; Sage: Thousand Oaks, CA, USA, 2012. [Google Scholar]
  77. Shen, J.; Feng, Z.; Zeng, G.; Zhu, B.P. Risk factors for injury during typhoon Saomei. Epidemiology 2009, 20, 892–895. [Google Scholar] [CrossRef] [PubMed]
  78. Han, Z.; Lu, X.; Hörhager, E.I.; Yan, J. The effects of trust in government on earthquake survivors’ risk perception and preparedness in China. Nat. Hazards 2017, 86, 437–452. [Google Scholar] [CrossRef]
Figure 1. The geographical location of Ningbo.
Sustainability 13 04145 g001
Figure 2. Administrative district division map of Ningbo City and sample schools.
Sustainability 13 04145 g002
Figure 3. Path coefficient diagram of risk perception of typhoon for high school students.
Sustainability 13 04145 g003
Table 1. Measurement of involved variables and reference sources of this study.
VariableCategoryItemsReference Sources
Risk perceptionEconomic risk
(EC)
EC01: Loss of personal and family propertyNews reports and interviews;
[60,61,62]
EC02: Ship loss at sea
EC03: House and building destruction
EC04: Infrastructure loss
EC05: Crop loss
EC06: Service industry losses
EC07: Industrial loss
EC08: Insurance compensation
Liability risk
(LI)
LI01: Government responsibility[1]; Interview
LI02: Insurance company responsibility
LI03: Media responsibility
LI04: Environmental organization responsibility
LI05: Individual responsibility
LI06: School responsibility
Personal risk
(PE)
PE01: Personal safetyNews reports and interviews;
[18]
PE02: Personal mental health impact
PE03: Family member safety
PE04: Life Quality
PE05: Daily schooling impact
PE06: Daily travel impact
Environmental risk
(EN)
EN01: landslides and mudslidesNews reports and interviews;
[63]
EN02: Risk of power outage
EN03: Trees and telephone poles are blown down by the wind, and the risk of falling objects is high.
EN04: Traffic accident risk
EN05: The sewer cover is washed away.
EN06: Ponding risk.
EN07: Possibility of infectious diseases caused by typhoon
EN08: Possibility of flood caused by heavy rainfalls
Environmental
Value
(EV)
Overall coordination viewEV01: Limited carrying capacity[47]
EV 02: Nature serves man
EV 03: Balance in nature
EV 04: Growing the economy
Management scienceEV 05: Abuse of the environment
EV 06: Economic efficiency
EV 07: Management factors
EV 08: Natural damage
EV 09: Subject to the laws of nature
EV 10: Enhance positive coping behaviors
Disaster threat DT 1: The severity level of life threatened by typhoon [18,23]
DT 2: The severity level of daily living threatened by typhoon
Disaster management ability of government DM1: The government’s ability to conduct disaster mitigation[18,23,66]
DM2: The government’s ability to conduct disaster preparedness
DM3: The government’s ability to conduct disaster response
DM4: The government’s ability to conduct disaster recovery
Table 2. Statistics on the number of urban high schools in Ningbo.
DistrictHaishu DistrictJiangdong DistrictJiangbei DistrictBeilun DistrictZhenhai DistrictYinzhou District
Junior high school861018729
Senior high school0015414
Table 3. Analysis of basic data of respondents.
Individual
Characteristics
AmountEffective
Percentage (%)
GenderMale41250.00
Female41250.00
GradeJunior One22126.85
Junior Two17821.63
Junior Three12915.67
Senior One13816.77
Senior Two13216.04
Senior Three263.16
Duration of residence in Ningbo0–5 years597.17
6–10 years15218.47
11–15 years36644.47
over 16 years24730.01
Parents’ occupationsfreelance22226.97
State units and public servants10612.88
Enterprise staff28534.63
Else21125.64
Parents
education level
High school and below44353.83
Technical secondary school9211.18
Junior college13015.80
Undergraduate12114.70
Postgraduate and above384.62
Annual household
income
CNY 50,000 or less11013.37
CNY 50,000–100,00020925.39
CNY 100,000–150,00020324.67
CNY 150,000–200,00010813.12
CNY 20,000 and above19423.57
Table 4. Reliability test of variables.
Risk PerceptionαInfluence Factorsα
Economic risk0.859Threat0.859
Liability risk0.806Disaster management ability0.963
Personal risk0.835Environmental values0.666
Environmental Risk0.852
Table 5. Statistical comparison of scores of typhoon disaster risk perception and influence factors among high school students in Ningbo.
Risk PerceptionMeanInfluence FactorsMean
Economic risk3.382Threat3.542
Liability risk3.443Disaster management ability3.7806
Personal risk3.197Environmental values3.244
Environmental Risk3.711
Table 6. Statistics on the scores of environmental value.
Very
Disagree (%)
Less
Agree (%)
General
(%)
Comparative Agree (%)Very Agree (%) Mean Variance
Overall coordination viewEV0117.220.131.618.013.12.8961.586
EV0255.912.314.98.68.32.0101.798
EV0318.920.530.716.313.62.8511.648
EV0456.814.113.18.77.31.9561.704
Management scienceEV054.511.921.522.239.93.8121.460
EV065.68.317.022.047.23.9701.475
EV075.114.439.820.919.83.3581.222
EV083.28.521.125.042.23.9471.256
EV095.010.024.825.435.03.7541.384
EV104.28.121.726.839.13.8831.304
Table 7. Standardized path coefficient estimation results.
EstimateS.E.C.R.p
Risk perceptionEnvironmental values0.1610.054.495***
Risk perceptionThreat0.7250.03815.506***
Risk perceptionDisaster management ability0.080.0292.2520.024
Liability riskRisk perception0.5530.05414.817***
Personal riskRisk perception0.7130.05819.126***
Economic riskRisk perception0.747
Environmental RiskRisk perception0.770.04720.578***
Overall Coordination ViewEnvironmental values0.612
Management ScienceEnvironmental values0.9020.14610.025***
Life threatThreat0.854
Living threatThreat0.8430.0424.664***
RecoveryDisaster management ability0.829
ResponseDisaster management ability0.9160.03232.822***
PreparednessDisaster management ability0.8820.03231.171***
MitigationDisaster management ability0.7040.04122.282***
(p value is significant, p < 0.05 is significant, p < 0.001, indicated by the symbol “***”).
Table 8. Calculation results of commonly used fitting indices.
Fitting IndexCMIN/DFRMRRMSEAGFIAGFIIFICFINFI
Result2.2740.0530.0390.9530.9390.9700.9700.948
Judgment value<3The smaller the better<0.08>0.9>0.9>0.9>0.9>0.9
Publisher’s Note: MDPI stays neutral with regard to jurisdictional claims in published maps and institutional affiliations.

