Article

The Impact of Stable Customer Relationships on Enterprises’ Technological Innovation Based on the Mediating Effect of the Competitive Advantage of Enterprises

Dongwu Business School, Soochow University, Suzhou 215006, China
*
Author to whom correspondence should be addressed.
Sustainability 2021, 13(7), 3610; https://doi.org/10.3390/su13073610
Submission received: 24 February 2021 / Revised: 17 March 2021 / Accepted: 19 March 2021 / Published: 24 March 2021

Abstract

:
Technological innovation and stable customer relationships are both important factors for the sustainable development of enterprises. However, it remains unclear whether there is a relationship between stable customer relationships and technological innovation. In this work, we manually collected data regarding customer relationships and the innovation of manufacturing companies listed in the A-Share index in China from 2009 to 2016. Through empirical analysis, this work used a two-way fixed effect model and intermediary effect model tests to explore the impact of stable customer relationships on technological innovation. The empirical research found the following. (1) Stable customer relationships significantly promote the technological innovation of enterprises, and the empirical results are still valid after a variety of robust tests. The competitive advantage of enterprises forms a part of the intermediary role in the relationship above. (2) Comparing the samples of large-scale enterprises, state-owned enterprises, mature enterprises, and low-capital-intensive enterprises, the research found that stable customer relationships can significantly promote corporate technological innovation in small-scale enterprises, non-state-owned enterprises, young enterprises, and highly capital-intensive enterprises. This article enriches and deepens our understanding of the mechanism by which stable customer relationships affect enterprises’ technological innovation. At the same time, this research is helpful for better evaluating the impact of establishing a stable customer relationship on the sustainable competitive advantage of enterprises.

1. Introduction

With the gradual rise and promotion of supply chain management, determining whether the supply chain can result in an advantageous position in market competition has become an important indicator for measuring companies. In October 2017, the General Office of the State Council issued the “Guiding Opinions on Actively Promoting Supply Chain Innovation and Application”. For the first time, supply chain development has been elevated to the status of one of the national strategies. In order to integrate and optimize the supply chain and create a community of interests, stable customer relationships are essential. In addition, the Chinese Accounting Standards continue to increase the disclosure of customer information by companies. The Guidelines 2007 require a listed company to disclose “their major customers and introduce the company’s total sales to the top five customers as a percentage of the company’s total sales”. The new standards of China Securities Regulatory Commission (CSRC) that are applicable to companies on the Main Board and Growth Enterprise Market, which came into effect on 1 January 2013, stipulate that “companies should disclose the information of their major customers and disclose the proportion of the company’s top five customer sales to the company’s total sales in two ways, separately and in aggregate. Further, companies are encouraged to disclose the names and sales of the top five customers separately; customers who belong to the same controller should be listed separately.” It can be seen from the CSRC’s strengthening of the disclosure requirements of detailed information by enterprises about their customers that the relationship between customers and enterprises has attracted increasing attention from stakeholders.
China’s economy has entered the “new normal” stage. The promotion of supply-side structural reforms basically depends on innovation. Zhang et al. [1] stated that innovation was increasingly becoming a decisive factor in maintaining and driving the sustainable development of China’s economy. At the same time, scholars have been committed to studying the influencing factors and driving forces of innovation. Many scholars have studied the perspectives of enterprise characteristics, such as corporate governance [2,3,4,5,6,7,8], human capital [9,10,11], and the nature of property [12,13]. The impact of customer relationships on innovation has also been studied from the perspective of laws and finance [14,15,16,17,18,19,20,21]. Although customer relationships have played important roles in supply chain management, there is scant literature regarding whether they promote the technological innovation of enterprises.
Research into the influence of customer relationships on corporate behavior and its economic consequences has mainly focused on the dimension of customer concentration [22,23,24,25,26]. There is little work in the literature on the impact of customer relationships on business from the perspective of customer stability. For example, the study of Li and Yang [27] found that a stable customer relationship has a positive impact on corporate debt financing. Wang and Peng [28] studied the impact of customer stability on earnings management. However, there are no articles discussing the impact of stable customer relationships on enterprises’ technological innovation. In contrast to the work above, this article studies the impact of stable customer relationships on enterprises’ technological innovation.
In addition, this article also studies the mechanism by which stable customer relationships affect enterprises’ technological innovation. The stable relationship between enterprises and customers has the characteristics of being heterogeneous, valuable, scarce, and difficult to imitate. According to the resource-based view, it is one of a company’s competitive advantages. Yang et al. [29] proposed the idea that the stronger a company’s competitive advantage, the more the company’s technological innovation can be promoted. Unfortunately, there are no studies that bring stable customer relationships, corporate competitive advantages, and corporate technological innovation into one framework. So, does the stability of customer relationships promote the technological innovation of an enterprise by enhancing the competitive advantage of the enterprise? This hypothesis is worth testing.
Moreover, the heterogeneous characteristics of enterprises, such as the enterprise scale, property rights, enterprise age, and enterprise capital intensity, can not only directly affect an enterprise’s technological innovation, but also affect the relationship between stable customers and technological innovation. Large-scale enterprises, state-owned enterprises (SOE) and more mature enterprises have relatively sufficient funds. They are more competitive in the market, with stronger bargaining power but less difficulty to obtain innovative resources. Thus, they rely on customer relationships less. On the contrary, small-scale enterprises, non-state-owned enterprises (NSOE), and young enterprises find it more difficult to obtain innovative resources and are more likely to face financing constraints of the credit market. Thus, they have more innovation incentives and so these companies may have a stronger demand for stable customers. Low-capital-intensive companies rely more on labor and other factors and less on high-tech innovation. However, highly capital-intensive enterprises rely on large amounts of capital investment, their innovation activities are more active, and the enterprises have a higher demand for innovation. Therefore, stable customer relationships may have a greater impact on innovation. This article examines whether heterogeneous corporate characteristics affect the degree of the influence of corporate technological innovation on stable customer relationships.
Compared with the existing literature, the possible innovations of this paper are as follows:
First of all, there is little literature that has studied the impact of stable customer relationships on innovation. This paper finds that a stable customer relationship significantly promotes the technological innovation of enterprises. This enriches the literature in the field of the technological innovation of enterprises and the literature on supply chain value and expands the research on the impact of customer relationships on technological innovation.
Secondly, the competitive advantage of an enterprise is embedded in the cause-and-effect link between customer relationships and enterprises’ technological innovation. This paper introduces corporate competitive advantage as an intermediary variable, and the study finds that stable customer relationships effectively promote corporate technological innovation by enhancing corporate competitive advantages.
Thirdly, this study conducted a multi-dimensional test according to the scale of an enterprise, property rights, the maturity of the enterprise and the degree of capital intensity. We investigate the heterogeneity of the effect of stabilizing customer relationships in the Chinese context and explore possible causes. This shows that different types of enterprises can make strategic layouts for stable customer relationships and provide references for their innovative strategic decisions.

2. Literature Review

2.1. Relevant Literature on the Technological Innovation of Enterprises

An enterprise’s technological innovation plays an important role in its development [30,31,32], and there is much work that has attempted to find out the factors that boost the technological innovation of enterprises. A theoretical paper by Manso [33] shows that the best way to motivate managers to innovate is to provide a tolerable short-term failure—a long-term incentive for successful management contracts.
Part of the literature has studied the micro characteristics of enterprises. Aghion et al. [2] found that higher institutional ownership ensures a safe job for the CEO, thereby helping to overcome the CEO’s myopia and improve innovation productivity. Lu and Dang [3] examined the relationship between corporate governance and innovation in different kinds of industry, and their results showed that ownership, funding, and executives have a positive impact on R&D investment; in capital and technology-intensive industries, the salary incentive for executives is beneficial for R&D investment. An et al. [4] showed that firms with diverse boards engage in more exploratory innovations and develop new technology in unfamiliar areas. Yu and Fang [5] stated that the “National Team” shareholdings significantly increased corporate innovation. Dai et al. [6] examined the effect of media coverage on firm innovation using a comprehensive sample of corporate news coverage and patenting over the period from 2000 to 2012 and found a negative relation between media coverage and firm innovation. He and Tian [7] showed that firms covered by a larger number of analysts generated fewer patents and patents with lower impact. Guo et al. [8] found that an increase in financial analysts led firms to cut research and development expenses, acquire more innovative firms and invest in corporate venture capital. Chang et al. provided empirical evidence on the positive effect of non-executive employee stock options on corporate innovation [9].
Part of the literature has involved work addressing this from a macro perspective. Mukherjee et al. [15] exploited staggered changes in state-level corporate tax rates to show that an increase in taxes reduces future innovation. Chemmanur et al. [16] stated that antitakeover provisions help nurture innovation by insulating managers from short-term pressures arising from equity markets. Gao et al. [17] showed that smoke-free laws affect innovation by improving inventor health and productivity and by attracting more productive inventors. Hsu et al. [18] showed that industries that are more dependent on external finance and that are more high-tech-intensive exhibit a disproportionally higher innovation level in countries with better-developed equity markets. Cornaggia et al. [19] found that banking competition reduces state-level innovation by public corporations headquartered within deregulating states. Acharya et al. [20] found that stringent labor laws and wrongful discharge laws that do not punish employees for short-term failures foster innovations. According to the literature above, the factors affecting corporate innovation are diverse; however, there is little literature that focuses on stable customer relationships as one of the factors.

2.2. Relevant Literature on Competitive Advantages of Enterprises

We also add to the literature studying the competitive advantages of enterprises. The term competitive advantage refers to the ability gained through attributes and resources to perform at a higher level than others in the same industry or market [34]. The study of this advantage has attracted profound research interest due to contemporary issues regarding the superior performance levels of firms in today’s competitive market [35]. Regarding the dimension of competitive advantage, Porter used his competitive strategy and divided the dimension of competitive advantage into cost advantage and differentiation advantage, especially emphasizing the importance of technology. Schulte [36] divided competitive advantage into three dimensions: efficiency, function, and sustainability.
There is also some work in the literature studying the factors affecting the competitive advantage of enterprises. Sol and Kogan [37], using the case of Chilean foreign direct investment, found that the knowledge of business strategy during the period of economic liberalization enhanced a company’s competitive advantage and that human capital can be a source of sustained competitive advantage [38,39,40]. Ofek and Sarvary [41] stated that growth, globalization, and recent advances in information technology have led many firms to introduce sophisticated knowledge management systems in order to create sustainable competitive advantage. Tallman et al. [42] integrated concepts from economic geography with those of strategic management to develop a model for the stocks and flows of knowledge as critical sources of competitive advantage for clusters and the firms within them. Berger and Roman [43] used a difference-in-difference approach to investigate the relation between the Troubled Assets Relief Program (TARP) and recipients’ competitive advantages; they found that TARP recipients received competitive advantages and increased both their market shares and market power.
It can be seen that the competitive advantages of enterprises include macro and micro levels. This paper mainly studies the stability of customer relationships, so it mainly explores the competitive advantages of enterprises from the perspective of enterprise operation. The sales performance, development potential and management performance are important embodiments of the internal operation advantages of the enterprise [44]. The resources available within the enterprise are particularly important for innovation [45]. Therefore, this paper examines the impact of the supplier–customer relationship on the competitive advantages of internal resources supply capacity and then examines how this competitive advantage affects enterprise innovation.

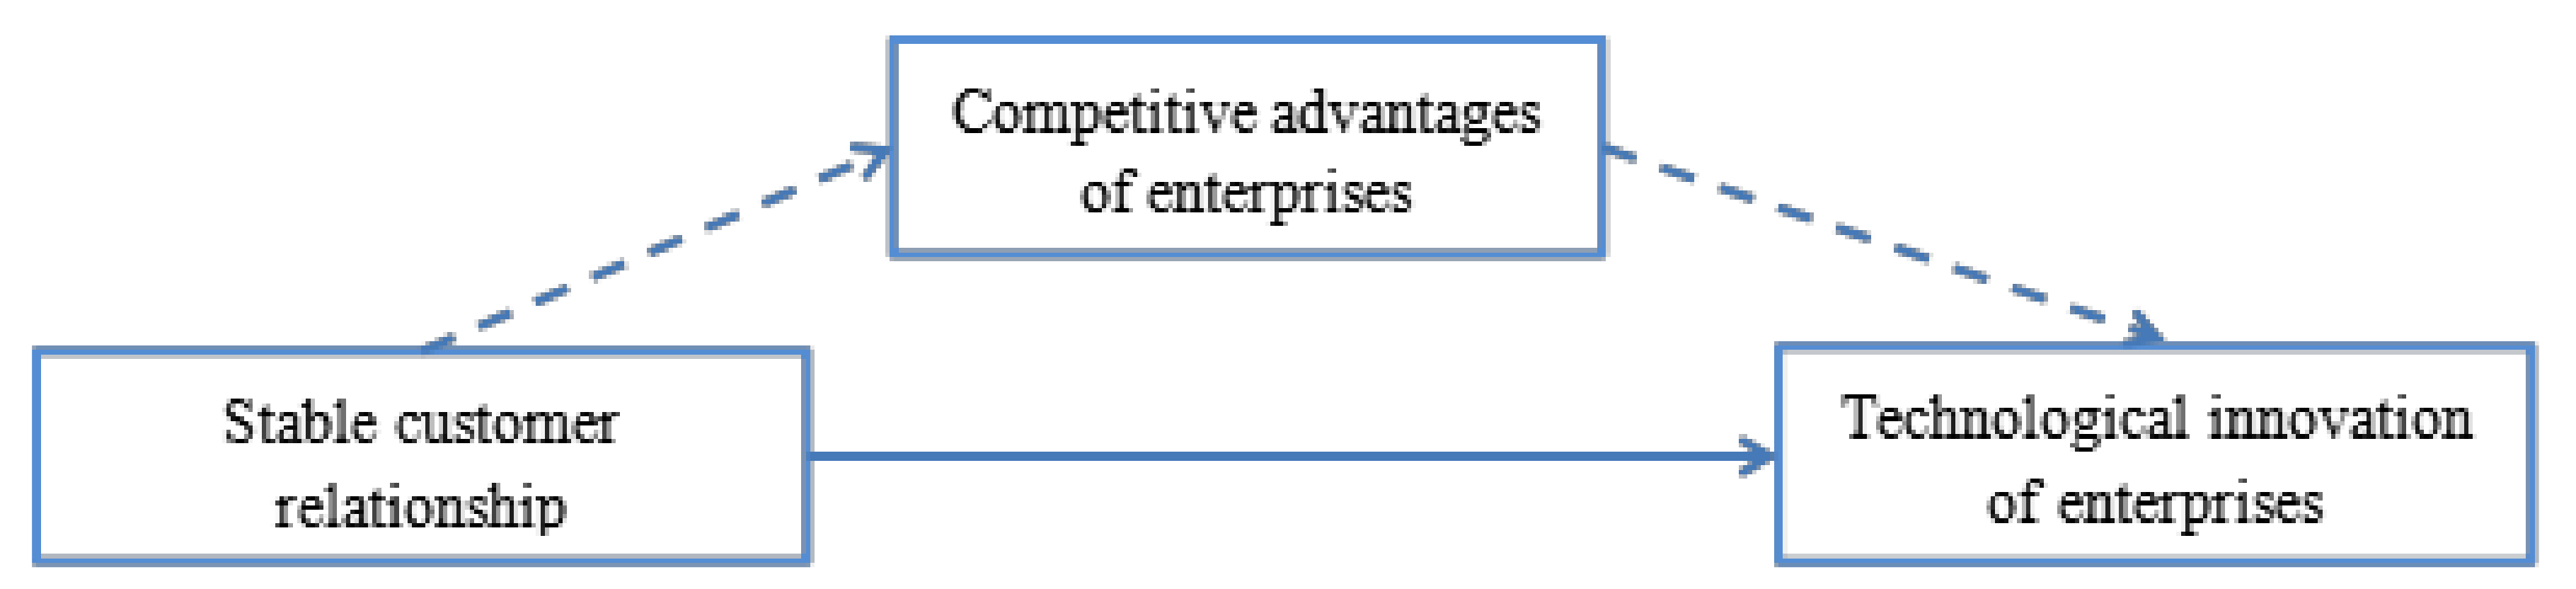
3. Theoretical Analysis and Development of Hypotheses

3.1. Theoretical Analysis

The relational contract theory, which was first proposed by Macneil [46], views contracts as relations rather than as discrete transactions. Thus, even a simple transaction can properly be understood as involving a wide web of social and economic relations. Frydlinger et al. [47] mentioned that a relational contract could avoid and mitigate risks through the alignment of interests. Partners lay the foundation for continuously aligned interests and agree upon a shared vision and strategic objectives for the partnership, specifying what joint success and value looks like. Brahm and Tarzijan [48] stated that relational contracts are key to supply chain collaboration. Prior business with current suppliers creates trust for future cooperation. Therefore, a stable customer relationship is based on trust and benefit sharing. At the same time, trust increases the ability of partners to accept risks and has a positive impact on the quality of their relationships.
Resource-based theory (RBT) is based on the assumption that strategic resources are heterogeneously distributed across firms and that these differences are stable over time. Value, rareness, imitability, and substitutability are four empirical indicators of the potential of firm resources to generate a sustained competitive advantage [49]. The RBT suggests that organizations must develop unique, firm-specific core competencies that allow them to outperform competitors by doing things differently [50]. The stable relationship between an enterprise and its customers is heterogeneous. This valuable, rare, imperfectly imitable, and not substitutable relationship enriches the initial endowment of the enterprise and brings the enterprise a competitive advantage, which is beneficial for the enterprise’s technological innovation.
Resource dependence theory (RDT) attempts to describe the impact of the external resources on the behavior of the organization. Pfeffer and Salancik contend that “it is the fact of the organization’s dependence on the environment that makes the external constraint and control of organizational behavior both possible and almost inevitable” [51]. Organizations can try to change their external resources by forming inter-organizational relationships to control or absorb uncertainty. In fact, the innovation activities of an enterprise are the process of absorbing environmental and technological resources and integrating internal and external knowledge resources led by the enterprise itself. Good customer relationships improve the supply capacity of innovative resources and strengthen the competitive advantage of enterprises in the process of innovation. Therefore, a stable supplier customer relationship is an important driving force for enterprises’ technological innovation.

3.2. Development of Hypotheses

Sun et al. [52] proposed that innovation activities, which are long term and high risk, rely on the continuous investment of enterprise resources. By establishing long-term and stable cooperative relations with customers, companies can internalize technology spillovers and achieve technological complementarities and synergy. A stable customer relationship can be considered as one of the external resources of innovation. Reinhilde [53] found that when spillovers exceed some critical level, cooperation in R&D is beneficial to technical progress and leads to higher profits for the partners. Cooperative R&D members learn from each other and avoid repeated research, which can reduce the risk of the independent R&D of enterprises, share R&D expenses, and realize the scale economy of the R&D of enterprises.
At the same time, RDT indicates that the innovation activity of an enterprise is a process in which the enterprise absorbs external technical resources and integrates internal and external knowledge. McMillan and Woodruff [54] stated that the more stable the relationship between enterprises and customers, the easier it is for both parties to form a corresponding communication mechanism. Moreover, the higher the degree of trust in each other, the better the knowledge transfer, resource acquisition and information sharing between them. Battigalli et al. [55] and Patatoukas [22] show that, in addition to obtaining valuable information from stable major customers to promote joint investment with customers, enterprises can also forecast the demand for products required by customers more accurately to adjust the direction of research and development and make innovation activities more in line with market demand in a timely manner, thereby reducing the risk of technological innovation and further promoting enterprises’ technological innovation.
Based on the analysis above, the more stable the relationship between an enterprise and its customers, the more it can encourage customers to actively participate or cooperate in an enterprise’s innovation and strengthen knowledge transfer, resource acquisition and information sharing in the supply chain. Ultimately, this effectively promotes the innovation of enterprises and enhances the value of the supply chain. Therefore, we put forward the first hypothesis:
Hypotheses 1 (H1).
Ceteris paribus, the more stable the relationship between enterprises and customers, the more effective the promotion of technological innovation.
First of all, the relational contract theory believes that a stable relationship based on trust and mutually beneficial cooperation reduces the uncertainty of transactions through more information sharing and communication. Dyer and Singh [56] stated that companies intend to invest more assets specifically in order to maintain stable cooperative relationships with major customers. These resources are embedded in the transactions and practices of both parties in a unique way, which further reduces the common transaction costs, increases the overall benefits of the supply chain, and enhances the competitive advantage of the enterprise. Patatoukas [22] found that a stable customer relationship on the basis of frequent trade not only reduces the transaction costs of both sides but also helps enterprises to improve the efficiency of inventory management and accounts’ receivable recovery, reduce sales costs, administrative expenses, and advertising expenditures, etc., and increase corporate performance. Therefore, it enhances corporate competitive advantages.
Secondly, the resource-based view contends that a corporate competitive advantage comes from the possession of valuable and scarce resources. When corporate resources are difficult to imitate and replace, a valuable, scarce, and continuous competitive advantage is formed [28]. Payne and Frow [57] show that the long-term relationship formed between enterprises and customers is heterogeneous, valuable, scarce, and difficult to imitate. This not only helps companies maintain their business with existing customers but also to meet customer needs better, and this helps broaden sales channels. By using and integrating such heterogeneous relationship resources, the initial resource endowment of an enterprise can be enriched, and this can bring the enterprise a competitive advantage.
Finally, stable customers are conducive to the stability of the supply chain in which the company is located and lead to the formation of a strong and effective supply chain alliance. Gosman et al. [58] and Wang and Peng [28] demonstrate that the cooperation between alliance companies is a win–win situation that not only improves the supply chain’s overall benefits but also enables companies to have higher revenue and revenue stability. This further enhances the company’s competitive advantage in the product market.
Based on the above analysis, this article proposes a second hypothesis:
Hypothesis 2 (H2).
Ceteris paribus, the more stable the relationship between the enterprise and its customers, the more competitive advantage the enterprise will have.
Weerawardena [59] stated that companies with competitive advantages will enhance their marketing capabilities and brand creation capabilities, increase customer loyalty, expand product sales, further increase corporate profits, and achieve excess profit accumulation. Kou and Gao [60] show that the accumulation of profits allows companies to have more sufficient funds, meaning that they are able to make more innovation inputs through endogenous financing. In addition, enterprises with competitive advantages can attract better human resources and external investment to share innovation risks. This improves the enterprise’s risk tolerance and the willingness to innovate, thereby promoting innovation. Moreover, the improvement of the market competitive advantage of a company’s products does not necessarily mean a decrease in the degree of industry competition [29]. On the contrary, it is precisely because of the existence of competition that enterprises in the market have an inherent motivation to innovate and are committed to enhancing their competitive advantages in the product market.
According to the analysis above, on the one hand, a stable customer relationship can enhance the competitive advantage of the enterprise by reducing transaction costs, enriching the initial resource endowment of an enterprise, leading to the formation of a strong and effective supply chain alliance. On the other hand, enterprises with competitive advantages can promote technological innovation by accumulating profit, improving their risk-bearing capacity and their own competitive incentive path. Therefore, this paper can further infer that the more stable the relationship between enterprises and customers, the more the competitive advantage of enterprises can be enhanced, promoting the technological innovation of enterprises. The influence relationship is shown in Figure 1.
Therefore, based on the above discussions, Hypothesis 3 is proposed.
Hypothesis 3 (H3).
Ceteris paribus, a stable customer relationship will significantly promote the technological innovation of an enterprise by enhancing the competitive advantage of the enterprise. That is, the competitive advantage of the enterprise plays an intermediary role in the stable customer relationship and the technological innovation of the enterprise.

4. Research Design

4.1. Sample Selection and Data Source

The manufacturing industry is a very important source of competitive advantage; it can reflect the productivity level of a country. This article takes the A-share manufacturing listed companies from 2009 to 2016 as a sample. The data regarding customer relationships and innovation input in this paper were collected from the annual financial report of each listed company. Other data were obtained from the CSMAR Database, WIND Database, and CHOICE Database.
The data were processed as follows according to the needs of the research: (1) samples marked ST and ST*, delisted enterprises and the enterprises with non-standard unqualified opinions issued by certified public accountants in the research year were eliminated; (2) samples that had not disclosed detailed information of customers for 2 consecutive years were eliminated; (3) samples with industry changes during the selected period were eliminated; (4) samples that lacked R&D data according to the principles of this article were eliminated; and (5) samples with major financial data missing were eliminated. In addition, we also performed Winsorize treatment on all continuous variables in the model by 1% and used the company level cluster robust standard error for all the regression coefficient standard errors of the models established in this paper to control the variance and auto correlation problems.

4.2. Variables

Enterprise innovation (R&D): Based on the work of Titman [61], Balkin [62], Pan et al. [14], and Zhang et al. [63], this paper measured the technological innovation of enterprises from the perspective of innovation investment. The R&D operating income ratio (RD_S) was calculated as the proportion of R&D expenditure to the total operating income of the year. The proportion of R&D expenditure in total assets of the year (RD_A) was applied in the robust section. Since many enterprises do not directly disclose R&D investment data, this paper used the following principles to collect and sort the relevant R&D data disclosed by the enterprises: (1) If the enterprises disclosed R&D expenditure in the report of the board of directors, the amount disclosed was taken as the innovation investment of the enterprises. (2) If the report of the board of directors was not disclosed, the “development expenditure” was selected. The current increase in the expenditure for the development phase of the project, together with the current increase in the expenditure for the research phase, was used as the data for the current research and development investment. (3) If neither of the above were disclosed, the amount of the relevant research and development expenses, research and development expenses and technology development expenses under the item of “management expenses” or the item of “payment of other cash flows related to operating activities” was selected as the R&D expenses data. If the data of R&D investment was still missing, the sample was removed.
Stable customer relationship (Stable): Based on the studies of Li and Yang [27], Wang and Peng [28], “the number of the top five customers in two consecutive years divided by 5” was applied as the customer stability (Stable1), and “the sales of stable customer divided by the sales of top five customers” was applied as an alternative variable of customer stability (Stable2). At the same time, we applied “whether the stability is greater than the annual industry median to set the dummy variable” (Sta1dum and Sta2dum) as an alternative variable for the robust test.

4.3. Methodological Remarks

Since the data in this paper are short panel data with a large n and small T, the established model forms were selected from mixed regression, fixed effect model and random effect model. All the models in this paper were established by the Least Square Dummy Variable Model and Hausman test, the fixed effect model was established, and the time fixed effect was controlled at the same time. Therefore, the models finally established in this paper were two-way fixed effect models. The specific model construction is shown below.
Based on the theoretical analysis, to investigate the impact of customer stability on enterprise technological innovation, we constructed Model (1) with reference to the methods of Zheng and Zhang [64] and Wang and Peng [28]:
Innovation = α0 + α1 Stable + φZ + ∑Year + ε
where the explained variable Innovation is measured by the ratio of R&D revenue to revenue (RD_S) and the explanatory variable Stable is measured by the count method (Stable1) and the ratio method (Stable2). The larger the two indicators, the more stable the customer relationship. In model (1), it is expected that α1 is positive, indicating that the more stable the relationship between enterprises and customers, the more effective the promotion of technological innovation.
The main control variable of customer concentration (CC) was measured by “the proportion of the total sales amount of the top five customers to the total sales amount of the year” disclosed in the annual report of listed companies. The control variable (Z) in this model included the enterprise characteristic variables of Lnsize, age, return on assests (ROA), Lev, TobinQ, cash flow (CF) and capital expenditure (PPE), while corporate governance variables were Esh, Bsize and Dual. In addition, we also controlled for the year.
In order to test hypotheses 2 and 3, this paper constructed a model by referring to the intermediary effect test procedures proposed by Baron and Kenny [65] and Li et al. [66]:
Innovation = α0 + α1 Stable + φZ + ∑Year + ε
Strength = β0 + β1 Stable + φZ + ∑Year + ε
Innovation = γ0 + γ1 Stable + γ2 Strength + φZ + ∑Year + ε
The competitive advantage of the intermediary variable enterprise (Strength) was measured by the profit margin of the main business of the enterprise. The higher the profit margin of the main business, the stronger the bargaining power an enterprise was said to have. Other variables were defined as described above. The detailed variable definitions in this article are shown in Table 1.

5. Empirical Results

5.1. Descriptive Statistics

Table 2 lists the statistical information of the main variables. We found that the average value of RD_S was only 0.0290, the maximum value was 0.1510, and the minimum value was 0, indicating that the sample enterprises generally had low R&D investment and there were large differences among different enterprises. The mean values of the explanatory variables Stable1 and Stable2 were 0.5270 and 0.6110, respectively. The maximum value was one and the minimum value was zero, indicating that some of the enterprises in the sample had the same top five customers for two consecutive years. Some enterprises were completely different, and the customer stability of different enterprises was quite different. The mean value of the intermediary variable Strength was 0.1950, and the maximum value and the minimum value were 0.9230 and −44.03, respectively, and the standard deviation was 1.33, which indicated that there were obvious differences in the competitive advantages of different enterprises in the product market. The average value of the main control variable CC was 0.2680, the maximum value was 0.9740, and the minimum value was 0.0128, which indicated that the average sales proportion of the top five customers was 26.8% and the maximum sales proportion was 97.4%. From the description of other control variables, there were certain differences among companies.

5.2. Regression Result Analysis

5.2.1. Customer Stability and Technological Innovation

Table 3 reports the impact of stable customer relationships on technological innovation. In Columns (1) and (2), we controlled the annual fixed effect and enterprise fixed effect but did not add other control variables. It can be seen that the regression coefficient of Stable was significantly positive at the level of 1%, which indicated that a stable customer relationship significantly promoted the technological innovation of enterprises. Considering the omission of variables, other variables that may affect enterprise innovation were added in Columns (3) and (4). The regression results show that the regression coefficients of Stable were also significantly positive at the level of 1%, which supports Hypothesis 1. From the perspective of control variables, the investment in innovation of small-scale enterprises was higher, which indicates that small-scale enterprises may have more innovation awareness due to competitive pressure. The higher the proportion of senior management shares, the lower the investment in innovation of enterprises, which may be due to the management defense effect of senior management shares. With the increase in the proportion of senior management shares, the supervisory role of shareholders regarding managers is weakened. The larger the size of the board of directors, the better the corporate governance and the more efficiently the enterprise operates, which is conducive to enterprise innovation.

5.2.2. Analysis of the Intermediary Effect: Enterprise Competitive Advantage

Table 4 shows the results of models (2)–(4), showing the test results of (1) the impact of stable customer relationships on corporate competitive advantages; (2) the impact of corporate competitive advantages on corporate technological innovation; (3) the results of the intermediary mechanism of stabilizing customer relationships on the promotion of corporate technological innovation by enhancing corporate competitive advantages.
Columns (1)–(3) of Table 4 show the test results with Stable1 as the explanatory variable, and Columns (4)–(6) are the test results with Stable2 as the explanatory variable. The results of Columns (1) and (2) show that the regression coefficients of customer stability are significantly positive at the level of 1%. Column (1) is exactly the same as that of benchmark regression, which supports Hypothesis 1. This is the first step of the intermediary test. Column (2) shows that the more stable the customer relationship, the more competitive advantage the enterprise can achieve. This is the second step of the intermediary test. The estimation results in Column (3) show that the regression coefficient of the intermediary variable Strength is significantly positive at the level of 5%. The coefficient of the customer stability is significantly positive at the level of 1%, which is smaller than the coefficient of the customer stability in Column (1). This indicates that the competitive advantage of the enterprise plays a part in the intermediary effect, which supports Hypothesis 3. This is the third step of the intermediary test, which determines that the intermediary effect of enterprise competitive advantage is significant and is part of the intermediary effect. Columns (4)–(6) of Table 4 show the above results.

5.3. Further Analyses

According to the analysis above, stable customer relationships bring higher earnings and increased earnings stability to an enterprise, which can ease the financing constraints of the enterprise, weaken, or share the risks faced and enable the enterprise to obtain more valuable resources for innovation. It can be expected that when the innovation demand of the enterprise is higher, or when greater innovation difficulties and pressure are faced, the enterprise will rely more on good customer relationships; that is, stable customers should be able to play a greater role and have a more significant positive impact on the technological innovation of enterprises. Therefore, we consider the impact of stable customer relationships, which is related to the heterogeneity of enterprises, on the technological innovation of enterprises of different sizes, ages, property rights, and capital intensities.

5.3.1. Firm size

The technological innovation of firms has the characteristics of heavy investment and high risk. Large-scale enterprises have more resource endowments and can meet the requirements of heavy investment in innovation. Moreover, large-scale enterprises have diversified R&D investment and can disperse their R&D risks. Dodgson [67] stated that the larger a firm’s size, the greater the investment in technological innovation. Therefore, the technological innovation of large-scale enterprises may be less dependent on the stability of customer relationships. On the contrary, small-scale enterprises may have difficulties in obtaining innovative resources due to financial constraints and face higher innovation risks. The positive impact of stable customers on their technological innovation may be relatively significant. The natural logarithm of the total assets of samples that are not less than the median of the industry of the year are classified as large-scale firm groups; others are classified as small-scale enterprise groups. The regression results are shown in Columns (1)–(4) in Table 5.
Columns (1)–(4) in Table 5 show the impact of stable customer relationships on the technological innovation of firms of different sizes. The regression coefficient of the customer stability of small-scale enterprises is significantly positive at the level of 1%. The regression coefficient of the customer stability of large-scale enterprises is significantly positive at the level of 10%. The coefficient value of small-scale enterprises is significantly higher than that of large-scale enterprises (0.0100 > 0.0038; 0.0109 > 0.0037), with both Stable1 and Stable2 applied. This shows that, compared with large-scale enterprises, the promotion effect of stable customer relationships on the technological innovation of enterprises is more significant in small-scale enterprises.

5.3.2. Property Rights

SOEs have sufficient capital and can obtain financial support from the government. Therefore, SOEs have strong market competitiveness, which weakens their dependence on customer relationships. On the contrary, as NSOEs face more constraints in the capital market, it is more difficult to raise funds from outside sources. Therefore, compared with SOEs, NSOEs may rely more on the stable customer relationship to fund innovation and share the innovation risk. That is, a stable customer relationship will have a more significant impact on NSOEs. In this paper, SOEs were classified as the SOE group and the rest were classified as the NSOE group. The regression results are shown in Columns (5)–(8) of Table 5.
Columns (5)–(8) in Table 5 show the estimated results for stable customer relationships regarding enterprise technology innovation when property rights are different. When Stable1 is applied, the coefficient of the customer stability of NSOE is 0.0075, which is significantly positive at the level of 1%, while the coefficient of the customer stability of SOE is 0.0046, which is significantly positive at the level of 5%. Both the coefficient and the significance of the customer stability of NSOE are higher than those of SOE. When Stable2 is used as the explanatory variable, the difference is more significant. This shows that, compared to SOE, stable customer relationships have a more significant promotion effect on NSOE’s technological innovation.

5.3.3. Enterprise Age

Companies of different ages face different difficulties in terms of innovation. Mature companies have relatively sufficient funds and rich innovation experience. On the contrary, it is more difficult for young companies to obtain innovative resources, and these companies may rely more on stable customer relationships to support innovation activities. The lifetime of the enterprise since its establishment was applied to measure the enterprise’s age. The samples with an age greater than or equal to the industry median were grouped as mature enterprises, and others were grouped as young enterprises. The regression results are shown in Columns (1)–(4) of Table 6.
Columns (1)–(4) in Table 6 report the estimated results of the impact of stable customer relationships on technological innovation in different age groups. When Stable1 is applied, both groups have positive significant coefficients at the level of 10%. This means that, in both groups, stable customer relationships significantly promote technical innovation. However, in the group of young enterprises, the effect is more pronounced, as its coefficient of 0.0059 is greater than that of the mature group. When Stable2 is applied, the coefficient of customer stability in the young group is 0.0095, which is significantly positive at the level of 1%, while the coefficient of customer stability in the mature group is positive but not significant. Both the coefficient of customer stability and the significance of young enterprises are significantly higher than those of mature enterprises. It can be speculated that a stable customer relationship has no effect on technical innovation in mature enterprises but has a significant positive influence in the young enterprises.

5.3.4. Capital Intensity

Enterprises with different capital intensities are faced with different innovation needs, so the impact of customer relationship stability on technological innovation is different.
Low-capital-intensive enterprises rely more on the input of labor and other factors and less on innovation investment at a high-tech level. However, highly capital-intensive enterprises rely on a large amount of capital investment. Their innovation activities are more active, and their innovation demand is higher. However, they face a capital shortage for innovation input. Thus, a stable relationship between enterprises and customers may have a greater impact on their technological innovation. The logarithm of the ratio of fixed assets to the number of employees is applied to measure capital. The samples whose capital intensity was not less than the annual industry median were grouped as highly capital-intensive enterprises, and others were grouped as low-capital-intensive enterprises. The regression results are shown in Columns (5)–(8) of Table 6.
The coefficient of customer stability of highly capital-intensive enterprises is significantly positive at the level of 1%, while the coefficient of customer stability of low-capital-intensive enterprises is positive, but not significant. The coefficients of highly capital-intensive enterprises are significantly higher than those of low-capital-intensive enterprises (0.0073 > 0.0037; 0.0076 > 0036), which shows that a stable customer relationship plays a more significant role in promoting technological innovation in high-capital-intensive enterprises.

6. Robustness Test

Although this paper sets two different measurement indicators for explanatory variables to test robustness and partially solves the problem of missing variables through the fixed effect model, there are still other possible problems that affect the robustness of the estimation results. In order to further improve the robustness of the estimation, this paper makes a more detailed robustness test through the following series of methods.

6.1. Variable Index Replacement

In order to further ensure the robustness of the results, the endogenous problem of measurement errors was excluded. Firstly, for the explanatory variables, the dummy variable of Sta1dum was set based on the determination of whether Stable1 was not less than the annual industry median, and the dummy variable Sta2dum was set based on whether Stable2 was not less than the annual industry median. Secondly, for the explained variable, the proportion of R&D expenditure in the total assets of the year RD_A was applied to measure the technological innovation. Finally, by changing the explained variable and changing both the explained variable and the explained variable at the same time, the regression was carried out again. The regression results are shown in Table 7. No matter how the measurement method of explanatory variables and explained variables was changed, the coefficient of customer stability was significantly positive at the level of 1% or 5%, ensuring the reliability of the main assumptions in this paper.

6.2. Exclusion of Alternative Hypothesis

There may also be an alternative hypothesis regarding the impact of stable customer relationships on enterprise innovation; that is, when the customer stability is too high, the enterprise may become inflexible and large stable customers will thus infringe on the interests of the enterprise and have an adverse impact on enterprise innovation. Therefore, a stable customer relationship may have a positive effect on enterprise innovation to a certain extent, but if it exceeds a certain critical value, it will hinder enterprise innovation; the two show an inverted U-shaped relationship. According to the above analysis, we added the square term of customer stability into the benchmark regression model (1) to test the robustness of the main hypothesis. If there was an inverted U-shaped relationship between customer stability and enterprise innovation, the square term of stable should be significantly negative. Table 8 reports the test results of the alternative hypothesis. The data show that the regression coefficient of stable2 is not significant, and the regression coefficient of stable is no longer significant, irrespective of whether stable1 or stable2 was used as the explanatory variable. This shows that there is no inverted U-shaped relationship between customer stability and enterprise innovation, and that the research conclusion of this paper is robust.

6.3. Sub-Sample Test

6.3.1. Eliminate the Samples of Enterprises with a Low Proportion of Customer Sales

If the sales proportion of stable customers in the enterprise is too low, this may not have a real impact on the enterprise, which will interfere with this paper’s judgment on the impact of customer stability on an enterprise’s technological innovation. Therefore, we aimed to eliminate stable customer sales (Cus_stable < 5%). The results are listed in Column (1) of Table 9. It was found that stable customer relationship still significantly promoted enterprise innovation at the level of 5%.
When stable2 was applied (stable customer sales proportion/top-five customer sales proportion) to measure customer stability, the customer stability may be very high while the stable customer sales proportion and the top five customer sales proportion are both low. The top five customers, including stable customers, may not have a substantial impact on the enterprise, which also affects the reliability of this conclusion. Therefore, we reexamined the impact of Stable 2 on enterprise technological innovation with the sub-samples obtained after eliminating the samples with the top five customers’ sales accounting for a relatively low proportion of the total (CC < 10%). The results are listed in Column (2) of Table 9. The data show that the estimated coefficient of stable customer stability was still significantly positive at the level of 1%, which ensures the reliability of the main assumptions in this paper.

6.3.2. Eliminating the Samples of Enterprises Whose Main Customers Are Individuals

In this paper, the sample enterprises in the fast-moving consumer goods industry, catering industry and clothing industry may face the situation that the main customers are individuals. Individual customers easily change, and their real impact on an enterprise’s technological innovation may be small. The existence of such enterprises may have caused us to estimate the impact of a stable customer relationship on an enterprise’s technological innovation incorrectly. Therefore, we reexamined the impact of customer stability on enterprise technological innovation with the sub-samples obtained after excluding the enterprise samples of the main customers (the top five customers) including individuals. The test results are listed in Columns (3) and (4) of Table 9. The data show that the regression coefficient of customer stability was still significantly positive at the level of 1% regardless of whether the independent variable was stable1 or stable2, which indicates that the main hypothesis of this paper is reliable and less affected by individual customers.

6.4. The Solution of the Endogenous Problem: Propensity Score Matching (PSM)

It is possible that the characteristics of the innovation and heterogeneity of enterprises attract customers to establish a stable relationship with enterprises, and so the enterprises whose customers choose to establish a stable relationship may be more innovative than other enterprises. This potential reverse causality may lead to the distortion of empirical test results. In order to solve the interference of the endogenous problem, we used PSM to deal with this problem.
First of all, according to whether stable1 is greater than the annual industry median, we set dummy variable D1 as the processing variable and divided the sample into the processing group (high customer stability group) and control group (low customer stability group). Then, the characteristic variables of heterogeneous enterprises were used as matching variables, and the corresponding p-score was calculated by the logit model. Based on the “nearest neighbor matching method” commonly used in PSM, the p-score of the treatment group and control group was matched by “one-to-one matching”. After matching, we recombined the processing group samples and the matched control group samples into the matched samples to re-verify the main hypothesis of this paper. According to the same steps above, we set dummy variable D2 according to whether stable2 was greater than the annual industry median and took this as the processing variable to conduct propensity score matching again; then, we constructed a new matching sample to test the main hypothesis.
The test results are shown in Table 10. The data show that the stable estimation coefficients of the samples in Columns (2) and (4) were significantly positive at the level of 1% and 5%, respectively, and the coefficients were higher than those of the samples before matching (0.0087 > 0.0056; 0.0058 > 0.0054), which not only shows that the main conclusions of this paper are reliable, but also shows that the existence of endogenous problems causes the positive promotion effect of customer relationship stability on enterprise technological innovation to be underestimated.
Table 11 shows the results of the balance test on the matching variables after matching the propensity score with D1 as the processing variable. The data show that the standardized deviations of all the variables after matching were less than 10%. The t-test also showed that there was no systematic difference between the processing group and the control group. Moreover, the likelihood ratio (LR) test showed that it was impossible to distinguish the high stability group and the customer according to the enterprise’s characteristic variables after matching. Therefore, from the overall point of view, the matching results met the balance hypothesis.
Table 12 shows the results of the balance test on the matching variables after propensity score matching with D2 as the processing variable. The data show that the standardized deviations of all variables after the matching were less than 5% except for the standardized deviation of CF. The t test also showed that there was no systematic difference between the processing group and the control group, and LR test showed that the standardized deviation of all variables after the matching was no longer valid. The enterprises’ characteristic variables distinguished the high customer stability group and low customer stability group. Therefore, from the overall point of view, the matching results also met the balance hypothesis.

7. Conclusions

Based on the relational contract theory, resource-based theory, and resource dependence theory, in this paper, we conducted a theoretical analysis and empirical research on the mechanism of stable customer relationships influencing enterprise technological innovation.
This article found that a stable customer relationship significantly promotes the technological innovation of enterprises, and the competitive advantage of enterprises plays an intermediary role. On the one hand, the coefficient of stability is significantly positive related to innovation; that is, the stability of customer relationship has a positive impact on enterprise technological innovation. This supports the idea that a stable customer relationship can encourage customers to actively cooperate with enterprises in R&D [22,55] to improve the success rate of innovation projects and share innovation risks. It can also strengthen the knowledge transfer, resource acquisition and information sharing between enterprises and customers. On the other hand, after the mediator variable distinction test, it can be seen that the competitive advantages of enterprises worked significantly as a mediator between a stable customer relationship and technological innovation. A stable customer relationship can reduce transaction risks, reduce common transaction costs, and form unique heterogeneous resources of enterprises to enhance the competitive advantage of enterprises. Enterprises with competitive advantage can invest in innovation with profit accumulation, benefit from innovation risk sharing by attracting talents and external capital investment and have strong innovation incentives to maintain a competitive advantage to effectively promote enterprise technological innovation.
Under the influence of heterogeneous enterprise characteristics (enterprise scale, property rights, enterprise age and enterprise capital intensity), the level of dependence of technological innovation on the stability of customer relationship is different for each enterprise. Compared with the groups of large-scale enterprises, SOEs, mature enterprises and low-capital-intensive enterprises, the promotion effect of stable customer relationship on technological innovation is more significant in the groups of small-scale enterprises, NSOEs, young enterprises and high-capital-intensive enterprises. Based on RBT, large-scale enterprises, SOEs and more mature enterprises have relatively sufficient funds, stronger competitiveness and negotiation power in the market, less difficulty and pressure in obtaining innovation resources and less dependence on customer relationships. On the contrary, small-scale enterprises, NSOE and young enterprises find it more difficult to obtain innovation resources and are more likely to face the financial constraints of the credit market. At the same time, they are more likely to face stronger innovation demand and incentive. The innovation of these enterprises is more dependent on stabilizing customers. In addition, high-capital-intensive enterprises rely on a large amount of capital investment, their innovation activities are more active, and their innovation demand is higher. Therefore, the stable relationship between enterprises and customers has a greater impact on technological innovation.
The conclusions of this article have enriched the research into the field of customer relations and enterprise technological innovations, deepened the understanding of the economic effects of stabilizing customer relationships and are of practical significance for promoting the development of the supply chain. With the widespread application of the concept of customer relationship management in enterprises, enterprises should pay more attention to the effective use of customer resources to enhance their own innovation capabilities and form supply chain alliances by establishing trust-based and win–win stable partnerships with major customers to obtain investment in innovation resources to enhance their competitive advantage and promote enterprise innovation. In addition, the conclusions of this article also have a guiding role for innovatively weak enterprises such as small-scale enterprises, non-state-owned enterprises, young enterprises, and capital-intensive enterprises. Such enterprises should pay more attention to customer relationship management and maintain stable cooperative relations with customers in order to reduce the business risk of the enterprise, as well as effectively using customer resources for innovation. Furthermore, large-scale enterprises, state-owned enterprises, mature enterprises, and non-capital-intensive enterprises should also improve their governance structures and maintain their customer relationships.

Author Contributions

Conceptualization, Y.C., Y.X., and M.H.; Methodology, Y.C. and M.H.; Data Collection, Y.X. and M.H.; Software, Y.C. and Y.X.; Validation, Z.L.; Formal Analysis, Y.C., Y.X., and M.H.; Investigation, Y.C. and Z.L.; Writing—Original Draft Preparation, Y.X. and M.H.; Writing—Review and Editing, Y.C. and Z.L.; Supervision, Z.L.; Funding Acquisition, Y.X. and Z.L. All authors have read and agreed to the published version of the manuscript.

Funding

This research was partially funded by the Key Project of National Social Science Foundation of China (grant number 20AGL016) and Postgraduate Research and Practice Innovation Program of Jiangsu Province (grant number KYCX20_2686).

Institutional Review Board Statement

Not applicable.

Informed Consent Statement

Not applicable.

Data Availability Statement

Please contact corresponding author.

Conflicts of Interest

The authors declare no conflict of interest.

References

  1. Zhang, J.; Yang, L.X.; Xin, F. Does real estate hinder Chinese innovation? An interpretation based on the loan term structure of the financial system. Manag. World 2016, 6, 64–80. [Google Scholar]
  2. Aghion, P.; Reenen, J.V.; Zingales, L. Innovation and institutional ownership. Am. Econ. Rev. 2013, 103, 277–304. [Google Scholar] [CrossRef] [Green Version]
  3. Lu, T.; Dang, Y. Corporate governance and innovation: Differences among industry categories. Econ. Res. J. 2014, 6, 115–128. [Google Scholar]
  4. An, H.; Chen, C.R.; Wu, Q.; Zhang, T. Corporate innovation: Do diverse boards help? J. Financ. Quant. Anal. 2019, 1–61. [Google Scholar] [CrossRef]
  5. Yu, X.H.; Fang, J.X. “National Team” shareholding and firms’ innovation decisions. Stud. Int. Financ. 2020, 8, 87–96. [Google Scholar]
  6. Dai, L.; Shen, R.; Zhang, B. Does the media spotlight burn or spur innovation? Rev. Acc. Stud. 2020. [Google Scholar] [CrossRef]
  7. He, J.; Tian, X. The dark side of analyst coverage: The case of innovation. J. Financ. Econ. 2013, 109, 856–878. [Google Scholar] [CrossRef]
  8. Guo, B.; David, P.-C.; Anna, T.-S. Firms’ innovation strategy under the shadow of analyst coverage. J. Financ. Econ. 2019, 131, 456–483. [Google Scholar] [CrossRef] [Green Version]
  9. Chang, X.; Fu, K.; Low, A.; Zhang, W. Non-executive employee stock options and corporate innovation. J. Financ. Econ. 2015, 115, 168–188. [Google Scholar] [CrossRef]
  10. Chemmanur, T.J.; Kong, L.; Krishnan, K.; Yu, Q. Top management human capital, inventor mobility, and corporate innovation. J. Financ. Quant. Anal. 2019, 54, 2383–2422. [Google Scholar] [CrossRef] [Green Version]
  11. Mao, C.X.; Weathers, J. Employee treatment and firm innovation. J. Bus. Financ. Account. 2019, 46, 977–1002. [Google Scholar] [CrossRef]
  12. Li, C.T.; Sun, M. Innovation activities in Chinese manufacturing firms: The roles of firm ownership and CEO incentives. Econ. Res. J. 2010, 5, 55–67. [Google Scholar]
  13. Fang, L.H.; Lerner, J.; Wu, C. Intellectual property rights protection, ownership, and innovation: Evidence from China. Rev. Financ. Stud. 2017, 30, 2446–2477. [Google Scholar] [CrossRef] [Green Version]
  14. Pan, Y.; Pan, J.P.; Dai, Y.Y. Litigation risk, judicial local protectionism and innovation. Econ. Res. J. 2015, 3, 131–145. [Google Scholar]
  15. Mukherjee, A.; Singh, M.; Aldokas, A. Do corporate taxes hinder innovation? J. Financ. Econ. 2017, 124, 195–221. [Google Scholar] [CrossRef]
  16. Chemmanur, T.J.; Tian, X. Do anti-takeover provisions spur corporate innovation? A regression discontinuity analysis. J. Financ. Quant. Anal. 2018, 53, 1163–1194. [Google Scholar] [CrossRef]
  17. Gao, H.; Hsu, P.H.; Li, K.; Zhang, J. The real effect of smoking bans: Evidence form corporate innovation. J. Financ. Quant. Anal. 2020, 55, 387–427. [Google Scholar] [CrossRef]
  18. Hsu, P.H.; Tian, X.; Xu, Y. Financial development and innovation: Cross-country evidence. J. Financ. Econ. 2014, 112, 116–135. [Google Scholar] [CrossRef] [Green Version]
  19. Cornaggia, J.; Mao, Y.; Tian, X.; Wolfe, B. Does banking competition affect innovation? J. Financ. Econ. 2015, 115, 189–209. [Google Scholar] [CrossRef] [Green Version]
  20. Acharya, V.; Baghai, R.; Subramanian, K. Wrongful discharge laws and innovation. Rev. Financ. Stud. 2014, 27, 301–346. [Google Scholar] [CrossRef]
  21. Chen, H.; Zhong, T.; Lee, J.Y. Capacity reduction pressure, financing constraints, and enterprise sustainable innovation investment: Evidence from Chinese manufacturing companies. Sustainability 2020, 12, 10472. [Google Scholar] [CrossRef]
  22. Patatoukas, P.N. Customer-base concentration: Implications for firm performance and capital markets. Account. Rev. 2012, 87, 363–392. [Google Scholar] [CrossRef] [Green Version]
  23. Jennifer, I. Customers and cash: How relationships affect suppliers’ cash holdings. J. Corp. Financ. 2013, 19, 159–180. [Google Scholar]
  24. Irvine, P.; Park, S.S.; Yildizhan, C. Customer-Base Concentration, Profitability and Distress Across the Corporate Life Cycle. MPRA Paper. Available online: https://mpra.ub.uni-muenchen.de/53941/ (accessed on 26 February 2014).
  25. Campello, M.; Gao, J. Customer concentration and loan contract terms. J. Financ. Econ. 2016, 3, 1–29. [Google Scholar]
  26. Cohen, D.A.; Li, B. Customer-base concentration, profitability and the information environment: The U.S. government as a major customer. Account. Rev. 2020, 95, 101–131. [Google Scholar] [CrossRef]
  27. Li, N.; Yang, Z.C. Customer relationship and debt contracting. Working Paper. 2011. [Google Scholar] [CrossRef]
  28. Wang, X.; Peng, X. Does stable relationship with customers improve the analyst forecasts about suppliers? J. Financ. Res. 2016, 5, 156–172. [Google Scholar]
  29. Yang, J.; Liu, H.; Nie, J. Research on relationship between market power and independent innovation performance: Take telecommunication industry as an example. Sci. Sci. Manag. Sci. Technol. 2011, 32, 65–72. [Google Scholar]
  30. Sougiannis, T. The accounting based valuation of corporate R&D. Acc. Rev. 1994, 69, 44–68. [Google Scholar]
  31. Hsu, P.H. Technological innovations and aggregate risk premiums. J. Financ. Econ. 2009, 94, 264–279. [Google Scholar] [CrossRef] [Green Version]
  32. Pandit, S.; Wasley, C.E.; Zach, T. The effect of research and development (R&D) inputs and outputs on the relation between the uncertainty of future operating performance and R&D expenditures. J. Account. Audit. Financ. 2011, 26, 121–144. [Google Scholar]
  33. Manso, G. Motivating innovation. J. Financ. 2011, 66, 1823–1860. [Google Scholar] [CrossRef] [Green Version]
  34. Porter, M.E. Competitive Strategy; The Free Press: New York, NY, USA, 1980. [Google Scholar]
  35. Clulow, V.; Gerstman, J.; Barry, C. The resource-based view and sustainable competitive advantage: The case of a financial services firm. J. Eur. Ind. Train. 2003, 27, 220–232. [Google Scholar] [CrossRef]
  36. Schulte, W.D. The Effect of International Corporate Strategies and Information and Communication Technologies on Competitive Advantage and Firm Performance: An Exploratory Study of the International Engineering, Procurement and Construction (IEPC) Industry; The George Washington University: Washington, DC, USA, 1999. [Google Scholar]
  37. Sol, P.D.; Kogan, J. Regional competitive advantage based on pioneering economic reforms: The case of Chilean FDI. J. Int. Bus. Stud. 2007, 38, 901–927. [Google Scholar] [CrossRef]
  38. Coff, R.W. Human assets and management dilemmas: Coping with hazards on the road to resource-based theory. Acad. Manag. Rev. 1997, 22, 374–402. [Google Scholar] [CrossRef]
  39. Hall, R. A framework linking intangible resources and capabilities to sustainable competitive advantage. Strateg. Manag. J. 2010, 14, 607–618. [Google Scholar] [CrossRef]
  40. Campbell, B.A.; Coff, R.; Kryscynski, D. Rethinking sustained competitive advantage from human capital. Acad. Manag. Rev. 2012, 37, 376–395. [Google Scholar] [CrossRef] [Green Version]
  41. Ofek, E.; Sarvary, M. Leveraging the customer base: Creating competitive advantage through knowledge management. Manag. Sci. 2001, 47, 1441–1456. [Google Scholar] [CrossRef] [Green Version]
  42. Tallman, S.; Jenkins, M.; Henry, N.; Pinch, S. Knowledge, clusters, and competitive advantage. Acad. Manag. Rev. 2004, 29, 258–271. [Google Scholar] [CrossRef]
  43. Berger, A.N.; Roman, R.A. Did TARP banks get competitive advantages? J. Financ. Quant. Anal. 2015, 50, 1199–1236. [Google Scholar] [CrossRef]
  44. Xie, F.H.; Bao, G.M. Study on the Relation of the integrity of corporate and the competitive advantage: The empirical investigation of Suzhou 188 corporates in the six areas. Nankai Bus. Rev. 2005, 4, 21–22. [Google Scholar]
  45. Li, S.; Zhai, S.Y.; Gu, P. The non-controlling shareholders’ activism and corporate technological innovation. China Ind. Econ. 2018, 7, 155–173. [Google Scholar]
  46. Macneil, I.R. Contracts: Adjustment of long term economic relations under classical, neoclassical and relational contract law. Northwestern Univ. Law Rev. 1978, 72, 854–902. [Google Scholar]
  47. Frydlinger, D.; Cummins, T.; Vitasek, K.; Bergman, J. Unpacking Relational Contracts: The Practitioner’s Go-To Guide for Understanding Relational Contracts. Available online: http://www.vestedway.com/wp-content/uploads/2016/10/Unpacking-Relational-Contracting_v19 (accessed on 10 February 2019).
  48. Brahm, F.; Tarzijan, J. Relational contracts and collaboration in the supply chain: Impact of expected future business volume on the make-or-buy decision. J. Supply Chain Manag. 2016, 52, 48–67. [Google Scholar] [CrossRef]
  49. Barney, J. Firm resources and sustained competitive advantage. J. Manag. 1991, 17, 99–120. [Google Scholar]
  50. Prahalad, C.K.; Hamel, G. The core competence of the corporation. Harv. Bus. Rev. 2010, 68, 275–292. [Google Scholar]
  51. Pfeffer, J.; Salancik, G.R. The External Control of Organizations: A Resource Dependence Perspective; Harper and Row: New York, NY, USA, 1978. [Google Scholar]
  52. Sun, Y.; Wu, L.; Yin, S. Green innovation risk identification of the manufacturing industry under global value chain based on grounded theory. Sustainability 2020, 12, 10270. [Google Scholar] [CrossRef]
  53. Veugelers, R. Collaboration in R&D: An assessment of theoretical and empirical findings. De Econ. 1998, 3, 419–443. [Google Scholar]
  54. McMillan, J.; Woodruff, C. Interfirm relationships and informal credit in Vietnam. Q. J. Econ. 1999, 114, 1285–1320. [Google Scholar] [CrossRef]
  55. Battigalli, P.; Fumagalli, C.; Polo, M. Buyer power and quality improvements. Res. Econ. 2007, 61, 45–61. [Google Scholar] [CrossRef]
  56. Dyer, J.H.; Singh, H. The relational view: Cooperative strategy and sources of interorganizational competitive advantage. Acad. Manag. Rev. 1998, 23, 660–679. [Google Scholar] [CrossRef] [Green Version]
  57. Payne, A.; Frow, P. A strategic framework for customer relationship management. J. Mark. 2005, 69, 167–176. [Google Scholar] [CrossRef]
  58. Gosman, M.; Kelly, T.; Olsson, P.; Warfield, T. The profitability and pricing of major customers. Rev. Account. Stud. 2004, 9, 117–139. [Google Scholar] [CrossRef]
  59. Weerawardena, J. The role of marketing capability in innovation-based competitive strategy. J. Strateg. Mark. 2003, 11, 15–35. [Google Scholar] [CrossRef]
  60. Kou, Z.L.; Gao, Q. Market structure, market performance and innovation behavior: Based on the panel date of China’s industrial firms. Ind. Econ. Res. 2013, 3, 1–11. [Google Scholar]
  61. Titman, S. The effect of capital structure on a firm’s liquidation decision. J. Financ. Econ. 1984, 13, 137–151. [Google Scholar] [CrossRef]
  62. Balkin, D.B.; Markman, G.; Gomez-Mejia, L.R. Is CEO pay in high-technology firms related to innovation? Acad. Manag. J. 2000, 43, 1118–1129. [Google Scholar]
  63. Zhang, X.; Liu, B.B.; Wang, T.; Li, C.T. Credit rent-seeking, financing constraint and corporate innovation. Econ. Res. J. 2017, 5, 161–174. [Google Scholar]
  64. Zheng, D.P.; Zhang, D. Impact of vertical relationship concentration and manager governance mechanism on technological innovation performance. Sci. Sci. Manag. Sci. Technol. 2016, 37, 85–95. [Google Scholar]
  65. Baron, R.M.; Kenny, D.A. The moderator-mediator variable distinction in social psychological research: Conceptual, strategic, and statistical considerations. J. Personal. Soc. Psychol. 1986, 51, 1173–1182. [Google Scholar] [CrossRef]
  66. Li, R.; Cui, Y.; Zheng, Y. The impact of corporate strategy on enterprise innovation based on the mediating effect of corporate risk-taking. Sustainability 2021, 13, 1023. [Google Scholar] [CrossRef]
  67. Dodgson, M. Organizational learning: A review of some literatures. Organ. Stud. 1993, 14, 375–394. [Google Scholar] [CrossRef]
Figure 1. Intermediary roadmap.
Sustainability 13 03610 g001
Table 1. Variable symbols and definitions.
Symbol Variable Variable Definition
RD_SR&D operating income ratioR&D investment/total operating income
Stable1Customer stability
(count method)
Number of top five customers in two consecutive years/5
Stable2Customer stability
(ratio method)
Total sales of stable customers/total sales of top five customers
StrengthCompetitive advantages of firmProfit from main business/income from main business
CCCustomer concentrationTotal sales amount of the top five customers/total sales amount of the year
LnsizeFirm sizeNatural logarithm of total assets
AgeFirm MaturityDuration of the company since its establishment
ROAReturn on assetsNet profit/total asset
LevLeverageTotal liability/total asset
TobinQFirm growth(price per share * tradable shares + net assets per share * non tradable shares + book value of liabilities)/total assets
CFCash flow levelCorporate free cash flow/total assets
PPECapital expenditureCash paid for the construction of fixed assets, intangible assets and other long-term assets/total assets
EshProportion of shares held by senior managementSenior management’s shares/total share capital
BsizeBoard sizeNatural logarithm of total number of directors
DualDualityThe president and general manager have duality.
If yes, it is 1; otherwise, it is 0
YearYear-fixed effect Year dummies
Table 2. Descriptive statistics.
VariableObsMeanMaxMinSd
RD_S11730.0290 0.1510 0.0000 0.0251
Stable111730.5270 1.0000 0.0000 0.2460
Stable211730.6110 1.0000 0.0000 0.2710
Strength11730.1950 0.9230 −44.0300 1.3300
CC11730.2680 0.9740 0.0128 0.1810
Lnsize117322.0600 26.0200 19.2400 1.1230
Age117315.1900 62.0000 3.0000 4.8360
ROA11730.0434 0.3120 -0.5070 0.0525
Lev11730.4710 0.9670 0.0158 0.1830
PPE11730.0616 0.4740 0.0006 0.0478
CF11730.0033 0.2760 −0.7490 0.1030
TobinQ11732.3530 14.9300 0.6830 1.6200
Esh11730.0311 0.6620 0.0000 0.0932
Bsize11732.1840 2.8900 1.3860 0.2000
Dual11730.7920 1.0000 0.0000 0.4060
Table 3. Customer stability and technological innovation.
Stable1Stable2Stable1Stable2
Column (1)Column (2)Column (3)Column (4)
Stable0.0049 ***0.0047 ***0.0056 ***0.0054 ***
(2.74)(2.73)(3.21)(3.17)
CC −0.0095−0.0104 *
(−1.62)(−1.75)
Lnsize −0.0045 *−0.0046 *
(−1.90)(−1.92)
Age −0.00000.0000
(−0.02)(0.09)
ROA −0.0317 *−0.0305
(−1.65)(−1.59)
Lev −0.0033−0.0035
(−0.40)(−0.43)
PPE 0.0323 **0.0327 **
(2.11)(2.13)
CF 0.00470.0050
(1.12)(1.19)
TobinQ −0.0009−0.0008
(−1.06)(−1.04)
Esh −0.0319 *−0.0311 *
(−1.84)(−1.80)
Bsize 0.0083 **0.0083 **
(2.06)(2.08)
Dual −0.0027−0.0026
(−0.93)(−0.88)
_cons0.0197 ***0.0194 ***0.1099 **0.1099 **
(15.24)(13.79)(2.08)(2.07)
Year FEYESYESYESYES
Firm FEYESYESYESYES
N1173117311731173
Adj-R20.12170.12300.16100.1626
Notes: The t-statistics in parentheses are based on robust standard errors clustered at the firm level. *, **, and *** indicate statistical significance at the 10%, 5%, and 1% levels, respectively.
Table 4. The intermediary effect test of the competitive advantage of enterprises.
Stable = Stable1Stable = Stable2
RD_SStrengthRD_SRD_SStrengthRD_S
Column (1)Column (2)Column (3)Column (4)Column (5)Column (6)
Stable0.0056 ***0.0231 ***0.0049 ***0.0054 ***0.0198 ***0.0049 ***
(3.21)(2.99)(2.89)(3.17)(2.84)(2.86)
Strength 0.0267** 0.0265 **
(2.19) (2.15)
CC−0.0095−0.0278−0.0088−0.0104 *−0.0309−0.0096
(−1.62)(−1.03)(−1.45)(−1.75)(−1.15)(−1.57)
Lnsize−0.0045 *0.0197 *−0.0051 **−0.0046 *0.0194 *−0.0051 **
(−1.90)(1.68)(−2.13)(−1.92)(1.67)(−2.14)
Age−0.0000−0.00170.00000.0000−0.00150.0001
(−0.02)(−0.65)(0.08)(0.09)(−0.59)(0.19)
ROA−0.0317 *0.7117 ***−0.0507 **−0.03050.7167 ***−0.0495 **
(−1.65)(8.29)(−2.22)(−1.59)(8.29)(−2.16)
Lev−0.0033−0.0098−0.0030−0.0035−0.0106−0.0032
(−0.40)(−0.37)(−0.38)(−0.43)(−0.40)(−0.41)
PPE0.0323 **0.1114 *0.0294 *0.0327 **0.1121 *0.0297 *
(2.11)(1.74)(1.94)(2.13)(1.75)(1.95)
CF0.0047−0.01820.00510.0050−0.01690.0054
(1.12)(−1.11)(1.23)(1.19)(−1.03)(1.29)
TobinQ−0.00090.0014−0.0009−0.00080.0015−0.0009
(−1.06)(0.43)(−1.13)(−1.04)(0.44)(−1.11)
Esh−0.0319 *−0.0638−0.0302 *−0.0311 *−0.0588−0.0295 *
(−1.84)(−0.92)(−1.71)(−1.80)(−0.85)(−1.67)
Bsize0.0083 **0.01690.0078 **0.0083 **0.01710.0079 **
(2.06)(1.07)(1.98)(2.08)(1.09)(2.00)
Dual−0.0027−0.0068−0.0026−0.0026−0.0061−0.0024
(−0.93)(−0.70)(−0.87)(−0.88)(−0.63)(−0.83)
_cons0.1099 **−0.23840.1163 **0.1099 **−0.23550.1162 **
(2.08)(−0.93)(2.25)(2.07)(−0.93)(2.23)
Year FEYESYESYESYESYESYES
Firm FEYESYESYESYESYESYES
N117311731173117311731173
Adj-R20.16100.27440.16810.16260.27360.1696
Notes: The t-statistics in parentheses are based on robust standard errors clustered at the firm level. *, **, and *** indicate statistical significance at the 10%, 5%, and 1% levels, respectively.
Table 5. Customer stability and technological innovation (distinguishing firm size and property rights). SOE: state-owned enterprise; NSOE: non-state-owned enterprise.
Stable = Stable1Stable = Stable2Stable = Stable1Stable = Stable2
Large-ScaleSmall-ScaleLarge-ScaleSmall-ScaleSOENSOESOENSOE
Column (1)Column (2)Column (3)Column (4)Column (5)Column (6)Column (7)Column (8)
Stable0.0038 *0.0100 ***0.0037 *0.0109 ***0.0046 **0.0075 ***0.0037 *0.0087 ***
(1.86)(3.16)(1.80)(3.43)(2.24)(2.66)(1.81)(3.12)
CC−0.0070−0.0097−0.0077−0.0104−0.0117−0.0090−0.0126 *−0.0096
(−0.87)(−0.88)(−0.94)(−0.96)(−1.63)(−1.06)(−1.71)(−1.13)
Lnsize0.0013−0.0076 *0.0012−0.0066 *−0.0027−0.0057 *−0.0028−0.0057 *
(0.43)(−1.95)(0.40)(−1.73)(−0.65)(−1.90)(−0.66)(−1.89)
Age0.00050.0175 *0.00050.0164 *0.0009−0.00040.0009−0.0003
(0.77)(1.84)(0.85)(1.84)(1.05)(−0.75)(1.10)(−0.58)
ROA−0.0255−0.0307−0.0246−0.0300−0.0096−0.0486 *−0.0093−0.0450
(−1.01)(−0.95)(−0.98)(−0.94)(−0.42)(−1.71)(−0.41)(−1.58)
Lev−0.0174 *0.0181−0.0177 *0.0182 *−0.01880.0107−0.02000.0122
(−1.68)(1.60)(−1.70)(1.67)(−1.55)(1.02)(−1.63)(1.17)
PPE0.00210.0611 **0.00230.0618 **0.01160.0608 ***0.01190.0616 ***
(0.11)(2.50)(0.12)(2.44)(0.59)(2.64)(0.61)(2.64)
CF0.0069−0.00120.00690.00000.0125 ***−0.00290.0132 ***−0.0037
(1.39)(−0.16)(1.37)(0.00)(2.77)(−0.44)(2.84)(−0.53)
TobinQ0.0011−0.00150.0011−0.0014−0.0004−0.0010−0.0004−0.0009
(1.13)(−1.33)(1.14)(−1.24)(−0.34)(−0.95)(−0.37)(−0.88)
Esh0.0145−0.0330 *0.0170−0.0328 *0.1816−0.0468 **0.1785−0.0468 **
(0.27)(−1.67)(0.31)(−1.70)(0.65)(−2.32)(0.63)(−2.34)
Bsize0.00810.00580.00790.00640.0101 *0.01060.0101 *0.0108
(1.44)(1.15)(1.42)(1.27)(1.91)(1.57)(1.91)(1.59)
Dual−0.0027−0.0002−0.0023−0.00040.0018−0.00590.0019−0.0057
(−0.80)(−0.05)(−0.71)(−0.10)(0.84)(−1.35)(0.88)(−1.31)
_cons−0.0273−0.0460−0.0257−0.05590.05150.1351 **0.05290.1309 **
(−0.41)(−0.32)(−0.38)(−0.41)(0.53)(2.13)(0.54)(2.04)
Year FEYESYESYESYESYESYESYESYES
Firm FEYESYESYESYESYESYESYESYES
N638535638535607566607566
Adj−R20.21190.18460.21270.19640.21730.17460.21570.1834
Notes: The t-statistics in parentheses are based on robust standard errors clustered at the firm level. *, **, and *** indicate statistical significance at the 10%, 5%, and 1% levels, respectively.
Table 6. Customer stability and technological innovation (distinguishing enterprise age and capital (cap.) intensity).
Stable = Stable1Stable = Stable2Stable = Stable1Stable = Stable2
MatureYoungMatureYoungHigh Cap.
Intensity
Low Cap.
Intensity
High Cap.
Intensity
Low Cap.
Intensity
Column (1)Column (2)Column (3)Column (4)Column (5)Column (6)Column (7)Column (8)
Stable0.0043 *0.0059 *0.00140.0095 ***0.0073 ***0.00370.0076 ***0.0036
(1.90)(1.81)(0.69)(3.18)(2.94)(1.24)(3.44)(1.09)
CC−0.0089−0.0078−0.0089−0.0101−0.0088−0.0017−0.0095−0.0023
(−0.99)(−1.03)(−1.01)(−1.36)(−1.33)(−0.20)(−1.44)(−0.28)
Lnsize−0.0044−0.0039−0.0043−0.0038−0.0043−0.0085 *−0.0041−0.0086 *
(−1.40)(−1.02)(−1.39)(−1.01)(−1.04)(−1.87)(−1.01)(−1.87)
Age0.0004−0.00060.00050.00000.0005−0.00010.0007−0.0001
(0.45)(−0.46)(0.52)(0.03)(0.78)(−0.17)(1.05)(−0.18)
ROA−0.0106−0.0986 **−0.0096−0.0974 **−0.0453 *−0.0287−0.0436−0.0277
(−0.48)(−2.55)(−0.44)(−2.53)(−1.66)(−0.99)(−1.63)(−0.95)
Lev0.0038−0.0237 *0.0037−0.0231 *−0.00730.0033−0.00820.0036
(0.38)(−1.88)(0.36)(−1.88)(−0.85)(0.22)(−0.96)(0.24)
PPE0.01050.0513 **0.00990.0535 **0.00500.0699 ***0.00650.0692 ***
(0.59)(2.30)(0.55)(2.43)(0.30)(2.75)(0.39)(2.73)
CF0.00160.0100 *0.00200.0105 *0.0099 *−0.00260.0107 *−0.0026
(0.27)(1.72)(0.34)(1.81)(1.80)(−0.32)(1.89)(−0.32)
TobinQ−0.0022 **0.0010−0.0022 **0.00100.0005−0.00180.0004−0.0018
(−2.40)(0.72)(−2.40)(0.74)(0.40)(−1.43)(0.38)(−1.40)
Esh−0.0675−0.0054−0.0665−0.0071−0.0520 **−0.0628−0.0507 **−0.0632
(−1.36)(−0.31)(−1.35)(−0.43)(−2.43)(−1.49)(−2.41)(−1.49)
Bsize0.0112 **0.00200.0109 **0.00160.00640.00890.00640.0091
(2.08)(0.28)(2.05)(0.23)(1.15)(1.51)(1.18)(1.53)
Dual−0.00680.0016−0.00660.0015−0.0015−0.0006−0.0011−0.0006
(−1.61)(0.47)(−1.60)(0.46)(−0.54)(−0.11)(−0.42)(−0.13)
_cons0.09310.12270.09300.11170.10120.1895 *0.09500.1910 *
(1.29)(1.46)(1.29)(1.36)(1.21)(1.91)(1.15)(1.90)
Year FEYESYESYESYESYESYESYESYES
Firm FEYESYESYESYESYESYESYESYES
N691482691482634539634539
Adj-R20.19670.21890.19170.23820.20850.17140.21520.1719
Notes: The t-statistics in parentheses are based on robust standard errors clustered at the firm level. *, **, and *** indicate statistical significance at the 10%, 5%, and 1% levels, respectively.
Table 7. Customer stability and technological innovation: variable index replacement.
RD_ARD_SRD_A
Stable1Stable2Sta1dumSta2dumSta1dumSta2dum
Column (1)Column (2)Column (3)Column (4)Column (5)Column (6)
Stable0.0038 ***0.0033 **0.0027 ***0.0019 **0.0018 ***0.0012 **
(2.59)(2.50)(3.07)(2.28)(2.80)(2.07)
CC−0.0049−0.0054−0.0098 *−0.0104 *−0.0051−0.0054
(−1.22)(−1.34)(−1.68)(−1.80)(−1.28)(−1.38)
Lnsize−0.0063 ***−0.0063 ***−0.0045 *−0.0046 *−0.0063 ***−0.0063 ***
(−3.47)(−3.52)(−1.93)(−1.92)(−3.50)(−3.54)
Age−0.00000.0000−0.00000.0000−0.00000.0000
(−0.07)(0.04)(−0.10)(0.06)(−0.16)(0.01)
ROA0.0257 *0.0265 *−0.0292−0.02980.0274 *0.0269 *
(1.74)(1.78)(−1.54)(−1.57)(1.86)(1.83)
Lev0.00430.0042−0.0030−0.00360.00450.0041
(0.90)(0.87)(−0.37)(−0.44)(0.94)(0.86)
PPE0.01680.01690.0320 **0.0308 **0.01660.0158
(1.35)(1.36)(2.08)(2.01)(1.34)(1.27)
CF0.00300.00320.00480.00510.00310.0033
(1.00)(1.07)(1.16)(1.23)(1.04)(1.10)
TobinQ0.00010.0002−0.0009−0.00090.00010.0001
(0.28)(0.29)(−1.07)(−1.05)(0.26)(0.27)
Esh−0.0138−0.0130−0.0306 *−0.0296 *−0.0129−0.0121
(−1.37)(−1.30)(−1.77)(−1.71)(−1.30)(−1.20)
Bsize0.0078 ***0.0079 ***0.0081 **0.0084 **0.0077 ***0.0079 ***
(2.93)(2.94)(2.01)(2.06)(2.87)(2.91)
Dual−0.0011−0.0010−0.0028−0.0026−0.0012−0.0010
(−0.63)(−0.56)(−0.96)(−0.89)(−0.66)(−0.58)
_cons0.1309 ***0.1313 ***0.1116 **0.1123 **0.1320 ***0.1327 ***
(3.46)(3.50)(2.14)(2.11)(3.52)(3.55)
Year FEYESYESYESYESYESYES
Firm FEYESYESYESYESYESYES
N117311731173117311731173
Adj-R20.13610.13550.16150.15780.13660.1326
Notes: The t-statistics in parentheses are based on robust standard errors clustered at the firm level. *, **, and *** indicate statistical significance at the 10%, 5%, and 1% levels, respectively.
Table 8. Customer stability and technological innovation with the customer stability square added.
Stable1Stable2
Column (1)Column (2)
Stable0.0055−0.0019
(1.02)(−0.37)
Stable20.00010.0071
(0.02)(1.44)
CC−0.0095−0.0111 *
(−1.62)(−1.87)
Lnsize−0.0045 *−0.0046 *
(−1.89)(−1.88)
Age−0.00000.0000
(−0.02)(0.04)
ROA−0.0317 *−0.0312
(−1.65)(−1.62)
Lev−0.0033−0.0034
(−0.40)(−0.42)
PPE0.0323 **0.0323 **
(2.11)(2.11)
CF0.00470.0050
(1.12)(1.20)
TobinQ−0.0009−0.0008
(−1.06)(−1.03)
Esh−0.0319 *−0.0309 *
(−1.84)(−1.79)
Bsize0.0083 **0.0084 **
(2.06)(2.09)
Dual−0.0027−0.0026
(−0.93)(−0.89)
_cons0.1100 **0.1109 **
(2.08)(2.07)
Year FEYESYES
Firm FEYESYES
N11731173
Adj−R20.16100.1647
Notes: The t-statistics in parentheses are based on robust standard errors clustered at the firm level. *, **, and *** indicate statistical significance at the 10%, 5%, and 1% levels, respectively.
Table 9. Customer stability and technological innovation: sub-sample test.
Stable1Stable2Stable1Stable2
Eliminate
Cus_Stable < 5%
Eliminate
CC < 10%
Eliminate Individual CustomersEliminate Individual Customers
(1)(2)(3)(4)
Stable0.0060 **0.0066 ***0.0057 ***0.0057 ***
(2.55)(3.38)(3.25)(3.26)
CC−0.0092−0.0092−0.0097−0.0106 *
(−1.37)(−1.54)(−1.58)(−1.71)
Lnsize−0.0038−0.0060 **−0.0044 *−0.0045 *
(−1.30)(−2.29)(−1.82)(−1.84)
Age0.00000.0001−0.0001−0.0001
(0.04)(0.18)(−0.26)(−0.18)
ROA−0.0462 *−0.0388 *−0.0350 *−0.0340 *
(−1.93)(−1.81)(−1.78)(−1.73)
Lev−0.0073−0.0012−0.0039−0.0042
(−0.78)(−0.14)(−0.47)(−0.51)
PPE0.0330 *0.0356 **0.0298 *0.0302 *
(1.89)(2.12)(1.92)(1.94)
CF0.00350.00190.00430.0045
(0.73)(0.41)(1.00)(1.05)
TobinQ−0.0003−0.0010−0.0009−0.0009
(−0.32)(−1.10)(−1.06)(−1.04)
Esh−0.0348 *−0.0406 **−0.0315 *−0.0307 *
(−1.70)(−2.12)(−1.82)(−1.78)
Bsize0.0117 **0.0102 **0.0083 **0.0084 **
(2.18)(2.13)(2.05)(2.07)
Dual−0.0009−0.0022−0.0027−0.0025
(−0.29)(−0.68)(−0.91)(−0.86)
_cons0.08630.1357 **0.1103 **0.1101 **
(1.30)(2.31)(2.05)(2.04)
Year FEYESYESYESYES
Firm FEYESYESYESYES
N948101711491149
Adj-R20.16880.17050.16130.1633
Notes: The t-statistics in parentheses are based on robust standard errors clustered at the firm level. *, **, and *** indicate statistical significance at the 10%, 5%, and 1% levels, respectively.
Table 10. Customer stability and technological innovation before and after Propensity Score Matching (PSM) pairing.
Stable = Stable1Stable = Stable2
Before PSMAfter PSMBefore PSMAfter PSM
(1)(2)(3)(4)
Stable0.0056 ***0.0087 ***0.0054 ***0.0058 **
(3.21)(3.11)(3.17)(2.58)
CC−0.0095−0.0007−0.0104 *−0.0087
(−1.62)(−0.08)(−1.75)(−1.21)
Lnsize−0.0045 *−0.0035−0.0046 *−0.0038
(−1.90)(−0.75)(−1.92)(−1.23)
Age−0.0000−0.00010.0000−0.0001
(−0.02)(−0.12)(0.09)(−0.37)
ROA−0.0317 *−0.0173−0.0305−0.0324
(−1.65)(−0.58)(−1.59)(−1.25)
Lev−0.0033−0.0091−0.0035−0.0119
(−0.40)(−0.75)(−0.43)(−1.06)
PPE0.0323 **0.0289 *0.0327 **0.0363 *
(2.11)(1.66)(2.13)(1.94)
CF0.00470.00570.00500.0010
(1.12)(1.12)(1.19)(0.16)
TobinQ−0.0009−0.0005−0.0008−0.0005
(−1.06)(−0.31)(−1.04)(−0.43)
Esh−0.0319 *−0.0155−0.0311 *−0.0065
(−1.84)(−0.70)(−1.80)(−0.32)
Bsize0.0083 **0.0141 ***0.0083 **0.0112 **
(2.06)(2.84)(2.08)(2.00)
Dual−0.00270.0016−0.0026−0.0018
(−0.93)(0.51)(−0.88)(−0.51)
_cons0.1099 **0.06590.1099 **0.0884
(2.08)(0.67)(2.07)(1.31)
Year FEYESYESYESYES
Firm FEYESYESYESYES
N11736281173846
Adj-R20.16100.18020.16260.1648
Notes: The t-statistics in parentheses are based on robust standard errors clustered at the firm level. *,**, and *** indicate statistical significance at the 10%, 5%, and 1% levels, respectively.
Table 11. Balance test of matching variables with D1 as a processing variable.
SampleMeanSD (%)t-Test
TreatmentControlt-Valuep-Value
CCBefore PSM0.298 0.254 24.2 3.88 0.000
After PSM0.298 0.293 2.4 0.32 0.749
LnsizeBefore PSM22.025 22.069 −4.1 −0.64 0.525
After PSM22.025 22.073 −4.5 −0.63 0.531
AgeBefore PSM15.321 15.045 6.1 0.97 0.333
After PSM15.321 15.231 2.0 0.27 0.784
ROABefore PSM0.046 0.043 6.5 1.02 0.307
After PSM0.046 0.045 1.9 0.26 0.793
LevBefore PSM0.470 0.472 −1.0 −0.16 0.877
After PSM0.470 0.469 0.4 0.05 0.958
PPEBefore PSM0.065 0.059 13.7 2.17 0.030
After PSM0.065 0.064 3.1 0.42 0.677
CFBefore PSM0.004 0.004 −0.1 −0.02 0.983
After PSM0.004 0.005 −0.8 −0.11 0.913
TobinQBefore PSM2.259 2.363 −7.1 −1.11 0.267
After PSM2.259 2.118 9.7 1.53 0.127
EshBefore PSM0.031 0.030 1.1 0.17 0.863
After PSM0.031 0.025 6.5 0.93 0.354
BsizeBefore PSM2.182 2.184 −1.1 −0.17 0.863
After PSM2.182 2.184 −1.0 −0.14 0.890
DualBefore PSM0.780 0.798 −4.3 −0.69 0.491
After PSM0.780 0.796 −4.0 −0.54 0.589
SamplePs R2LR chi2p > chi2Mean deviationMedian deviationB
Before PSM0.02130.930.001 6.34.335.4 *
After PSM0.0043.990.970 3.32.414.7
Notes: *, **, and *** indicate statistical significance at the 10%, 5%, and 1% levels, respectively.
Table 12. Balance test of matching variables with D2 as a processing variable.
SampleMeanSD (%)t-Test
TreatmentControlt-Valuep-Value
CCBefore PSM0.309 0.233 43.1 7.44 0.000
After PSM0.309 0.301 4.5 0.69 0.490
LnsizeBefore PSM21.974 22.124 −13.7 −2.33 0.020
After PSM21.974 21.934 3.6 0.64 0.525
AgeBefore PSM15.163 15.104 1.3 0.22 0.824
After PSM15.163 14.972 4.2 0.68 0.499
ROABefore PSM0.046 0.042 7.3 1.24 0.216
After PSM0.046 0.047 −2.0 −0.33 0.745
LevBefore PSM0.463 0.478 −8.3 −1.41 0.158
After PSM0.463 0.462 0.8 0.13 0.895
PPEBefore PSM0.064 0.058 13.5 2.31 0.021
After PSM0.064 0.066 −4.9 −0.77 0.441
CFBefore PSM0.004 0.005 −0.9 −0.15 0.877
After PSM0.004 0.009 −5.6 −0.93 0.352
TobinQBefore PSM2.350 2.314 2.4 0.41 0.682
After PSM2.350 2.345 0.3 0.05 0.958
EshBefore PSM0.032 0.028 5.3 0.91 0.363
After PSM0.032 0.030 2.5 0.40 0.691
BsizeBefore PSM2.187 2.181 3.3 0.56 0.575
After PSM2.187 2.193 −2.8 −0.47 0.635
DualBefore PSM0.766 0.814 −11.7 −2.01 0.045
After PSM0.766 0.764 0.5 0.07 0.943
SamplePs R2LR chi2p > chi2Mean deviationMedian deviationB
before PSM0.04675.030.000 10.17.351.4 *
after PSM0.0033.940.972 2.92.812.1
Notes: *, **, and *** indicate statistical significance at the 10%, 5%, and 1% levels, respectively.
Publisher’s Note: MDPI stays neutral with regard to jurisdictional claims in published maps and institutional affiliations.

