Article

Long-Term Trial of Tillage Systems for Sugarcane: Effect on Topsoil Hydrophysical Attributes

by
Aline Fachin Martíni
1,*,
Gustavo Pereira Valani
1,
Laura Fernanda Simões da Silva
2,
Denizart Bolonhezi
3,*,
Simone Di Prima
4,5 and
Miguel Cooper
1,*
1
Department of Soil Science, “Luiz de Queiroz” College of Agriculture, University of São Paulo, Piracicaba, Sao Paulo 13418-900, Brazil
2
Program in Agroecology and Rural Development (PPGADR), University of São Carlos (UFSCar), Araras, Sao Paulo 13600-970, Brazil
3
Sugarcane Research Center, Agronomic Institute of Campinas (IAC), Ribeirão Preto, Sao Paulo 14001-970, Brazil
4
Department of Agriculture, University of Sassari, Sassari 07100, Italy
5
Univ Lyon, Université Claude Bernard Lyon 1, CNRS, ENTPE, UMR 5023 LEHNA, F-69518 Vaulx-en-Velin, France
*
Authors to whom correspondence should be addressed.
Sustainability 2021, 13(6), 3448; https://doi.org/10.3390/su13063448
Submission received: 18 February 2021 / Revised: 14 March 2021 / Accepted: 18 March 2021 / Published: 20 March 2021

Abstract

:
Seeking to provide essential information about sustainable tillage systems, this work aimed to assess the effects of liming and soil cultivation systems on the soil hydrophysical attributes of a long-term cultivated sugarcane field in the tropical region of southeast Brazil. Infiltration tests and soil sampling down to 0.10 m were performed in order to determine saturated soil hydraulic conductivity, soil bulk density, soil total porosity, macroporosity, microporosity, and soil resistance to penetration. The studied areas include no-tillage (NT) and conventional tillage (CT) systems with 0 (CT0 and NT0) and 4 (CT4 and NT4) Mg ha−1 of lime, and an adjoining area with native forest (NF). The data analysis included an analysis of variance followed by the Tukey test to compare different systems, assessment of the Pearson correlation coefficient between variables, and a principal component analysis of the dataset. The lowest bulk density and highest soil total porosity, macroporosity and saturated hydraulic conductivity were found in the NF. The bulk density in CT4 and NT0 was higher than in other systems, indicating the need for amelioration. NT4 is suggested as the most viable system for conservation agriculture in sugarcane fields, combining the benefits of no-tillage and liming to enhance soil hydrophysical functions.

1. Introduction

Sugarcane (Saccharum officinarum) is an important crop worldwide due to its multiple purposes in both food and fuel industries [1]. As a result of a higher demand for its by-products, sugarcane production has increased in recent years, combined with an expansion in the crop area, the improvement of soil fertility, and the use of agricultural machinery in all its cultivation stages. Although soil use intensification has boosted sugarcane production by means of crop area extension, lime application and mechanized agriculture, it has also led to changes in soil structure, including structural degradation [2,3,4]. Soil structure and its related soil hydrophysical attributes are of primary importance for plant growth and development, as they influence soil aeration, soil water storage, water retention, and drainage [5].
In agricultural fields, soil and crop management is considered one of the main factors controlling soil structure [3], in which the extent of possible changes depends upon the operations performed. As sugarcane is a semi-perennial crop, successive cuts are performed throughout its cultivation, which demands the proper correction of soil fertility, given that the intense exporting of nutrients reduces soil fertility. In this sense, liming is used to correct soil acidity, which neutralizes the toxic effects of some elements, including aluminum and manganese; it also supplies calcium and magnesium, increases the availability of some nutrients, such as phosphorus, and contributes to the improvement of soil structure and microbial activity [6]. However, the amount of lime applied, as well as the way in which the lime is applied (in the soil surface only or incorporated into the soil) may degrade the soil structure in the long-term [4,7]. Therefore, it is important to study liming and tillage systems in sugarcane fields.
In most sugarcane fields, the soil is tilled to promote favorable physical conditions for plant growth and development. However, depending on soil characteristics (such as particle size distribution, organic matter content and soil moisture), as well as the tilling depth and equipment used, tillage may lead to the breakdown of soil aggregates and the loss of soil organic matter, resulting in an undesirable condition for soil structure [8,9]. Furthermore, tillage operations may also influence soil attributes or processes related to soil structure [3], such as soil porosity (macro and microporosity), soil bulk density, soil resistance to penetration, soil water infiltration and soil hydraulic conductivity [10].
Soil tillage is a common practice between sugarcane-producing farmers, and the conventional farming system is widely used. Although it may promote a temporarily favorable physical environment for plant growth, it also increases the number of macropores and decreases soil bulk density, especially in the topsoil, changing soil structure and the related soil hydrophysical attributes [11], including the saturated hydraulic conductivity, which is also temporarily increased in such conditions [12]. In contrast, conservational systems, such as the no-tillage system, which keeps the soil covered and minimally disturbs the soil, are known to restore soil structure through aggregation, as well as to mitigate soil erosion and supply soil organic matter [13,14], improving water storage in the soil. Nevertheless, the effects of no-tillage systems on soil’s hydrophysical attributes, especially in relation to water infiltration and saturated hydraulic conductivity, are still scarce and conflicting [5,15], especially for sugarcane fields [16].
In a review of the tillage effects on soil’s hydraulic properties, Strudley et al. [15] reported inconsistent responses in experimental studies, as comparisons between no-tillage and conventional tillage systems led to intermediate results for soil porosity, bulk density, hydraulic conductivity and soil water infiltration. This is because the hydrophysical attributes of cultivated soils may vary in time and space [15,17], and depend on topography, soil type, climate, crop species, machinery and implements used, waste management, management period and management history [15]. Therefore, the outcomes of farming systems cannot be standardized from one study site to another [15]. Therefore, studies within such a scope should be site-specific, and thus they should be carried out in several regions in order to understand each region specifically.
In the tropical region of Brazil, studies of soil’s hydrophysical attributes in sugarcane fields under no-tillage systems with liming are scarce [16], especially for long-term no-tillage systems. This data scarcity from long-term experiments limits the understanding of the influence of tillage systems and liming on soil structure and soil hydrophysical attributes [10], given that these soil attributes differ from those of short-term experiments due to the effect of the management system’s persistence on a longer temporal scale [15].
It is important to note that while conventional tillage is the system most used for cultivating sugarcane, it is known to impact the environment and its sustainability, especially due to soil degradation and its negative implications for ecosystem functions [2,16,18]. Considering that sugarcane is usually grown as a source for renewable energy, contributing to environmental sustainability, it is important to cultivate sugarcane in a system that promotes soil conservation instead of soil degradation. Thus, studies of conservation tillage and management systems in sugarcane are of primary importance for a more sustainable production of this crop, especially if the life-cycle assessments of sugarcane biofuel are considered.
Thus, this work aimed to assess the effects of liming and tillage systems on soil hydrophysical attributes in a long-term cultivated sugarcane field in the tropical region of southeast Brazil. This study is important in providing essential information about sustainable tillage systems, such as no tillage, in sugarcane cultivation.

2. Materials and Methods
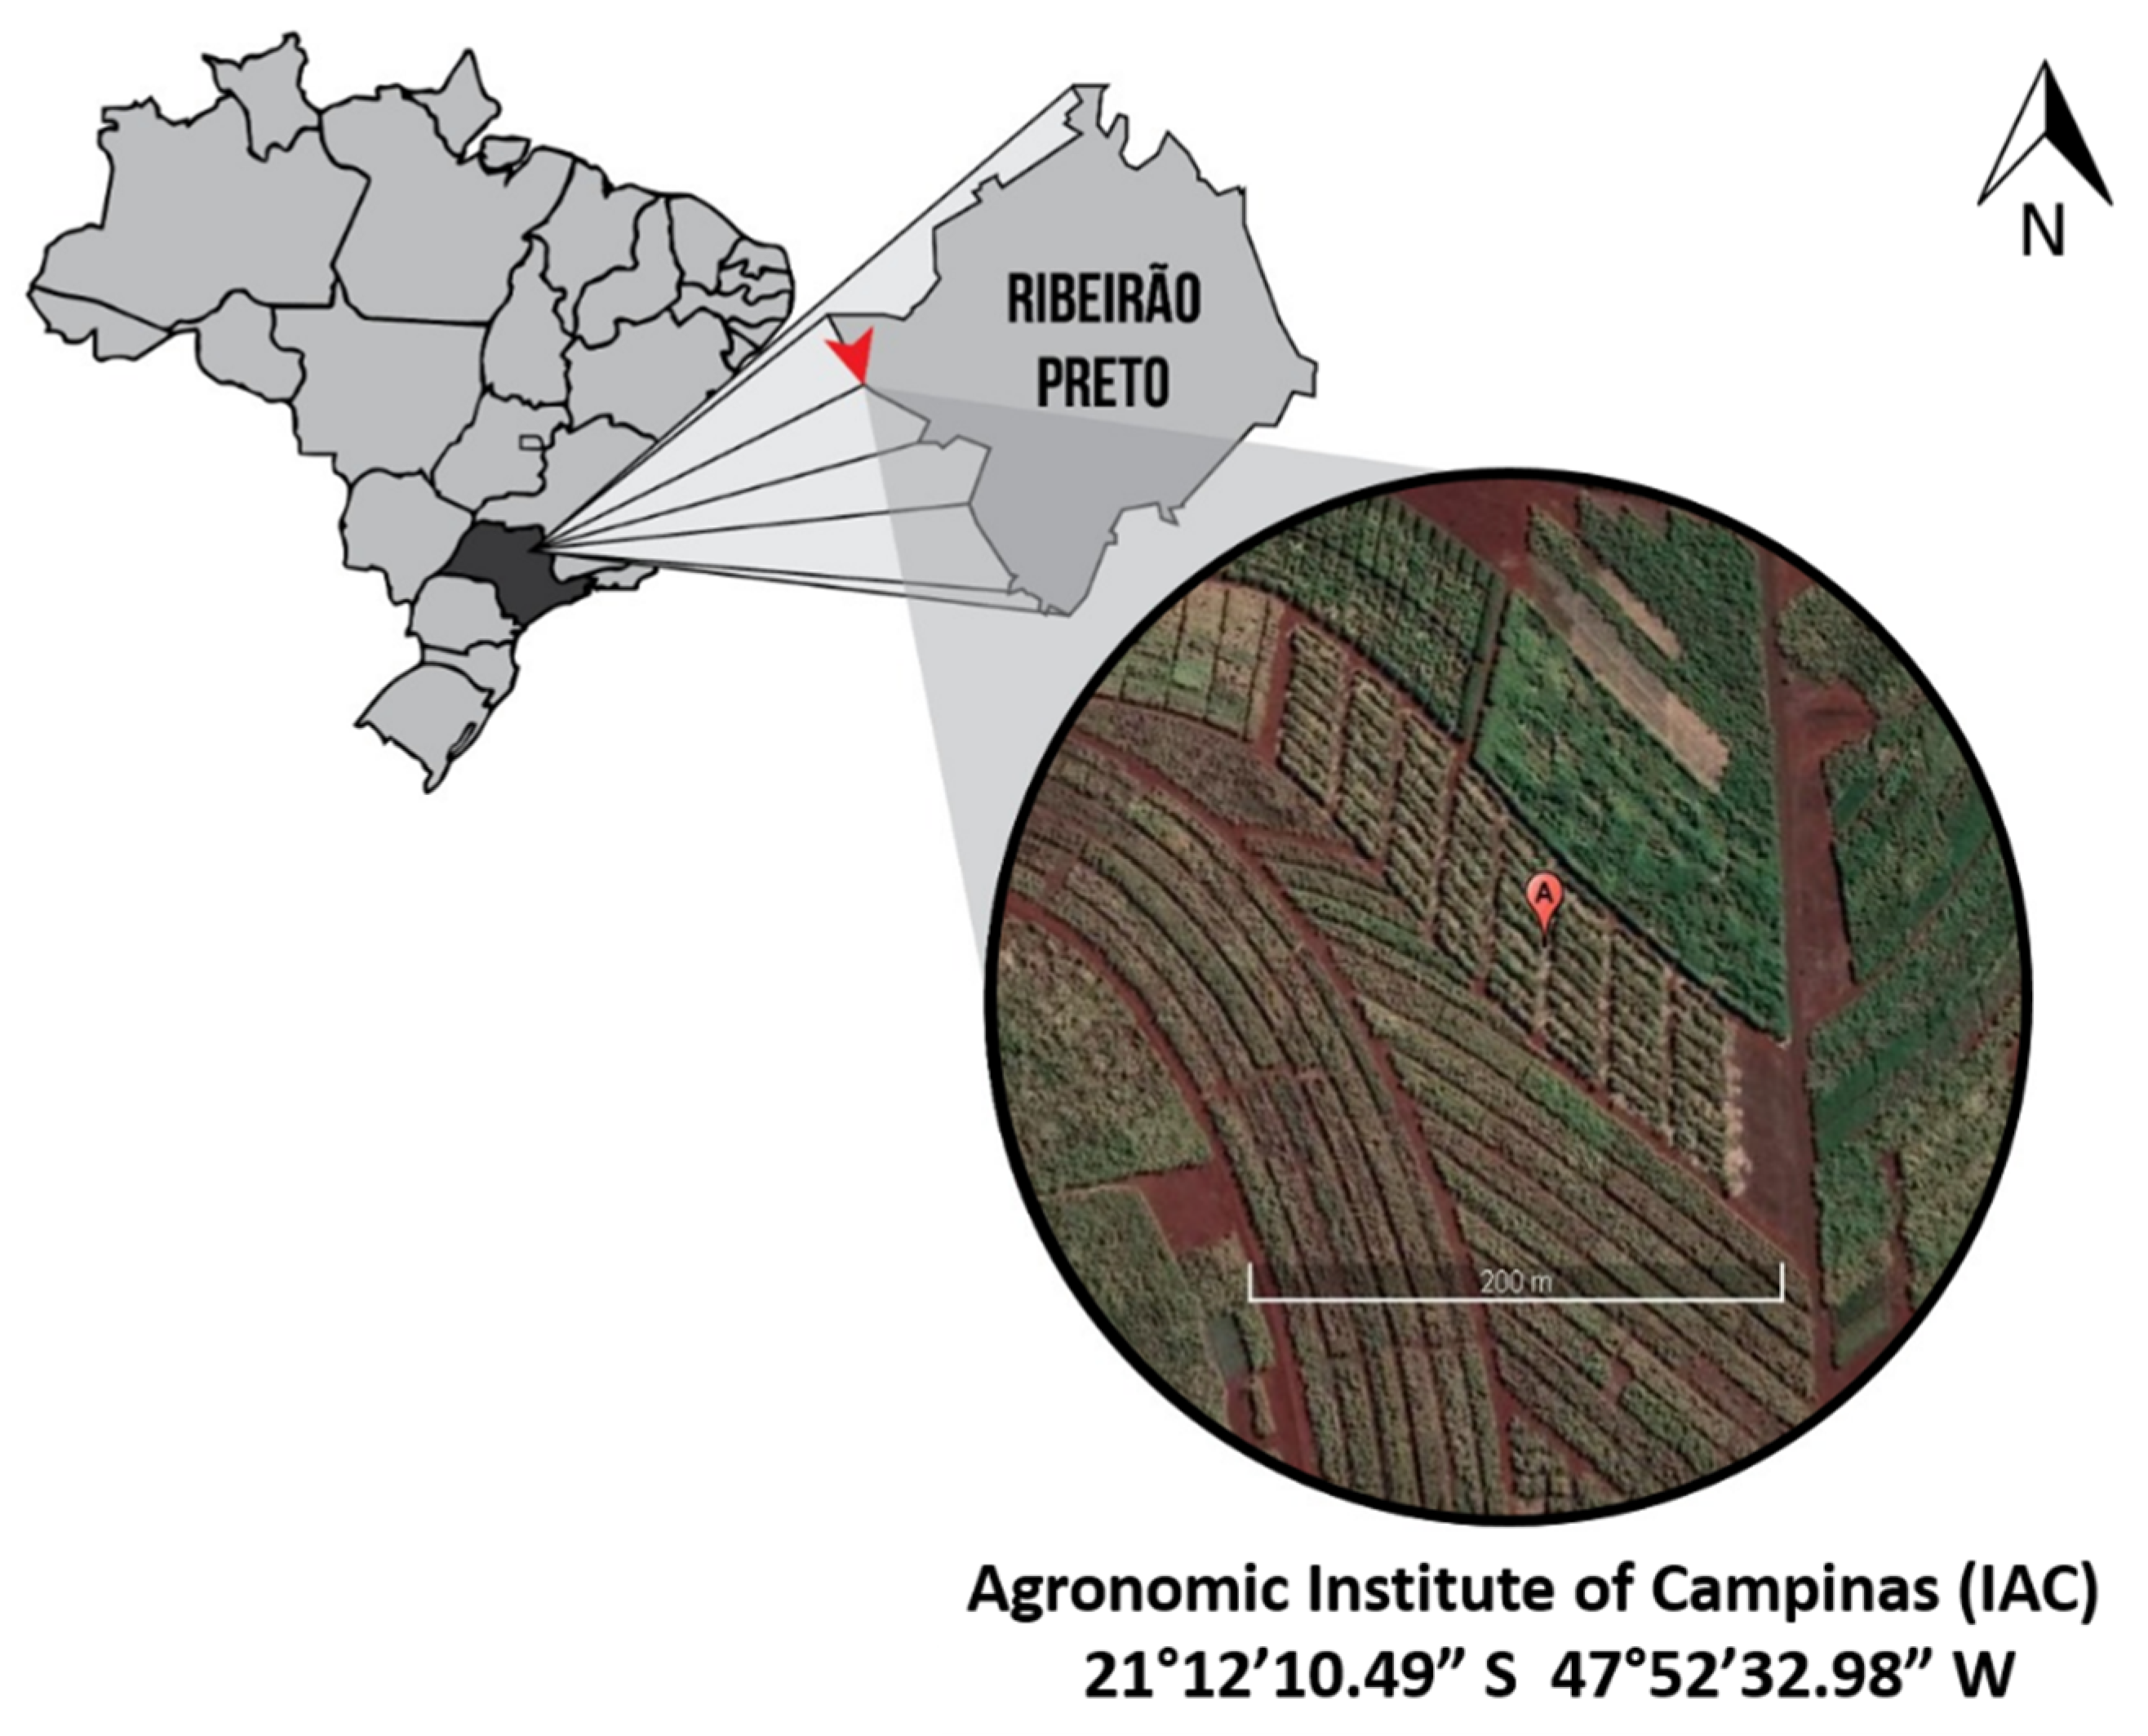
2.1. Study Area

The study was carried out at the Sugarcane Research Center of the Agronomic Institute of Campinas (IAC), which is located in the municipality of Ribeirão Preto, São Paulo State, Brazil. The studied site’s (Figure 1) geographic coordinates are 21°12′10.49″ S and 47°52′32.98″ W, and it is located at 614 m above sea level. The region’s climate is classified as Aw, tropical with dry winters and rainy summers, with a mean annual temperature of 21.6 °C and mean annual rainfall of 1454 mm [19].
The studied site comprises an experiment conducted since 1998, in which sugarcane (Saccharum officinarum L.) and soybean (Glycine max L.) are grown in a rotational system on a clayey Rhodic Eutrudox [20] (Table 1). The trial has been installed according to a randomized blocks experimental design, with the treatments arranged by split-plot scheme. The main plots are composed of two soil tillage systems: no-tillage (NT) and conventional tillage (CT). No-tillage was implemented in 1998 after the renovation of a commercial sugarcane field cultivated by conventional tillage and using soybean as a transitional and cover crop, which produced straw residues to initiate sugarcane plantation under no-tillage conditions. In subsequent years, crop residues have been permanently kept on the soil surface. In this system, glyphosate is sprayed over ratoons during sugarcane renovation, which is done every 5 years without tilling the soil, and using soybean as a transitional crop before replanting sugarcane. Conventional tillage (CT) was implemented in the study site using standard practices which consist of moldboard plowing down to 30 cm followed by offset disk harrowing twice down to 20 cm, which occurs before sowing the soybean as a transitional crop, after which sugarcane is planted. This cultivation system is repeated at each sugarcane renovation, and no subsoiling has occurred since the beginning of the trial. During the sugarcane cycle, fertilization and pesticide spraying are performed mechanically, and stalks are harvested by using chopper harvesters in both NT and CT. The secondary plots are composed of four liming rates, 0, 2, 4 and 6 Mg ha−1, applied in 1998, 2003, 2008 and 2018, respectively, during the renovation of sugarcane fields, always before sowing soybean. Lime is applied on the soil surface and is not incorporated into the NT system, whilst in the CT system it is incorporated during soil preparation. However, this study only assessed the experimental units under two liming rates (0 and 4 Mg ha−1). In order to facilitate the entry of machinery, each plot has a width of 15 m and a length of 20 m. Since the beginning of the trial and up to the date of sampling (April 2019), the NT system had not been tilled; on the other hand, in that same period the CT system was tilled 10 times. An adjoining area with native forest (from the Cerrado Biome [21]) was also assessed with four replicates, which was set as a reference for the agricultural plots.

2.2. Soil Sampling and Analytical Procedures

Infiltration tests and soil sampling were performed in April 2019 in the crop row (for the NT and CT systems), considering two replicates in each experimental unit, totaling 40 infiltration tests, 40 undisturbed soil samples and 40 disturbed soil samples. Soil water infiltration was tested by the Beerkan method [24]. A steel cylinder of 0.16 m diameter was inserted 0.01 m into the bare soil, as crop residues and litter had previously been removed. A known volume of water (150 mL) was then poured into the cylinder and the infiltration time was recorded, and then the cumulative infiltration, I (mm), was plotted against time, t (h). This procedure was repeated at least eight times, and up to the number of times needed to reach the steady state, as required by the Beerkan method.
The saturated soil hydraulic conductivity, Ks (mm h−1), was estimated by the steady version of the simplified method based on a Beerkan infiltration run (SSBI) [25], as follows:
Ks =   i s γ γ w r α * + 1
where is (mm h−1) is the slope of the linear regression fitted to the final portion of the cumulative infiltration time series data points (I(t) vs. t) describing steady-state conditions, r (mm) is the cylinder radius, γw and γ are dimensionless constants, often fixed at 1.818 [26] and 0.75 [27,28,29], respectively, and α* (mm−1) is the sorptive number, which expresses the relative importance of the capillary over gravity forces during water movement in unsaturated soils [30,31]. In this study, α* was set to be equal to 0.012 mm −1, taking into account that it represents the suggested first approximation value for most field soils [20], and that it is already used for many tropical soils, e.g., [25,32].
At the same points where the infiltration tests were performed, the topsoil (0–0.10 m) was sampled. Disturbed soil samples were collected before and after an infiltration test to determine the initial (θgi, g g−1) and final (θgf, g g−1) soil gravimetric water content, which are both needed for estimating Ks. Undisturbed soil samples were collected with soil cores of about 100 cm3, and they were used to determine soil bulk density (Bd, g cm−3), soil total porosity (TP, %), macroporosity (Mac, %), microporosity (Mic, %), soil resistance to penetration (RP, MPa) and volumetric water content (θv, cm3 cm−3).
The θgi and θgf were determined by weighing the soil sample before and after oven drying at 105 °C for 24 h until the sample reached a constant dry weight. Bd was determined as the ratio between the dry soil weight and the volume of the core used for sampling [33]. TP was determined by the difference between 1 and the ratio between soil bulk density and soil particle density (1−Bd/Pd). The value used for mean particle density was 3.12 g cm−3, which was assessed by using a helium pycnometer [34]. Mic was determined after water-saturated soil samples were set at –6 kPa. Mac was determined as the difference between TP and Mic. RP was assessed with a benchtop electronic penetrometer (CT3 Texture Analyzer, Brookfield, Middlebore, MA, EUA) in the central portion of the undisturbed soil sample, in which the water content was standardized to be equivalent to a tension of –6 kPa. θv was determined by multiplying θgi and θgf by Bd (θv = θgi or θgf x Bd).

2.3. Data Analysis

After the assumptions for the normality of residuals and the homogeneity of variance were met by the Shapiro–Wilk and Barllet’s tests, all studied variables (Ks, Bd, TP, Mic, Mac and RP) were subjected to analysis of variance (Anova), considering soil tillage and management systems as explanatory variables (NF, CT0, CT4, NT0 and NT4). The mean values were therefore compared with the Tukey test (p < 0.05). In order to achieve data normality for Ks, the natural logarithm was applied in the original data set for this variable in order to reduce its variability. Additionally, the dataset was standardized and used to calculate the Pearson correlation coefficient between the studied variables, and to perform a principal component analysis (PCA). The PCA analyzed the interrelationship between the variables and explained them based on their inherent dimensions, the components. Although the six hydrophysical variables led to six principal components in the PCA, only the first and the second components (PC1 and PC2) were considered, as they accounted for most of the data variability (94%), which was then explored in order to look for a global response regarding soil hydrophysical attributes in relation to tillage and management systems. The analyses were done using the statistical software R with the R Studio environment [35].

3. Results

All studied variables differed between tillage and management systems (Table 2). The NF differed from the other systems in all variables, whilst CT4, NT0 and NT4 did not differ in terms of Bd, TP and Mac. Ks was the variable that most differed within systems, as NF ≠ CT0 ≠ CT4 ≠ NT4, and NT0 = CT4 and NT4. The Ks in the NF was 6 to 22 times higher than in other systems. For the variables Bd, TP and Mac, only the NF differed from CT4, NT0 and NT4, as CT0 was similar to NF and the other treatments. NF was the system with the lowest Bd mean and the highest values for TP and Mac. Mic and RP showed a similar trend, with the same differences between systems, consisting of lower means for NF and CT0 and higher means for CT4 and NT0.
The highest correlation (Figure 2) was found between Bd and TP (negatively correlated), followed by TP and Mac (positively correlated) and Bd and Mac (negatively correlated). Ks was the variable least correlated with other soil hydrophysical attributes, in which the correlation ranged from −0.66 to 0.67.
According to the PCA (Figure 3 and Table 3), which was performed to better understand the effects of tillage and management systems on soil hydrophysical attributes, the first principal component (PC1) was responsible for 85.6% of data variability, and it is represented by Bd, RP and Mic (positively), as well as TP and Mac (negatively). The second component (PC2) accounted for 8.4% of data variability, and it is mainly represented by Ks (positively). The PCA also shows that there is a positive correlation between Bd, RP and Mic, as well as between TP and Mac.
The higher values in PC1 indicate that the systems NT0 and CT4 had higher values in attributes such as Bd, RP and Mic. The lower values in PC1, contrarily, indicate that CT0 and NF had higher values for Mac and TP, while the systems CT0 and NF had intermediate values. Moreover, the higher values in PC2 indicate that NF had the highest Ks, followed by CT0.

4. Discussion

The Ks values ranged from high (36–360 mm h−1) to very high (>360 mm h−1) [36]. The very high Ks in NF is a probable result of its high macroporosity (Table 2), as it was the soil hydrophysical attribute most correlated (0.67) with Ks (Figure 2). Very high Ks values are commonly found in oxisols under NF in comparison to cultivated areas [37,38]. For instance, an assessment of soil hydrophysical attributes in response to land use changes found a decrease in soil water infiltration from 1258 to 100 mm h−1 in forest areas converted to pasturelands [39], which is within the same variation found in our study considering Ks from NF in relation to the other evaluated soil use and management systems.
Although the Ks values in all studied soil and management systems with sugarcane were classified as high, the highest value within cultivated areas was found in CT0 (Table 2). Soil tillage in this system may increase both water infiltration into the soil and soil hydraulic conductivity, as tillage implements break the soil surface layer, loosening the soil and thus increasing macroporosity [9,10,12,40], as well as total porosity. Contrarily, some studies have shown that such tillage systems may decrease soil water infiltration, aggregate stability and macroporosity, and may promote soil sealing due to the lack of soil cover in the area [10,40]. This process of infiltration decrease can be found in CT4, the system that presents the lowest Ks value, and high values for Bd, Mic and RP (Table 2).
Studies of the effects of liming on chemical, physical and structural soil attributes in oxisols have shown that liming promotes clay dispersion, and reduces aggregate stability and infiltration rates [4,41,42,43]. In relation to the tillage systems, no-tillage may promote lime accumulation in the topsoil, and therefore impair liming reactivity [4]. However, these negative effects of liming on physical attributes were not observed in NT4. According to some studies [7,44,45], this is related to the higher soil organic carbon contents in no-tillage systems. In this condition, soil hydrophysical attributes are enhanced by liming, given that the increase in pH in soils with higher carbon inputs promotes an increase in the soil microbial population and microbial activity, which promotes aggregate stabilization [7].
A few studies that compared different soil tillage and management systems have found higher values of Ks in CT in relation to NT [3,46]. In our study, however, such behavior was observed only in CT0. Overall, it can be noted that the higher Ks values are related to lower Bd, higher TP and higher Mac values (Figure 2 and Figure 3).
The results for Bd in our study are similar to those from Luz et al.’s study [47], which assessed soil hydrophysical attributes in a clayey oxisol and found Bd values close to 1.0 g cm−3 in an area under native vegetation, and about 1.2 g cm−3 in soils with sugarcane. Differently, other studies [3,8,48,49] found Bd values for soils under sugarcane ranging from 1.46 to 1.68 g cm−3, which are higher than the ones in our study, regardless of the tillage and management system assessed. In a literature review concerning no-tillage systems and soil physical attributes, Blanco-Canqui and Ruis [5] found that Bd in NT may have mixed effects, as it may increase, decrease, or result in no differences when compared to CT. The latter relates to our results for Bd, in which no differences were found between soil tillage and management systems. The above-mentioned authors also described that the lapse in time after the implementation of soil management systems greatly influences soil bulk density, and that minimal differences are observed for Bd in long-term soil tillage and management systems. The work of Fan et al. [50], for example, assessed a 30 y tillage experiment and found changes in Bd values between CT and NT up to 4% only. In this same context, Barbosa et al. [51] emphasizes that CT in sugarcane fields disrupts compacted soil layers, temporarily reducing Bd due to increased Mac. However, these same authors discuss that as time goes by, a reduction in Mac is observed, increasing Bd and RP, leading to similar physical environments in the soil for both CT and NT. Therefore, it is clear that every tillage operation in CT systems leads to significant changes in the soil physical environment, while NT systems promote a more stable environment through time. It is important to mention that in our study, the soil was disturbed 10 times in a period of 21 years for the CT system treatment.
Some authors have suggested maximum Bd values to establish critical limits for plant growth and development. Limiting Bd values between 1.25 g cm−3 [52] and 1.40 g cm−3 [53,54] has been recommended for clayey soils. Considering the critical limit of 1.40 g cm−3, the Bd values in our study do not impair plant growth and development. However, considering the 1.25 g cm−3 value, which was suggested for an oxisol under sugarcane in Brazil, plant growth and development in CT4 and NT0 may be limited, demanding soil management interventions to promote a favorable environment in these systems.
Soil bulk density influences other soil attributes or processes, including oxygen diffusion rate, water storage, plant growth and soil resistance to penetration [55]. Soils with high bulk density, in general, have low total porosity, low macroporosity, high microporosity [49] and high soil resistance to penetration. Our results show a significant negative correlation between macro- and microporosity, as well as between soil bulk density and macroporosity, and a positive correlation between soil bulk density and soil resistance to penetration (Table 2, Figure 2 and Figure 3), which corroborates with other studies found in the literature, e.g., [49].
As for soil bulk density, critical limits for macroporosity and soil resistance to penetration were also established in order to enable adequate oxygen diffusion and root growth and development. The minimum value for macroporosity is defined as 0.10 cm3 cm−3, or 10% [56]. The maximum value for soil resistance to penetration varies according to soil type, soil management and crop species, although the value of 2 MPa is recommended by several authors [57,58,59,60]. Barbosa et al. [52] studied the relationship between soil texture and critical limits for soil resistance to penetration in oxisols under sugarcane, and they suggested a value of 2.5 MPa as the maximum value for soil resistance to penetration in clayey soils.
The values for Mac and RP found in this study indicate no restriction for root growth and development, differently from other studies with soils under sugarcane [3,49,51]. Our results suggest that aeration is adequate, as Mac values were higher than 10% and RP values were lower than 2.5 MPa. In relation to RP in different soil tillage and management systems, our results corroborate Baquero et al.’s [49], in which a clear difference was found between values from native forests and sugarcane areas; in our case, this especially held between both NF and CT4, and NF and NT0, which is expected as there is no anthropogenic influence in NF.
Overall, it can be seen that CT4 and NT0 are the treatments that require the most care, especially due to their higher values of Bd in relation to the other systems. Liming, tillage and the lack of soil cover in CT4 have probably reduced aggregate stability, causing clay dispersion and, consequently, the obstruction of larger pores [4,41,42,43], resulting in an increase in Bd and a decrease in macroporosity. The non-addition of lime in NT0 and the consequently lower soil pH (Table 1) may have limited the soil microbial diversity, abundance, and activity in this system, reducing aggregate stability, and therefore decreasing macroporosity [7,45] and increasing Bd. Moreover, the results from CT0 should also be carefully analyzed. The high Mac and low RP resulting from soil tillage may reduce the contact between roots and soil particles, and therefore compromise plant growth and development, leading to lower crop yields. Such a condition was assessed in the work of Duarte Júnior and Coelho [61], in which sugarcane grown under a no-tillage system performed better than sugarcane grown under conventional tillage, with 37% more stalk productivity. In addition, due to the characteristics of the system, which include soil tilling and not keeping the soil covered with straw, CT0 reduces the accumulation of organic carbon in the soil, and consequently the stability of its structure [44], potentially increasing soil erosion rates [62] and the emission of carbon dioxide [63], which makes it an unsustainable system.
Considering the soil tillage and management systems studied, and considering the soil fertility requirements for growing sugarcane, the NT4 treatment can be suggested as the most viable system for conservation agriculture in sugarcane fields. Our results from a long-term experiment suggest that, besides ensuring a better fertility status resulting from liming, this system enhances soil hydrophysical attributes and soil structural quality, as a result of i) the maintenance of soil cover due to no-tillage, which protects the soil from raindrop impact and reduces the pressure from agricultural machinery on the soil, attenuating the increase in both Bd and RP, as well as the decrease in TP and Mac; ii) the higher soil organic carbon content derived from the soil cover, which promotes microbial activity and leads to aggregate stabilization, processes known to improve soil physical quality through time [3,51].
The organic matter inputs in NT enhance soil physical attributes related to soil water infiltration, such as pore size distribution and continuity [64]. However, our study has not assessed pore continuity, and thus this should be further investigated in future research, as pore continuity and other indicators of pore characterization assessed by imaging techniques are considered more correlated to several soil functions than analytical methods [65]. Furthermore, pore connectivity in long-term no-tillage systems is known to provide soil functions, even under compaction and with undesirable results from analytical soil assessments [66]. Future works should also include assessments related to aggregate stability, water retention and soil structural quality in order to better understand the outcomes of different soil tillage and management systems for sugarcane.

5. Conclusions

The highest values of soil hydraulic conductivity were found in the native forest and in conventional tillage without lime, as a consequence of the lowest values of bulk density and the highest values of soil total porosity and macroporosity.
A conventional tillage system with 4 Mg ha−1 of lime and a no-tillage system with 0 Mg ha−1 of lime may require soil amelioration through soil tillage and management practices, especially because of their high bulk density values, which are over one of the suggested critical bulk density limits for plant growth and development.
Overall, the no-tillage with 4 Mg ha−1 of lime is suggested as the most viable system for conservation agriculture in sugarcane fields because it combines the benefits of correcting soil fertility through liming with the benefits of no-tillage, which improves the hydrophysical attributes and soil structure, promoting soil conservation and the system’s sustainability. This system presented intermediate values of saturated hydraulic conductivity, soil density, total porosity, macro- and microporosity and resistance of the soil to penetration, which promotes a favorable environment for a better soil hydrophysical functioning.
Future research should study the benefits of conservation tillage in sugarcane in the whole soil profile, and include more detailed analysis to better understand the improvement of soil functioning and its impacts on soil conservation and the sustainability of sugarcane as a source of renewable fuels. To accomplish this, we suggest the description and quantification of pore continuity by 2D and 3D image processing techniques, which are correlated to a variety of soil functions, as well as the assessment of aggregate stability, soil water retention and soil structural quality.

Author Contributions

Conceptualization, M.C., A.F.M., L.F.S.d.S. and D.B.; formal analysis, A.F.M.; investigation, D.B., A.F.M., G.P.V., M.C. and L.F.S.d.S.; resources, A.F.M., M.C. and D.B.; data curation, A.F.M.; writing—original draft preparation, A.F.M. and G.P.V.; writing—review and editing, M.C., S.D.P., L.F.S.d.S., D.B., A.F.M. and G.P.V.; visualization, A.F.M. and G.P.V.; supervision, M.C. and D.B.; project administration, M.C. and D.B.; funding acquisition, D.B., M.C., A.F.M. and S.D.P. All authors have read and agreed to the published version of the manuscript.

Funding

This research was in part by the Coordenação de Aperfeiçoamento de Pessoal de Nível Superior—Brasil (CAPES)—Finance Code 001, in part by São Paulo Research Foundation (FAPESP), grant number 2018/20570-0, and in part by Fundação Agrisus.

Institutional Review Board Statement

Not applicable.

Informed Consent Statement

Not applicable.

Data Availability Statement

The data presented in this study are available on request from the corresponding author. The data are not publicly available due to privacy restrictions.

Acknowledgments

Miguel Cooper acknowledges the National Council for Scientific and Technological Development (CNPq) for the fellowship. Aline Fachin Martíni acknowledges Nayana Alves Pereira for the support with the Best methodology, the laboratory technician Rossi for the support with analysis, and the team “Cooper Trupe” for field support.

Conflicts of Interest

The authors declare no conflict of interest.

References

  1. Surendran, U.; Ramesh, V.; Jayakumar, M.; Marimuthu, S.; Sridevi, G. Improved sugarcane productivity with tillage and trash management practices in semi arid tropical agro ecosystem in India. Soil Tillage Res. 2016, 158, 10–21. [Google Scholar] [CrossRef]
  2. Cherubin, M.R.; Karlen, D.L.; Franco, A.L.C.; Tormena, C.A.; Cerri, C.C.E.P.; Davies, C.A.; Cerri, C.C.E.P. Soil physical quality response to sugarcane expansion in Brazil. Geoderma 2016, 267, 156–168. [Google Scholar] [CrossRef]
  3. Awe, G.O.; Reichert, J.M.; Fontanela, E. Sugarcane production in the subtropics: Seasonal changes in soil properties and crop yield in no-tillage, inverting and minimum tillage. Soil Tillage Res. 2020, 196, 104447. [Google Scholar] [CrossRef]
  4. Nunes, M.R.; Vaz, C.M.P.; Denardin, J.E.; van Es, H.M.; Libardi, P.L.; da Silva, A.P. Physicochemical and Structural Properties of an Oxisol under the Addition of Straw and Lime. Soil Sci. Soc. Am. J. 2017, 81, 1328–1339. [Google Scholar] [CrossRef] [Green Version]
  5. Blanco-Canqui, H.; Ruis, S.J. No-tillage and soil physical environment. Geoderma 2018, 326, 164–200. [Google Scholar] [CrossRef]
  6. Brady, N.C.; Weil, R.R. Elementos da Natureza e Propriedades do Solo, 3rd ed.; Bookman: Porto Alegre, Brazil, 2013; ISBN 9788565837743. [Google Scholar]
  7. Albuquerque, J.A.; Bayer, C.; Ernani, P.R.; Mafra, A.L.; Fontana, E.C. Effects of liming and phosphorus application on the structural stability of an acid soil. Rev. Bras. Ciência Solo 2003, 27, 799–806. [Google Scholar] [CrossRef]
  8. Scarpare, F.V.; de Jong van Lier, Q.; de Camargo, L.; Pires, R.C.M.; Ruiz-Corrêa, S.T.; Bezerra, A.H.F.; Gava, G.J.C.; Dias, C.T.S. Tillage effects on soil physical condition and root growth associated with sugarcane water availability. Soil Tillage Res. 2019, 187, 110–118. [Google Scholar] [CrossRef]
  9. Carpenedo, V.; Mielniczuk, J. Estado de agregação e qualidade de agregados de Latossolos Roxos, submetido a diferentes sistemas de manejo. Rev. Bras. Ciência Solo 1990, 14, 99–105. [Google Scholar]
  10. Blanco-Canqui, H.; Wienhold, B.J.; Jin, V.L.; Schmer, M.R.; Kibet, L.C. Long-term tillage impact on soil hydraulic properties. Soil Tillage Res. 2017, 170, 38–42. [Google Scholar] [CrossRef] [Green Version]
  11. Reichert, J.M.; da Rosa, V.T.; Vogelmann, E.S.; da Rosa, D.P.; Horn, R.; Reinert, D.J.; Sattler, A.; Denardin, J.E. Conceptual framework for capacity and intensity physical soil properties affected by short and long-term (14 years) continuous no-tillage and controlled traffic. Soil Tillage Res. 2016, 158, 123–136. [Google Scholar] [CrossRef] [Green Version]
  12. Coquet, Y.; Vachier, P.; Labat, C. Vertical variation of near-saturated hydraulic conductivity in three soil profiles. Geoderma 2005, 126, 181–191. [Google Scholar] [CrossRef]
  13. Singh, B.P.; Setia, R.; Wiesmeier, M.; Kunhikrishnan, A. Agricultural Management Practices and Soil Organic Carbon Storage. In Soil Carbon Storage; Elsevier: Amsterdam, The Netherlands, 2018; pp. 207–244. [Google Scholar]
  14. Denardin, J.E.; Kochhann, R.A.; Faganello, A.; Denardin, N.D.; Santi, A. Diretrizes do Sistema Plantio Direto no Contexto da Agricultura Conservacionista; Embrapa Trigo: Passo Fundo, Brazil, 2012. [Google Scholar]
  15. Strudley, M.W.; Green, T.R.; Ascough, J.C. Tillage effects on soil hydraulic properties in space and time: State of the science. Soil Tillage Res. 2008, 99, 4–48. [Google Scholar] [CrossRef]
  16. Martíni, A.F.; Valani, G.P.; Boschi, R.S.; Bovi, R.C.; Simões da Silva, L.F.; Cooper, M. Is soil quality a concern in sugarcane cultivation? A bibliometric review. Soil Tillage Res. 2020, 204, 104751. [Google Scholar] [CrossRef]
  17. Alletto, L.; Coquet, Y. Temporal and spatial variability of soil bulk density and near-saturated hydraulic conductivity under two contrasted tillage management systems. Geoderma 2009, 152, 85–94. [Google Scholar] [CrossRef]
  18. Carvalho, J.L.N.; Nogueirol, R.C.; Menandro, L.M.S.; de Oliveira Bordonal, R.; Borges, C.D.; Cantarella, H.; Franco, H.C.J. Agronomic and environmental implications of sugarcane straw removal: A major review. GCB-Bioenergy 2016, 9, 1181–1195. [Google Scholar] [CrossRef]
  19. Alvares, C.A.; Stape, J.L.; Sentelhas, P.C.; De Moraes Gonçalves, J.L.; Sparovek, G. Köppen’s climate classification map for Brazil. Meteorol. Z. 2013, 22, 711–728. [Google Scholar] [CrossRef]
  20. Soil Survey Staff. Soil Taxonomy. A Basic System of Soil Classification for Making and Interpreting Soil Surveys, 2nd ed.; USDA, Ed.; NRCS: Washington, DC, USA, 1999. [Google Scholar]
  21. de Miranda, E.E.; Fonseca, M.F. Considerações Fitogeográficas e Históricas Sobre o Bioma Cerrado no Estado de São Paulo; Embrapa: Campinas, Brazil, 2013. [Google Scholar]
  22. Teixeira, P.C.; Donagemma, G.K.; Fontana, A.; Teixeira, W.G. Manual de Métodos de Análises de Solo, 3th ed.; Teixeira, P.C., Donagemma, G.K., Fontana, A., Teixeira, W.G., Eds.; Embrapa: Brasilia-DF, Barzil, 2017; ISBN 9788570357717. [Google Scholar]
  23. de Camargo, O.A.; Moniz, A.C.; Jorge, J.A.; Valadares, J.M.A.S. Boletim Técnico 106: Métodos de Análise Química, Mineralógica e Física de Solos do Instituto Agronômico de Campinas; Instituto Agronomico de Campinas: Campinas-SP, Barzil, 2009. [Google Scholar]
  24. Lassabatère, L.; Angulo-Jaramillo, R.; Soria Ugalde, J.M.; Cuenca, R.; Braud, I.; Haverkamp, R. Beerkan Estimation of Soil Transfer Parameters through Infiltration Experiments-BEST. Soil Sci. Soc. Am. J. 2006, 70, 521–532. [Google Scholar] [CrossRef]
  25. Bagarello, V.; Di Prima, S.; Iovino, M. Estimating saturated soil hydraulic conductivity by the near steady-state phase of a Beerkan infiltration test. Geoderma 2017, 303, 70–77. [Google Scholar] [CrossRef]
  26. White, I.; Sully, M.J. Macroscopic and microscopic capillary length and time scales from field infiltration. Water Resour. Res. 1987, 23, 1514–1522. [Google Scholar] [CrossRef]
  27. Reynolds, W.D.; Elrick, D.E. Pressure infiltrometer. In Methods of Soil Analysis; Dane, J.H., Topp, G.C., Eds.; Science Society of America: Madison, WI, USA, 2002; pp. 826–836. [Google Scholar]
  28. Haverkamp, R.; Ross, P.J.; Smettem, K.R.J.; Parlange, J.Y. Three-dimensional analysis of infiltration from the disc infiltrometer: 2. Physically based infiltration equation. Water Resour. Res. 1994, 30, 2931–2935. [Google Scholar] [CrossRef] [Green Version]
  29. Di Prima, S.; Lassabatere, L.; Bagarello, V.; Iovino, M.; Angulo-Jaramillo, R. Testing a new automated single ring infiltrometer for Beerkan infiltration experiments. Geoderma 2016, 262, 20–34. [Google Scholar] [CrossRef]
  30. Raats, P. Analytical Solutions of a Simplified Flow Equation. Trans. ASAE 1976, 19, 0683–0689. [Google Scholar] [CrossRef]
  31. Di Prima, S.; Stewart, R.D.; Castellini, M.; Bagarello, V.; Abou Najm, M.R.; Pirastru, M.; Giadrossich, F.; Iovino, M.; Angulo-Jaramillo, R.; Lassabatere, L. Estimating the macroscopic capillary length from Beerkan infiltration experiments and its impact on saturated soil hydraulic conductivity predictions. J. Hydrol. 2020, 589, 125159. [Google Scholar] [CrossRef]
  32. Bagarello, V.; Di Prima, S.; Giordano, G.; Iovino, M. A test of the Beerkan Estimation of Soil Transfer parameters (BEST) procedure. Geoderma 2014, 221–222, 20–27. [Google Scholar] [CrossRef]
  33. Grossman, R.B.; Reinsch, T.G. Bulk Density e Linear Extensibility. In Methods of Soil Analysis—Part 4—Physical Methods; Dane, J.H., Topp, G.C., Eds.; Soil Science Society of America: Madison, WI, USA, 2002; pp. 201–228. [Google Scholar]
  34. Flint, A.L.; Flint, L.E. Particle Density. In Methods of Soil Analysis—Part 4—Physical Methods; Campbell, G.S., Horton, R., Jury, W.A., Nielsen, D.R., van ES, H.M., Wierenga, P.J., Dane, J.H., Topp, G.C., Eds.; Soil Science Society of America: Madison, WI, USA, 2002; pp. 229–240. [Google Scholar]
  35. R Core Team. R: A Language and Environment for Statistical Computing; R Foundation for Statistical Computing: Vienna, Austria, 2020; Available online: https://www.R-project.org/ (accessed on 2 December 2020).
  36. Soil Science Division Staff. Soil Survey Manual; Ditzler, C., Scheffer, K., Monger, H.C., Eds.; USDA Handb.; Government Printing Office: Washington, DC, USA, 2017; Volume 18, ISBN 978-1410204172.
  37. Araujo, M.A.; Tormena, C.A.; Silva, A.P. Propriedades físicas de um Latossolo Vermelho distrófico cultivado e sob mata nativa. Rev. Bras. Ciência Solo 2004, 28, 337–345. [Google Scholar] [CrossRef]
  38. Silva, A.J.N.; Ribeiro, M.R.; Mermut, A.R.; Benke, M.B. Influência do cultivo contínuo da cana-de-açúcar em latossolos amarelos coesos do estado de Alagoas: Propriedades micromorfológicas. Rev. Bras. Ciência Solo 1998, 22, 515–525. [Google Scholar] [CrossRef] [Green Version]
  39. Scheffler, R.; Neill, C.; Krusche, A.V.; Elsenbeer, H. Soil hydraulic response to land-use change associated with the recent soybean expansion at the Amazon agricultural frontier. Agric. Ecosyst. Environ. 2011, 144, 281–289. [Google Scholar] [CrossRef] [Green Version]
  40. Unger, P.W. Infiltration of Simulated Rainfall: Tillage System and Crop Residue Effects. Soil Sci. Soc. Am. J. 1992, 56, 283–289. [Google Scholar] [CrossRef]
  41. Butierres, M. Efeito do Calcário e Fosfato de Potássio no Ponto de Zero Carga (PZC) e Grau de Floculação de Três Solos do Rio Grande do Sul. Tese de Mestrado, Universidade Federal do Rio Grande do Sul, Santa Maria, Brazil, 1980; 59p. [Google Scholar]
  42. Morelli, M.; Ferreira, E. Efeito do carbonato de cálcio e do fosfato diamônico em propriedades eletroquímicas e físicas de um Latossolo. Rev. Bras. Ciência Solo 1987, 11, 1–6. [Google Scholar]
  43. Roth, C.H.; Pavan, M.A. Effects of lime and gypsum on clay dispersion and infiltration in samples of a Brazilian Oxisol. Geoderma 1991, 48, 351–361. [Google Scholar] [CrossRef]
  44. Segnini, A.; Carvalho, J.L.N.; Bolonhezi, D.; Bastos Pereira Milori, D.M.; Lopes da Silva, W.T.; Simoes, M.L.; Cantarella, H.; de Maria, I.C.; Martin-Neto, L. Carbon stock and humification index of organic matter affected by sugarcane straw and soil management. Sci. Agric. 2013, 70, 321–326. [Google Scholar] [CrossRef] [Green Version]
  45. Franco, A.L.C.; Cherubin, M.R.; Cerri, C.E.P.; Six, J.; Wall, D.H.; Cerri, C.C. Linking soil engineers, structural stability, and organic matter allocation to unravel soil carbon responses to land-use change. Soil Biol. Biochem. 2020, 150, 107998. [Google Scholar] [CrossRef]
  46. Haruna, S.I.; Anderson, S.H.; Nkongolo, N.V.; Zaibon, S. Soil Hydraulic Properties: Influence of Tillage and Cover Crops. Pedosphere 2018, 28, 430–442. [Google Scholar] [CrossRef]
  47. da Luz, F.B.; Carvalho, M.L.; de Borba, D.A.; Schiebelbein, B.E.; Paiva de Lima, R.; Cherubin, M.R. Linking Soil Water Changes to Soil Physical Quality in Sugarcane Expansion Areas in Brazil. Water 2020, 12, 3156. [Google Scholar] [CrossRef]
  48. León, H.N.; Almeida, B.G.; Almeida, C.D.G.C.; Freire, F.J.; Souza, E.R.; Oliveira, E.C.A.; Silva, E.P. Medium-term influence of conventional tillage on the physical quality of a Typic Fragiudult with hardsetting behavior cultivated with sugarcane under rainfed conditions. Catena 2019, 175, 37–46. [Google Scholar] [CrossRef]
  49. Baquero, J.E.; Ralisch, R.; Medina, C.D.C.; Filho, J.T.; Guimarães, M.D.F. Soil physical properties and sugarcane root growth in a red oxiso. Rev. Bras. Ciência Solo 2012, 36, 63–70. [Google Scholar] [CrossRef] [Green Version]
  50. Fan, R.Q.; Yang, X.M.; Drury, C.F.; Reynolds, W.D.; Zhang, X.P. Spatial distributions of soil chemical and physical properties prior to planting soybean in soil under ridge-, no- and conventional-tillage in a maize-soybean rotation. Soil Use Manag. 2014, 30, 414–422. [Google Scholar] [CrossRef]
  51. Barbosa, L.C.; Magalhães, P.S.G.; Bordonal, R.O.; Cherubin, M.R.; Castioni, G.A.F.; Tenelli, S.; Franco, H.C.J.; Carvalho, J.L.N. Soil physical quality associated with tillage practices during sugarcane planting in south-central Brazil. Soil Tillage Res. 2019, 195, 104383. [Google Scholar] [CrossRef]
  52. Barbosa, L.C.; de Souza, Z.M.; Franco, H.C.J.; Otto, R.; Rossi Neto, J.; Garside, A.L.; Carvalho, J.L.N. Soil texture affects root penetration in Oxisols under sugarcane in Brazil. Geoderma Reg. 2018, 13, 15–25. [Google Scholar] [CrossRef]
  53. USDA-NRCS Soil Quality Resource Concerns: Compaction. Available online: https://web.extension.illinois.edu/soil/sq_info/compact.pdf (accessed on 2 December 2020).
  54. Arshad, M.A.C.; Lowery, B.; Grossman, B. Physical Tests for Monitoring Soil Quality. In Methods for Assessing Soil Quality; Doran, J.W., Jones, A.J., Eds.; Soil Science Society of America: Madison, WI, USA, 1996; pp. 123–141. [Google Scholar]
  55. Letey, J. Relationship between Soil Physical Properties and Crop Production. In Advances in Soil Science; Stewart, B., Ed.; Springer: New York, NY, USA, 1958; pp. 277–294. [Google Scholar]
  56. Erickson, A.E. Tillage Effects on Soil Aeration. In Predicting Tillage Effects On Soil Physical Properties And Processes; Unger, P., Van Doren, D., Jr., Skidmore, F.D., Whisler, E.L., Eds.; American Society of Agronomy: Madison, WI, USA, 1982; pp. 91–104. [Google Scholar]
  57. Tormena, C.A.; Silva, A.P.; Libardi, P.L. Caracterização do intervalo hídrico ótimo de um latossolo roxo sob plantio direto. Rev. Bras. Ciência Solo 1998, 22, 573–581. [Google Scholar] [CrossRef]
  58. Tormena, C.; Silva, A.P.; Libardi, P.L. Soil physical quality of a Brazilian Oxisol under two tillage systems using the least limiting water range approach. Soil Tillage Res. 1999, 52, 223–232. [Google Scholar] [CrossRef]
  59. de Lima, C.L.R.; Miola, E.C.C.; Timm, L.C.; Pauletto, E.A.; da Silva, A.P. Soil compressibility and least limiting water range of a constructed soil under cover crops after coal mining in Southern Brazil. Soil Tillage Res. 2012, 124, 190–195. [Google Scholar] [CrossRef]
  60. da Silva, Á.P.; Tormena, C.A.; Fidalski, J.; Imhoff, S. Funções de pedotransferência para as curvas de retenção de água e de resistência do solo à penetração. Rev. Bras. Ciência Solo 2008, 32, 1–10. [Google Scholar] [CrossRef] [Green Version]
  61. Duarte Júnior, J.; Coelho, F. A cana-de-açúcar em sistema de plantio direto comparado ao sistema convencional com e sem adubação. Rev. Bras. Eng. Agric. Ambient. 2008, 12, 576–583. [Google Scholar] [CrossRef] [Green Version]
  62. Prove, B.G.; Doogan, V.J.V.; Truong, P.N. V Nature and Magnitude of Soil Erosion in Sugarcane Land on the Wet Tropical Coast of North-Eastern Queensland. Aust. J. Exp. Agric. 1995, 35, 641–649. [Google Scholar] [CrossRef]
  63. La Scala, N.; Bolonhezi, D.; Pereira, G.T. Short-term soil CO2 emission after conventional and reduced tillage of a no-till sugar cane area in southern Brazil. Soil Tillage Res. 2006, 91, 244–248. [Google Scholar] [CrossRef]
  64. Canisares, L.P.; Cherubin, M.R.; da Silva, L.F.S.; Franco, A.L.C.; Cooper, M.; Mooney, S.J.; Cerri, C.E.P. Soil microstructure alterations induced by land use change for sugarcane expansion in Brazil. Soil Use Manag. 2019, 1–11. [Google Scholar] [CrossRef]
  65. Rabot, E.; Wiesmeier, M.; Schlüter, S.; Vogel, H.-J. Soil structure as an indicator of soil functions: A review. Geoderma 2018, 314, 122–137. [Google Scholar] [CrossRef]
  66. Cavalieri, K.M.V.; da Silva, A.P.; Tormena, C.A.; Leão, T.P.; Dexter, A.R.; Håkansson, I. Long-term effects of no-tillage on dynamic soil physical properties in a Rhodic Ferrasol in Paraná, Brazil. Soil Tillage Res. 2009, 103, 158–164. [Google Scholar] [CrossRef]
Figure 1. Location of the studied area within São Paulo State.
Sustainability 13 03448 g001
Figure 2. Correlation between soil hydrophysical attributes: bulk density (Bd), total porosity (TP), microporosity (Mic), macroporosity (Mac), soil resistance to penetration (RP) and natural logarithm of the saturated hydraulic conductivity (ln Ks). The larger the circle, the higher the correlation (either positive or negative).
Sustainability 13 03448 g002
Figure 3. Principal component analysis (PCA) biplot based on soil hydrophysical attributes: bulk density (Bd), total porosity (TP), microporosity (Mic), macroporosity (Mac), soil resistance to penetration (RP) and natural logarithm of the saturated hydraulic conductivity (ln Ks). The larger circles represent the average mean from the four replicates within the same color. Each small circle represents the average mean of the two replicates from each experimental unit.
Sustainability 13 03448 g003
Table 1. Relative particle size distribution, soil texture and soil classification of the study site.
TreatmentpHSOCCaMgH+AlCECClaySiltSandTextureSoil Classification
g kg−1mmolc kg−1%
NF6.5381073931183711316ClayRhodic Eutrudox
CT 05.12228962101711415ClayRhodic Eutrudox
CT 46.020372734102701713ClayRhodic Eutrudox
NT 05.027351972.129691516ClayRhodic Eutrudox
NT 46.230644640153651916ClayRhodic Eutrudox
NF: native forest; CT: conventional tillage; NT: no-tillage; 0: 0 Mg ha−1 of lime; 4: 4 Mg ha−1 of lime; pH: potential of hydrogen; SOC: soil organic carbon; Ca: calcium; Mg: magnesium; H+Al: titratable acidity; CEC: cation exchange capacity. Methods: pH in H2O (1:2.5 ratio), Ca, Mg, H+Al and CEC determined according Teixeira et. [22]; SOC determined according Camargo et al. [23]. Clay, silt and sand determined by the densimeter method [22]. Soil texture and soil classification according to soil taxonomy [20].
Table 2. Average means and standard deviations (±) for hydrophysical soil attributes: saturated hydraulic conductivity (Ks), bulk density (Bd), total porosity (TP), microporosity (Mic), macroporosity (Mac) and soil resistance to penetration (RP).
TreatmentSoil Hydrophysical Attributes
Ks (mm h−1)Bd (g cm−3)TP (%)Mic (%)Mac (%)RP (MPa)
NF1262.90 ± 633.00 a1.00 ± 0.05 b68.04 ± 1.50 a40.02 ± 2.57 c28.02 ± 3.90 a0.54 ± 0.18 c
CT0201.63 ± 48.78 b1.17 ± 0.11 ab62.73 ± 3.49 ab41.18 ± 3.72 bc21.56 ± 6.84 ab0.77 ± 0.47 bc
CT455.91 ± 28.56 d1.30 ± 0.11 a58.45 ± 3.52 b45.22 ± 3.64 ab13.23 ± 6.98 b1.50 ± 0.69 ab
NT078.04 ± 18.39 cd1.29 ± 0.21 a58.71 ± 6.62 b45.57 ± 2.37 a13.14 ± 8.64 b1.53 ± 0.53 a
NT494.56 ± 7.99 c1.21 ± 0.13 a61.20 ± 4.12 b44.18 ± 2.20 abc17.02 ± 5.99 b1.18 ± 0.56 abc
NF: native forest; CT: conventional tillage; NT: no-tillage; 0: 0 Mg ha−1 of lime; 4: 4 Mg ha−1 of lime. The letters refer to the Tukey test for the comparison of means at the 95% confidence interval. Average means followed by the same letter do not differ statistically.
Table 3. Correlation between each variable and the two main components of the principal component analysis.
VariablePC1 (85.6% of Data Variability)PC2 (8.4% of Data Variability)
Bd0.9670.065
TP−0.968−0.065
Mic0.9200.136
Mac−0.992−0.096
RP0.9390.158
Ks−0.7450.665
PC1: first component; PC2: second component; Bd: bulk density; TP: total porosity; Mic: microporosity; Mac: macroporosity; RP: soil resistance to penetration; ln Ks: natural logarithm of the saturated hydraulic conductivity.
Publisher’s Note: MDPI stays neutral with regard to jurisdictional claims in published maps and institutional affiliations.

