
Soil Salinity Type Effects on the Relationship between the Electrical Conductivity and Salt Content for 1:5 Soil-to-Water Extract


 ,
,  , and
, and
Abstract
1. Introduction

2. Materials and Methods
3. Results
4. Discussion
5. Conclusions
Author Contributions
Funding
Institutional Review Board Statement
Informed Consent Statement
Conflicts of Interest
References
- Shahid, S.A. Developments in salinity assessment, modeling, mapping, and monitoring from regional to submicroscopic scales. In Developments in Soil Salinity Assessment and Reclamation—Innovative Thinking and Use of Marginal Soil and Water Resources in Irrigated Agriculture; Shahid, S.A., Abdelfattah, M.A., Taha, F.K., Eds.; Springer: Dordrecht/Heidelberg, Germany; New York, NY, USA; London, UK, 2013; pp. 3–43. [Google Scholar]
- Bresler, E.; McNeal, B.L.; Carter, D.L. Saline and Sodic Soils; Advanced Series in Agricultural Sciences; Springer: Berlin/Heidelberg, Germany, 1982; Volume 10, 236p. [Google Scholar]
- Van Straten, G.; de Vos, A.C.; Rozema, J.; Bruning, B.; van Bodegom, P.M. An improved methodology to evaluate crop salt tolerance from field trials. Agric. Water Manag. 2019, 213, 375–387. [Google Scholar] [CrossRef]
- Levy, G.J.; Mamedov, A.I.; Goldstein, D. Sodicity and water quality effects on slaking of aggregates from semi–arid soils. Soil Sci. 2003, 168, 552–562. [Google Scholar] [CrossRef]
- Rengasamy, P. Soil processes affecting crop production in salt affected soils. Funct. Plant Biol. 2010, 37, 613–620. [Google Scholar] [CrossRef]
- Egamberdieva, D.; Wirth, S.; Bellingrath-Kimura, S.D.; Mishra, J.; Arora, N.K. Salt-tolerant plant growth promoting rhizobacteria for enhancing crop productivity of saline soils. Front. Microbiol. 2019, 10, 2791. [Google Scholar] [CrossRef] [PubMed]
- Khasayev, G.A.; Madyashov, A.G. Summary of the possibilities for improving the efficiency of implementing measures for sa-line lands desalination. Taurida Sci. Herald 2018, 104, 208–219, (In Russian with English abstract). [Google Scholar]
- Azizov, G.Z. Classification of Saline Soils of Azerbaijan According to the Degree and Type of Salinity; Elm: Baku, Azerbaijan, 2002; (In Russian with English abstract). [Google Scholar]
- Ismayilov, A.; Yashar, A. Analysis of the relief role in the Kur–Araz lowland soils salinity based on GIS technology. In Proceedings of the Eurasian GIS Congress, Baku, Azerbaijan, 4–7 September 2018; pp. 294–297. [Google Scholar]
- Omuto, C.T.; Vargas, R.R.; El Mobarak, A.M.; Mohamed, N.; Viatkin, K.; Yigini, Y. Mapping of Salt–Affected Soils; Technical manual; FAO: Rome, Italy, 2020; 131p. [Google Scholar] [CrossRef]
- Hammam, A.A.; Mohamed, E.S. Mapping soil salinity in the East Nile Delta using several methodological approaches of salinity assessment. Egypt. J. Remote Sens. Space Sci. 2018, 23, 125–131. [Google Scholar] [CrossRef]
- Corwin, D.L.; Scudiero, E. Review of soil salinity assessment for agriculture across multiple scales using proximal and/or remote sensors. In Advances in Agronomy; Elsevier: Amsterdam, The Netherlands, 2019; Volume 158, pp. 1–130. [Google Scholar] [CrossRef]
- Hazelton, P.; Murphy, B. Interpreting Soil Test Results. What Do All the Numbers Mean? CSIRO Publishing: Collingwood, Australia, 2016; 200p. [Google Scholar] [CrossRef]
- Pankova, E.I.; Vorobieva, L.A.; Balyuk, S.A.; Khasankhanova, G.M.; Konyushkova, M.V.; Yamnova, I.A. Salt–affected soils of the Eurasian Region: Fdiagnostics, criteria and distribution. In Handbook for Saline Soil Management; Vargas, R., Pankova, E.I., Balyuk, S.A., Krasilnikov, P.V., Khasankhanova, G.M., Eds.; FAO: Rome, Italy, 2018; pp. 3–15. Available online: http://www.fao.org/3/I7318EN/i7318en.pdf (accessed on 10 September 2018).
- United States Salinity Laboratory. Diagnoses and Improvement of Saline and Alkali Soils; Agriculture Handbook No 60; USDA: Washington, DC, USA, 1954; 160p.
- Hogg, T.J.; Henry, J.L. Comparison of 1:1 and 1:2 suspensions and extracts with the saturation extracts in estimating salinity in Saskatchewan. Can. J. Soil Sci. 1984, 64, 699–704. [Google Scholar] [CrossRef]
- Zhang, H.; Schroder, J.L.; Pittman, J.J.; Wang, J.J.; Payton, M.E. Soil salinity using saturated paste and 1:1 soil to water extract. Soil Sci. Soc. Am. J. 2005, 69, 1146–1151. [Google Scholar] [CrossRef]
- Sonmez, J.S.; Buyuktas, D.; Okturen, F.; Citak, S. Assessment of different soil to water ratios (1:1, 1:2:5, 1:5) in soil salinity studies. Geoderma 2008, 144, 361–369. [Google Scholar] [CrossRef]
- He, Y.; DeSutter, T.; Prunty, L.; Hopkins, D.; Jia, X.; Wysocki, D. Evaluation of 1:5 soil to water extract electrical conductivity methods. Geoderma 2012, 185–186, 12–17. [Google Scholar] [CrossRef]
- Matthees, H.L.; He, Y.; Owen, R.K.; Hopkins, D.; Deutsch, B.; Lee, J.; Clay, D.E.; Reese, C.; Malo, D.D.; DeSutter, T.M. Predicting soil electrical conductivity of the saturation extract from a 1:1 soil to water ratio. Commun. Soil Sci. Plant Anaysis 2017, 48, 2148–2154. [Google Scholar] [CrossRef]
- Kargas, G.; Chatzigiakoumis, I.; Kollias, A.; Spiliotis, D.; Massas, I.; Kerkides, P. Soil Salinity Assessment Using Saturated Paste and Mass Soil:Water 1:1 and 1:5 Ratios Extracts. Water 2018, 10, 1589. [Google Scholar] [CrossRef]
- Chang, C.; Sommerfeldt, T.G.; Carefoot, J.M.; Schaalje, G.B. Relationships of electrical conductivity with total dissolved salts and cation concentration of sulfate–dominant soil extracts. Can. J. Soil Sci. 1983, 63, 79–86. [Google Scholar] [CrossRef]
- Kargas, G.; Londra, P.; Sgoubopoulou, A. Comparison of soil EC values from methods based on 1:1 and 1:5 soil to water ratios and ECe from saturated paste extract based method. Water 2020, 12, 1010. [Google Scholar] [CrossRef]
- Slavich, P.G.; Petterson, G.H. Estimating the electrical conductivity of saturated paste extracts from 1:5 soil: Water suspensions and texture. Aust. J. Soil Res. 1993, 31, 73–81. [Google Scholar] [CrossRef]
- Vaughn, P.J.; Lesch, S.M.; Corwin, D.L.; Cone, D.G. Water content effect on soil salinity prediction: A geostatistical study using cokriging. Soil Sci. Soc. Am. J. 1995, 59, 1146–1156. [Google Scholar] [CrossRef]
- Shirokova, Y.I.; Forkutsa, I.; Sharafutdinova, N. Use of electrical conductivity instead of soluble salts for soil salinity monitoring in Central Asia. Irrig. Drain. Syst. 2000, 14, 199–205. [Google Scholar] [CrossRef]
- Khorsandi, F.; Yazdi, F.A. Gypsum and texture effects on the estimation of saturated paste electrical conductivity by two extraction methods. Commun. Soil Sci. Plant Anal. 2007, 38, 1105–1117. [Google Scholar] [CrossRef]
- Chi, M.C.; Wang, Z.C. Characterizing salt affected soils of Songnen Plain using saturated paste and 1:5 soil to water extraction methods. Arid Land Res. Manag. 2010, 24, 1–11. [Google Scholar] [CrossRef]
- Visconti, F.; de Paz, J.M.; Rubio, J.L. What information does the electrical conductivity of soil water extracts of 1 and 5 ratio (w/v) provide for soil salinity assessment of agricultural irrigated lands? Geoderma 2010, 154, 387–397. [Google Scholar] [CrossRef]
- He, Y.; DeSutter, T.; Hopkins, D.; Jia, X.; Wysocki, D. Predicting ECe of the saturated paste extract from value of EC1:5. Can. J. Soil Sci. 2013, 93, 585–594. [Google Scholar] [CrossRef]
- Hassannia, M.; Nazari, B.; Kaviani, A.; Sotoodehni, A. Evaluation and analysis of different regression models for estimation of ECe from EC1:5—with a case study from Buin-Zahra, Iran. Irrig. Drainage 2020, 69, 1192–1203. [Google Scholar] [CrossRef]
- Zaman, M.; Shahid, S.A.; Heng, L. Guideline for Salinity Assessment, Mitigation and Adaptation Using Nuclear and Related Techniques; Springer Open: Cham, Switzerland, 2018; 164p. [Google Scholar]
- Zhang, F.; Tiyip, T.; Ding, J.; Taff, G.N.; He, Q. The effects of the chemical components of soil salinity on electrical conductivity in the region of the delta oasis of Weigan and Kuqa Rivers, China. Agric. Sci. China 2009, 985–993. [Google Scholar] [CrossRef]
- Dierickx, W.R. The salinity and alkalinity status of arid and semi–arid lands. In Land Use Land Cover and Soil Science; Verheye, W., Ed.; EOLSS Publisher: Oxford, UK, 2011; pp. 163–189. [Google Scholar]
- Marion, G.M.; Babcock, K.L. Predicting specific conductance and salt concentration in dilute aqueous solutions. Soil Sci. 1976, 122, 181–187. [Google Scholar] [CrossRef]
- Letey, J.; Hoffman, G.J.; Hopmans, J.W.; Grattan, S.R.; Suarez, D.; Corwin, D.L.; Oster, J.D.; Wu, L.; Amrhein, C. Evaluation of soil salinity leaching requirement guidelines. Agric. Water Manag. 2011, 98, 502–506. [Google Scholar] [CrossRef]
- Khorsandi, F.; Yazdi, F.A. Estimation of saturated paste extracts’ electrical conductivity from 1:5 soil/water suspension and gypsum. Commun. Soil Sci. Plant Anal. 2011, 42, 315–321. [Google Scholar] [CrossRef]
- Methods of Soil Analysis, 2nd ed.; Agronomy Monograph 9; ASA and SSSA: Madison, WI, USA, 1986.
- SAS Institute. SAS User’s Guide; Version 9.2.; SAS Institute: Cary, NC, USA, 2008. [Google Scholar]
- Cui, G.; Lu, Y.; Zheng, C.; Liu, Z.; Sai, J. Relationship between soil salinization and groundwater hydration in Yaoba Oasis, Northwest China. Water 2019, 11, 175. [Google Scholar] [CrossRef]
- Van der Zee, S.E.A.T.M.; Shah, S.H.H.; Vervoort, R.W. Root zone salinity and sodicity under seasonal rainfall due to feedback of decreasing hydraulic conductivity. Water Resour. Res. 2014, 50, 9432–9446. [Google Scholar] [CrossRef]
- Corwin, D.L.; Yemoto, K. Measurement of soil salinity: Electrical conductivity and total dissolved solids. Soil Sci. Soc. Am. J. 2019, 83, 2558–2574. [Google Scholar] [CrossRef]
- Levy, G.J.; Goldstein, D.; Mamedov, A.I. Saturated hydraulic conductivity of semi-arid soils: Combined effects of salinity, sodicity and rate of wetting. Soil Sci. Soc. Am. J. 2005, 69, 653–662. [Google Scholar] [CrossRef]
- Tang, S.; She, D.; Wang, H. Effect of salinity on soil structure and soil hydraulic characteristics. Can. J. Soil Sci. 2020. [Google Scholar] [CrossRef]


| Classification | ECe dS m−1 | Crop Yield | EC (1:5) dS m−1 | Number of Samples EC 1:5 |
|---|---|---|---|---|
| Non-saline | 0–2 | not affected | 0.0–0.25 | 253 |
| Slightly saline | 2–4 | sensitive crop affected | 0.25–0.5 | 290 |
| Saline (moderate) | 4–8 | many crops affected | 0.5–1.0 | 170 |
| Strongly saline | 8–16 | only tolerant crops | 1.0–2.0 | 101 |
| Extremely saline | >16 | a few very tolerant crops | >2.0–3.0 | 286 |
| Salinity Type | Salinity, % | ||||||
|---|---|---|---|---|---|---|---|
| Type | Ion Ratios | pH | Non | Slight | Moderate | Strong | Very Strong |
| Chloride (Cl) Sulfate–Chloride (SO4–Cl) | Cl:SO4 > 1 | <8.5 neutral | <0.05 | 0.05–0.12 | 0.12–0.35 | 0.35–0.7 | >0.7 |
| Chloride–Sulfate (Cl–SO4) | Cl:SO4 = 0.2–1.0 | <8.5 neutral | <0.10 | 0.10–0.25 | 0.25–0.50 | 0.50–1.0 | >1.0 |
| Sulfate (SO4) | Cl:SO4 < 0.2 | <8.5 neutral | <0.15 | 0.15–0.30 | 0.30–0.60 | 0.60–1.5 | >1.5 |
| Chloride–Soda (Cl–HCO3) Soda–Chloride (HCO3–Cl) | Cl:SO4 > 1, HCO3: Cl >1 HCO3 > Ca+Mg | >8.5 alkaline | <0.10 | 0.10–0.15 | 0.15–0.30 | 0.30–0.5 | >0.5 |
| Sulfate–Soda (SO4–HCO3) Soda–Sulfate (HCO3–SO4) | Cl:SO4 < 1; HCO3: Cl >1 HCO3 > Ca+Mg | >8.5 alkaline | <0.15 | 0.15–0.25 | 0.25–0.40 | 0.40–0.6 | >0.6 |
| Salinity Type | Number of Samples | pH | Salinity Range | EC = a TSS | TSS = a EC | |||
|---|---|---|---|---|---|---|---|---|
| TSS % | EC 1:5 dS m−1 | a | R2 p < 0.001 | a | R2 p < 0.001 | |||
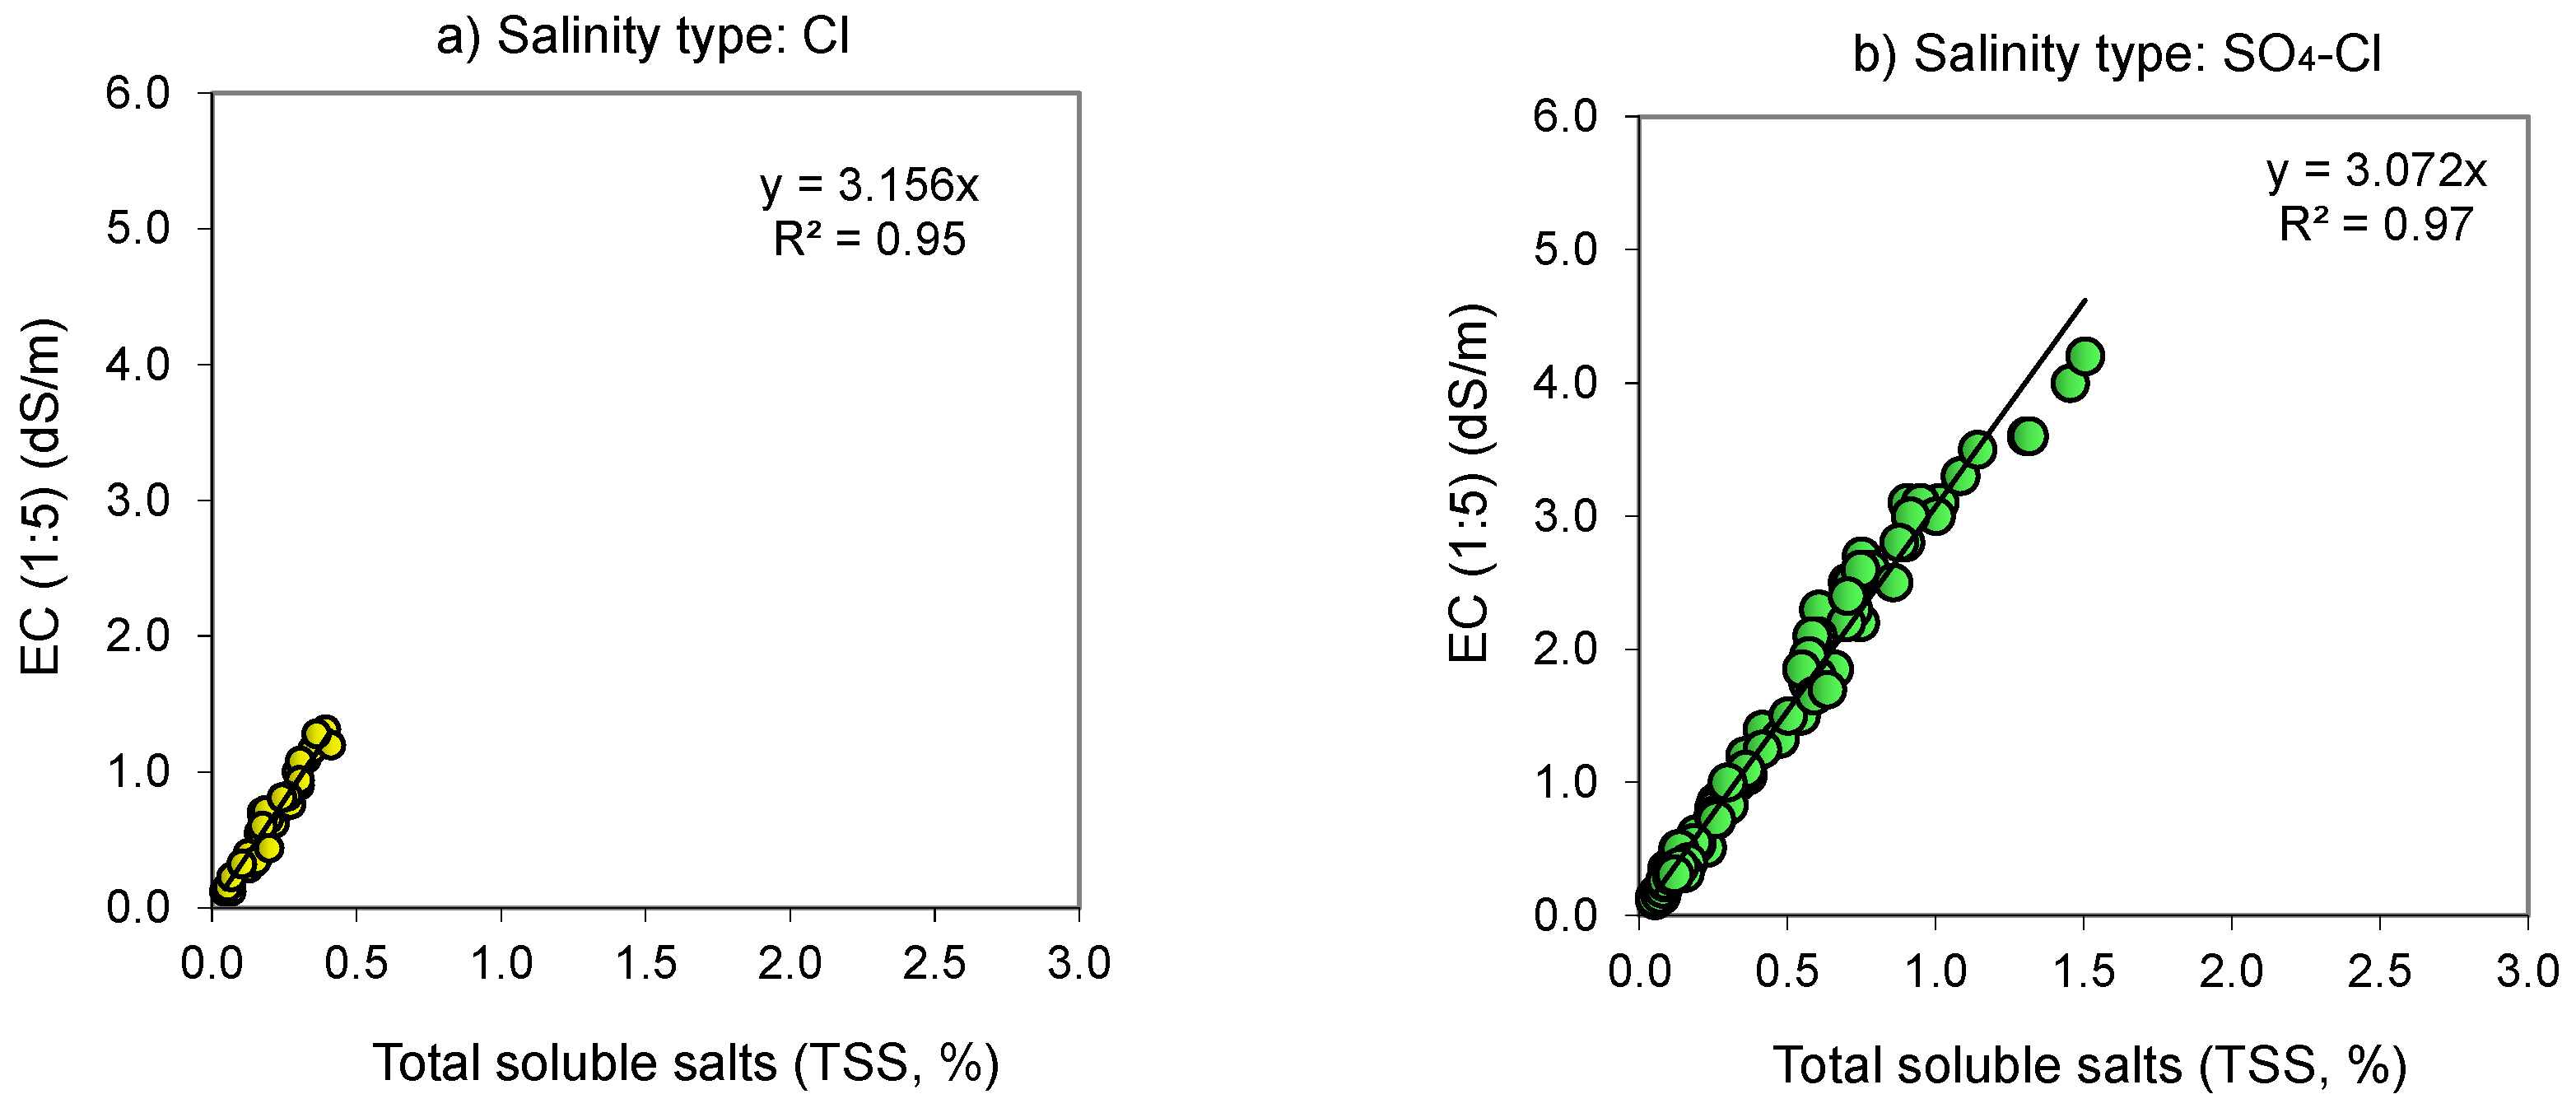
| Cl | 32 | <8.5 | 0.044–0.414 | 0.120–1.20 | 3.156 a | 0.95 | 0.313 e | 0.94 |
| SO4–Cl | 96 | <8.5 | 0.050–1.504 | 0.135–4.20 | 3.072 ab | 0.97 | 0.323 e | 0.97 |
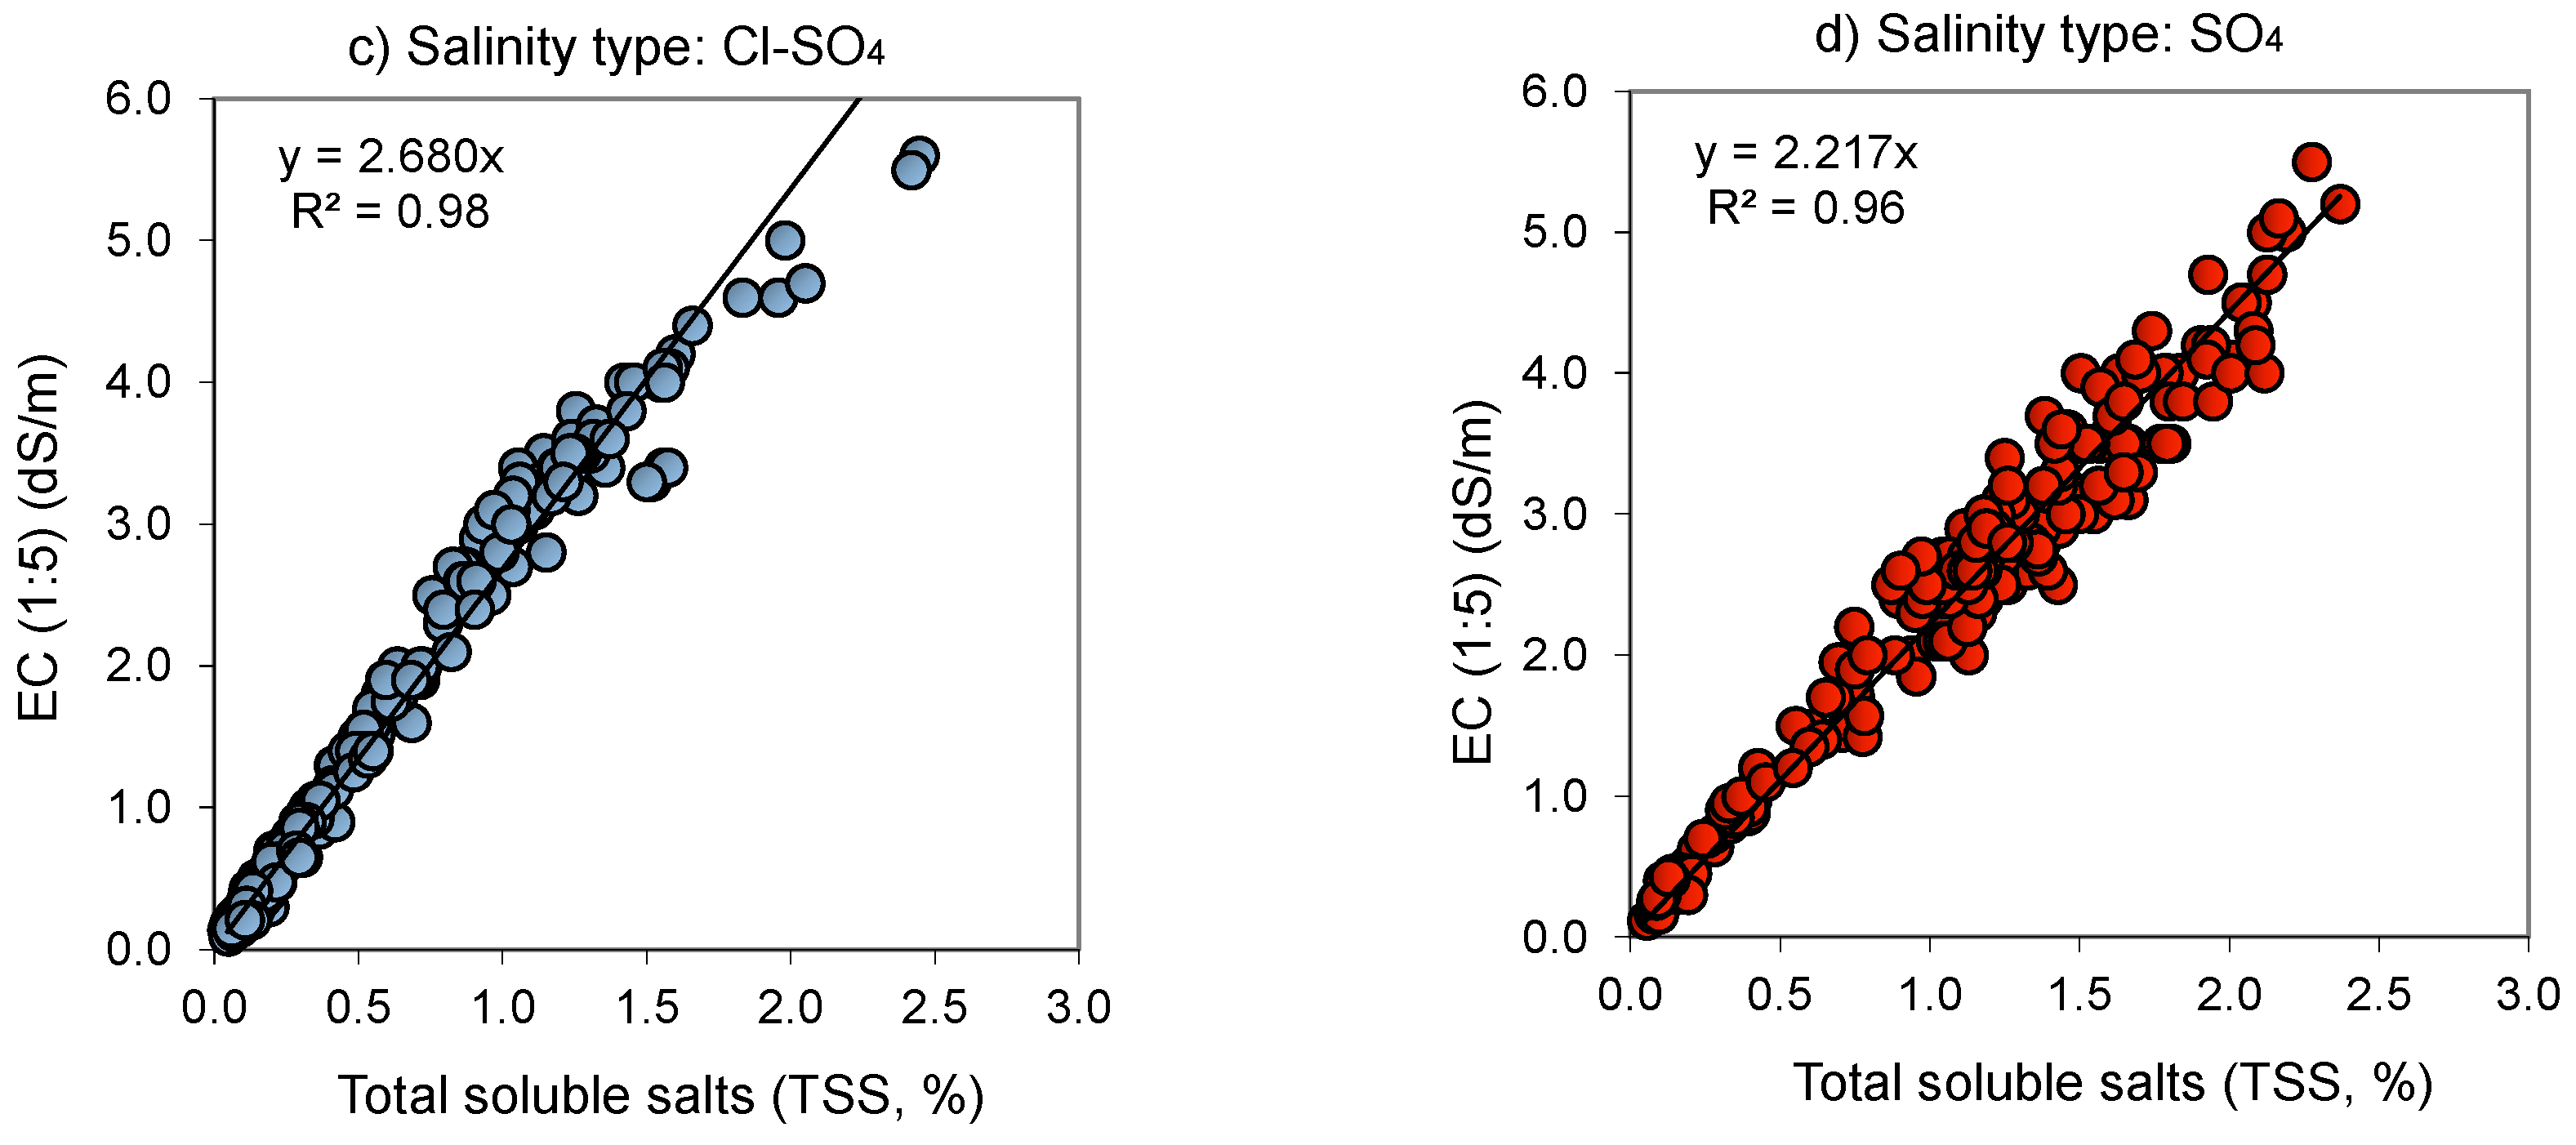
| Cl–SO4 | 390 | <8.5 | 0.046–2.448 | 0.140–5.60 | 2.680 c | 0.98 | 0.369 d | 0.98 |
| SO4 | 246 | <8.5 | 0.054–2.369 | 0.115–5.20 | 2.217 e | 0.96 | 0.447 a | 0.96 |
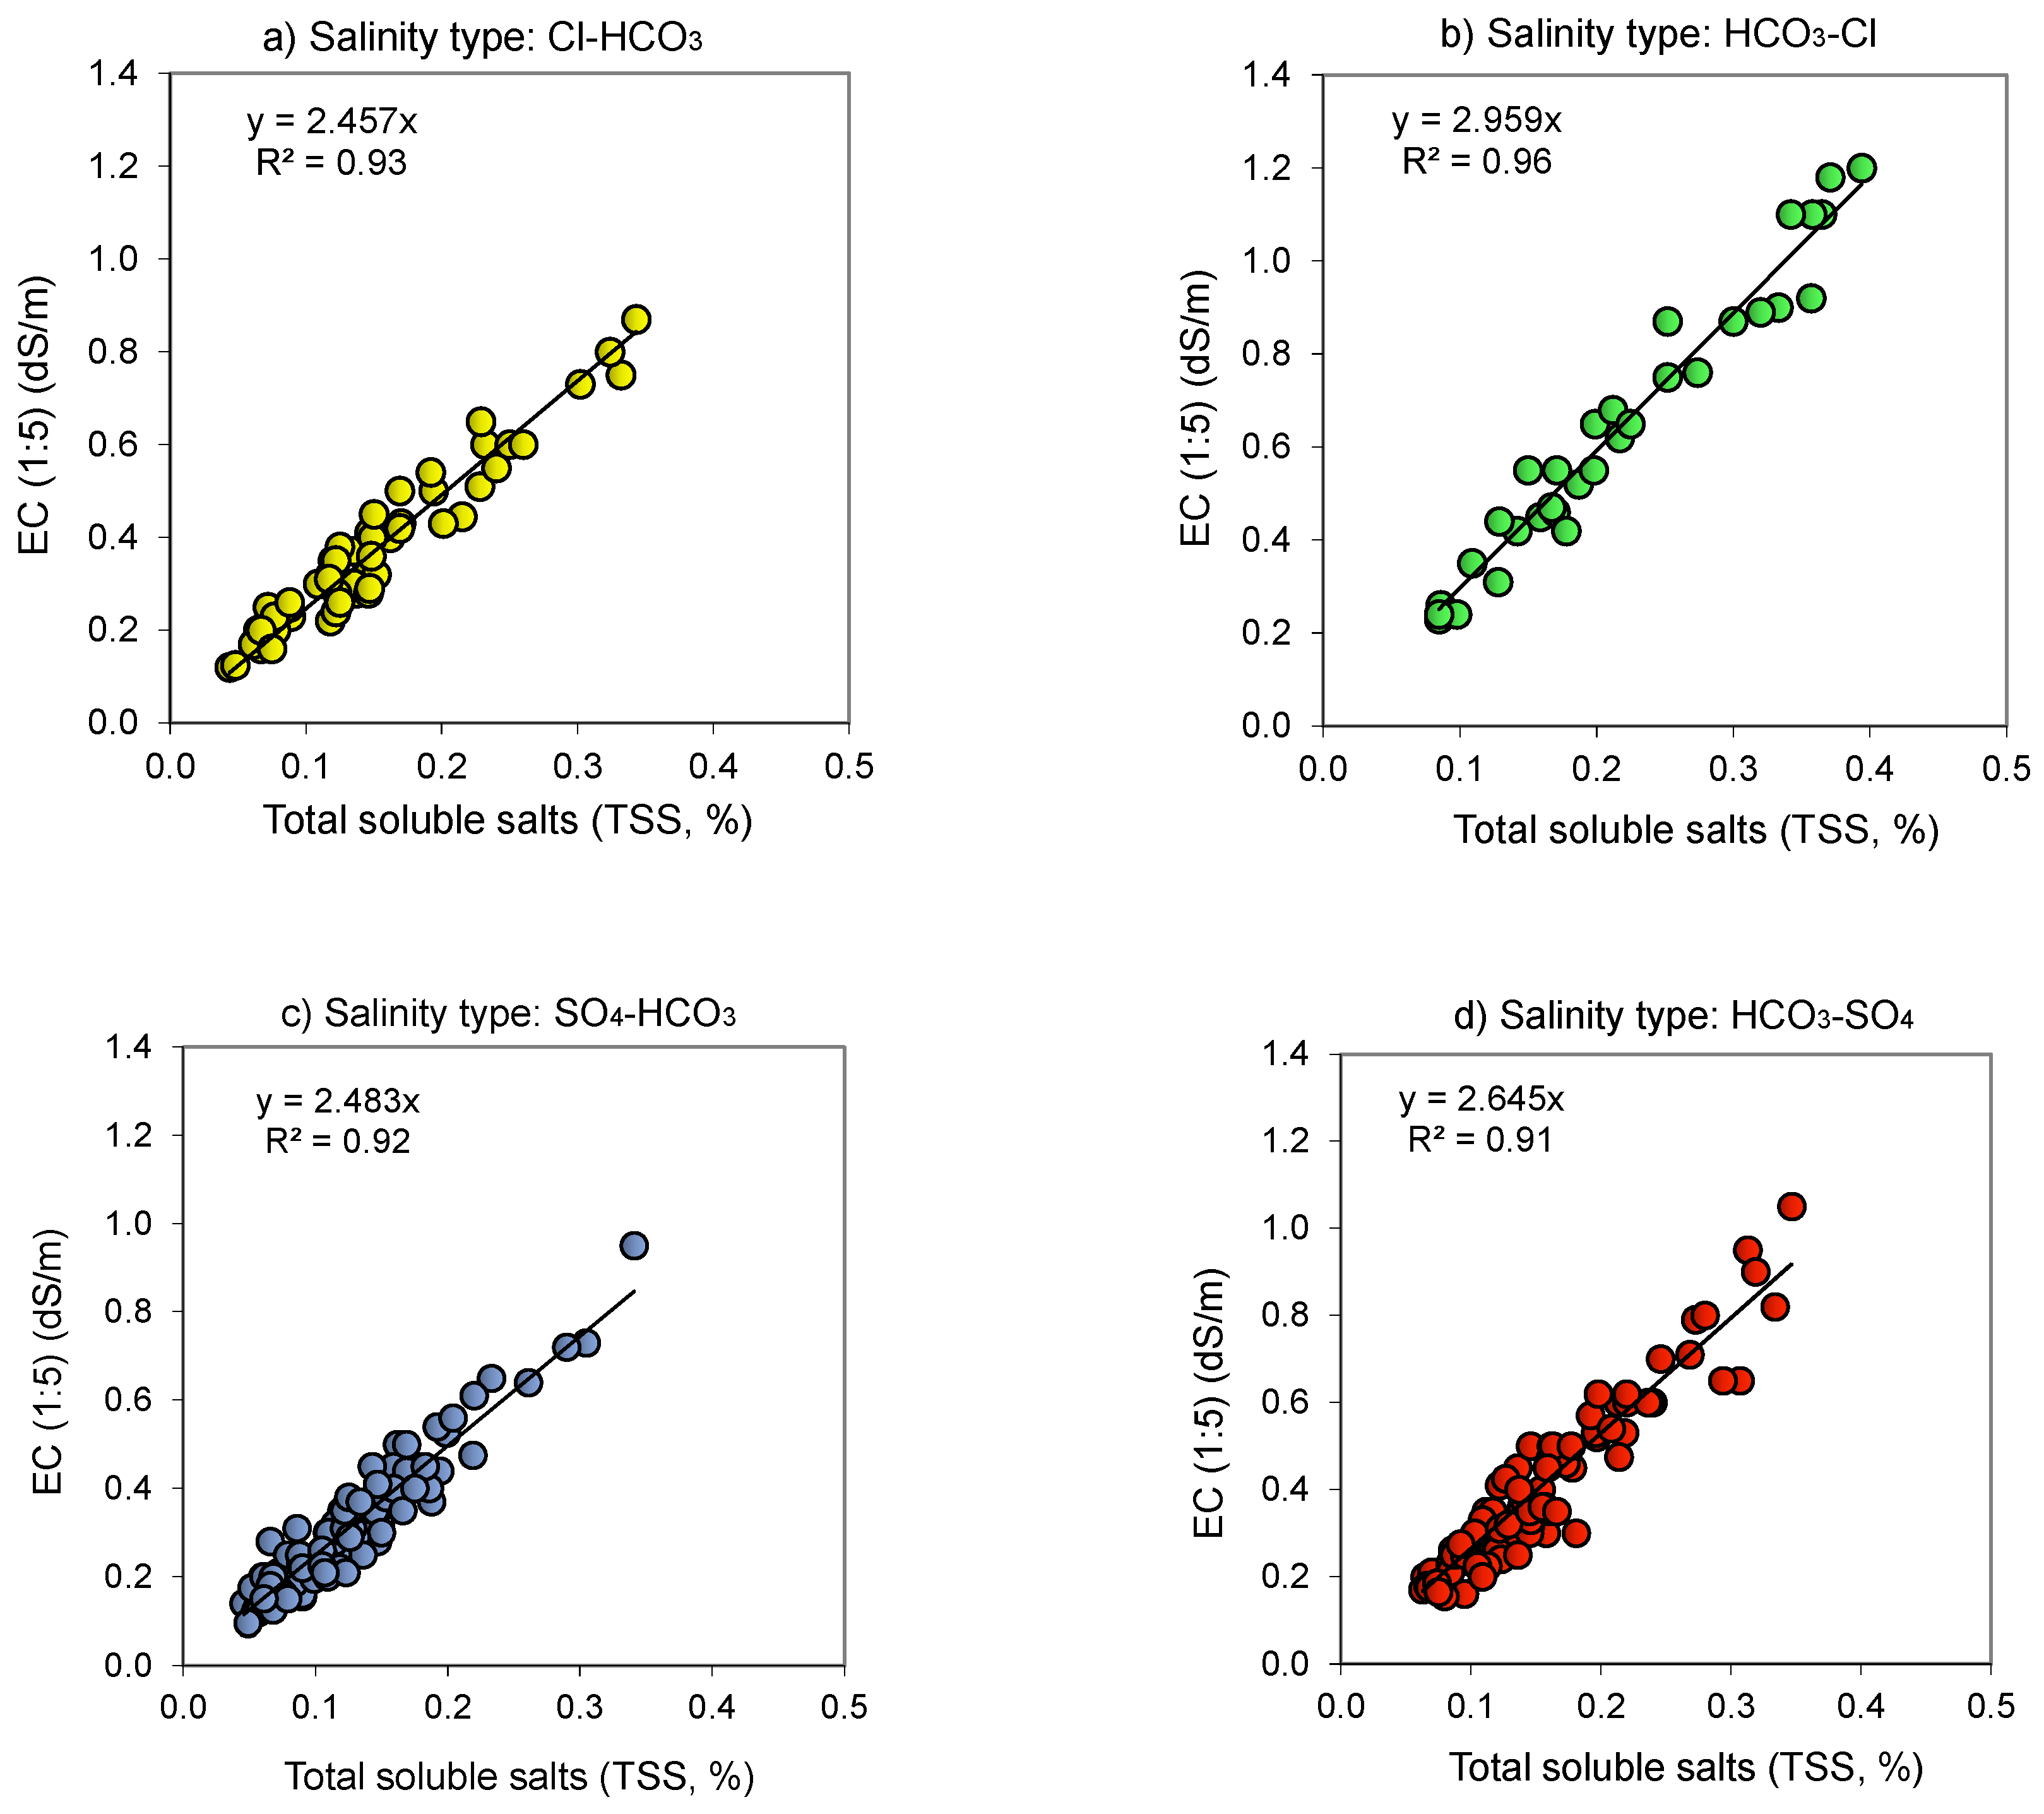
| Cl–HCO3 | 56 | >8.5 | 0.044–0.343 | 0.120–0.87 | 2.457 d | 0.93 | 0.402 b | 0.93 |
| HCO3–Cl | 32 | >8.5 | 0.085–0.394 | 0.230–1.20 | 2.959 b | 0.96 | 0.336 e | 0.95 |
| SO4–HCO3 | 144 | >8.5 | 0.046–0.341 | 0.140–0.95 | 2.483 d | 0.92 | 0.396 c | 0.91 |
| HCO3–SO4 | 104 | >8.5 | 0.063–0.347 | 0.170–1.05 | 2.645 c | 0.91 | 0.371 d | 0.91 |
| All | 1100 | 0.044–2.448 | 0.115–5.60 | 2.401 d | 0.96 | 0.408 b | 0.96 | |
Publisher’s Note: MDPI stays neutral with regard to jurisdictional claims in published maps and institutional affiliations. |
© 2021 by the authors. Licensee MDPI, Basel, Switzerland. This article is an open access article distributed under the terms and conditions of the Creative Commons Attribution (CC BY) license (http://creativecommons.org/licenses/by/4.0/).
Share and Cite
Ismayilov, A.I.; Mamedov, A.I.; Fujimaki, H.; Tsunekawa, A.; Levy, G.J. Soil Salinity Type Effects on the Relationship between the Electrical Conductivity and Salt Content for 1:5 Soil-to-Water Extract. Sustainability 2021, 13, 3395. https://doi.org/10.3390/su13063395
Ismayilov AI, Mamedov AI, Fujimaki H, Tsunekawa A, Levy GJ. Soil Salinity Type Effects on the Relationship between the Electrical Conductivity and Salt Content for 1:5 Soil-to-Water Extract. Sustainability. 2021; 13(6):3395. https://doi.org/10.3390/su13063395
Chicago/Turabian StyleIsmayilov, Amin I., Amrakh I. Mamedov, Haruyuki Fujimaki, Atsushi Tsunekawa, and Guy J. Levy. 2021. "Soil Salinity Type Effects on the Relationship between the Electrical Conductivity and Salt Content for 1:5 Soil-to-Water Extract" Sustainability 13, no. 6: 3395. https://doi.org/10.3390/su13063395
APA StyleIsmayilov, A. I., Mamedov, A. I., Fujimaki, H., Tsunekawa, A., & Levy, G. J. (2021). Soil Salinity Type Effects on the Relationship between the Electrical Conductivity and Salt Content for 1:5 Soil-to-Water Extract. Sustainability, 13(6), 3395. https://doi.org/10.3390/su13063395