Article

Public Acceptability of Low Emission Zones: The Case of “Madrid Central”

by
Javier Tarriño-Ortiz
*,
Julio A. Soria-Lara
,
Juan Gómez
and
José Manuel Vassallo
Transport Research Centre, TRANSyT, Universidad Politécnica de Madrid, 28040 Madrid, Spain
*
Author to whom correspondence should be addressed.
Sustainability 2021, 13(6), 3251; https://doi.org/10.3390/su13063251
Submission received: 24 February 2021 / Revised: 12 March 2021 / Accepted: 13 March 2021 / Published: 16 March 2021

Abstract

:
Cities have intensified the adoption of Low Emission Zones (LEZs) to improve urban livability. Despite the high social controversy caused by LEZs in many cities, the scientific literature has paid little attention to study their public acceptability. This paper conducts a modelling approach exploring the impact of four groups of variables on the public acceptability of LEZs: (i) socio-economic and demographic characteristics; (ii) personal attitudes; (iii) travel-related variables; and (iv) perceptions and mobility habits linked to LEZs. The city of Madrid, Spain, is a case study of great interest because a LEZ called “Madrid Central” has been recently implemented. A total of 799 individual questionnaires were used to calibrate an ordered logit model. Results indicate that socio-economic and demographic variables are weakly related to the level of public acceptability towards the LEZ. On the contrary, the political ideology of individuals, their environmental awareness, their primary transport mode, the use of shared mobility systems, and the frequency of access to “Madrid Central” have a higher explanatory power. The results may be useful for policy-makers to understand the factors that increase the public acceptability of LEZs.

1. Introduction

Despite the fact that sustainable mobility has been prioritized in the planning agendas of many cities (Banister 2008; Schwanen et al., 2011) [1,2], the academic interest to understand the link between air quality and transport seems now stronger than ever. That not only reflects a growing concern on the challenge that transport air pollution poses to society, but also reveals the conflict of maximizing the benefits of mobility while reducing its environmental impacts (Polichetti, 2017; Ramos et al., 2017) [3,4]. To address this particular issue, many cities (e.g., Sao Paulo, Beijing, México City, Paris, London, and Berlin) have opted for implementing Low Emission Zones (LEZs), to constrain the use of combustion-based cars in favor of electric vehicles, collective and active modes (Zainol et al., 2014; Szarata et al., 2017) [5,6].
The implementation of LEZs in the European context mainly responds to requirements from the EU urban agenda and its legal framework. The European Environment Agency has set annual emission limits for certain air pollutants (https://www.eea.europa.eu/es/senales/senales-2013/articulos/la-legislacion-europea-en-relacion accessed on 10 March 2021), while EU member states are responsible for safeguarding these emission thresholds. Specific emissions standards for road pollutants have been established at the European context (e.g., PM and NOX), triggering urban transit restrictions implemented by local authorities according to the type of vehicle (from Euro I to Euro VI). Those car traffic restrictions seem suitable tools to achieve livable, walkable, and healthy cities, but their effectiveness and feasibility is also linked to high social controversy generated when they are implemented (Soria-Lara et al., 2019) [7].
The adoption of LEZs depends on cultural norms, legal systems, and air quality objectives (Alduán, 2014; Holman et al., 2015) [8,9]. LEZs are traditionally based on applying a set of specific policies that limit car access, such as restrictions by license-plate, charges to motor vehicles, time-slot limitations, car-sharing promotion, etc. Those policies have a great impact on the environment, economics, and society, with important effects on individuals’ mobility patterns. Not only the modal choice tends to shift towards collective and active modes (Ahanchian et al., 2019) [10], but cities become more attractive for visitors, pedestrians, and cyclists (Sandahl and Lindh, 1995; Soni and Soni, 2016) [11,12]. Although the implementation of LEZs strongly affects individuals’ daily life thereby prompting social controversy, very limited attention has been paid to study how acceptability levels of LEZs vary between population groups and why. Predominant studies focus on the need for social acceptability of specific transport policies such as, e.g., road charging (Ison and Rye, 2005; Gaunt et al., 2007; Gu et al., 2018) [13,14,15], but no attention is usually paid to LEZs.
Previous research on LEZs has mostly focused on examining both their environmental impacts (Lutz, 2009; Ellison et al., 2013; Ferreira et al., 2015) [16,17,18], and possible changes on the individuals’ daily life (Ahanchian et al., 2019; Pronello and Camusso, 2011) [10,19]. Bridging the research gap of studying social acceptability of LEZs will help practitioners and policy-makers to achieve a better understanding of how LEZs could be easily implemented. On the contrary, if no attention is paid to acceptability issues, social controversy related to LEZs could increase, thereby limiting their effectiveness and positive impacts on cities.
To respond to those important issues, this paper aims to identify key variables explaining the public acceptability of LEZs. A total of four groups of variables are analyzed concerning: (i) socio-economics and demography; (ii) personal attitudes; (iii) travel-related variables; and (iv) perceptions and mobility habits linked to LEZs. The city of Madrid, Spain serves as case study. In 2018, a LEZ called “Madrid Central” was implemented, covering an area of 5 km2 and generating a high level of social controversy. An individual-level survey was disseminated by the authors of the paper after the implementation “Madrid Central” to obtain information about the four groups of variables outlined above as well as individuals’ mobility habits before and after the adoption of “Madrid Central”. The survey collected 799 valid responses. The information gathered is used to calibrate an ordered logit model to determine the influence of the four groups of variables (predictors) on the level of public acceptability of “Madrid Central” (target). The level of individual acceptability is measured through a five-point Likert-scale (1—Very negative, 5—Very positive).
The remainder of the paper is structured as follows. Section 2 outlines the literature review, and summarizes different approaches used to assess the effects originated by LEZs. Section 3 presents the case study, while Section 4 details the data gathering process and the sample characteristics. Section 5 describes the ordered logit methodology adopted. Section 6 shows the main results. Finally, Section 7 closes the paper with concluding remarks and further research inquiries.

2. Literature Review: The Effects of LEZs

Previous research works have used different approaches to study the effects of LEZs. A first group of studies conducts ex ante and ex post evaluations of the impacts of LEZs on air quality. A second group uses ex ante models to predict changes related to individuals´ daily life (e.g., mobility habits, social relationships, etc.) prompted by the implementation of LEZs or similar policy schemes (e.g., traffic restrictions, and pedestrianization).
Within the first group of the reviewed studies, Duque et al. (2016) [20] evaluate a set of strategies to reduce air pollution in the Porto’s LEZ using a numerical modelling tool. Their results show that the LEZ has local benefits associated to reductions of 3% of NO2 concentration, while no reductions on PM concentrations are noticed. Similarly, Dias et al. (2012) [21] develop an integrated modelling approach to assess air quality impacts of a LEZ in Coimbra, Portugal. The authors found a small improvement of air quality within the LEZ, having difficulties to reach the air quality targets. Moreover, they observed that the expected emissions at the city level could increase due to the reconfiguration of mobility patterns. Another study worth mentioning was conducted by Boogaard et al. (2012) [22] in several Dutch cities. Their conclusions show the low capacity of LEZs to produce significant reductions in car pollution. Other authors highlight the impact of LEZs on the vehicle fleet renewal worldwide (e.g., Berlin, London, and Lisbon), triggering technological advances that reduce emissions per vehicle and improve air quality (Lutz, 2009; Ellison et al., 2013; Ferreira et al., 2015) [16,17,18]. Finally, the study conducted by Holman et al. (2015) [9] across different European cities, points out the difficulties to distinguish between the effects caused by a LEZ on air quality and those effects prompted by other policy measures (e.g., fleet renewal). York and Rouleau (2017) [23] noted that there is limited evidence on the effects of LEZs on air quality.
The second group of studies focuses on predicting changes in daily life prompted by the implementation of LEZs and similar policy schemes, using data collected through individual questionnaires. For example, Ahanchian et al. (2019) [10] developed an agent-based model to predict the modal behavior and modal choice of travelers in Denmark. The authors explore different scenarios similar to LEZs (expansion of public infrastructure, incentives for sustainable modes, and disincentives for private cars) to improve air quality. The results show an increase in the use of public transport and bicycles, and a decrease in the use of private vehicles and walking. Variations in mobility behavior are also studied by Pronello and Camusso (2011) [19] in Alessandria (Italia). They conducted statistical analysis to correlate socio-demographics and frequent trips under the context of hypothetical policies that would improve air quality (e.g., road pricing). Finally, de Groot and Steg (2006) [24] developed an ex ante agent-based model that examined how a transport pricing policy may affect different individual’s daily aspects (comfort, security, economy, health, leisure time, and social relationships). The study shows variations in the willingness to change car use across different countries.
This research adds to the literature an ex post evaluation of the public acceptability towards the implementation of a LEZ, applied to the case of Madrid. As an innovative aspect, the evaluation includes as predictors a set of variables related to individual perceptions and mobility habits linked to “Madrid Central”, including socioeconomics and demography, personal attitudes, and travel-related variables. A better understanding of variables affecting the public acceptability level of LEZ will provide policy-makers with potential solutions to increase their successful implementation.

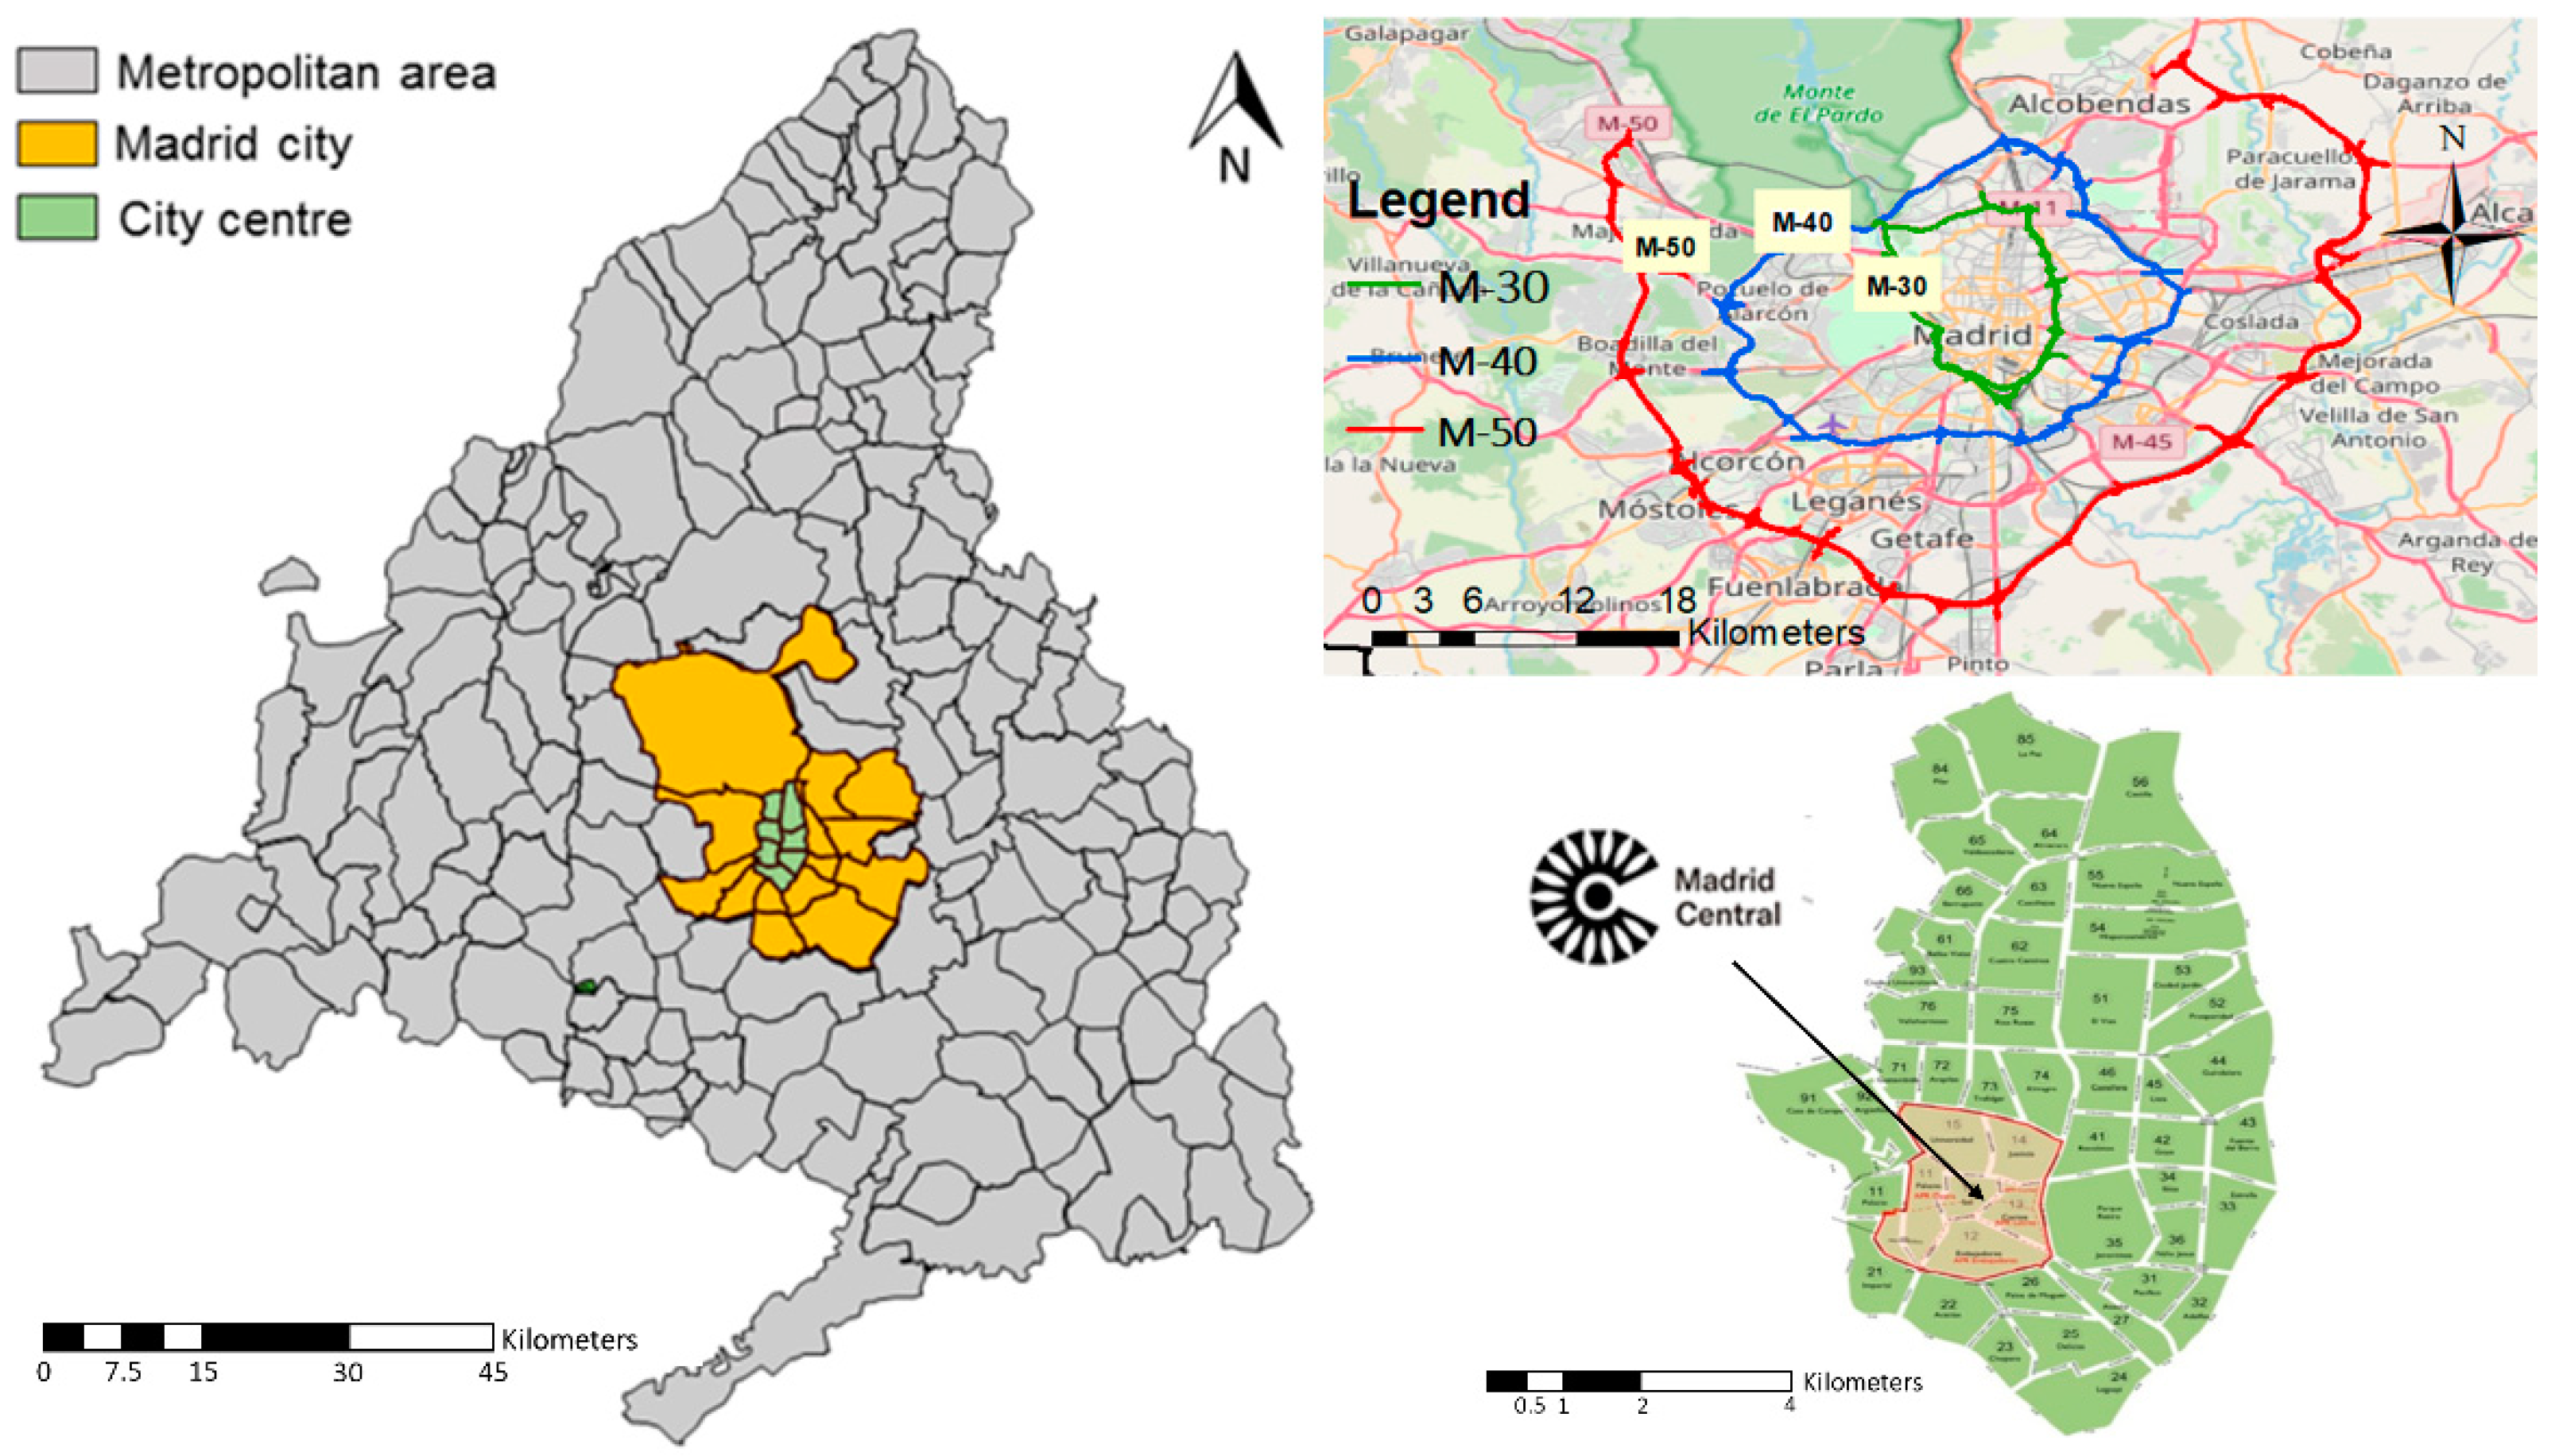
3. Case Study: “Madrid Central” LEZ

The city of Madrid, Spain has an area of 605 km2 and a population over 3 million inhabitants (5300 inhabitants/km2). It is a compact city with a high population density. The city of Madrid has experienced a rapid suburbanization process, being expanded through its metropolitan area (8022 km2 and 6.5 million inhabitants). Nowadays, the city of Madrid provides the widest job offer, retail, and leisure activities among the municipalities located in its metropolitan area, generating a strong interdependency with their surrounding towns. For instance, only Madrid city concentrates 60% of the regional GDP.
The latest mobility survey (Monzón et al., 2019) [25] indicates a total of 2.3 million trips on a working day within the metropolitan area of Madrid. The modal split shows a predominant use of private vehicles including cars and motorcycles (57.8%), while the use of public transport covers 36.9% of those trips, and non-motorized transport modes (bicycle and walking) reaches 3.8%. A different modal split is observed within Madrid City, where the relevance of collective transport systems and non-motorized modes goes up to 37.8% and 36.8%, respectively. On the contrary, the use of private vehicles for intra-city trips is 24.7%.
The metropolitan area of Madrid has an extensive road transport network, including ten main highways. In particular, there are three main beltways around Madrid City (M-30, M-40, and M-50) connecting different municipalities within its metropolitan area (Figure 1). These beltways typically define, in practical terms, the different geographical areas within the metropolitan area of Madrid.
The existing public transport network is based on an integrated system, consisting of collective buses, sub-urban rail, and metro services. For the setting of public transport fares, both the city of Madrid and its metropolitan area are divided into eight transport zones. For each one of these zones, the transport authority offers three types of tickets: single ticket, ten-trip ticket, and a public transport pass, which allows unlimited use of collective transport for one month/year. That collective transport pass is widely used among regular travelers, reaching 3.6 million of users. Moreover, discounted prices in the collective transport pass exist for young users (<26 years), seniors (>65 years), larger families, and disabled people.
Road traffic produces 74.4% of local emissions in the city (Ayuntamiento de Madrid, 2017) [26]. The highest levels of NOx and PM concentration are found in the city center, with annual average values close to 50 μg/m3 and 25 μg/m, respectively, partly due to intense level of car traffic experienced. Since 2011, the air quality limits established by the EU have been exceeded during several episodes, particularly for NOX and O3. The unfavorable weather conditions of Madrid City (temperature inversion) make difficult to remove those pollutants from the city atmosphere, especially during the fall and winter. To address this problem, Madrid local government developed an air quality plan called “Plan A” (2017), being the implementation of a Low Emission Zone one of the most prominent policy schemes of the Plan. Such LEZ was labelled as “Madrid Central” (Figure 1).
“Madrid Central”, implemented on 30 November 2018, covers an area of 5 km2 in the center of Madrid City. This is a place with the greatest accessibility levels from elsewhere. “Madrid Central” is reached by a total 70 bus lines, 4 metro lines, 57 bike-sharing stations, 27 taxi stands, and 5946 underground parking spaces. It is aimed at improving air quality and promoting a city center more friendly for pedestrians, cyclists, neighbors, and visitors. Traffic restrictions for private vehicles depend on a labelling system according to the engine type (Zero, Eco, C, B or A; from the lowest to the highest polluting levels). The characteristics of the vehicle fleet in Madrid and its metropolitan area are shown in Table 1.
Private vehicles are limited to access and/or park to/in “Madrid Central” depending on their label (Table 2). Restrictions for motorcycles are lower than for private vehicles. Some exceptions exist for residents, disabled people, and security and emergency vehicles. For example, residents have a maximum of 20 invitations a month for guests to get to “Madrid Central”. To expand modal choice options in “Madrid Central”, the City Council has promoted a bike-sharing system (BiciMad), as well as shared mobility services comprising electric cars, mopeds, and kick scooters.
“Madrid Central” was one of the flagships policy measures implemented by the former mayor of the city, who was supported by a coalition of left-wing parties. The implementation of the measure raised great controversy in the political debate and across the general public both before and after its implementation. The disputes were mostly about the effectiveness of the measure to reduce pollution, and its impact on commuters and retail services within the zone. The right-wing coalition governing the city since May 2019, has established a new mobility plan, called “Madrid 360”, which basically maintains the previous LEZ with few small changes in its operation and functioning.

4. The Data: An Individual-Level Survey

4.1. Data Gathering

A modelling-based approach is used to address the main objective of this research, namely identifying key variables explaining the public acceptability of “Madrid Central”. The main data source was an individual online survey collecting different types of variables at the individual level: socio-economic and demographical, personal attitudes, travel-related variables, perceptions, and mobility habits linked to “Madrid Central”, and individual level of acceptability towards “Madrid Central”. A pilot survey was tested with a small group of people. Their responses provided the research team with input to refine the survey´s design (e.g., readability), adding new questions when necessary. The final online survey was disseminated among citizens of Madrid and its metropolitan area from January to June 2019. The dissemination plan included social networks, specialized websites, and on-street dissemination of flyers indicating the purpose of the research. The latter was intended to include adequate heterogeneity in the sample in terms of individual socio-demographics, given the limitations of online dissemination to capture all population segments. A total of 1300 people filled out the questionnaire. In the end we obtained 799 valid responses. The survey consisted of the following five main blocks (Table 3):
(i)
Socioeconomics and demography of individuals, such as gender, age, level of education, monthly income, and ZIP code of residence.
(ii)
Personal attitudes, collecting information on individual beliefs and ideology, including economic, social, and environmental awareness.
(iii)
Travel-related variables affecting daily travel, such as individual possession of driver license or transit pass, private vehicle availability, and frequency of use of different transport modes (collective transport, and shared mobility services).
(iv)
Individual perceptions and mobility habits linked to the implementation of “Madrid Central”: trip frequency to access “Madrid Central”, main activities carried out within this area, transport modes chosen to access/leave “Madrid Central” before and after the implementation of the LEZ, and perception of “Madrid Central” as a pedestrian.
(v)
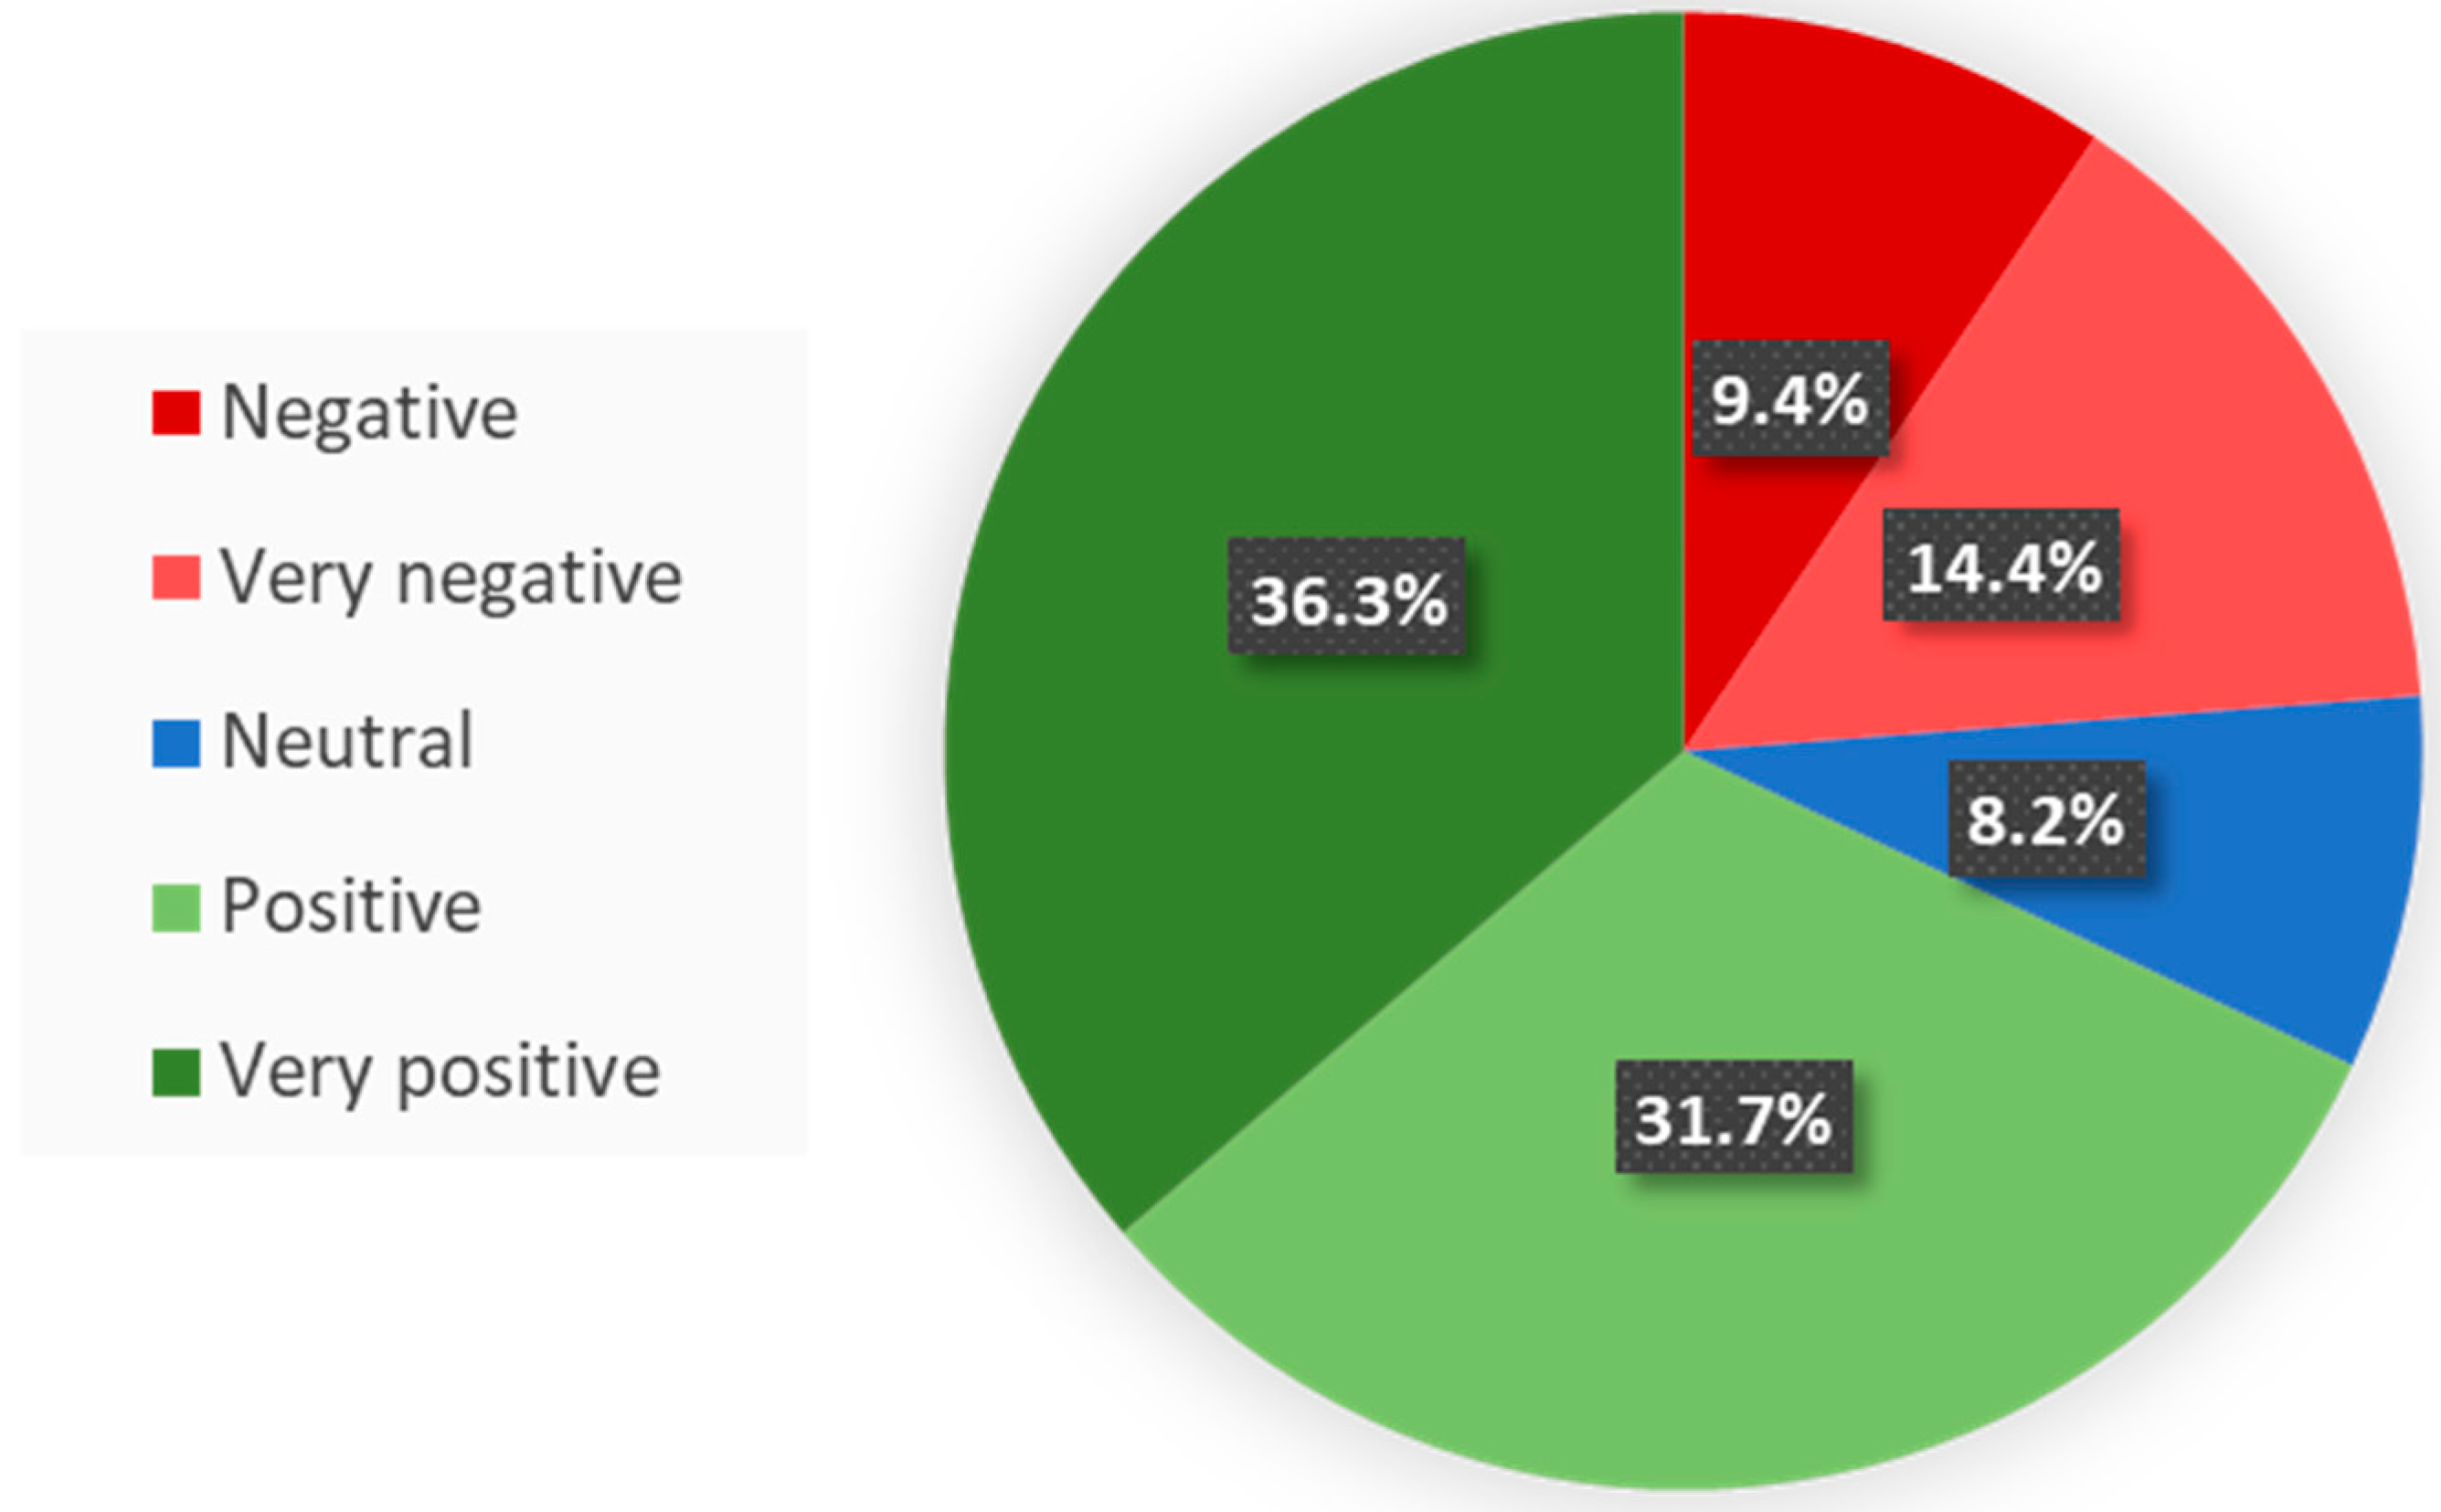
Individual level of acceptability of “Madrid Central”. This block includes the dependent variable for this research. Respondents showed their individual level of acceptability using a five-point Likert-scale (1—Very negative, 2—Negative, 3—Neutral, 4—Positive, 5—Very positive).
Participants were asked to select possible measures/actions that, in their view, would enhance the individual acceptability of “Madrid Central”. Additionally, the information reported concerning ZIP code of residence was employed to build a new explanatory variable which captures residential location. It has six main categories referred to the main beltways within the metropolitan area: (i) Within “Madrid Central”; (ii) Between “M-30” and “Madrid Central”; (iii) Between “M-30” and “M-40”; (iv) Between “M-40” and “M-50”; (v) Outside of “M-50”; and (vi) No data.

4.2. Sample Characteristics

As observed in Table 4, the sample shows a higher share of males (59.1%) and a lower presence of people aged above 65 (2.4%). According to their employment status, 56.9% of respondents are employees, with a remarkable presence of students (16.8%) and part-time employees who are studying at the same time (18.8%). It is worth mentioning that 75.3% of surveyed people have university degrees. Regarding household structure, 38.3% of respondents share a household (flat mates and couples), 30.8% are families with children, and 28.4% live with their parents. The income level is uniformly distributed across the sample, with a representative percentage of respondents in all income subgroups included in the questionnaire. It is worth mentioning that all categories included in each variable are adequately represented in the sample.
The second block of the survey focuses on personal attitudes (see Table 5). There is a higher presence of left-wing ideology (36.9%) compared to other options. Surveyed people also reported very high levels of awareness in social (38.4%), economic (40.3%), and environmental (53.4%) issues.
Table 5 shows the information collected on travel-related variables. Most of the respondents hold a driver’s license (91.9%) and have at least one car available at their households (79.2%). Only 13.9% have a moped or motorcycle at home. Most of participants (73.3%) have public transport pass, and the frequency of using collective transport is equally distributed across all categories included in the survey. Finally, respondents reported a very low use of the existing shared mobility forms (72.2% of respondents rarely used these services), which is aligned with the results obtained by the latest Madrid Mobility Survey (Monzón et al., 2019) [25].
The fourth group of variables are related to individual perceptions and mobility habits linked to “Madrid Central” (Table 6). More than a quarter of respondents (27.3%) showed that the implementation of “Madrid Central” has had a very negative or negative impact on their usual trips, while a total of 23% pointed out a positive or very positive impact. Only a minor share of participants showed negative (6.3%) and very negative (4.4%) satisfaction as pedestrians while walking within “Madrid Central”. Furthermore, 24.7% of respondents have increased their time walking in the LEZ after the implementation of the “Madrid Central”, but most of them (71.5%) kept their previous walking habits.
The change of individuals’ retail and leisure activities after the implementation of “Madrid Central” are balanced across respondents (Table 6). There are similar percentages of respondents claiming that their retail and leisure activity decreased (38.2%), increased (34.9%), and remained constant (26.9%) in comparison with the situation prior to the LEZ.
Participants were also asked about the two most frequent transport modes used to get to the center of Madrid before and after the implementation of the LEZ. The survey shows a large share of people travelling by metro (53.3%) and private car (50.6%, alone or with companion) to get to “Madrid Central”. These transport modes are followed by collective bus (21.1%), suburban train (12.5%), and walking (12.6%). Since the implementation of “Madrid Central”, around 49.9% of respondents changed at least one of the two most frequent transport modes previously used to reach this place. The most remarkable change is a decrease of 29.6% in the use of private vehicle, while the share of public transport and non-motorized transport modes increased by 8.7% for the metro, 6.1% for the collective bus, 3.9% for suburban train, and 5.8% for walking.
Finally, we show the resulting trends regarding individuals’ acceptability of “Madrid Central”, which is the dependent variable of this study. The degree of acceptability is divided into five categories using a five-point Likert Scale (1—Very negative, 5—Very positive). A total of 36.2% of respondents showed a very positive opinion of “Madrid Central”, while 31.7% stated a positive opinion (Figure 2). By contrast, only 9.5% of respondents pointed out a very negative view towards “Madrid Central”, while 14.6% pointed out a negative view. The reminder 8.3% provided a neutral position. Overall, it can be observed that “Madrid Central” seems to be fairly supported by the public.
All respondents were additionally encouraged to point out possible actions to improve their satisfaction with “Madrid Central”. Participants with a positive or very positive acceptability of “Madrid Central” mainly indicated the following actions: increasing current public transport services (80.6%); a better promotion of car-sharing (44.7%); financial support for renewing private vehicle fleet (44.1%); and expanding “Madrid Central” (31.9%). Participants with a negative or very negative acceptability of “Madrid Central” pointed out: the need for a higher supply of collective transport services (49.7%) and the activation of financial support for renewing private vehicle fleet (46.1%). Other measures showed by this group of respondents were allowing combustion-based vehicles to get to “Madrid Central” for some time-slots (34.6%); implementing a fee to access “Madrid Central” by private vehicle (22.8%); and reducing the current extension of “Madrid Central” (22.0%).

5. Methodology: An Ordered Logit Model

This research explores the public acceptability towards “Madrid Central” implementing a choice modelling framework. The variable modelled is the individual acceptability of “Madrid Central”, measured by a five-point Likert scale (see Section 4). Due to the ordinal and discrete nature of the dependent variable, an ordered logit model has been adopted (Hanushek and Jackson, 1977) [27]. This methodology has been widely used in the field of transportation research (see, e.g., De Oña and De Oña, 2014; Irawan et al., 2018) [28,29], as well as a means to evaluate individual satisfaction (Cao and Cao, 2016) [30].
Ordered logit models are based on traditional logit models derived from the utility maximizing theory and behavior. According to this framework, individuals will select the option (in our case, level of acceptability of “Madrid Central”) with the highest utility, each one determined by a number of explanatory variables related to socioeconomic and demographic information of the individual (I), personal attitudes (A), travel-related variables (T) and mobility habits related to Madrid Central (M). The utility (Unj) gained by individual n for choosing alternative j can be written as
U n j = f   ( I n ,   A n j ,   T n j , M n j ) U n j = f   ( I n ,   A n j ,   T n j , M n j ) ,
The utility (U) obtained by the decision maker can be divided in two additive parts:
U n j = p β p   X n p + ε ,
where X is a vector of explanatory variables, β is a vector of coefficients to be estimated, and ε is the idiosyncratic error term.
The acceptability of “Madrid Central” LEZ has been collected as an ordered discrete variable (1 = Very negative; 2 = Negative; 3 = Neutral; 4 = Positive; 5 = Very positive). Then, an ordered logit model can be adopted in terms of probability of the level of acceptability towards “Madrid Central” as
P y n > k =   exp β   X n τ m 1 + exp β   X n τ m ,           n = 1 , 2 , 3 , 4 , 5 ; m = 1 , 2 , 3 , 4 ,
where τ1,2,3,4 represent the thresholds defined. Then the model can be expressed as
y =   j 1   i f   τ 1   U n j 2   i f   τ 1   U n     τ 2 j 3   i f   τ 2   U n     τ 3 j 4   i f   τ 3   U n     τ 4 j 5   i f   τ 4   U n
and the probability for each choice can be obtained as follows:
P y = j k =   F ( τ k U n ) F τ k 1     U n P y = j k =   F ( τ k U n ) F τ k 1     U n ,
One of the main assumptions of ordered logits models is the proportional odds assumptions (Wang et al., 2018) [31] whereby the relationship between any pairs of outcome categories is assumed to be equal. Consequently, it is assumed that the four accumulative odds ratios calculated from the five-level ordinal measure of acceptability are identical. Ordered logit models have been previously used in the field of transport and urban planning (see, e.g., Hensher et al., 2005; Train, 2009) [32,33].

6. Results

Since explanatory variables used in the model were mostly categorical, the interpretation of the modelling results required the selection of a base case. This enabled us to determine whether, for each explanatory variable, individuals’ answers were statistically significant across categories in comparison with the base case. The base categories chosen can be consulted in Table 7. Before calibrating the ordered logit model, multicollinearity tests are conducted for checking strong correlations among explanatory variables (Gujarati and Porter, 2004) [34]. The analysis showed no multicollinearity problems.
The results from the ordered logit model exploring acceptability towards “Madrid Central” are shown in Table 7. Most of explanatory variables that resulted non-statistically significant were finally removed from the last version of the model. To address that, we conducted multiple likelihood-ratio (LR) tests during the calibration process, ensuring that some explanatory variables could be omitted with no impact on the overall fitting or the explanatory power of the model.
The signs of the modelling coefficients and their statistical and practical significance are reasonable and aligned with the expected results (see Table 7). The model concludes that, from a statistical viewpoint (p-value < 0.05), the level of acceptability of “Madrid Central” is strongly influenced by all type of explanatory variables included in the questionnaire: socio-demographic characteristics, personal attitudes, travel-related variables, as well as perceptions and mobility habits linked to “Madrid Central”. In the remainder of this section, the most highlighted modelling results are discussed in detail.

6.1. Socioeconomics and Demography

Only few socio-demographic characteristics resulted statistically significant, showing their minor role in explaining the public acceptability of “Madrid Central” (see Table 7). Individuals who were simultaneously working and studying presented a more positive attitude towards the LEZ. Participants sharing a household also have higher acceptability. These results are related to the fact that people within these two groups are young (83.3% of individuals who were simultaneously working and studying and 90.8% of people sharing a household are below 26 years old), low-income (70% of individuals working and studying simultaneously and 72.4% of participants sharing a household have a monthly income under 1300 €/month), and less car dependent (68.6% of people working and studying and 86.2% of individuals sharing a household did not use a private vehicle to access Madrid Central) based on the results of the survey. Therefore, collective transport modes are a good option for them, since the public transport network in Madrid is dense and ubiquitous. In addition, collective transport is an affordable option, with unlimited use allowed for a certain amount of time in case a travel pass is acquired.
These population segments would not have a big need for a private vehicle at home, being too expensive for them. Surprisingly, some sociodemographic groups negatively affected by the LEZ, such as families with children or dependent people—as they would likely have a greater need for using the private vehicle—did not show statistically significant differences in their level of acceptability of “Madrid Central”.

6.2. Personal Attitudes

Political ideology and environmental awareness are found crucial to understand people’s acceptability of “Madrid Central”. Political ideology seems to be a very important driver to accept “Madrid Central”, with all categories within this variable being statistically significant (p-value = 0.000). Respondents with a left-wing political ideology shows a much higher acceptability in comparison with other political ideologies, especially supporters of right-wing parties. Particularly, for individuals supporting left-wing parties, the probability of being very positive towards “Madrid Central” is more than four times higher compared to individuals supporting other political ideologies. This result is aligned with previous studies correlating restrictive transport policies implemented by local governments (Christiansen, 2018) [35].
It must be noted that the implementation of “Madrid Central” was one of the most important measures adopted by a local government made up of a coalition of left-wing parties. The measure has been the subject of many debates among political parties with different ideologies about its effectiveness and influence on economic and societal issues. Our results clearly show that participants with left-wing ideology were much in favor of these measures, showing an alignment with the left-coalition in the government. Nevertheless, it is worth mentioning that “Madrid Central” seems to be a measure fairly supported by Madrid residents (see Section 4), with more than 65% of respondents reporting a positive or very positive opinion towards the LEZ.
In accordance with the objective of the LEZs, the environmental awareness of individuals was strongly related to acceptability. It makes sense that people more concerned about environmental issues are prone to support initiatives such as “Madrid Central”. Respondents with a high and very high environmental awareness strongly support the implementation of “Madrid Central” (p-value = 0.008), even though the effectiveness of this measure on improving environmental metrics has not been demonstrated yet in a robust way. Furthermore, it is worth noticing that individuals’ social and economic awareness were not found statistically significant in determining acceptability towards the LEZ, despite the plausible impacts of “Madrid Central” on society and economy.

6.3. Travel-Related Variables

Travel-related attributes also influence the level of public acceptability. Purchasing a collective transport pass or owning a private motorcycle were related to a higher acceptability of “Madrid Central” (p-values = 0.023 and 0.003, respectively). Owners of the public transport pass in the sample are regular collective transport users, who make on average more than four trips per day. They are not expected to be much affected by car restrictions to access “Madrid Central”, where public transport accessibility and supply are very high.
As previously shown, motorcyclists bear fewer restrictions than cars do to enter “Madrid Central”, so they are expected to drive more comfortable with a lower number of cars on the street. These reasons would likely lead them to have a more favorable attitude towards mobility policies based on car restrictions. Surprisingly, frequent users of shared mobility services show a lower degree of acceptability (p-value = 0.009) compared to occasional users of these services. Frequent users may fear that “Madrid Central” will increase the overall use of shared mobility services (e.g., by attracting new users), thus reducing their availability in the future.

6.4. Perceptions and Mobility Habits Linked to “Madrid Central”

The variables of this group have a significant role in explaining public acceptability towards “Madrid Central”. First, the level of acceptability is directly related to the positive or negative impact of this policy on the trips made by the respondents. Reasonably, participants who had kept or improved their travel experience show a higher acceptability (p-value = 0.000) than those who had worsened it. These results are similar to other restrictive transport policies, which have received lower ratings from harmed users (Gaunt, 2007) [14]. Moreover, citizens who had increased their daily walking routines within the LEZ also show a higher acceptability towards “Madrid Central” (p-value = 0.000). This effect is likely caused by the fact that car restriction policies imply the development of friendlier and more walkable cities.
Respondents who increased or maintained their retail and leisure activities in the area after the implementation of “Madrid Central” are more favorable to the LEZ, compared to those who reduced their activity levels. This probably happened because “Madrid Central” has created a friendlier environment for those people that travel to the area for leisure activities. Regarding mobility patterns, citizens who travel occasionally to “Madrid Central” (maximum twice a week or during weekends) show a higher acceptability level. However, individuals whose main activity within the LEZ is shopping present a lower acceptability of “Madrid Central”, maybe as a consequence of the negative impact that private vehicle restrictions can have on loading heavy bags.
Participants who changed their transport mode after the implementation of “Madrid Central” have a more negative acceptability than those who did not do it. It is worth mentioning that 49.9% of the sample reported having changed the transport mode previously used to get to the area, demonstrating the effectiveness of “Madrid Central” to shift the modal choice of people towards more environmentally friendly modes.
Finally, regarding the transport mode most frequently used before and after the implementation of “Madrid Central”, only three variables resulted statistically significant. Citizens using their private vehicles before the implementation of the LEZ shows lower acceptability, while citizens traveling by bicycle after the implementation of Madrid Central have more favorable attitudes. It is worth noticing too that car users are less favorable to “Madrid Central”, while cyclist—including those who did not use it before the measure—are more satisfied with the car restrictions imposed in Madrid Central. This result demonstrates that “Madrid Central” has been effective to create a better environment for the use of active modes.

7. Conclusions

Previous research on LEZs has been mostly focused on the evaluation of air pollutant concentration in cities worldwide. However, studies addressing acceptability issues are few and mostly based on stated preferences according to hypothetical scenarios. To address this knowledge gap, the current paper presents an ordered logit approach determining key drivers to explain the public acceptability of LEZs in Madrid, Spain. The study can provide planners and policy makers with a better understanding about the characteristics of the people who feel harmed by LEZs, as well as re-orient the negative impacts and maximize social benefits of car restriction policies. Furthermore, the obtained results could feed participatory planning processes, in which different citizens profiles regarding LEZ acceptability can be selected and engaged (May and Isson, 2008; Whitmarsh et al., 2009; Soria-Lara et al., 2019) [7,36,37].
One interesting finding is that acceptability of low emission zones in urban areas, at least in the case of “Madrid Central”, is weakly related to socioeconomic aspects—such as gender, age, education, or level of income. On the contrary, acceptability is much better explained by political ideology, environmental awareness, and the impact of car restrictions on individual mobility habits. Nevertheless, responses on environmental awareness could be biased, as participants could tend to provide polite responses overvaluing their real environmental awareness. Further studies focused on analyzing environmental awareness as a latent variable could confirm the obtained results in this study.
Overall, the acceptability of “Madrid Central” is fairly positive among Madrid’s citizens, given their high environmental awareness (77.1% of the sample). Those results are aligned with the obtained by Oltra et al. (2021) [38] in the context of Barcelona, where people with high environmental awareness showed higher acceptance level of car restriction policies. The strong relationship between political ideology and acceptability is reasonable, as the implementation of “Madrid Central” has been at the hotspot of the political debate in the region during 2018, generating confrontation among political parties. In this respect, though certain political influence is unavoidable, public authorities should work to provide better information to the community based on quantitative research studies that demonstrate its impact on aspects, such as air pollution, modal change, and economic and social impacts. That will contribute to help people obtain objective judgement, rather than thoughts based on ideological alignment with political parties. Additionally, this would also facilitate the design of transport policy scenarios that link people concerns with expert knowledge (Banister, 2008) [1].
A relevant result is that acceptability of “Madrid Central” is largely associated with the impact that this policy has on individuals’ habits, especially regarding mobility travel behavior. Citizens who have improved the quality of their trips show a greater acceptability towards “Madrid Central”. Frequent users of public transportation, motorcyclist, and occasional users of shared mobility services are also more in favor of “Madrid Central”, likely because the measure benefits or at least does not damage them. Furthermore, “Madrid Central” is more highly supported by those people who took advantage of the measure to develop a more intense retail and leisure activity, to enjoy walking, or to start biking to or within the LEZ.
However, “Madrid Central” is less supported by people negatively influenced by the LEZ. Respondents who were forced to change their usual mode to get to “Madrid Central”, especially people getting by car, are opposed to car restrictions. That is a controversial issue in transport planning, where previous studies (Szarata et al. (2017)) [6] underline the initial rejection from car users and local groups to similar policies that restrict car access. “Madrid Central” is not supported either by people going shopping, likely because the car is the most comfortable way for them to carry heavy bags. In addition, frequent users of shared mobility services are not much in favor of Madrid Central, likely because they may end up experiencing greater competition to rent these services in the area.
In order to improve acceptability without compromising sustainability standards, local authorities should focus on promoting policy schemes that minimize the negative impacts on those who feel harmed by LEZs. In the survey, the authors of the paper left some free text to the respondents to suggest actions that may improve or complement car restriction policies within “Madrid Central”. A great share of the respondents suggested increasing the frequency of public transport services in the area, providing financial support to the renewal of the car fleet, and promoting mobility sharing approaches. Offering solutions within a sustainable framework may undoubtedly contribute to improve the acceptability of certain groups of the population.

Author Contributions

J.T.-O. participated in the design of the original idea, the implementation of the field work, the empirical analysis, and the redaction of the manuscript. J.A.S.-L. took part in the design of the original idea and the redaction of the manuscript. J.G. participated in the design of the original idea, the empirical analysis, and the redaction of the manuscript. J.M.V. took part in the design of the original idea and the redaction of the manuscript. All authors have read and agreed to the published version of the manuscript.

Funding

This research received no external funding.

Institutional Review Board Statement

Not applicable.

Informed Consent Statement

Informed consent was obtained from all subjects involved in the study.

Data Availability Statement

Data under request.

Conflicts of Interest

The authors declare no conflict of interests.

References

  1. Banister, D. The sustainable mobility paradigm. Transp. Policy 2008, 15, 73–80. [Google Scholar] [CrossRef]
  2. Schwanen, T.; Banister, D.; Anable, J. Scientific research about climate change mitigation in transport: A critical review. Transp. Res. Part. A Policy Pract. 2011, 45, 993–1006. [Google Scholar] [CrossRef] [Green Version]
  3. Polichetti, G. Effect of travel restriction on PM10 concentrations in Naples: One year of experience. Atmos. Environ. 2017, 151, 12–16. [Google Scholar] [CrossRef]
  4. Ramos, R.; Cantillo, V.; Arellana, J.; Sarmiento, I. From restricting the use of cars by license plate numbers to congestion charging: Analysis for Medellin, Colombia. Transp. Policy 2017, 60, 119–130. [Google Scholar] [CrossRef]
  5. Zainol, R.; Ahmad, F.; Nordin, N.A.; Aripin, A.W.M. Evaluation of users’ satisfaction on pedestrian facilities using pair-wise comparison approach. IOP Conf. Ser. Earth Environ. Sci. 2014, 18, 1–6. [Google Scholar] [CrossRef]
  6. Szarata, A.; Nosal, K.; Duda-Wiertel, U.; Franek, L. The impact of the car restrictions implemented in the city centre on the public space quality. Transp. Res. Procedia 2017, 27, 752–759. [Google Scholar] [CrossRef]
  7. Soria-Lara, J.A.; Tarriño-Ortiz, J.; Bueno, P.; Ortega, A.; Vassallo, J.M. A collaborative appraisal framework to evaluate transport policies for improving air quality in city centres. Cities 2019, 92, 112–124. [Google Scholar] [CrossRef]
  8. Alduán, A.S. Boletín CF+S. 2014. Available online: http://polired.upm.es/index.php/boletincfs/article/view/2851/2912 (accessed on 2 February 2021).
  9. Holman, C.; Harrison, R.; Querol, X. Review of the efficacy of low emission zones to improve urban air quality in European cities. Atmos. Environ. 2015, 111, 161–169. [Google Scholar] [CrossRef]
  10. Ahanchian, M.; Gregg, J.S.; Tattini, J.; Karlsson, K.B. Analyzing effects of transport policies on travelers’ rational behaviour for modal shift in Denmark. Case Stud. Transp. Policy 2019, 7, 849–861. [Google Scholar] [CrossRef]
  11. Sandahl, J.; Lindh, C. Impact of improving the attractiveness of town centres. Transp. Policy 1995, 2, 51–56. [Google Scholar] [CrossRef]
  12. Soni, N.; Soni, N. Benefits of pedestrianization and warrants to pedestrianize an area. Land Use Policy 2016, 57, 139–150. [Google Scholar] [CrossRef]
  13. Ison, S.; Rye, T. Implementing Road User Charging: The Lessons Learnt from Hong Kong, Cambridge and Central London. Transp. Rev. 2005, 25, 451–465. [Google Scholar] [CrossRef]
  14. Gaunt, M.; Rye, T.; Allen, S. Public Acceptability of Road User Charging: The Case of Edinburgh and the 2005 Referendum. Transp. Rev. 2007, 27, 85–102. [Google Scholar] [CrossRef]
  15. Gu, Z.; Liu, Z.; Cheng, Q.; Saberi, M. Congestion pricing practices and public acceptance: A review of evidence. Case Stud. Transp. Policy 2018, 6, 94–101. [Google Scholar] [CrossRef]
  16. Lutz, M. The Low Emission Zone in Berlin—Results of a First Impact Assessment. Workshop on “NOx: Time for Compliance”. 2009. Available online: http://www.stadtentwicklung.berlin.de/umwelt/luftqualitaet/de/luftreinhalteplan/download/paper_lez_berlin_en.pdf (accessed on 10 December 2020).
  17. Ellison, R.B.; Greaves, S.P.; Hensher, D.A. Five years of London’s low emission zone: Effects on vehicle fleet composition and air quality. Transp. Res. Part. D Transp. Environ. 2013, 23, 25–33. [Google Scholar] [CrossRef]
  18. Ferreira, F.; Gomes, P.C.; Tente, H.; Carvalho, A.C.; Pereira, P.A.C.; Monjardino, J. Air quality improvements following implementation of Lisbon’s Low Emission Zone. Atmos. Environ. 2015, 122, 373–381. [Google Scholar] [CrossRef]
  19. Pronello, C.; Camusso, C. Travellers’ profiles definition using statistical multivariate analysis of attitudinal variables. J. Transp. Geogr. 2011, 19, 1294–1308. [Google Scholar] [CrossRef]
  20. Duque, L.; Relvas, H.; Silveira, C.; Ferreira, J.; Monteiro, A.; Gama, C.; Rafael, S.; Freitas, S.; Borrego, C.; Miranda, A. Evaluating strategies to reduce urban air pollution. Atmos. Environ. 2016, 127, 196–204. [Google Scholar] [CrossRef]
  21. Dias, D.; Tchepel, O.; Antunes, A.P. Integrated modelling approach for the evaluation of low emission zones. J. Environ. Manag. 2016, 177, 253–263. [Google Scholar] [CrossRef] [PubMed]
  22. Boogaard, H.; Janssen, N.A.; Fischer, P.H.; Kos, G.P.; Weijers, E.P.; Cassee, F.R.; van der Zee, S.C.; de Hartog, J.J.; Meliefste, K.; Wang, M.; et al. Impact of low emission zones and local traffic policies on ambient air pollution concentrations. Sci. Total Environ. 2012, 435-436, 132–140. [Google Scholar] [CrossRef]
  23. Bigazzi, A.Y.; Rouleau, M. Can traffic management strategies improve urban air quality? A review of the evidence. J. Transp. Health 2017, 7, 111–124. [Google Scholar] [CrossRef]
  24. De Groot, J.; Steg, L. Impact of transport pricing on quality of life, acceptability, and intentions to reduce car use: An exploratory study in five European countries. J. Transp. Geogr. 2006, 14, 463–470. [Google Scholar] [CrossRef]
  25. Monzón, A.; Cascajo, R.; Romero, C.; Calzado, R.; López, C. Informe del Observatorio de Movilidad Metropolitana–2017; Ministerio para la Transición Ecológica: Madrid, Spain, 2019. [Google Scholar]
  26. Ayuntamiento de Madrid. Plan de Calidad del Aire y Cambio Climático de Madrid. 2017. Available online: https://transparencia.madrid.es/portales/transparencia/es/Transparencia-por-sectores/Medio-ambiente/Aire/Plan-de-calidad-del-aire-y-cambio-climatico-Plan-A-2017-2020/?vgnextfmt=default&vgnextoid=fab664457127f510VgnVCM1000001d4a900aRCRD&vgnextchannel=33d9508929a56510VgnVCM1000008a4a900aRCRD (accessed on 1 March 2021).
  27. Hanushek, E.A.; Jackson, J.E. Statistical Methods for Social Scientists; Academic Press: Cambridge, MA, USA, 1977. [Google Scholar]
  28. De Oña, J.; De Oña, R. Quality of Service in Public Transport Based on Customer Satisfaction Surveys: A Review and Assessment of Methodological Approaches. Transp. Sci. 2015, 49, 605–622. [Google Scholar] [CrossRef] [Green Version]
  29. Irawan, M.Z.; Belgiawan, P.F.; Widyaparaga, A.; Deendarlianto; Budiman, A.; Muthohar, I.; Sopha, B.M. A market share analysis for hybrid cars in Indonesia. Case Stud. Transp. Policy 2018, 6, 336–341. [Google Scholar] [CrossRef]
  30. Cao, J.; Cao, X. Comparing importance-performance analysis and three-factor theory in assessing rider satisfaction with transit. J. Transp. Land Use 2017, 10, 65–68. [Google Scholar] [CrossRef] [Green Version]
  31. Wang, T.; Chen, J.; Wang, C.; Ye, X. Understand e-bicyclist safety in China: Crash severity modeling using a generalized ordered logit model. Adv. Mech. Eng. 2018, 10, 1687814018781625. [Google Scholar] [CrossRef] [Green Version]
  32. Hensher, D.A.; Rose, J.M.; Greene, W.H. NLOGIT for Applied Choice Analysis: A Primer; Amsterdam University Press: Amsterdam, The Netherlands, 2005; pp. 197–217. [Google Scholar]
  33. Train, K.E. Discrete Choice Methods with Simulation; Cambridge University Press: Cambridge, UK, 2009. [Google Scholar]
  34. Gujarati, D.N.; Porter, D.C. Basic Econometrics; McGraw-Hill: New York, NY, USA, 2004. [Google Scholar]
  35. Christiansen, P. Public support of transport policy instruments, perceived transport quality and satisfaction with democracy. What is the relationship? Transp. Res. Part A Policy Pract. 2018, 118, 305–318. [Google Scholar] [CrossRef]
  36. May, A.; Ison, S. Decision-support for sustainable urban transport strategies. Transp. Policy 2008, 15, 325–327. [Google Scholar] [CrossRef]
  37. Whitmarsh, L.; Swartling, Å.G.; Jäger, J. Participation of experts and non-experts in a sustainability assessment of mobility. Environ. Policy Gov. 2009, 19, 232–250. [Google Scholar] [CrossRef]
  38. Oltra, C.; Sala, R.; López-Asensio, S.; Germán, S.; Boso, À. Individual-Level Determinants of the Public Acceptance of Policy Measures to Improve Urban Air Quality: The Case of the Barcelona Low Emission Zone. Sustain. J. Rec. 2021, 13, 1168. [Google Scholar] [CrossRef]
Figure 1. Location of “Madrid Central”.
Sustainability 13 03251 g001
Figure 2. Individual acceptability level of “Madrid Central”.
Sustainability 13 03251 g002
Table 1. Vehicle fleet in Madrid and its metropolitan area.
Vehicle FleetVehicle Typology (%)
ZeroEcoCBA
Private car0.42.737.434.125.5
Private motorcycle0.00.956.617.125.4
Table 2. Access to Madrid Central according to vehicle typology.
Population Vehicle Typology
ZeroEcoCBA
ResidentsYesYesYesYesYes (until 2025)
Guests (max.20/month)YesYesYesYesYes (until 2020)
No residentsCarYesYesExcept to parking/garagesExcept to parking/garagesNo
MotorcycleYesYesRestricted hours
(7 to 22 h)
Restricted hours
(7 to 22 h)
No
Freight distributionYesYesRestricted hours Restricted hours No
Table 3. Survey structure and variables included.
BlockVariablesDescriptionQuestion Type
Socioeconomic and demographic characteristicsAgeIndividual age (several categories)Multi-answer question
GenderMale/female
Level of EducationUniversity/non-university level
Employment statusStudent; employee; part-time employee and student; other (homemaker; unemployed, retired)
Household structureComposition and number of people living in household (several categories)
Monthly incomeIndividual monthly income (several categories)
Residential locationZIP code of residenceOpen question
Personal attitudesPolitical ideologyLeft-wind, right-wind, and central ideologyMulti-answer question
Environmental awarenessDegree of environmental awareness Five-point Likert scale
1—Very low
5—Very high
Social awarenessDegree of social awareness
Economic awarenessDegree of economic awareness
Travel-related variablesDriver’s licenseHaving driver’s licenseMulti-answer question
Private vehicle availabilityHaving at least one vehicle (car or motorcycle) available at home
Having transport passHaving public transport pass
Use of public transport servicesFrequency of use of public transport servicesFive-point Likert scale
1—Very low
5—Very high
Use of shared mobility servicesFrequency of use of shared mobility services
Perceptions and mobility habits regarding “Madrid Central”Overall impact of “Madrid Central” on their usual tripsOverall affection on usual trips in terms of time, cost, comfort, etc.Five-point Likert scale
1—Very negatively
5—Very positively
Evaluation of Madrid Central as a pedestrianIndividual satisfaction with “Madrid Central” when walking
Time walking on foot within “Madrid Central”Variation in walking time after the implementation of “Madrid Central” (decrease, increase or maintain)Multi-answer question
Retail and leisure activities within “Madrid Central”Impact on retail and leisure activities conducted within “Madrid Central” (decrease, increase or neutral)
Trip frequency to “Madrid Central” Trip Frequency to “Madrid Central” as destination (several categories)
“Madrid Central” role in the individuals’ daily lifeIt captures whether individuals live in “Madrid Central”, work in “Madrid Central”, or both
Type of day typically travelling to “Madrid Central”Travelling to “Madrid Central” during working and/or non-working days
Main activity conducted in “Madrid Central”Common activity carried out within “Madrid Central” (working, studying, shopping, leisure time, commuting)
Change in modal choice after the implementation of “Madrid Central”Whether the respondent has changed (or not) the transport mode chosen to access “Madrid Central” after the implementation of the LEZ
Usual transport modes (max.2) to access “Madrid Central” before implementing the LEZSelection of main transport modes to get to “Madrid Central” before the implementation of the LEZ (only the two most usual modes were reported)
Usual transport modes (max.2) to access “Madrid Central” after implementing the LEZSelection of main transport modes to get to “Madrid Central” after the implementation of the LEZ (only the two most usual modes were reported)
Acceptability level of “Madrid Central”Individual acceptability of “Madrid Central”Overall individual acceptability of “Madrid Central” (dependent variable)Five-point Likert scale
1—Very negative
5—Very positive
Table 4. Socioeconomics and demography information.
VariablesCategoriesRespondents% Sample
AgeBelow 2523529.4
From 26 to 3418322.9
From 35 to 4921126.4
From 50 to 6415118.9
Above 65192.4
GenderMale47259.1
Female32740.9
Level of educationUniversity60275.3
Non-university19724.7
OccupationStudent13516.9
Employee45556.9
Part-time employee and student 15018.8
Other (Homemaker, Unemployed or Retired)597.4
Household structureLiving alone779.7
Living with parents22728.4
Sharing household (two or more people who share a private dwelling)23538.3
Family with children24630.8
Family with elderly or disabled people141.8
Monthly incomeWithout own income11314.1
Under 800 Euro9712.1
From 800 to 1000 Euro729.0
From 1000 to 1300 Euro10913.7
From 1300 to 1600 Euro9111.4
From 1600 to 2000 Euro11514.4
From 2000 to 2500 Euro799.9
From 2500 to 3200 Euro659.1
Above 3200 Euro587.3
Residential locationWithin “Madrid Central”12615.8
Between “M-30” and “Madrid Central”12315.4
Between “M-30” and “M-40”19724.7
Between “M-40” and “M-50”16320.4
Outside of “M-50”13216.5
No data587.2
Table 5. Personal attitudes and travel-related variables.
Variables% Sample
Left-WingCentristRight-WingNone
Political ideology36.925.313.324.5
Variables % Sample
Very lowLowNeutralHighVery high
Environmental awareness4.54.813.623.753.4
Social awareness12.46.019.923.338.4
Economic awareness9.86.219.424.340.3
VariablesCategoryRespondents% Sample
Driver’s license(Yes)73491.9
Private car availability(Yes)63379.2
Private motorcycle availability(Yes)11113.9
Public transport pass(Yes)58673.3
Use of public transportVery low22628.3
Low12215.3
Medium8811.0
High10813.5
Very high25531.9
Use of shared mobility servicesVery low57772.2
Low9812.3
Medium759.4
High303.7
Very high192.4
Table 6. Perceptions and mobility habits linked to “Madrid Central”.
Variables % Sample
Very NegativeNegativeNeutralPositiveVery Positive
Overall impact of LEZ on their usual trips11.815.549.712.410.6
Evaluation of “Madrid Central” as a pedestrian4.46.323.024.841.5
VariablesSubgroupRespondents% Sample
Time walking on foot in theDecreased313.9
LEZMaintained57171.5
Increased19724.6
Retail and leisure activitiesDecrease30538.2
within “Madrid Central” Maintain21526.9
Increase27934.9
Trip frequency to
“Madrid Central”
Less or equal than 1 trip per month759.4
More than 1 trip per month13316.7
Less than 2 trips per week13917.4
2–5 trips per week17922.4
5–10 trips per week9311.6
Above 10 trips week18022.5
“Madrid Central” role on the individual’s daily lifeResidence and work405.0
Residence567.0
Work16120.2
No direct relationship54267.8
Type of day travelling to
“Madrid Central”
Working day13617.0
Non-working day23929.9
Both42453.1
Main activity conducted in Madrid CentralWork22327.9
Study678.4
Shopping 17421.8
Leisure25632.0
Transit area637.9
Other 162.0
Modal choice before Private vehicle (alone)25131.4
Madrid Central (max.2) (Respondents could select a maximum of 2 different transport modes)Private vehicle (with companion)15319.2
Metro42653.3
Bus16921.2
Suburban train10012.5
Bicycle405.0
Walking10112.6
Taxi/Ride-hailing324.0
Car-sharing192.4
Kick-Scooter sharing10.1
Moped scooter sharing111.4
Change in modal choice(Yes)39949.9
Modal choice afterPrivate vehicle (alone)10513.4
Madrid Central (max.2) (Respondents could select a maximum of 2 different transport modes)Private vehicle (with companion)617.6
Metro49562.0
Bus21827.3
Suburban train13116.4
Bicycle587.3
Walking14718.4
Taxi/Ride-hailing668.3
Car-sharing475.9
Kick-Scooter sharing101.3
Moped scooter sharing222.8
Table 7. Individual acceptability level of “Madrid Central”: Ordered logit model results.
BlocksExplanatory VariablesCoeff.Std.
Error
p-Value
SOCIOECONOMIC AND DEMOGRAPHIC CHARACTERISTICSOccupation
Part-time employee and student0.4271.1920.026
Household structure
Sharing household (two or more people who share a private dwelling)0.3950.1680.018
PERSONAL ATTITUDESPolitical ideology (base case: leftist)
Centrist−0.8700.2040.000
Rightist−1.6370.2490.000
None−0.9300.2080.000
Environmental awareness0.4640.1760.008
TRAVEL RELATED VARIABLESPrivate motorcycle availability (base case: no)
Yes0.4960.2180.023
Public transport pass (base case: no)
Yes0.5180.1720.003
Use of shared mobility services
High−0.5330.2050.009
PERCEPTIONS AND MOBILITY HABITS RELATED TO MADRID CENTRALOverall impact of LEZ on usual trips (base case: very negative)
Negative1.5270.2810.000
Neutral2.2010.2960.000
Positive2.8090.3740.000
Very positive3.5670.4430.000
Time walking on foot in the LEZ
Increased0.7340.1910.000
Retail and leisure activities within “Madrid Central” after restrictions were implemented (base case: decreased)
Maintained1.3800.2120.000
Increased1.9300.2420.000
Trip frequency to “Madrid Central”
More than 1/month and less than 2/week0.4380.1980.027
Type of day travelling to “Madrid Central” (base case: working day)
Non-working day0.5870.2350.013
Both0.4660.2020.021
Main activity in “Madrid Central”
Shopping−0.5030.1870.007
Change in modal choice (base case: no)
Yes−0.5670.1840.002
Private vehicle (alone) before Madrid Central(base case: no)
Yes−0.3940.2000.049
Private vehicle (with companion) before Madrid Central (base case: no)
Yes−0.3060.2010.128
Bicycle after Madrid Central (base case: no)
Yes0.6810.3560.056
Cut1−0.0240.461
Cut21.7850.474
Cut32.6080.481
Cut45.3410.508
No. obs.799
Log-Likelihood−789.099
Pseudo R20.315
Publisher’s Note: MDPI stays neutral with regard to jurisdictional claims in published maps and institutional affiliations.

