
Optimal Combination of External Wall Insulation Thickness and Surface Solar Reflectivity of Non-Residential Buildings in the Korean Peninsula

Abstract
1. Introduction
2. Materials and Methods
2.1. Selection of Representative Cities and Buildings for Simulation
2.1.1. Representative City
- Jeju Island: The largest island in South Korea (low latitude).
- Busan: A metropolitan government located in the southeastern part; the second largest city in South Korea and a port city.
- Kwangju: A metropolitan government located in the southwestern region; the largest city in southwestern Honam Province.
- Daegu: A metropolitan government located in central Gyeongsang-do; the third largest city in South Korea.
- Daejeon: A metropolitan government located in the central region; a key transportation location.
- Seoul: The capital of South Korea, having the largest population, located in the center of the Korean Peninsula.
- Gangneung: Located in the eastern region; the largest city in Gangwon Province.
- Kaesong: A large city in North Korea, adjacent to South Korea.
- Pyongyang: The capital and largest city in North Korea.
- Hamhung: The second largest city in North Korea, and an industrial city.
- Sinuiju: A city located in the northwestern region, adjacent to the Chinese border.
- Chongjin: The third largest city in North Korea, located in the northern region (high latitude).
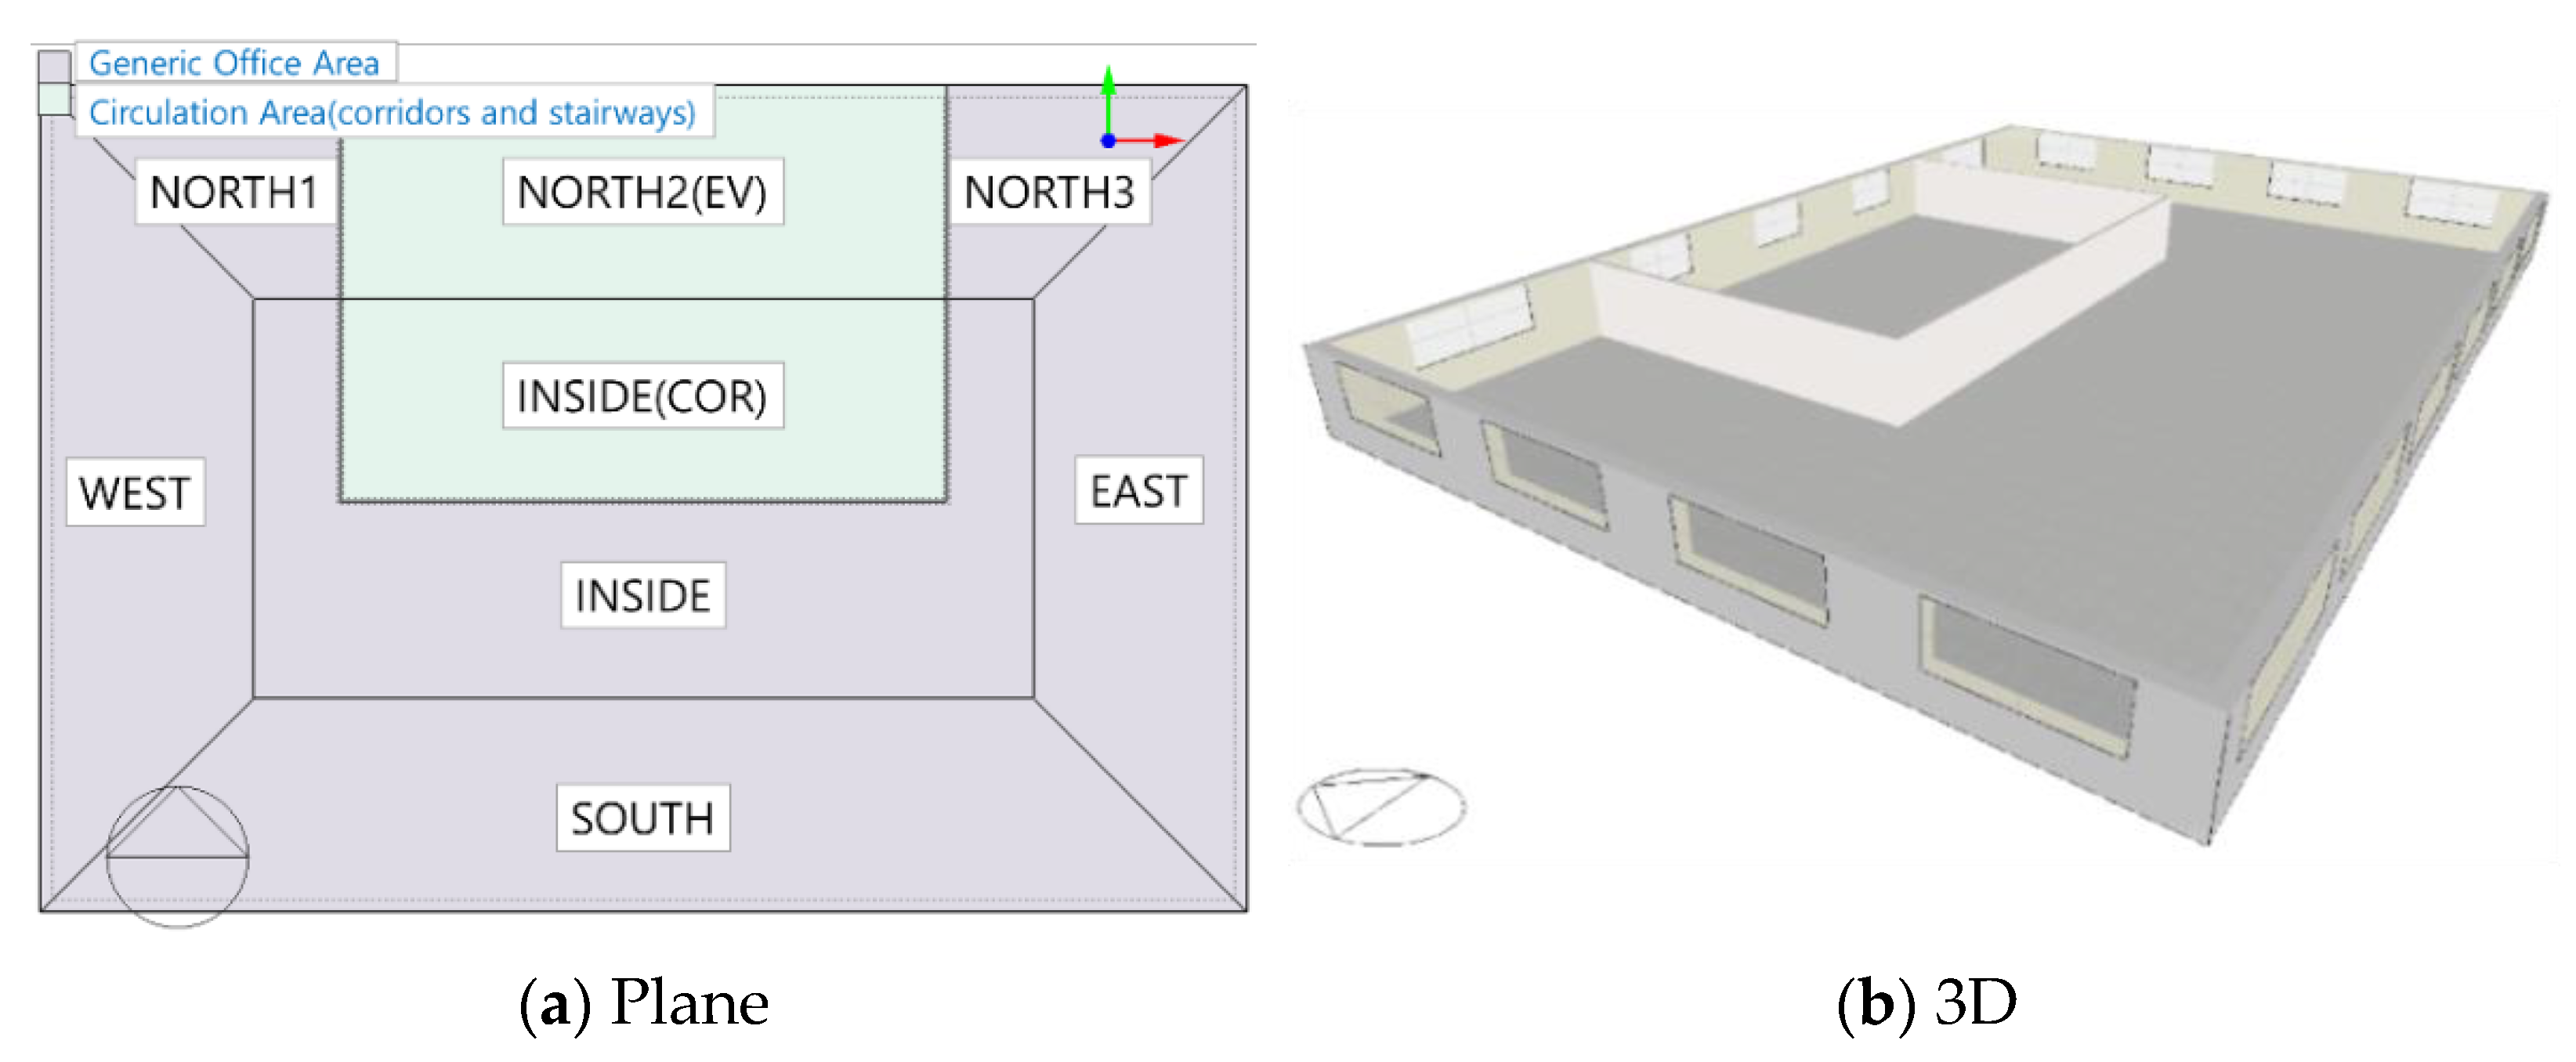
2.1.2. Selection of Simulated Buildings
2.2. Analysis Methods and Conditions
2.2.1. Energy Simulation

| Item | Detail | |
|---|---|---|
| Weather data (External condition) | TMYx (2004–2018): South and North Korea (Jeju, Busan, Seoul, Pyongyang, Sinuiju Chongjin, etc.) [48] | |
| Ground reflectivity | 0.2 (constant, default) | |
| Activity schedule | Monday to Friday (9:00–18:00), 9 h [51] | |
| Internal heat gain | Occupant | 131 W/person (latent and sensible heat) Occupancy density: 0.2 (person/m2) [52] |
| Lighting | 25 W/m2 (latent heat) [53] Mean radiant fraction: 46% | |
| Office equipment | 14 W/m2 [54] | |
| Setting point [53] | Heating (Nov–Feb) | 20 °C, RH 40% |
| Cooling (Jun–Aug) | 26 °C, RH 60% | |
| Mid-term (Mar–May, Sep–Oct) | 20–26 °C, RH 40–60% | |
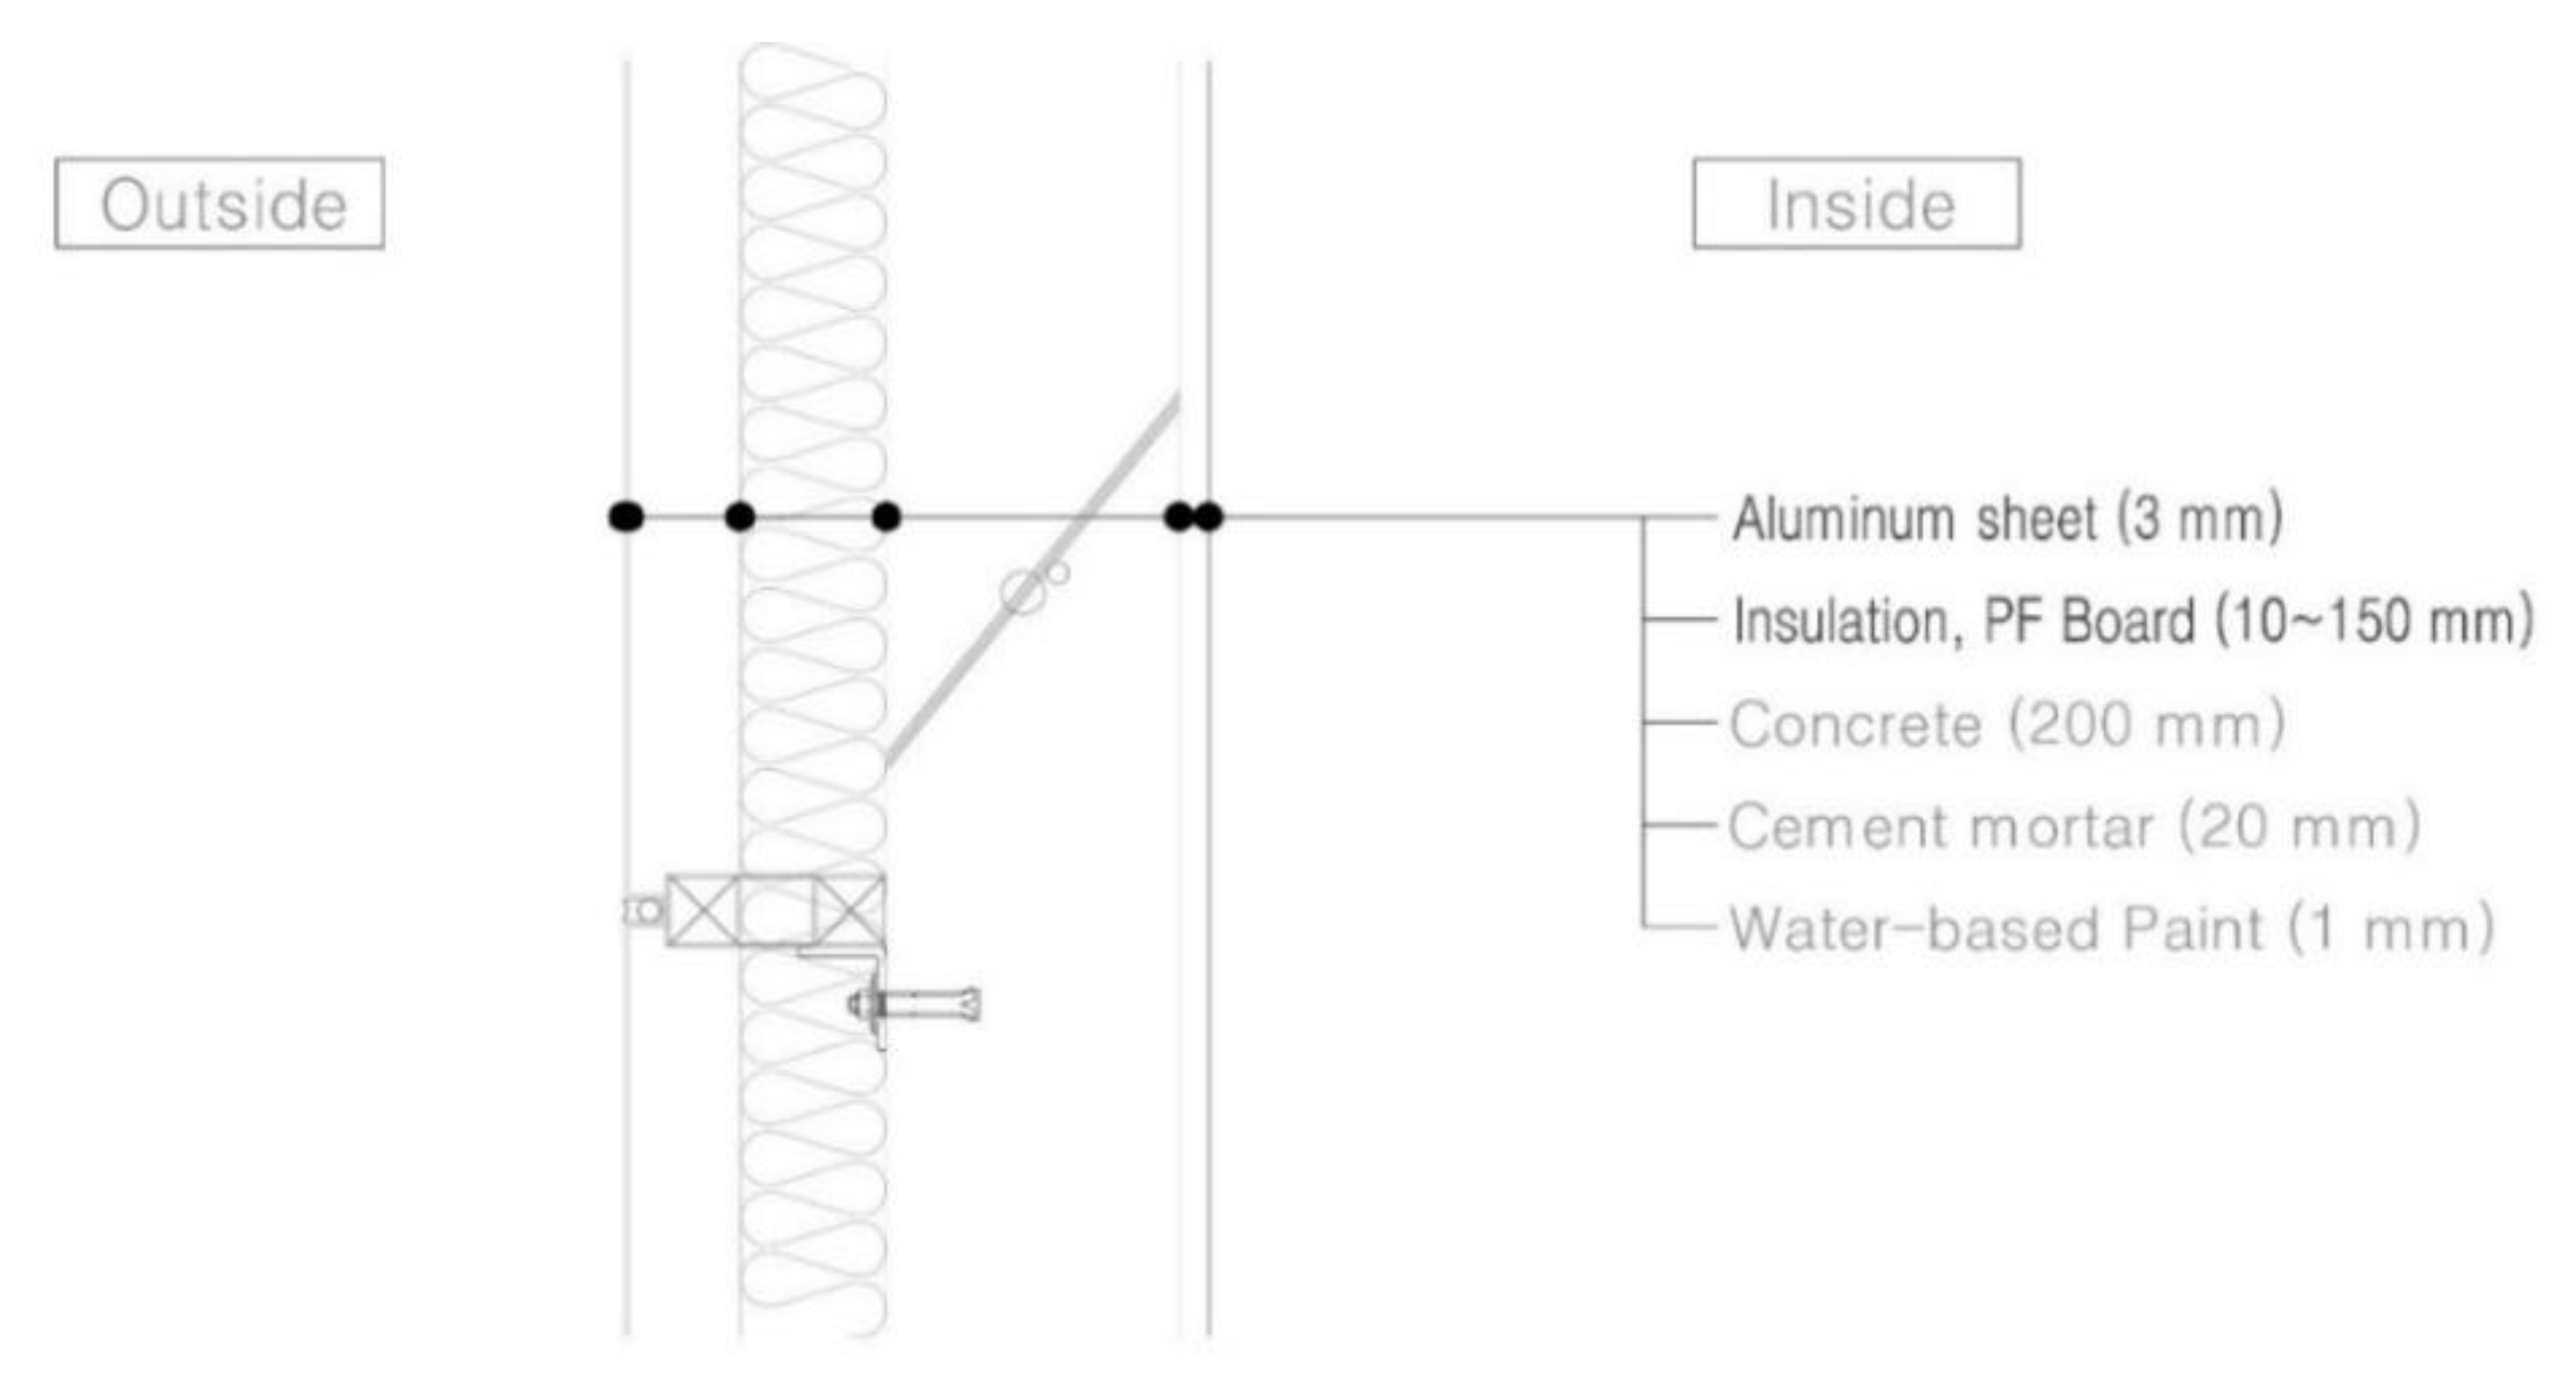
| Insulation | External wall | PF board (0.019 W/m·K) 10–150 mm (no air gap between aluminum sheet and insulation) |
| Roof and floor | Adiabatic | |
| Wall reflectivity | East, West, North, and South: 0.1–0.9 | |
| Outer surface emissivity (paint coating) | 0.9 | |
| Infiltration | 1.5 ACH [54] | |
| Windows | U-value | 1.3 W/m2·K, Steel frame [Legal criteria (Central 1)] |
| SHGC | 0.58 [33] | |
| Heating and cooling | EHP (heating COP 3.0, cooling COP 3.5) | |
| Ventilation | 2.15 ACH [55] | |
| Annual operating days | 250 d [51] | |
2.2.2. Cost Analysis
| Parameter | Unit Cost | Remark | |
|---|---|---|---|
| Cost of insulation material (Cim) | 10 mm | 8.37 $/m2 | PF board, semi-nonflammable |
| 20 mm | 10.29 $/m2 | ||
| 30 mm | 12.62 $/m2 | ||
| 40 mm | 14.99 $/m2 | ||
| 50 mm | 15.49 $/m2 | ||
| 60 mm | 17.49 $/m2 | ||
| 70 mm | 19.49 $/m2 | ||
| 80 mm | 21.49 $/m2 | ||
| 90 mm | 23.49 $/m2 | ||
| 100 mm | 27.27 $/m2 | ||
| 110 mm | 29.27 $/m2 | ||
| 120 mm | 31.27 $/m2 | ||
| 130 mm | 33.27 $/m2 | ||
| 140 mm | 35.27 $/m2 | ||
| 150 mm | 37.27 $/m2 | ||
| Cost of reflective material (Crm) | 0.1~0.7 | 88.84 $/m2 | Aluminum sheet (coating) |
| Electricity fee (Fs, Fw) [61] | Summer: 0.08 $/kWh, Winter: 0.07 $/kWh | Korea Electric Power Corporation 2020, General Electric Power (A) | |
| Inflation rate (If) [62] | 1.72% | 2010–2019 Korean average consumer inflation rate | |
| Interest rate (It) [63] | 2.05% | 2010–2019 Standard interest rate average | |
| Analysis period (n) [64] | 40 y | Corporate Tax Act Enforcement Rule [Attachment 5] Standard useful life for buildings, etc. | |
| Heating and cooling energy demand and consumption (Ec, Eh) | EnergyPlus | ||
3. Results and Discussion
3.1. Analysis of Energy Saving Methods for Heating and Cooling
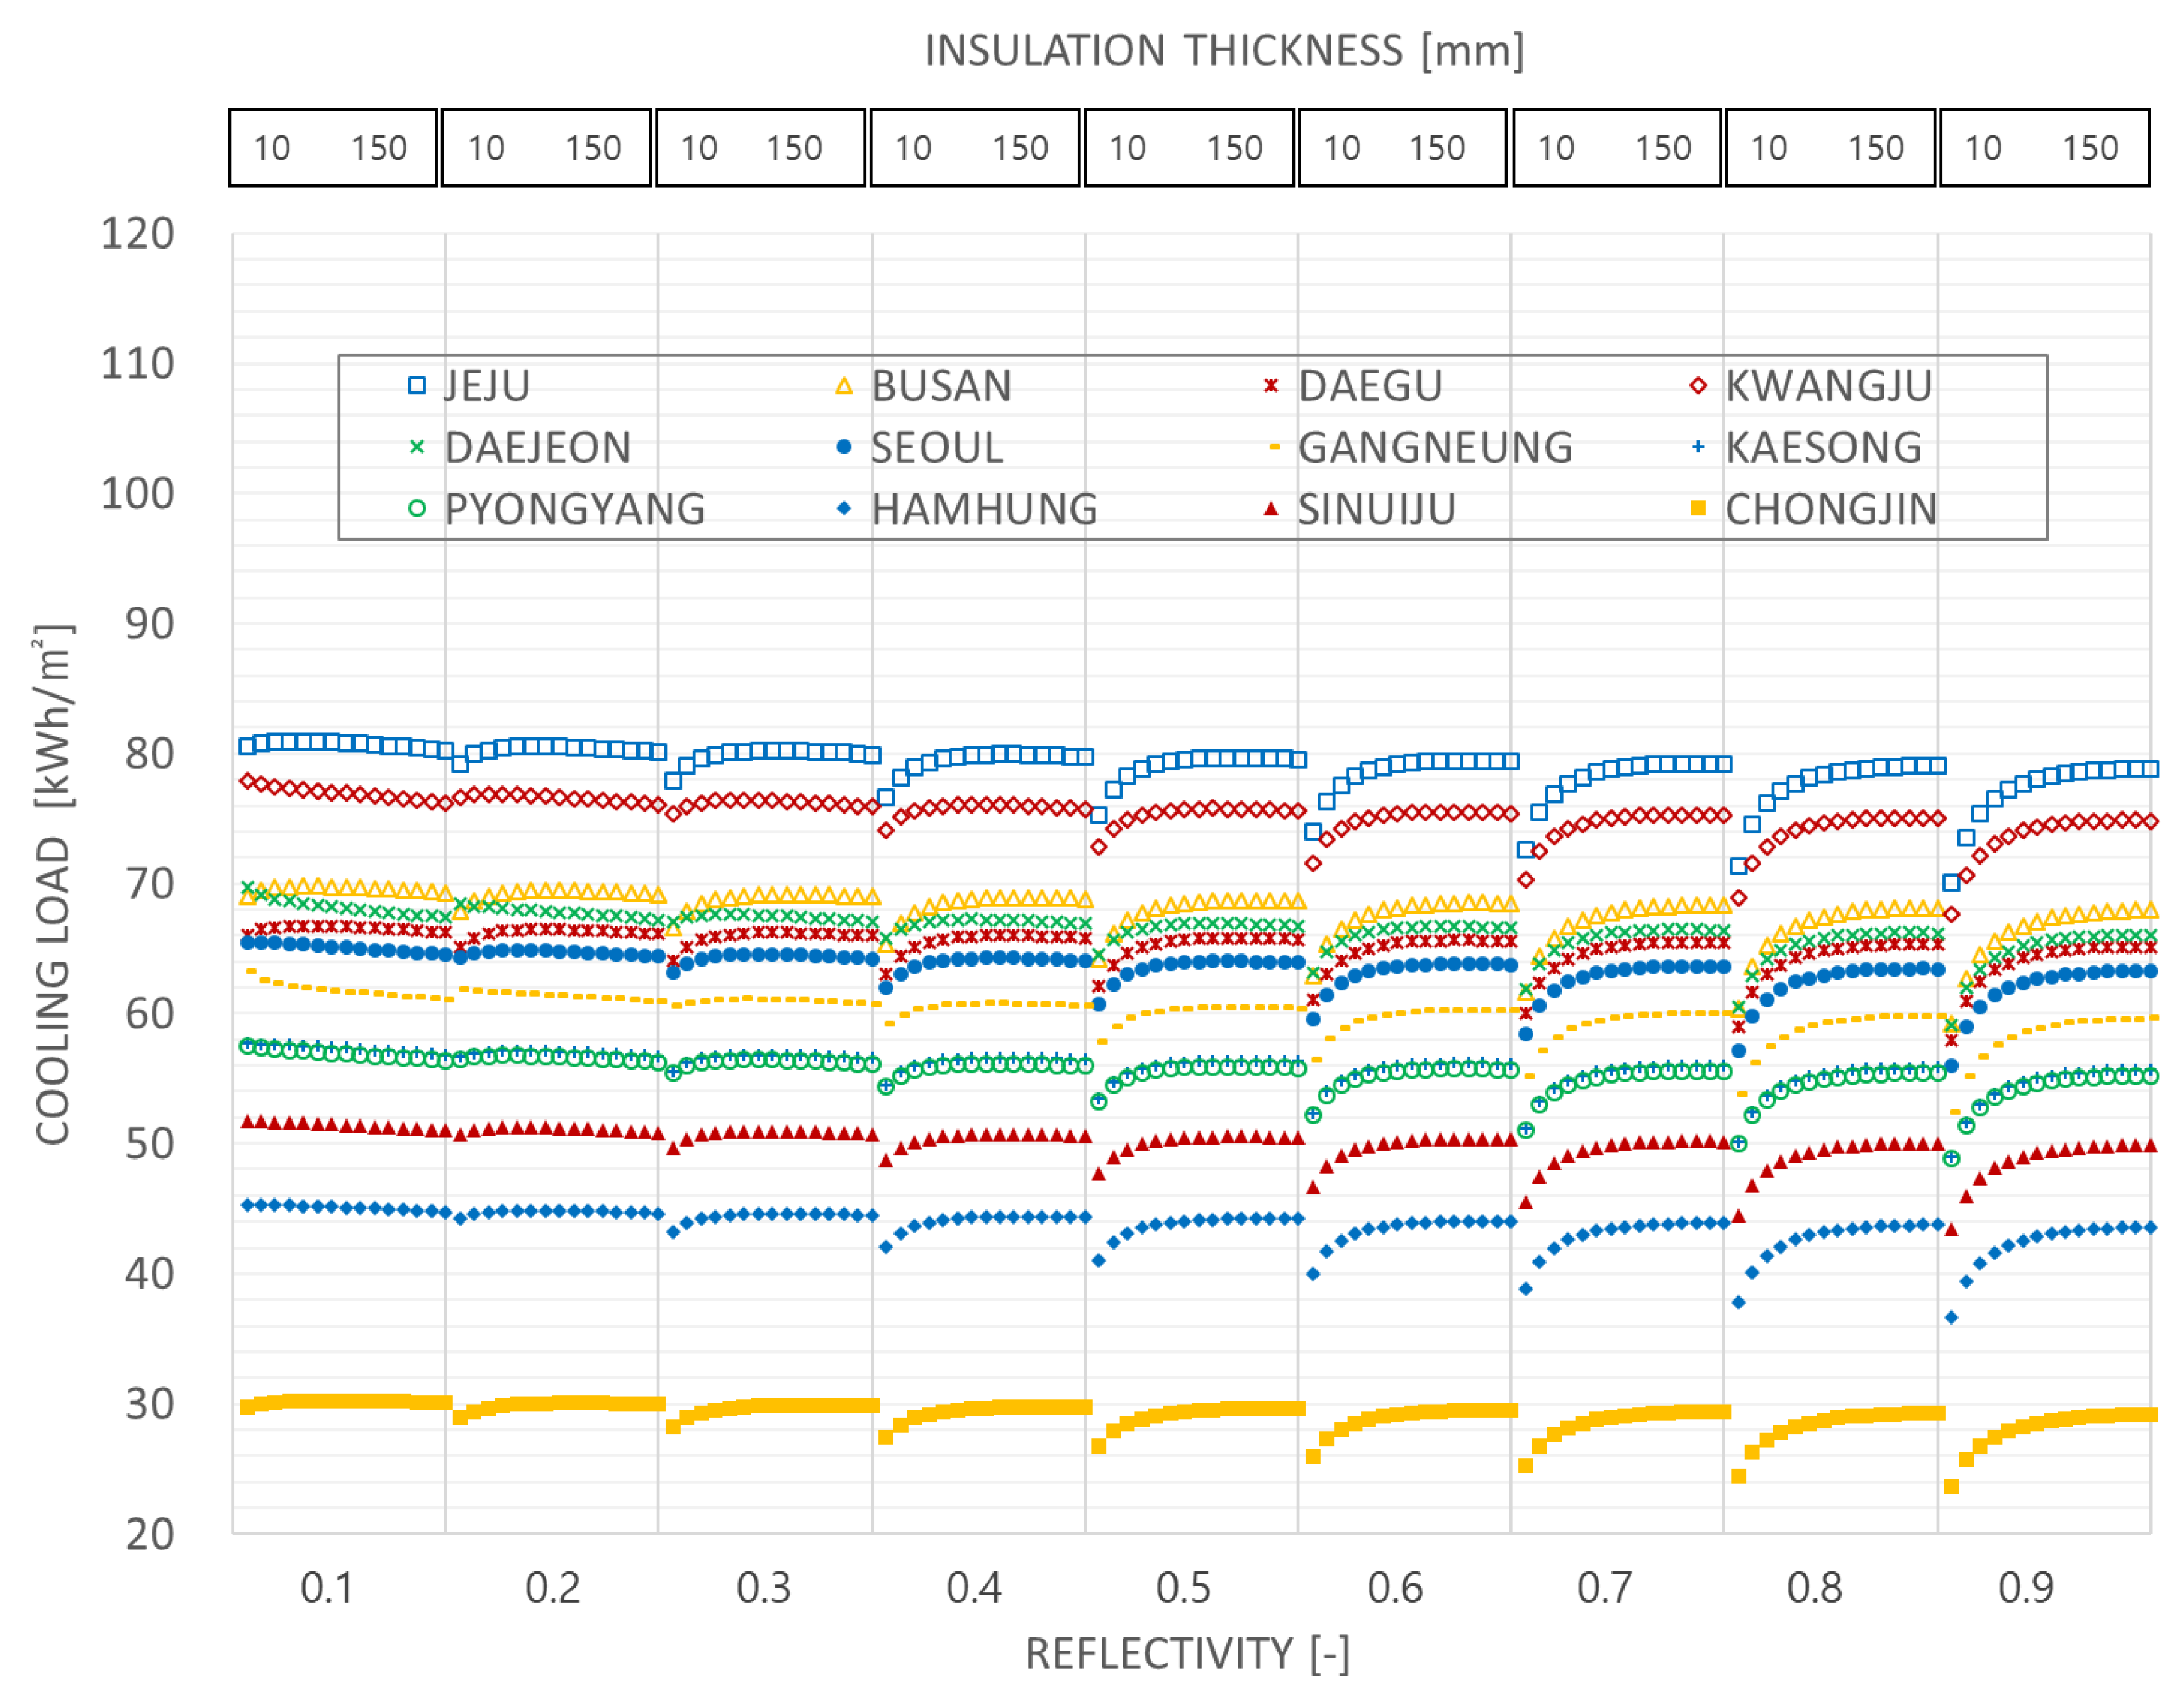
3.1.1. Cooling Load Results
- In general, the cooling load decreases as the latitude increases, although certain differences were observed between the east and west regions of the Korean Peninsula, (East region: Busan, Daegu, Gangneung, Hamhung and Chongjin. West Region: Jeju, Kwangju, Daejeon, Seoul, Kaesong, Pyongyang and Sinuiju)
- Even when the cities are located at a similar latitude, less cooling load occurs in the east than that in the west. For example, Kwangju and Busan, Seoul and Gangneung and Sinuiju and Hamhung are located at similar latitudes, but there are less cooling loads in the east compared to the west, likely because of the coastal climate effects in the east.
- As the thickness of the insulation material increases, there exists a sector in which the cooling load increases. This phenomenon occurs because increasing the thickness of the resistive thermal insulation results in less heat loss to the outside that was generated internally by the equipment, the lighting, the human body and solar radiation [66,67,68,69,70]. These phenomena can be identified by the change in the cooling load, i.e., the slope, against the change in the insulation thickness. In this study, the change of insulation thickness for each reflectivity was constant at 10 mm; therefore, if the change in the cooling load was greater than zero, then this sector could be considered as one in which the cooling load increases with increasing insulation thickness. The reflectivity values at which this change-over starts are as follows: Jeju 0.1, Busan 0.1, Daegu 0.1, Kwangju 0.2, Daejeon 0.3, Seoul 0.2, Gangneung 0.3, Kaesong 0.2, Pyongyang 0.2, Hamhung 0.2, Sinuiju 0.2, Chongjin 0.1.
- In all the regions, an increase in the reflectivity increases the change-over interval. In other words, the sector in which the increase in the insulation thickness results in an increase in the cooling load is broadened.
- The changes in the cooling load occur over a larger range as the insulation thickness decreases in a thin sector (approximately 10 to 40 mm) and the reflectivity of the external wall increases.
- As the reflectivity of the exterior wall of the building increases, the region with a relatively large reduction in cooling loads pertains to the low latitudinal region. Therefore, the cooling load can be effectively reduced by increasing the external wall reflectivity at low latitudes.
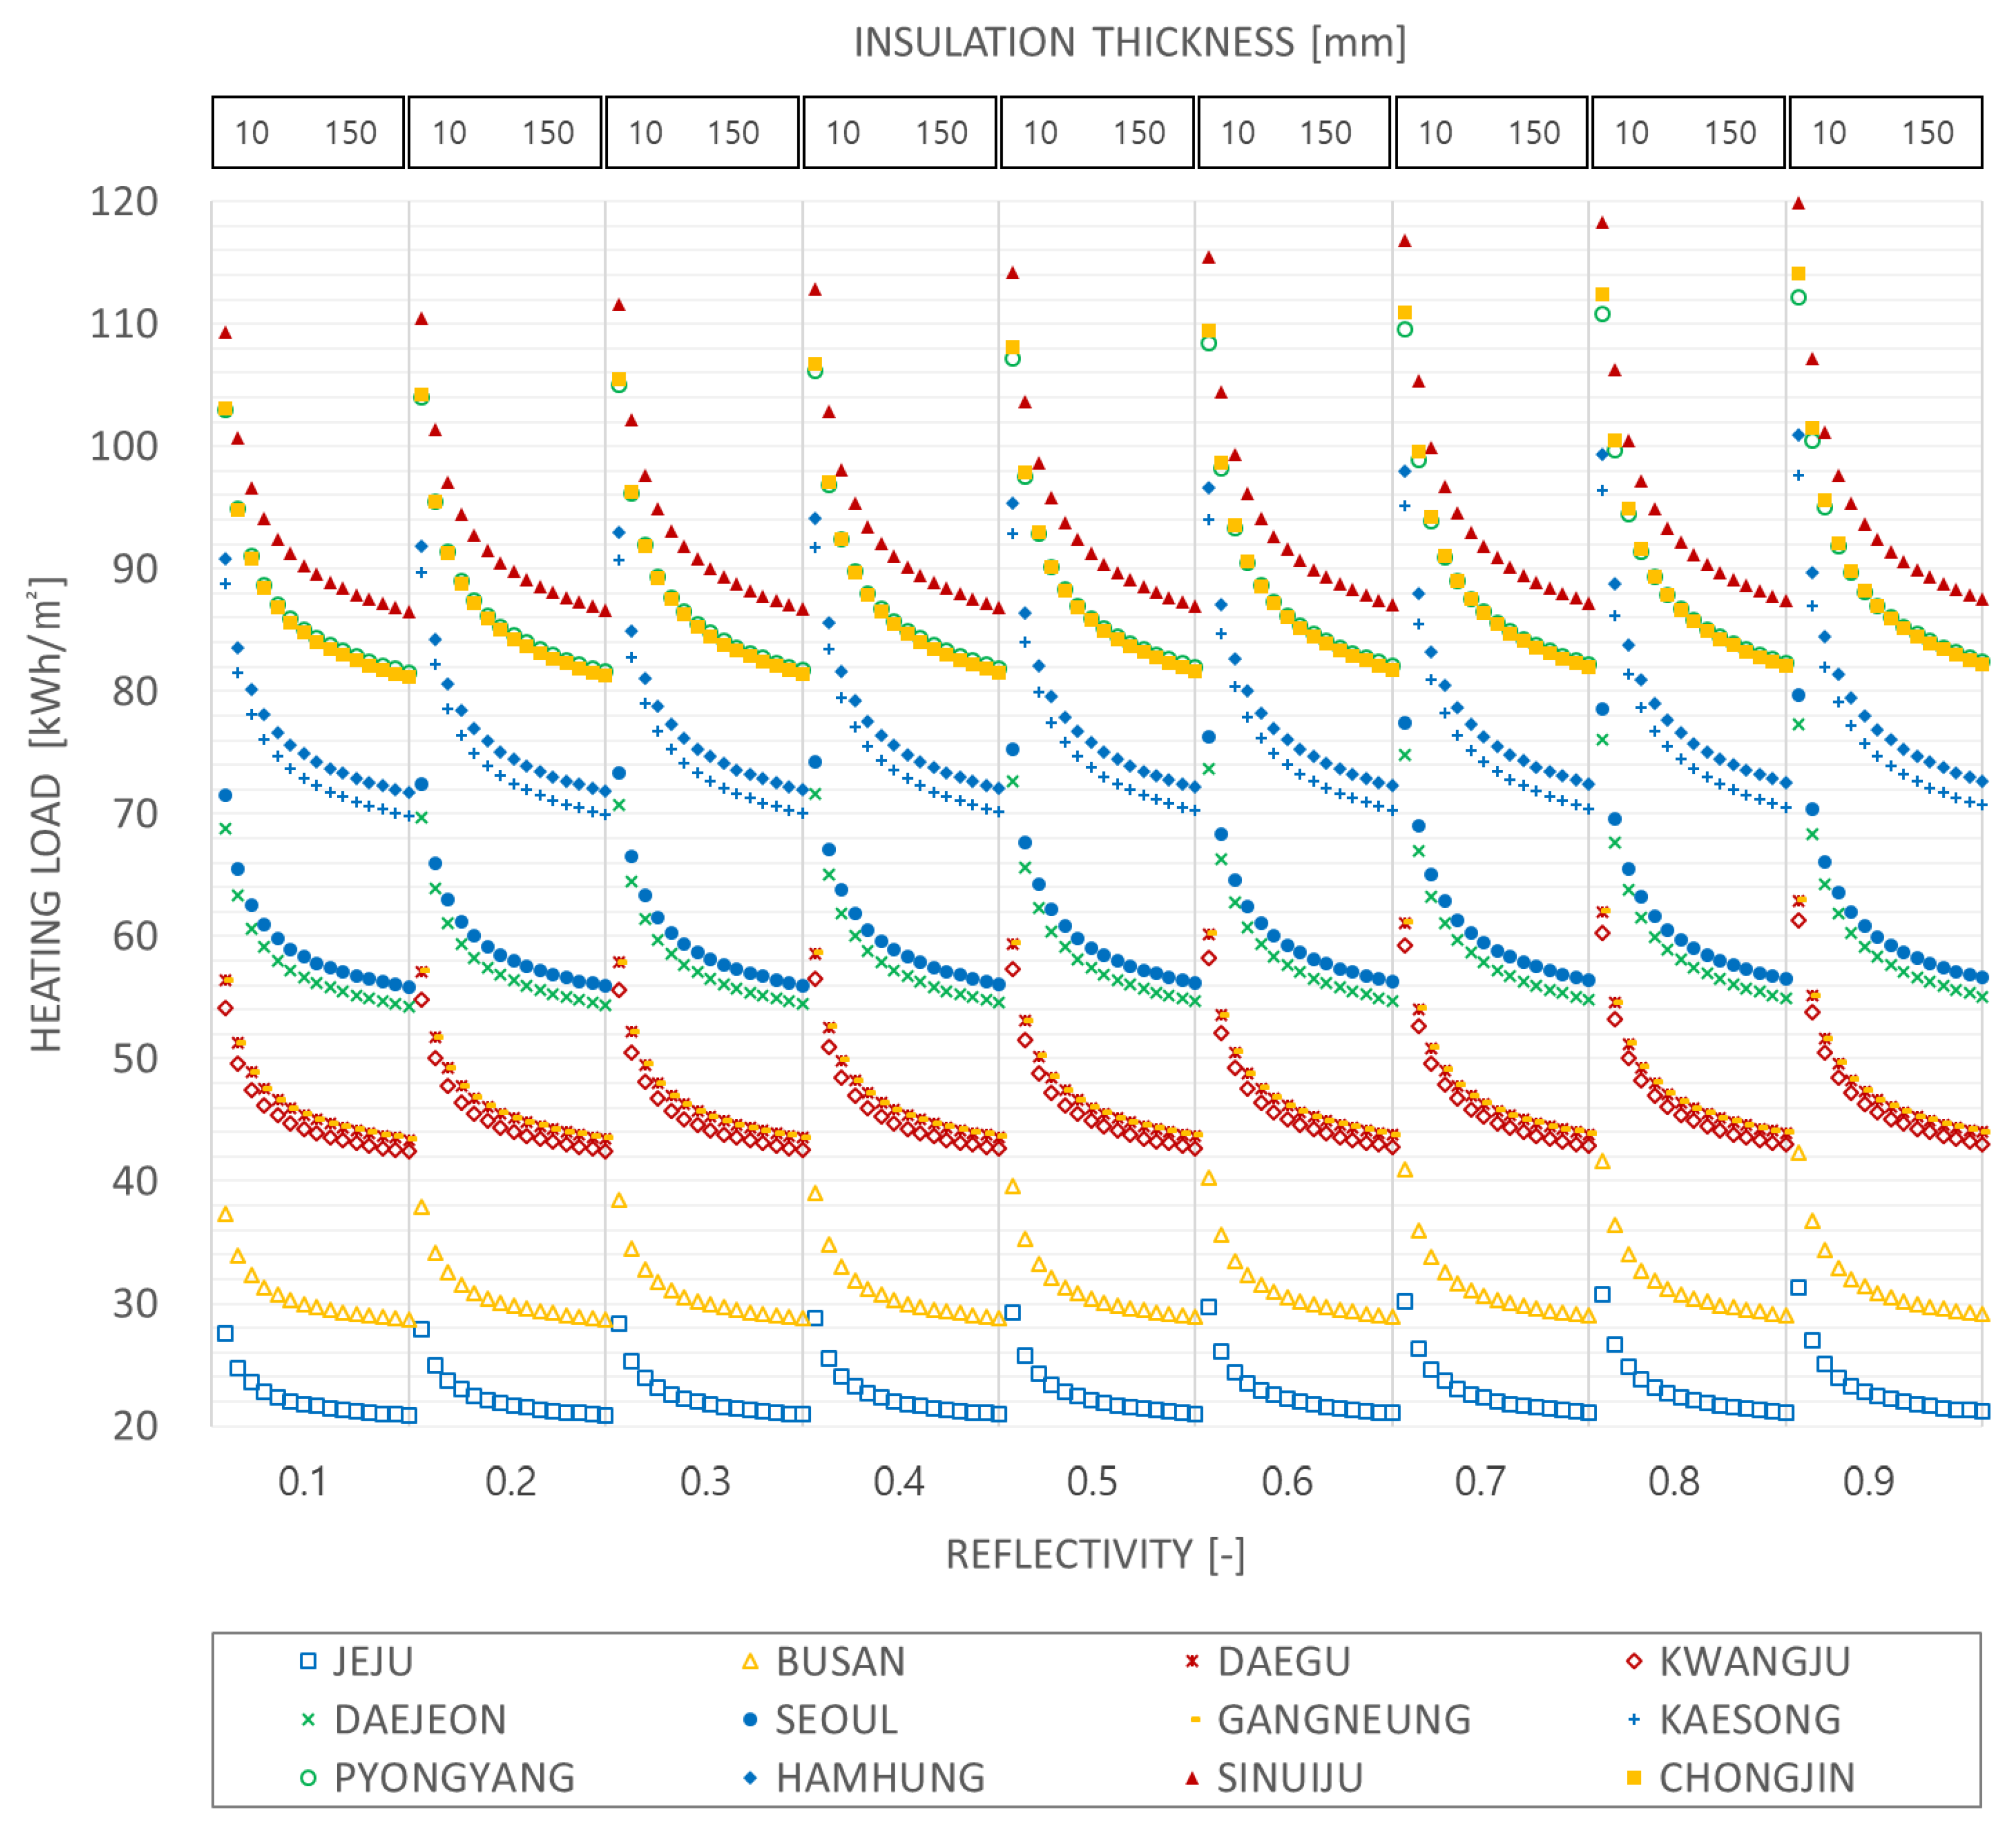
3.1.2. Heating Load Results
- There exist certain differences between the eastern and western regions of the Korean Peninsula; however, in general, the heating load decreases at lower latitudes.
- The heating load is smaller in the eastern than in the western region of the Korean Peninsula. For example, Chongjin, Hamhung, Gangneung and Busan, located in the east, are located at a higher or almost identical latitude than Sinuiju, Pyongyang, Daejeon and Kwangju, which are located in the west, but exhibit a smaller heating load. This phenomenon likely occurs because the western part of the Korean Peninsula is affected by the continental climate, and the eastern part has the characteristics of the coastal climate caused by the Kuroshio current [28].
- As the reflectivity increases, the heating load increases. This phenomenon occurs because as the external wall reflectivity increases, the solar radiation energy absorbed by the external wall decreases.
- The heating load changes considerably in the thin sector (10 to 40 mm) of the insulation. As the thickness of the insulation increases, this value decreases rapidly. As the reflectivity increases or the thickness of the insulation decreases, the heating load increases.
- The change in the amount of reduction in the heating load due to the increase in the insulation material increases as the latitude increases. Therefore, the heating load reduction effect pertaining to the increase in the insulation thickness is more notable at higher latitudes than that at lower latitudes.
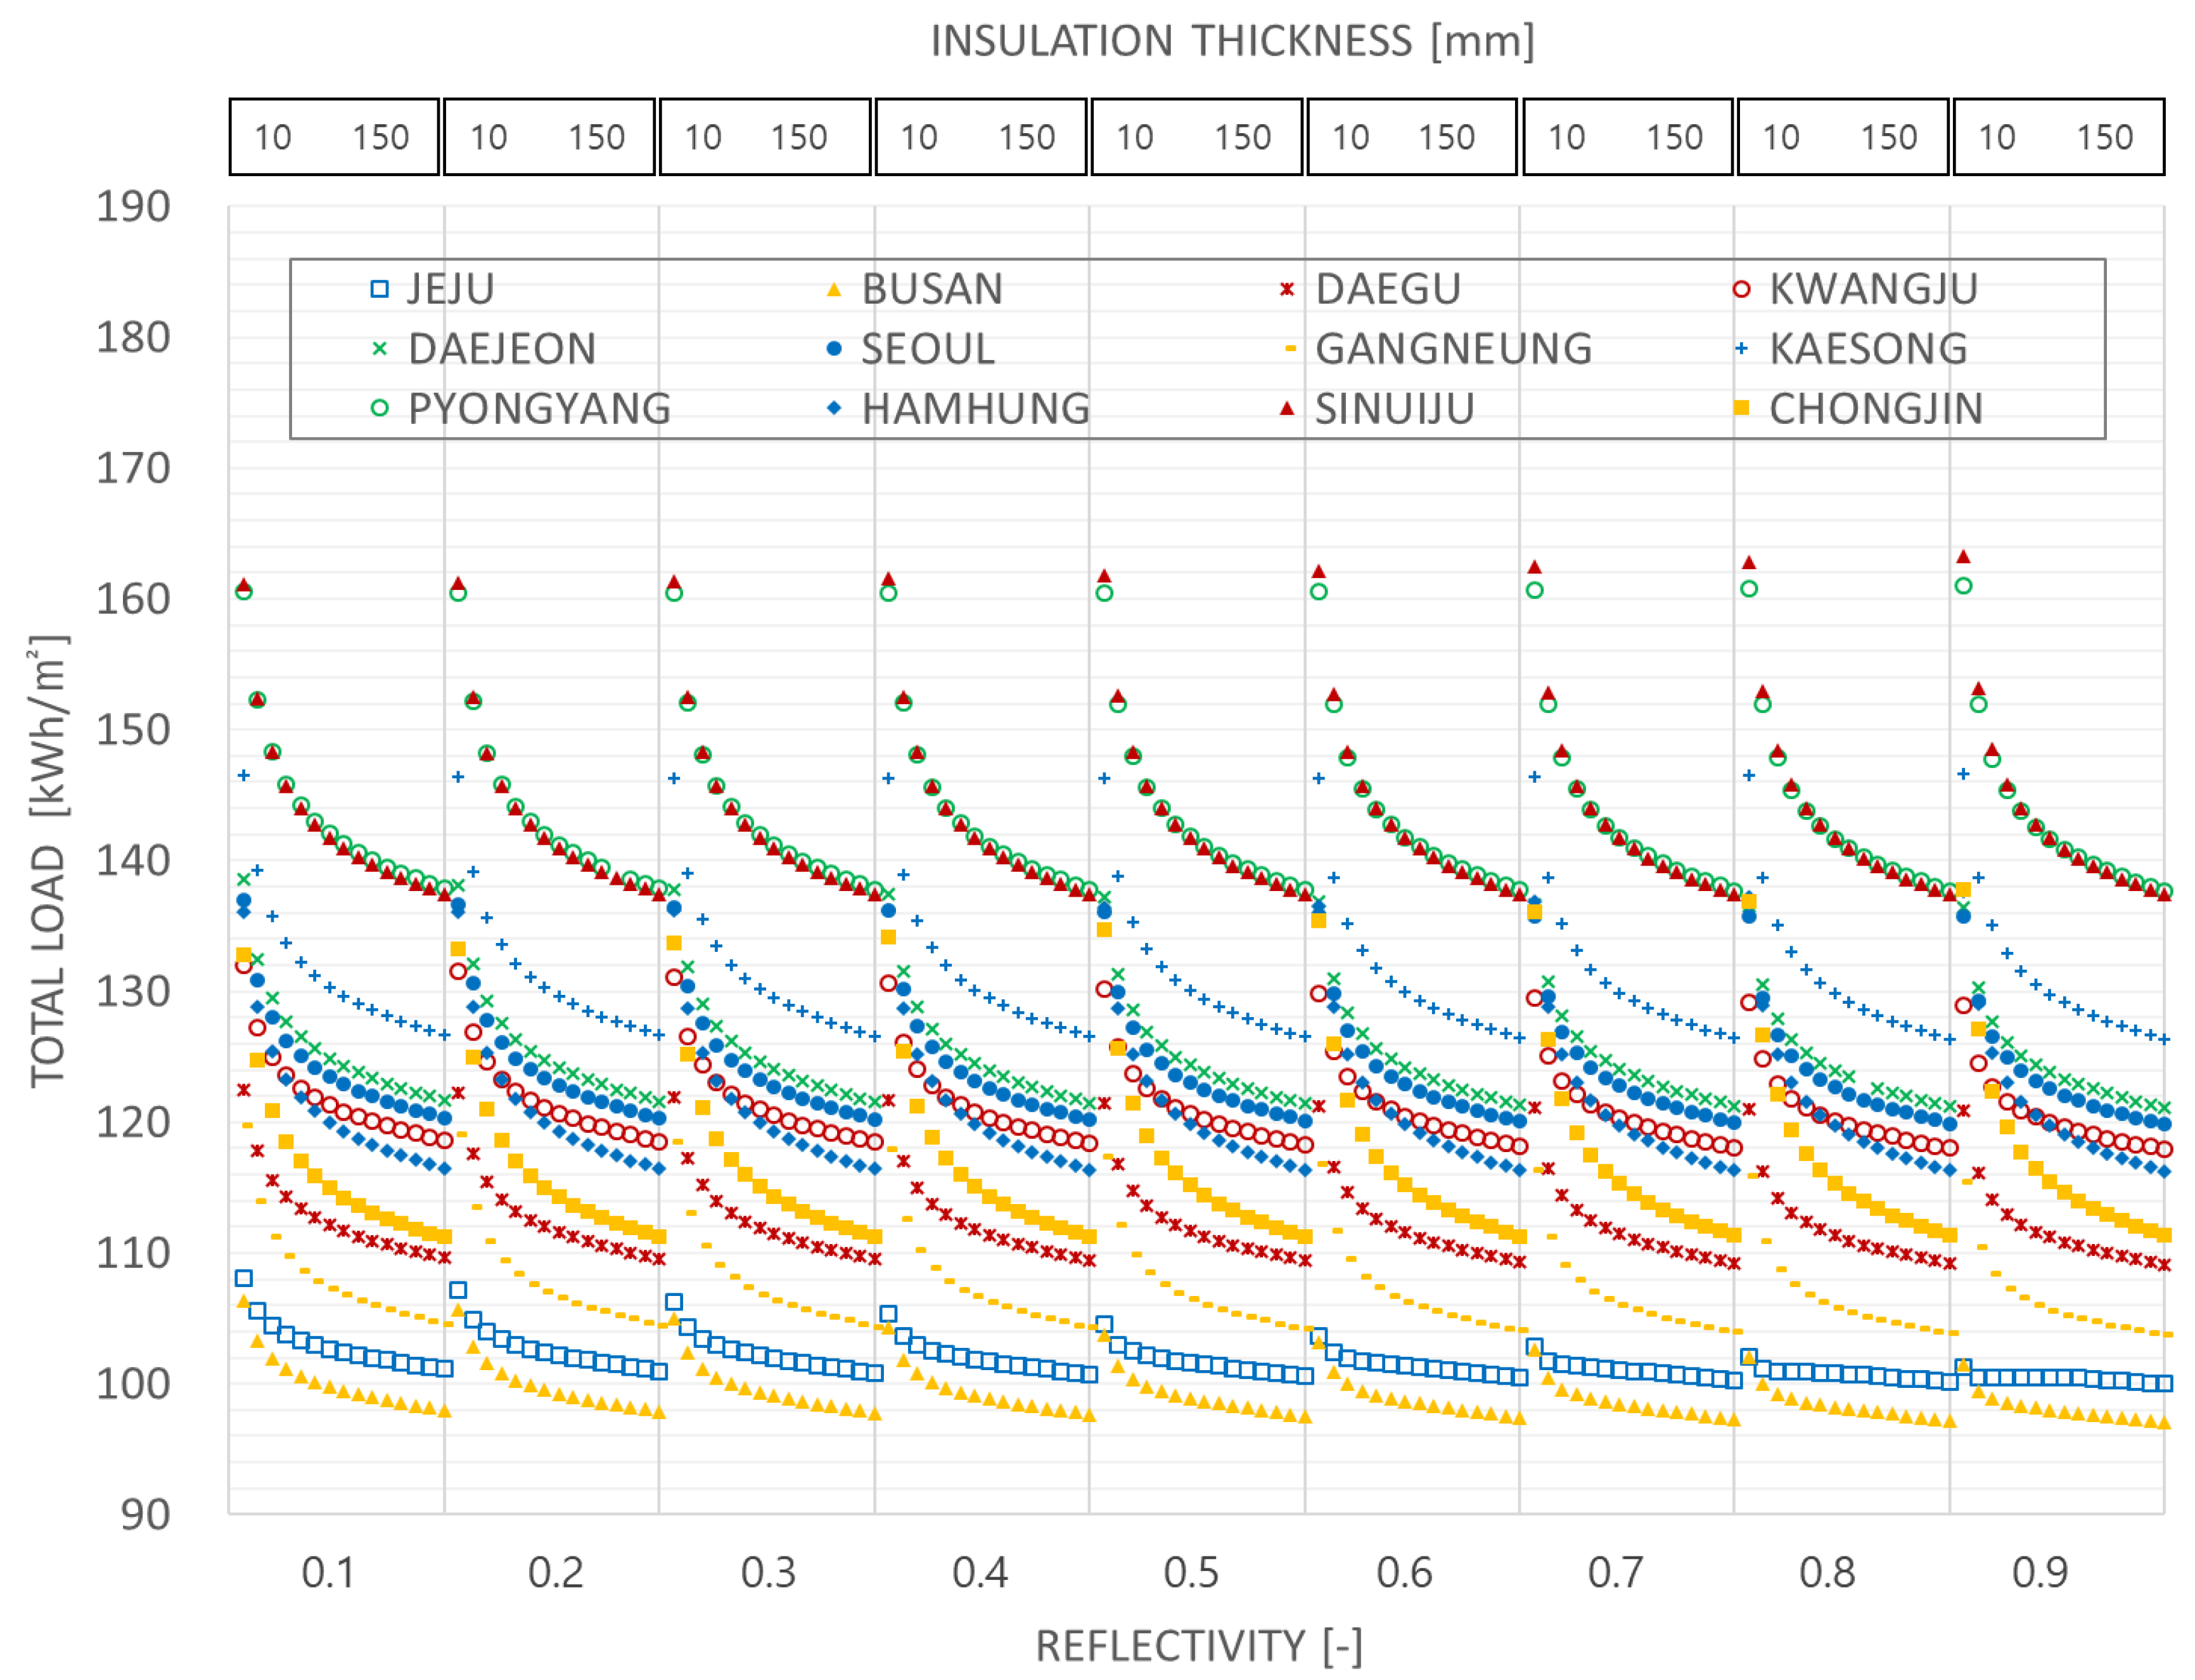
3.1.3. Total Load Results
- The total load of each region can be clearly divided into the western part of the Korean Peninsula (Pyongyang, Sinuiju, Kaesong, Daejeon, Seoul, Kwangju) and the eastern part (Hamhung, Chongjin, Daegu, Gangneung, and Busan), with the western part occupying a larger portion. This finding occurs because the eastern part of the Korean Peninsula is affected by the coastal climate, involving a small daily temperature range and a mild climate.
- The increase and decrease in the reflectivity are based on the different total loads by region. With an increased reflectivity, Chongjin, Sinuiju, Hamhung, Pyongyang and Kaesong exhibited an increased total load, while Jeju, Busan, Gangneung, Kwangju, Daejeon, Daegu and Seoul exhibited a decreased total load. The regions are listed in order of the increase and decrease in the load. Specifically, the regions with high heating load should have lower reflectivity and the regions with high cooling loads higher reflectivity, to reduce each load. In other words, energy saving can be achieved by increasing and decreasing the reflectivity in the southern and northern regions, respectively.
- In all the regions, the total load decreases as the insulation thickness increases.
- A higher latitude corresponds to a greater total load change due to the change in the insulation thickness. In other words, a higher latitude corresponds to a significant effect of the insulation thickness.
- Lower-latitude regions correspond to a reduced total load variation against the change in the insulation thickness.
- The total load is highly dependent on insulation thickness in the thin insulation thickness sector, but becomes less dependent in the thick sector.
- In the case of Jeju Island and Busan, regions with relatively large cooling load and small heating load, the total load is little affected by insulation thickness at high reflectivity.
3.2. Optimal Insulation Thickness and Reflectivity Considering Economics
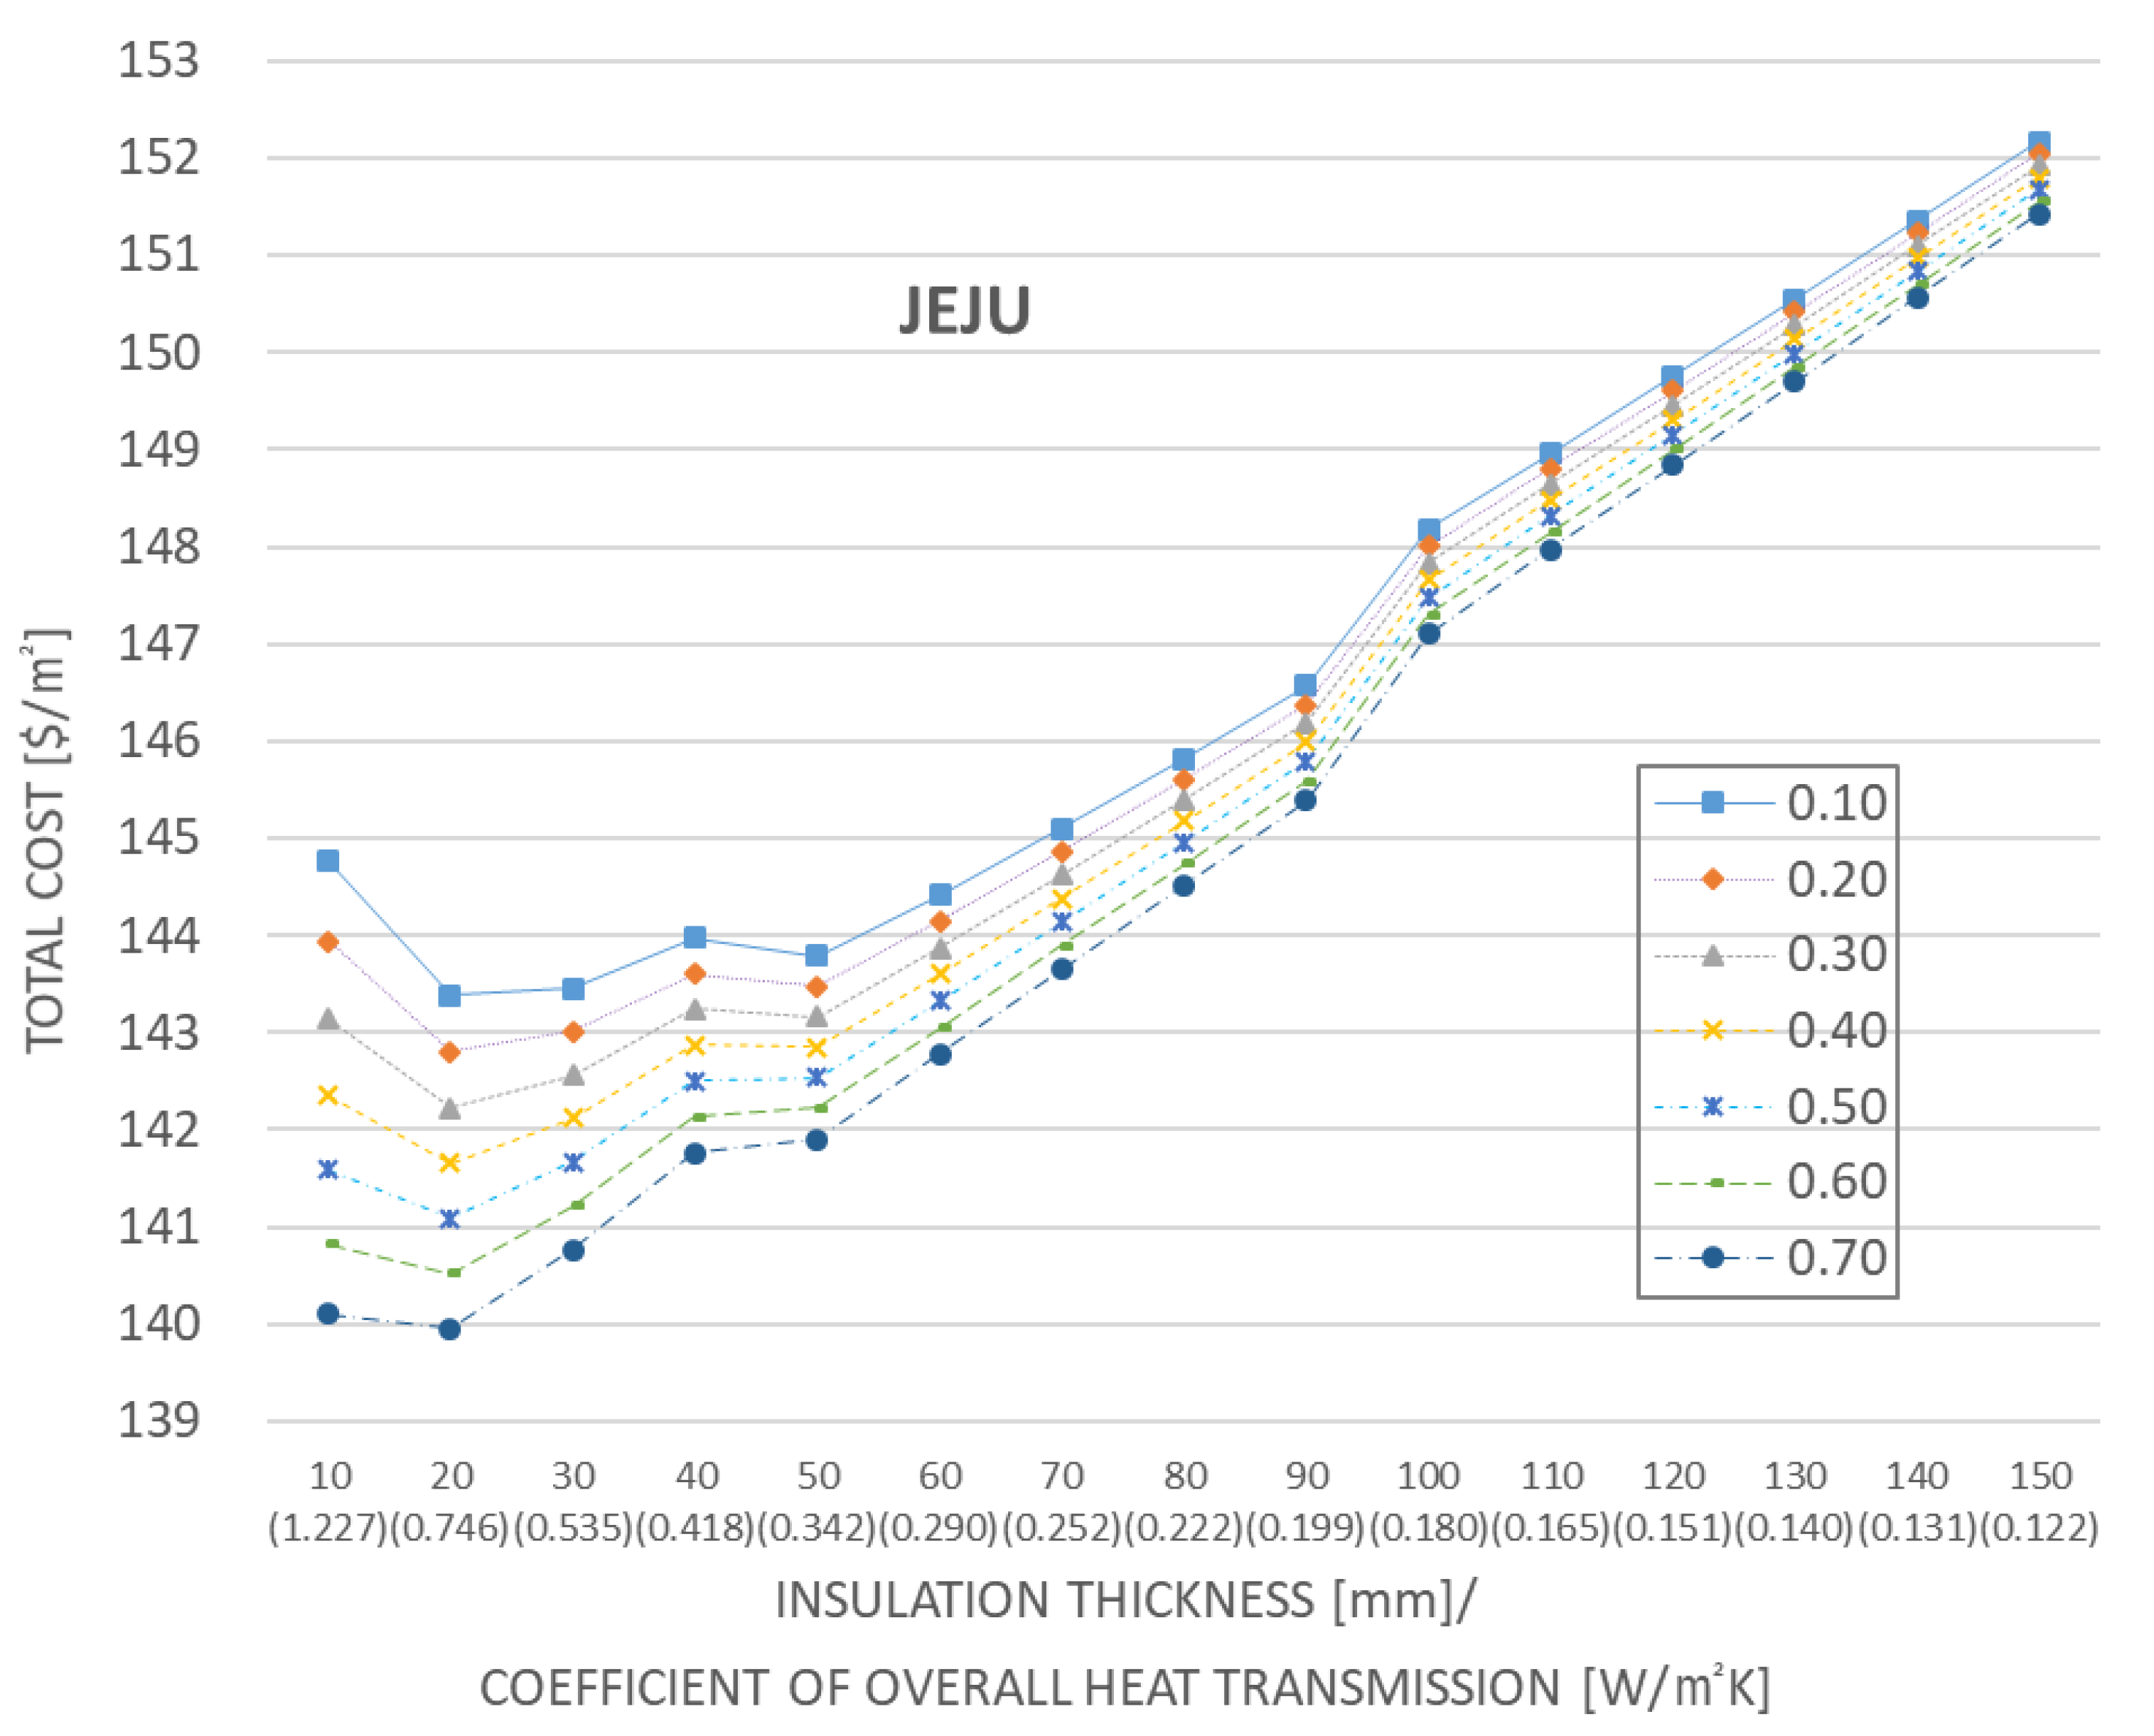
- The total cost mimics the shape of a proportional graph.
- Except for the insulation thickness of 10–20 mm, a thicker insulation corresponds to a higher total cost.
- The change in the total cost for changes in the reflectivity at an arbitrary insulation thickness is relatively large compared to that in the other regions. High reflectivity corresponds to a minimum total cost for all insulation thicknesses. In particular, a thinner insulation corresponds to a greater change in the total cost.
- The lowest total cost combination pertains to an insulation thickness and reflectivity of 20 mm and 0.7, respectively, for Jeju.
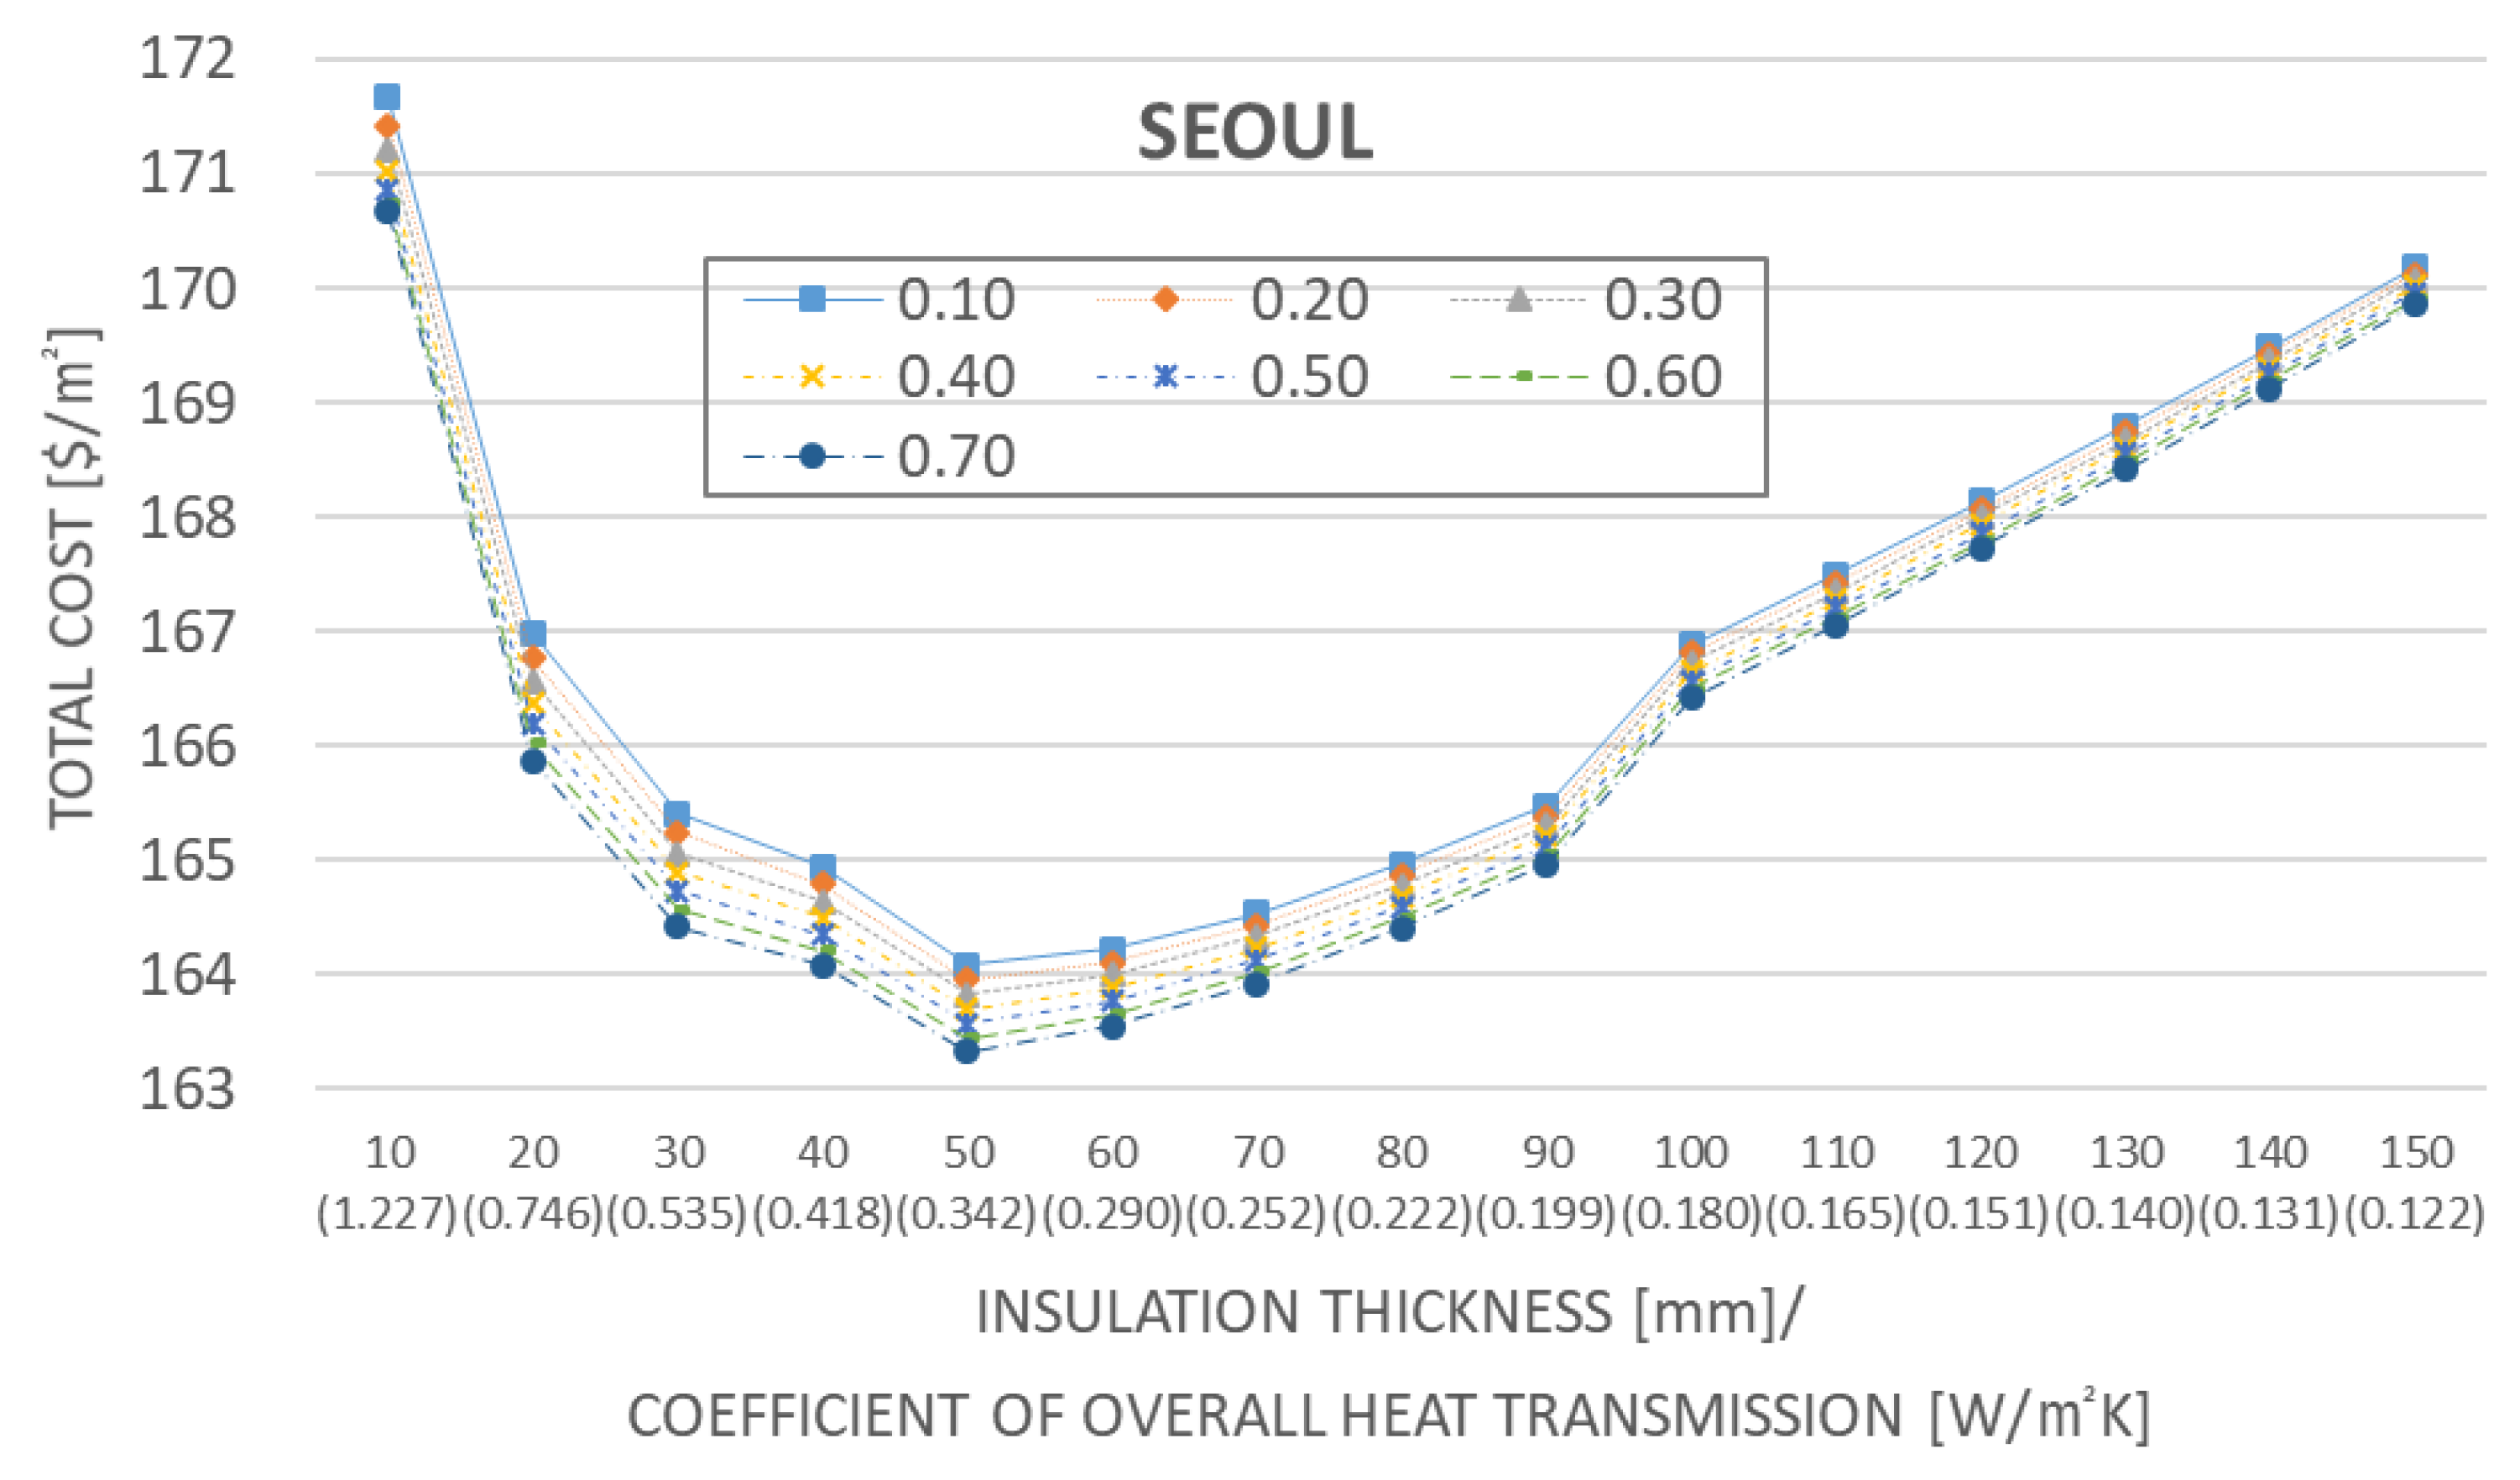
- The shape of the total cost graph is similar to a U-shape.
- The total cost is reduced as the insulation thickness increases from 10 to 50 mm; however, the cost in the subsequent sector increases.
- The cost changes due to the changes in reflectivity are not as large as those in low latitudes. However, the thin sector of the insulation exhibits a relatively large change compared to that in the thick sector.
- The lowest total cost combination pertains to an insulation thickness and reflectivity of 50 mm and 0.7, respectively.
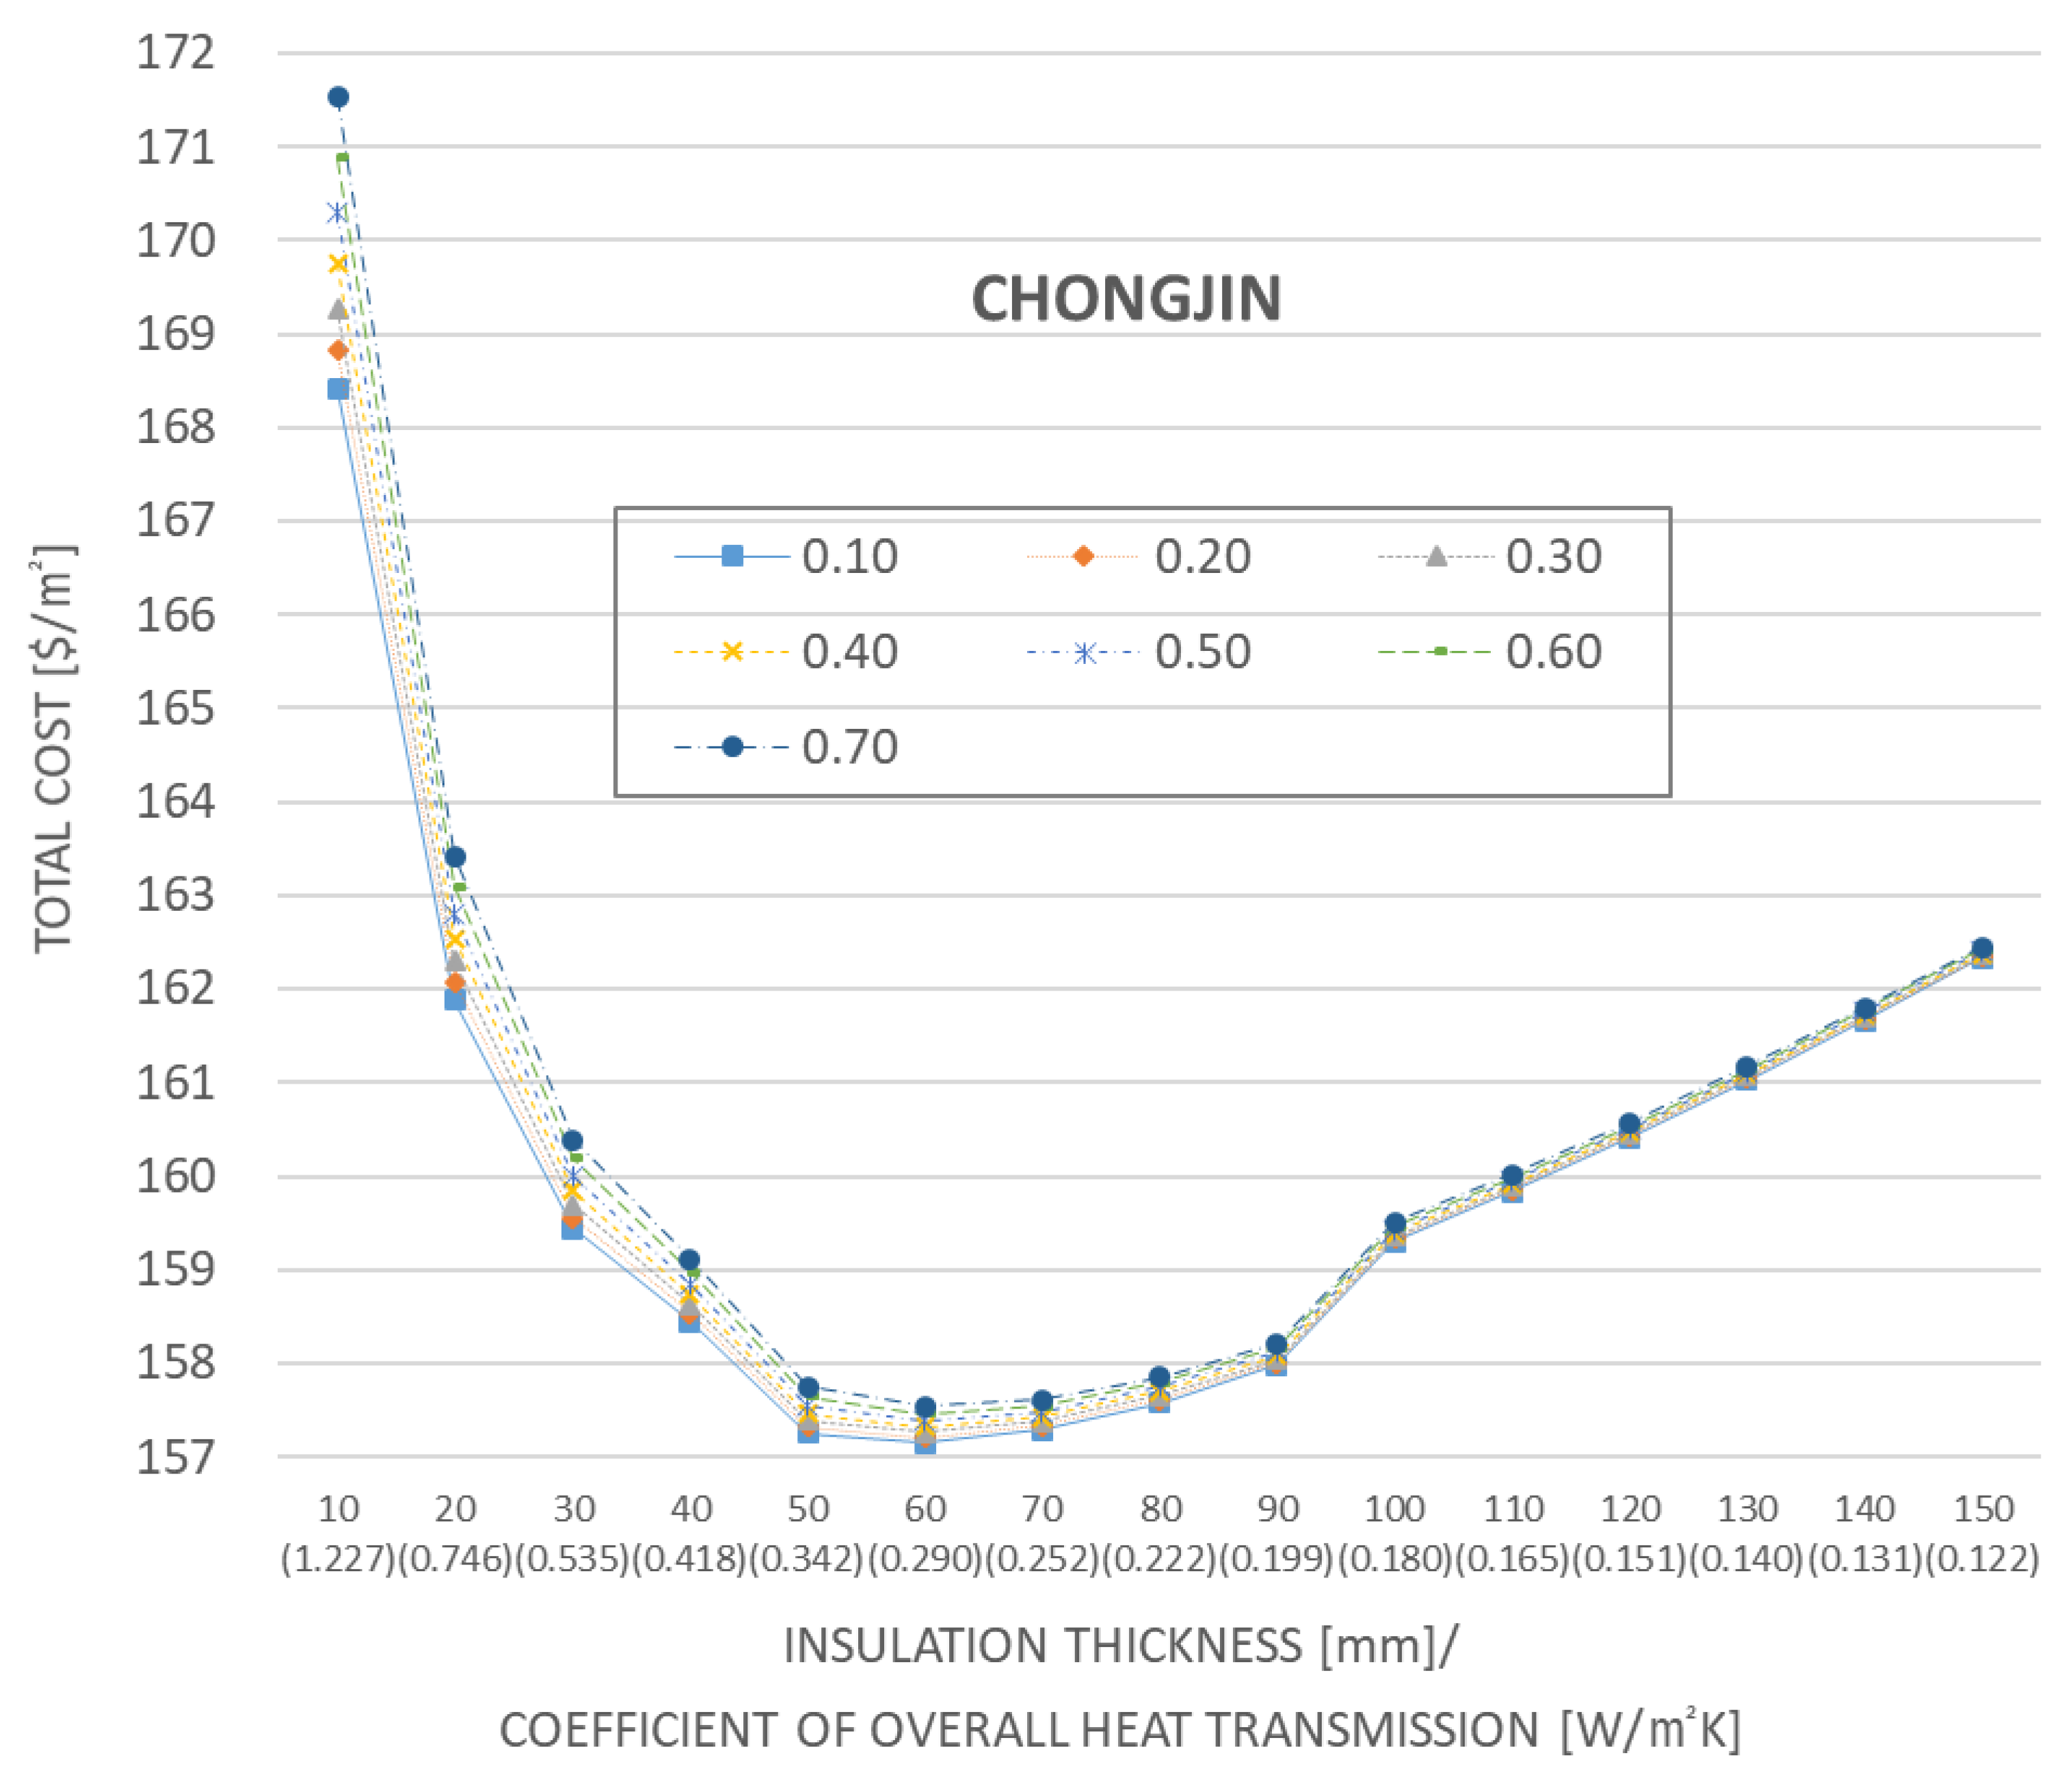
- The shape of the total cost graph is close to the L-shape.
- The total cost decreases as the insulation thickness increases to 60 mm; however, it increases at higher thicknesses.
- The change in the total cost with the change in reflectivity decreases as the thickness of the insulation increases. In particular, a relatively large change can be observed for the insulation thickness of 10–20 mm. In contrast to the low latitude case, a lower reflectivity corresponds to a lower total cost.
- The lowest total cost combination pertains to an insulation thickness and reflectivity of 60 mm and 0.1, respectively.
- High-latitude regions correspond to a higher shift to the right of the optimal insulation thickness.
- The range of total cost due to changes in the insulation thickness varied for the high (approximately 157–172 $/m2), low (approximately 140–152 $/m2) and mid (approximately 163–172 $/m2) latitudes. Therefore, if the high-latitude region, the building is assigned an optimum insulation thickness, and the insulation thickness for the low-latitude building is not larger than the one required, and a relatively large energy saving effect can be expected compared to that in the mid-latitude.
- In all the regions, the total cost changes are significant due to changes in reflectivity in the regions with a thin insulation thickness. This aspect can increase the energy savings in terms of the surface reflectivity in low-latitude regions, as the optimal insulation thickness occurs in sectors thinner than that in the other regions.
- In the low latitude and mid latitude regions, a higher reflectivity corresponds to a lower total cost. However, in high latitudes, a lower reflectivity corresponds to a lower total cost.
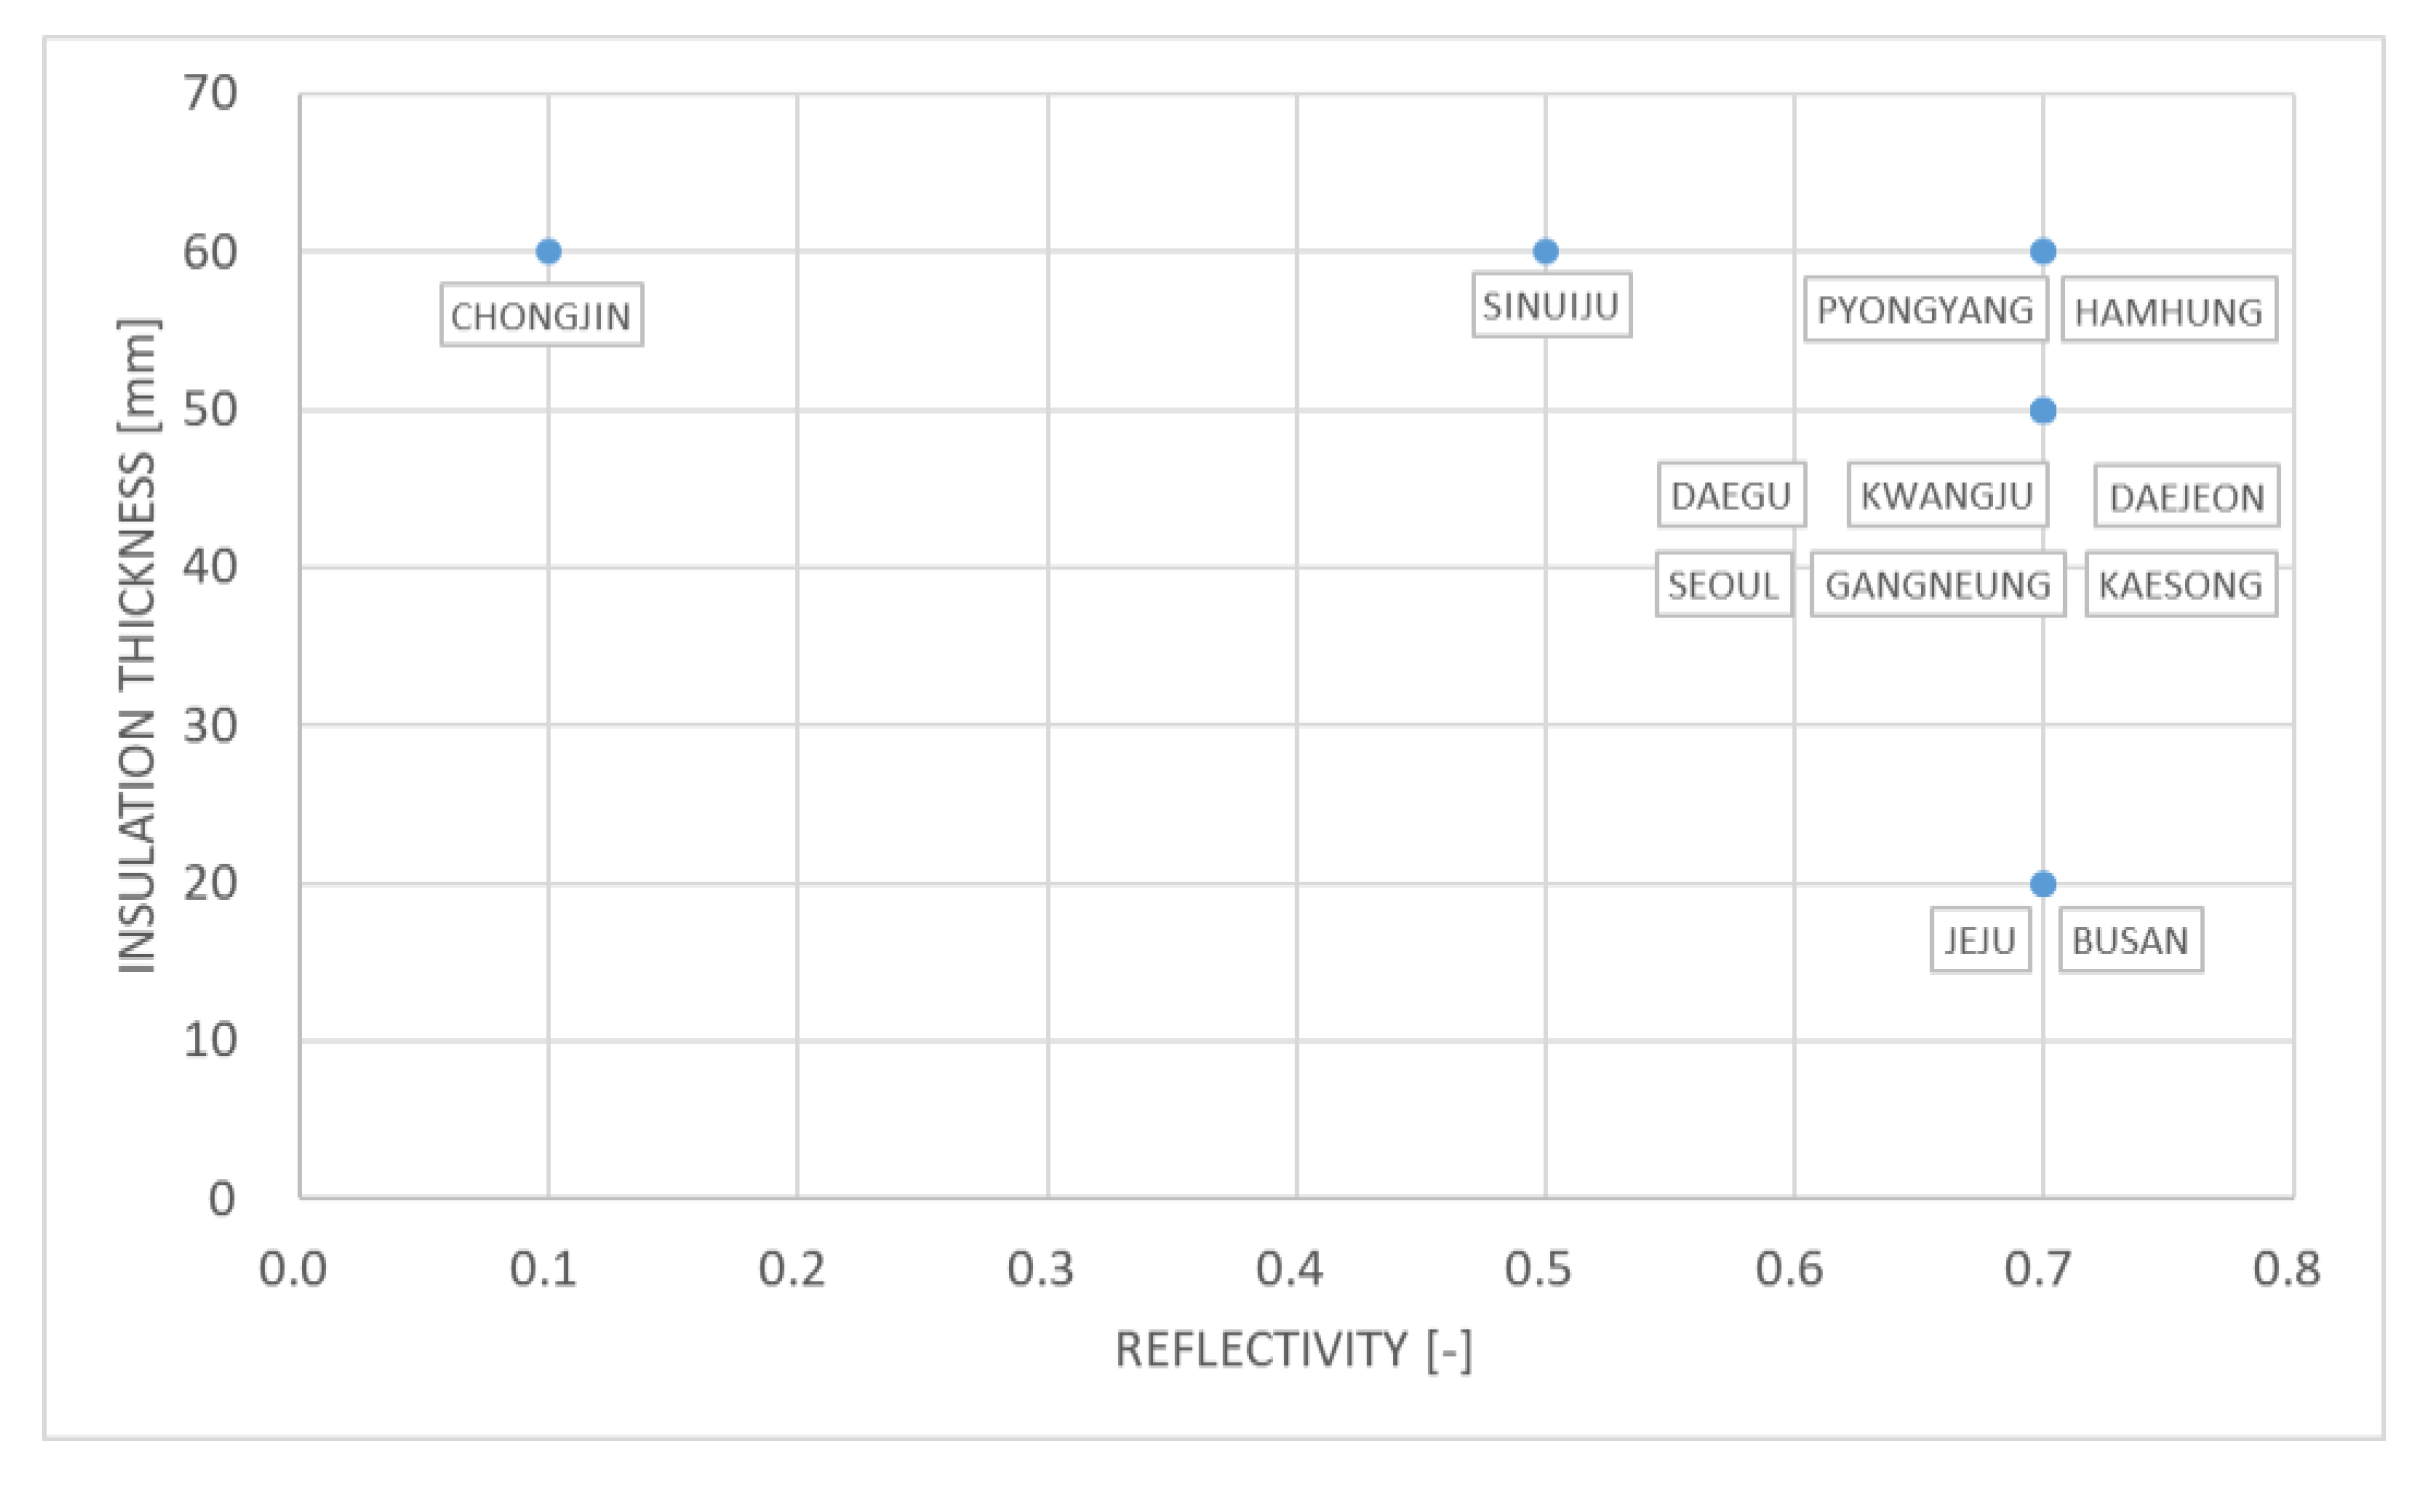
- All the regions except Chongjin (reflectivity 0.1) and Sinuiju (reflectivity 0.5), which are located at high latitudes, exhibited the lowest cost when the reflectivity was high (reflectivity 0.7). Moreover, high-latitude regions with an optimal reflectivity of 0.7 corresponded to a larger optimal insulation thickness.
- Comparing the optimal reflectivity values of the two countries based on Yuan’s research data [27], regions close to the poles had optimal values in the range of low reflectivity, and regions close to the equator had optimal values in the range of high reflectivity. For the central region, the optimum reflectivity was 0.7 in the Korean Peninsula and 0.4–0.6 in Japan, although the two countries are located in similar latitudes.
- When the regions are sorted in order of large cooling loads, in most regions, the optimum reflectivity is high in the order of large cooling loads. However, although Sinuiju exhibited a higher cooling load than Hamhung, it required a lower optimal reflectivity. In terms of the cooling load, Sinuiju exhibited values one step larger than those of Hamhung, but in terms of the heating load, Sinuiju exhibited values three step larger. Therefore, in the case of Sinuiju, the thickness of the insulating materials must be increased, and the reflectivity must be reduced to lower the heating load.
- The high reflectivity of the external wall may reflect sunlight according to the reflective characteristics, creating a glare around the building and vehicle drivers [80,81]. Therefore, a high reflectivity of the exterior walls of the buildings must be accompanied by an environmental impact assessment considering the surrounding environment.
- Sinuiju is located at a lower latitude than Chongjin but requires an optimal insulation thickness larger than that of Chongjin. This phenomenon is likely accompanied by an increase in insulation thickness because Sinuiju has a larger heating load than Chongjin.
- In all regions, the thickness of the optimal insulation material increased in the order of the large heating loads.
- Assuming that the optimal reflectivity is applied to the external wall, the regions for the optimal insulation thickness can be divided into three categories: Jeju and Busan (20 mm); Daegu, Kwangju, Daejeon, Seoul, Gangneung and Kaesong (50 mm); Chongjin, Sinuiju, Pyongyang and Hamhung (60 mm).
4. Conclusions
- According to the analysis of heating and cooling loads in the Korean Peninsula, certain changes were observed in the eastern and western regions as well as the latitude.
- To reduce the cooling load, it is necessary to increase the reflectivity of the external wall and adopt an insulation thickness suitable for that reflectivity. Figure 7 illustrates the appropriate insulation thickness according to the reflectivity of the external wall of the building.
- To reduce the heating load, one must reduce the reflectivity of the external wall and increase the insulation thickness. Figure 8 presents the insulation thicknesses suitable to match the reflectivity of the exterior walls by region.
- To reduce the total load, energy can be saved by increasing and decreasing the reflectivity in the southern region (South Korea) and northern region (North Korea), respectively.
- The total load decreases as the insulation thickness increases in all regions. In particular, high-latitude regions present greater total load changes due to the change in the insulation thickness.
- However, in the case of Jeju Island and Busan, which have relatively large cooling loads and small heating loads, a high reflectivity of the external walls corresponds to a small effect by the increase in the insulation thickness.
Author Contributions
Funding
Institutional Review Board Statement
Informed Consent Statement
Conflicts of Interest
Nomenclature
| Symbols | |
| Af | Floor area of simulation, m2 |
| Ai | Applied area of insulation material, m2 |
| Ar | Applied area of reflectivity material, m2 |
| ACH | Air change per hour, 1/h |
| Ce | Cost of energy consumption over the building life time, $ |
| Ci | Insulation material cost, $ |
| Cim | Cost of insulation material per square meter, $/m2 |
| Cr | Reflectivity material cost, $ |
| Crm | Cost of reflectivity material per square meter, $/m2 |
| Ct | Total cost, $ |
| CDD | Cooling degree day, base 18.3 °C, °C-day |
| COP | Coefficient of performance |
| Ec | Cooling energy consumption per square meter per year, kWh/m2·y |
| Eh | Heating energy consumption per square meter per year, kWh/m2·y |
| Et | Total energy cost per square meter per year, $/m2·y |
| EHP | Electric heat pump |
| Fs | Electricity fee in summer of Korea, $/kWh |
| Fw | Electricity fee in winter of Korea, $/kWh |
| It | Interest rate, % |
| n | Life time of a building, y |
| PF | Phenolic foam |
| PWF | Present worth factor |
| r | Actual interest rate, % |
| RH | Relative humidity, % |
| TMY | Typical meteorological year |
References
- Key World Energy Statistics. 2016. Available online: https://www.oecd-ilibrary.org/energy/key-world-energy-statistics-2016_key_energ_stat-2016-en (accessed on 18 November 2020).
- 2030 Greenhouse Gas Reduction Roadmap Revised and 2018–2020 Emission Rights Allocation Plan Confirmed. Available online: http://www.me.go.kr/home/web/board/read.do?pagerOffset=1170&maxPageItems=10&maxIndexPages=10&searchKey=&searchValue=&menuId=&orgCd=&boardId=886420&boardMasterId=1&boardCategoryId=&decorator= (accessed on 18 November 2020).
- Yi, D.-I. A Study on the Energy Saving System: Focusing on the Energy Saving System in Building Sector. Master’s Thesis, ChungAng University, Seoul, Korea, 2010. [Google Scholar]
- Kim, P.-W. Architecture and Energy: A System for Energy Saving in Buildings—Focused on Regulatory and Promoting Methods. Rev. Arch. Build. Sci. 1986, 30, 58–60. [Google Scholar]
- IEA. Technology Roadmap Energy Efficient Building Envelopes 2013; IEA: Paris, France, 2013. [Google Scholar]
- Zero Energy Building Mandatory Detailed Road Map. Available online: https://zeb.energy.or.kr/BC/BC02/BC02_02_001.do (accessed on 18 November 2020).
- Seo, S.-M.; Park, J.-C.; Rhee, E.-K. An Analysis of Thermal Loads Depending on Korea Building Insulation Standard and the Optimum Insulation Standard. J. Korean Sol. Energy Soc. 2011, 31, 146–155. [Google Scholar] [CrossRef]
- Ascione, F.; De Masi, R.F.; Santamouris, M.; Ruggiero, S.; Vanoli, G.P. Experimental and numerical evalua-tions on the energy penalty of reflective roofs during the heating season for Mediterranean climate. Energy 2018, 144, 178–199. [Google Scholar] [CrossRef]
- Mansouri, O.; Bourbia, F.; Belarbi, R. Influence de la réflectivité de l’enveloppe sur la demande énergétique des bâtiments et sur le confort thermique. Fundam. Eng. Sci. 2018, 18, 33–42. [Google Scholar]
- Saber, H.H.; Maref, W. Energy Performance of Cool Roofs Followed by Development of Practical Design Tool. Front. Energy Res. 2019, 7. [Google Scholar] [CrossRef]
- Saafi, K.; Daouas, N. A life-cycle cost analysis for an optimum combination of cool coating and thermal insulation of residential building roofs in Tunisia. Energy 2018, 152, 925–938. [Google Scholar] [CrossRef]
- Ramamurthy, P.; Sun, T.; Rule, K.; Bou-Zeid, E. The joint influence of albedo and insulation on roof performance: A modeling study. Energy Build. 2015, 102, 317–327. [Google Scholar] [CrossRef]
- Ucar, A.; Balo, F. Determination of the energy savings and the optimum insulation thickness in the four different insulated exterior walls. Renew. Energy 2010, 35, 88–94. [Google Scholar] [CrossRef]
- Yu, J.; Yang, C.; Tian, L.; Liao, D. A study on optimum insulation thicknesses of external walls in hot summer and cold winter zone of China. Appl. Energy 2009, 86, 2520–2529. [Google Scholar] [CrossRef]
- Ozel, M. Thermal performance and optimum insulation thickness of building walls with different structure materials. Appl. Therm. Eng. 2011, 31, 3854–3863. [Google Scholar] [CrossRef]
- Kaynakli, O. A study on residential heating energy requirement and optimum insulation thickness. Renew. Energy 2008, 33, 1164–1172. [Google Scholar] [CrossRef]
- Nematchoua, M.K.; Raminosoa, C.R.R.; Mamiharijaona, R.; René, T.; Orosa, J.A.; Elvis, W.; Meukam, P. Study of the economical and optimum thermal insulation thickness for buildings in a wet and hot tropical climate: Case of Cameroon. Renew. Sustain. Energy Rev. 2015, 50, 1192–1202. [Google Scholar] [CrossRef]
- Daouas, N.; Hassen, Z.; Aissia, H.B. Analytical periodic solution for the study of thermal performance and optimum insulation thickness of building walls in Tunisia. Appl. Therm. Eng. 2010, 30, 319–326. [Google Scholar] [CrossRef]
- Wati, E.; Meukam, P.; Nematchoua, M.K. Influence of external shading on optimum insulation thickness of building walls in a tropical region. Appl. Therm. Eng. 2015, 90, 754–762. [Google Scholar] [CrossRef]
- Dombaycı, Ö.A.; Gölcü, M.; Pancar, Y. Optimization of insulation thickness for external walls using different energy-sources. Appl. Energy 2006, 83, 921–928. [Google Scholar] [CrossRef]
- Kayfeci, M.; Keçebaş, A.; Gedik, E. Determination of optimum insulation thickness of external walls with two different methods in cooling applications. Appl. Therm. Eng. 2013, 50, 217–224. [Google Scholar] [CrossRef]
- Çomaklı, K.; Yüksel, B. Environmental impact of thermal insulation thickness in buildings. Appl. Therm. Eng. 2004, 24, 933–940. [Google Scholar] [CrossRef]
- del Coz Díaz, J.J.; García Nieto, P.J.; Betegón Biempica, C.; Prendes Gero, M.B. Analysis and optimization of the heat-insulating light concrete hollow brick walls design by the finite element method. Appl. Therm. Eng. 2007, 27, 1445–1456. [Google Scholar] [CrossRef]
- Al-Khawaja, M.J. Determination and selecting the optimum thickness of insulation for buildings in hot countries by accounting for solar radiation. Appl. Therm. Eng. 2004, 24, 2601–2610. [Google Scholar] [CrossRef]
- Ozel, M. The influence of exterior surface solar absorptivity on thermal characteristics and optimum insulation thickness. Renew. Energy 2012, 39, 347–355. [Google Scholar] [CrossRef]
- Mansouri, O.; Belarbi, R.; Bourbia, F. Albedo effect of external surfaces on the energy loads and thermal comfort in buildings. Energy Procedia 2017, 139, 571–577. [Google Scholar] [CrossRef]
- Yuan, J.; Farnham, C.; Emura, K.; Alam, M.A. Proposal for optimum combination of reflectivity and insulation thickness of building exterior walls for annual thermal load in Japan. Build. Environ. 2016, 103, 228–237. [Google Scholar] [CrossRef]
- Domestic Climate Data of Korea. Available online: http://www.weather.go.kr/weather/climate/average_regional.jsp (accessed on 18 November 2020).
- Korea Meteorological Administration. 1981~2010 the Climate Atlas of Korea; Korea Meteorological Administration: Seoul, Korea, 2012. [Google Scholar]
- Korea Meteorological Administration Seoul. Annual Climatological Report of North Korea; Korea Meteorological Administration Seoul: Seoul, Korea, 2016. [Google Scholar]
- Korea Meteorological Administration. 30 Years of North Korean Meteorological (1981–2010); Korea Meteorological Administration: Seoul, Korea, 2012. [Google Scholar]
- Climate Details. Available online: https://en.wikipedia.org/wiki/Climate_of_Seoul (accessed on 18 November 2020).
- Korea Energy Agency. A Study on the Improvement of the Total Energy Consumption Criteria in Korea; Korea Energy Agency: Ulsan, Korea, 2019.
- Kaynakli, O. A review of the economical and optimum thermal insulation thickness for building applications. Renew. Sustain. Energy Rev. 2012, 16, 415–425. [Google Scholar] [CrossRef]
- Liu, X.; Chen, Y.; Ge, H.; Fazio, P.; Chen, G.; Guo, X. Determination of optimum insulation thickness for building walls with moisture transfer in hot summer and cold winter zone of China. Energy Build. 2015, 109, 361–368. [Google Scholar] [CrossRef]
- Alsayed, M.F.; Tayeh, R.A. Life cycle cost analysis for determining optimal insulation thickness in Palestinian buildings. J. Build. Eng. 2019, 22, 101–112. [Google Scholar] [CrossRef]
- Sagbansua, L.; Balo, F. Ecological impact & financial feasibility of Energy Recovery (EIFFER) Model for natural insulation material optimization. Energy Build. 2017, 148, 1–14. [Google Scholar] [CrossRef]
- Kurekci, N.A. Determination of optimum insulation thickness for building walls by using heating and cooling degree-day values of all Turkey’s provincial centers. Energy Build. 2016, 118, 197–213. [Google Scholar] [CrossRef]
- Sisman, N.; Kahya, E.; Aras, N.; Aras, H. Determination of optimum insulation thicknesses of the external walls and roof (ceiling) for Turkey’s different degree-day regions. Energy Policy 2007, 35, 5151–5155. [Google Scholar] [CrossRef]
- Bektas Ekici, B.; Aytac Gulten, A.; Aksoy, U.T. A study on the optimum insulation thicknesses of various types of external walls with respect to different materials, fuels and climate zones in Turkey. Appl. Energy 2012, 92, 211–217. [Google Scholar] [CrossRef]
- Yu, J.; Tian, L.; Yang, C.; Xu, X.; Wang, J. Optimum insulation thickness of residential roof with respect to solar-air degree-hours in hot summer and cold winter zone of china. Energy Build. 2011, 43, 2304–2313. [Google Scholar] [CrossRef]
- Cuce, E.; Cuce, P.M.; Wood, C.J.; Riffat, S.B. Optimizing insulation thickness and analysing environmental impacts of aerogel-based thermal superinsulation in buildings. Energy Build. 2014, 77, 28–39. [Google Scholar] [CrossRef]
- Fumo, N.; Mago, P.; Luck, R. Methodology to estimate building energy consumption using EnergyPlus Benchmark Models. Energy Build. 2010, 42, 2331–2337. [Google Scholar] [CrossRef]
- Henninger, R.H.; Witte, M.J.; Crawley, D.B. Analytical and comparative testing of EnergyPlus using IEA HVAC BESTEST E100–E200 test suite. Energy Build. 2004, 36, 855–863. [Google Scholar] [CrossRef]
- Eskin, N.; Türkmen, H. Analysis of annual heating and cooling energy requirements for office buildings in different climates in Turkey. Energy Build. 2008, 40, 763–773. [Google Scholar] [CrossRef]
- Amiri Rad, E.; Fallahi, E. Optimizing the insulation thickness of external wall by a novel 3E (energy, environmental, economic) method. Constr. Build. Mater. 2019, 205, 196–212. [Google Scholar] [CrossRef]
- U.S. DoE. EnergyPlus Version 8.9.0 Documentation Engineering Reference, 2018. Available online: https://energyplus.net/sites/all/modules/custom/nrel_custom/pdfs/pdfs_v8.9.0/EngineeringReference.pdf (accessed on 12 March 2021).
- Climate Data (TMYx 2004~2018). Available online: http://climate.onebuilding.org/WMO_Region_2_Asia/KOR_South_Korea/ (accessed on 18 November 2020).
- National Climatic Data Center. Typical Meteorological Year User’s Manual TD-9734: Hourly Solar Radiation-Surface Meteorological Observations; NCDC: Asheville, NC, USA, 1981.
- Siu, C.Y.; Liao, Z. Is building energy simulation based on TMY representative: A comparative simulation study on doe reference buildings in Toronto with typical year and historical year type weather files. Energy Build. 2020, 211, 109760. [Google Scholar] [CrossRef]
- Korea Energy Agency. The revision of the Regulations on the Operation of Energy Efficiency Rating System for Buildings in Korea Energy Corporation; Korea Energy Agency: Ulsan, Korea, 2016.
- Minister of Land Infrastructure and Transport Korea. Air Conditioning Load Calculation Design Criteria KDS 31 25 06; Minister of Land Infrastructure and Transport Korea: Sejong, Korea, 2016. [Google Scholar]
- Minister of Land, Infrastructure and Transport Korea. National Construction Standards-2016 Design Criteria for Building Machinery Equipment; Minister of Land Infrastructure and Transport Korea: Sejong, Korea, 2016. [Google Scholar]
- Korea Energy Agency. Detailed Guidelines for Energy Efficiency Rating of Buildings in Korea Energy Corporation; Korea Energy Agency: Ulsan, Korea, 2020.
- Rules on the Standards, etc. of Facilities in Buildings. Available online: http://www.law.go.kr/%EB%B2%95%EB%A0%B9/%EA%B1%B4%EC%B6%95%EB%AC%BC%EC%9D%98%20%EC%84%A4%EB%B9%84%EA%B8%B0%EC%A4%80%20%EB%93%B1%EC%97%90%20%EA%B4%80%ED%95%9C%20%EA%B7%9C%EC%B9%99 (accessed on 18 November 2020).
- Al-Sanea, S.A.; Zedan, M.F.; Al-Ajlan, S.A.; Abdul Hadi, A.S. Heat Transfer Characteristics and Optimum Insulation Thickness for Cavity Walls. J. Therm. Envel. Build. Sci. 2003, 26, 285–307. [Google Scholar] [CrossRef]
- Minister of Land, Infrastructure and Transport Korea. Standard Product Estimation for Construction Projects 2019—Construction Technology Information System. Available online: https://www.codil.or.kr/helpdesk/read.do?bbsId=BBSMSTR_900000000202&nttId=11952&searchWrd= (accessed on 18 November 2020).
- Aytaç, A.; Aksoy, U. The relation between optimum insulation thickness and heating cost on external walls for energy saving. J. Fac. Eng. Archit. Gazi Univ. 2006, 21, 753–758. [Google Scholar]
- Bolattürk, A. Optimum insulation thicknesses for building walls with respect to cooling and heating degree-hours in the warmest zone of Turkey. Build. Environ. 2008, 43, 1055–1064. [Google Scholar] [CrossRef]
- Derradji, L.; Imessad, K.; Amara, M.; Boudali Errebai, F. A study on residential energy requirement and the effect of the glazing on the optimum insulation thickness. Appl. Therm. Eng. 2017, 112, 975–985. [Google Scholar] [CrossRef]
- Korea Electric Power Corporation. Electric Rates Table. Available online: http://cyber.kepco.co.kr/ckepco/front/jsp/CY/E/E/CYEEHP00101.jsp (accessed on 18 November 2020).
- IMF. 2010–2019 Korea Average Consumer Price Growth Rate. Available online: https://tradingeconomics.com/south-korea/inflation-cpi (accessed on 18 November 2020).
- Bank of Korea. 2010–2019 Base Rate Trend. Available online: https://www.bok.or.kr/portal/singl/baseRate/list.do?dataSeCd=01&menuNo=200643 (accessed on 18 November 2020).
- Enforcement Rules of the Corporate Tax Act of the Ministry of Government Legislation, the Scope of the Standard Useful Life and the Scope of the Useful Life. Available online: http://www.law.go.kr/%EB%B2%95%EB%A0%B9/%EB%B2%95%EC%9D%B8%EC%84%B8%EB%B2%95%20%EC%8B%9C%ED%96%89%EA%B7%9C%EC%B9%99 (accessed on 18 November 2020).
- Zhang, Y.; Long, E.; Li, Y.; Li, P. Solar Radiation Reflective Coating Material on Building Envelopes: Heat Transfer Analysis and Cooling Energy Saving. Energy Explor. Exploit. 2017, 35, 748–766. [Google Scholar] [CrossRef]
- D’Orazio, M.; Di Perna, C.; Di Giuseppe, E. The effects of roof covering on the thermal performance of highly insulated roofs in Mediterranean climates. Energy Build. 2010, 42, 1619–1627. [Google Scholar] [CrossRef]
- Kisilewicz, T. On the Role of External Walls in the Reduction of Energy Demand and the Mitigation of Human Thermal Discomfort. Sustainability 2019, 11, 1061. [Google Scholar] [CrossRef]
- Chvatal, K.M.S.; Corvacho, H. The Impact of Increasing the Building Envelope Insulation upon the Risk of Overheating in Summer and an Increased Energy Consumption. J. Build. Perform. Simul. 2009, 2, 267–282. [Google Scholar] [CrossRef]
- Mulville, M.; Stravoravdis, S. The Impact of Regulations on Overheating Risk in Dwellings. Build. Res. Inf. 2016, 44, 520–534. [Google Scholar] [CrossRef]
- Overheating in Commercial Buildings—Waverley. Available online: https://www.waverley.co.uk/overheating-in-commercial-office-buildings-blinds/ (accessed on 2 March 2021).
- Insulation. Available online: https://www.energy.gov/energysaver/weatherize/insulation (accessed on 2 March 2021).
- Kameni Nematchoua, M.; Ricciardi, P.; Reiter, S.; Yvon, A. A Comparative Study on Optimum Insulation Thickness of Walls and Energy Savings in Equatorial and Tropical Climate. Int. J. Sustain. Built Environ. 2017, 6, 170–182. [Google Scholar] [CrossRef]
- Aktemur, C.; Atikol, U. Optimum Insulation Thickness for the Exterior Walls of Buildings in Turkey Based on Different Materials, Energy Sources and Climate Regions. Int. J. Eng. Technol. Ijet 2017, 3, 72–82. [Google Scholar] [CrossRef][Green Version]
- Wang, C.; Guo, X.; Zhu, Y. Energy saving with optic-variable wall for stable air temperature control. Energy 2019, 173, 38–47. [Google Scholar] [CrossRef]
- Hernández-Pérez, I.; Xamán, J.; Macías-Melo, E.V.; Aguilar-Castro, K.M. Reflective Materials for Cost-Effective Energy-Efficient Retrofitting of Roofs. In Cost-Effective Energy Efficient Building Retrofitting; Elsevier: Amsterdam, The Netherlands, 2017; pp. 119–139. [Google Scholar] [CrossRef]
- Dominguez-Delgado, A.; Domínguez-Torres, H.; Domínguez-Torres, C.-A. Energy and Economic Life Cycle Assessment of Cool Roofs Applied to the Refurbishment of Social Housing in Southern Spain. Sustainability 2020, 12, 5602. [Google Scholar] [CrossRef]
- Berardi, U.; Tronchin, L.; Manfren, M.; Nastasi, B. On the Effects of Variation of Thermal Conductivity in Buildings in the Italian Construction Sector. Energies 2018, 11, 872. [Google Scholar] [CrossRef]
- Mahlia, T.M.I.; Taufiq, B.N.; Ismail; Masjuki, H.H. Correlation between Thermal Conductivity and the Thickness of Selected Insulation Materials for Building Wall. Energy Build. 2007, 39, 182–187. [Google Scholar] [CrossRef]
- Yuan, J. Impact of Insulation Type and Thickness on the Dynamic Thermal Characteristics of an External Wall Structure. Sustainability 2018, 10, 2835. [Google Scholar] [CrossRef]
- Lee, K.H.; Lee, H.S.; Lee, Y.G. A study on the environmental performance using the reflective glass as building envelope material. J. Archit. Inst. Korea 1994, 10, 167–173. [Google Scholar]
- Choi, J.B. An Evaluation on the Reflected Sunlight Glare by Field Measurements and Surveys Analysis. Master’s Thesis, Korea National University of Transportation, Choongbuk, Korea, 2019. [Google Scholar]


| Aspect | Present Study | Yuan [27] | |
|---|---|---|---|
| Analysis program | ENERGY+ | HASP/ACLD-B | |
| Climatic data | IWEC, Korean Peninsula (Latitude 33–43° N) | Japan (Latitude 26–43° N) | |
| Simulation model | Standard Building | - | |
| Purpose | Office (medium size) | Office | |
| Conditioned area | 582 m2 | 605 m2 | |
| Parameter value | Insulation | 10 to 150 mm (10 mm spacing) | 10 to 100 mm (10 mm spacing) |
| Reflectivity | 0.1–0.9 (0.1 interval) | ||
| Applicable law | Korea (Energy Saving Design Criteria): Central 1 (Wall: 0.17 and Window: 1.3) | Japan (Act on the Rational Use of Energy) | |
| Economic analysisdata | Korea Market (2020) | Japan Market (2015) | |
| Material price | Including labor | - | |
| Electricity cost | Summer: 0.08 $/kWh Winter: 0.07 $/kWh (2019) | 0.18 $/kWh (2015) | |
| Inflation rate | Rise of inflation: 1.72% (IMF 2010–2019) | Energy cost increase rate: 0.73% (IMF) | |
| Interest rate | 2.05% (Korea Bank, 2010–2019) | 2.4% (Cooperative Association DDK) | |
| Period | 40 y | 10 y | |
| City | Latitude (°N), Longitude (°E) | Climate | Temperature (°C) | ||||
|---|---|---|---|---|---|---|---|
| Mean | Max (Aug) | Min (Jan) | |||||
| Av | Hi | Av | Lo | ||||
| Jeju | 33.30, 126.31 | Humid subtropical climate. Winters are cool and dry, while summers are hot, humid and sometimes rainy. Usually windy. | 15.5 | 18.7 | 35.5 | 12.4 | −5.8 |
| Busan | 35.06, 129.01 | Cooler version of a humid subtropical climate. Extremely high or low temperatures are rare. | 14.7 | 18.9 | 37.3 | 11.3 | −10.2 |
| Daegu | 35.53, 128.37 | Cooler version of a humid subtropical climate. Warm temperate, moist forest climate. Basin climate characteristics in summer. | 14.1 | 19.5 | 38.1 | 9.5 | −13 |
| Kwangju | 35.10, 126.53 | Close to the west coast. In winter, snowfall occurs because of west-north or west winds. | 13.8 | 19.1 | 37.2 | 9.5 | −11.7 |
| Daejeon | 36.22, 127.22 | Monsoon-influenced, humid subtropical and humid continental climatic regimens. | 13.0 | 18.4 | 37.6 | 8.3 | −17 |
| Seoul | 37.34, 126.57 | Humid subtropical climate influenced by the monsoons. | 12.5 | 17 | 36.6 | 8.6 | −18 |
| Gang- neung | 37.45, 128.53 | Humid subtropical climate with cool to cold winters and hot, humid summers. Because this is a coastal city, generally milder winters and relatively cooler summers than the rest of Korea are experienced. Warmer than the west coast at the same latitude in winter. | 13.1 | 17.5 | 35.5 | 9.2 | −14.7 |
| Kaesong | 37.58, 126.34 | Humid continental climate, with cold, dry winters and hot, humid summers with abundant rainfall. | 11.0 | 16.3 | 35.5 | 6.6 | −17.9 |
| Pyong- yang | 39.02, 125.47 | Hot-summer humid continental climate, featuring warm to hot, humid summers and cold, dry winters. Cold, dry winds can blow from Siberia in winter, making conditions extremely cold. | 10.6 | 15.9 | 34.4 | 6.0 | −18.8 |
| Hamhung | 39.56, 127.33 | Humid continental climate, with warm, humid summers and moderately cold, dry winters. | 10.3 | 16.0 | 35.9 | 5.4 | −20.4 |
| Sinuiju | 40.06, 124.23 | Monsoonal humid continental climate with hot, humid and stormy summers and cold, dry winters with little snowfall. | 9.8 | 15.0 | 35.5 | 5.6 | −20 |
| Chongjin | 41.47, 129.49 | Humid continental climate with cold, dry winters and warm, rainy summers. | 8.4 | 12.7 | 32.4 | 4.5 | −14.3 |
| Item | Detail | |
|---|---|---|
| Building scale | Total floor area: 6147 m2 (five floors above ground, two basement levels) | |
| Orientation | South | |
| Construction material | Reinforced concrete | |
| Aspect ratio | 1.46 | |
| Mid-level floor area | 786 m2 (air-conditioned area) | |
| Core position | Side | |
| Floor height | 4.02 m (Ceiling height: 2.7 m) | |
| Window to wall ratio | East: 22%, West: 25%, South: 31%, North: 19% | |
| Zone ratio | Office 38.5%, Meeting 3.8%, Storage 5.1%, EV and Corridor 26.9%, Others 25.7% | |
| Insulation | Wall | PF board (0.232 W/m2K) |
| Roof | Rigid polyurethane (0.127 W/m2K) | |
| Floor | Rigid polyurethane (0.173 W/m2K) | |
| City | Latitude (°N) | Longitude (°E) | Elevation (m) | Heat/Cool Degree-Days (℃ d) | |
|---|---|---|---|---|---|
| HDD 18.3 | CDD 18.3 | ||||
| Busan | 35.100 | 129.033 | 71 | 1862 | 717 |
| Daegu | 35.883 | 128.617 | 61 | 2185 | 862 |
| Daejeon | 36.300 | 127.400 | 78 | 2682 | 696 |
| Jeju | 33.517 | 126.533 | 23 | 1647 | 823 |
| Kwangju | 35.167 | 126.900 | 74 | 2261 | 812 |
| Seoul | 37.567 | 126.967 | 87 | 2684 | 736 |
| Chongjin | 41.783 | 129.817 | 43 | 3776 | 232 |
| Hamhung | 39.933 | 127.550 | 22 | 3187 | 423 |
| Kaesong | 37.967 | 126.567 | 70 | 3061 | 1026 |
| Pyongyang | 39.224 | 125.670 | 36 | 3243 | 619 |
| Sinuiju | 40.100 | 124.383 | 7 | 3481 | 525 |
Publisher’s Note: MDPI stays neutral with regard to jurisdictional claims in published maps and institutional affiliations. |
© 2021 by the authors. Licensee MDPI, Basel, Switzerland. This article is an open access article distributed under the terms and conditions of the Creative Commons Attribution (CC BY) license (http://creativecommons.org/licenses/by/4.0/).
Share and Cite
Kim, J.H.; Kim, Y.I. Optimal Combination of External Wall Insulation Thickness and Surface Solar Reflectivity of Non-Residential Buildings in the Korean Peninsula. Sustainability 2021, 13, 3205. https://doi.org/10.3390/su13063205
Kim JH, Kim YI. Optimal Combination of External Wall Insulation Thickness and Surface Solar Reflectivity of Non-Residential Buildings in the Korean Peninsula. Sustainability. 2021; 13(6):3205. https://doi.org/10.3390/su13063205
Chicago/Turabian StyleKim, Jung Ho, and Young Il Kim. 2021. "Optimal Combination of External Wall Insulation Thickness and Surface Solar Reflectivity of Non-Residential Buildings in the Korean Peninsula" Sustainability 13, no. 6: 3205. https://doi.org/10.3390/su13063205
APA StyleKim, J. H., & Kim, Y. I. (2021). Optimal Combination of External Wall Insulation Thickness and Surface Solar Reflectivity of Non-Residential Buildings in the Korean Peninsula. Sustainability, 13(6), 3205. https://doi.org/10.3390/su13063205