Article

Combining Social Media and Mobile Positioning Data in the Analysis of Tourist Flows: A Case Study from Szeged, Hungary

1
Department of Economic and Social Geography, University of Szeged, H-6720 Szeged, Hungary
2
Geographical Institute, Research Centre for Astronomy and Earth Sciences, H-1112 Budapest, Hungary
3
Hungarian Tourism Agency, H-1027 Budapest, Hungary
*
Author to whom correspondence should be addressed.
Sustainability 2021, 13(5), 2926; https://doi.org/10.3390/su13052926
Submission received: 29 January 2021 / Revised: 25 February 2021 / Accepted: 2 March 2021 / Published: 8 March 2021

Abstract

:
Despite the growing importance of mobile tracking technology in urban planning and traffic forecasting, its utilization in the understanding of the basic laws governing tourist flows remains limited. Knowledge regarding the motivations and spatial behavior of tourists has great potential in sustainable tourism studies. In this paper, we combine social media (Twitter) and mobile positioning data (MPD) in the analysis of international tourism flows in Szeged, a secondary urban center in Hungary. First, the content of geotagged and non-geotagged Twitter messages referring to Szeged in a six-month period of 2018 was analyzed. In this way specific events attracting foreign tourists were identified. Then, using MPD data of foreign SIM cards, visitor peaks in the investigated period were defined. With the joint application of the social media and mobile positioning analytical tools, we were able to identify those attractions (festivals, sport and cultural events, etc.) that generated significant tourism arrivals in the city. Furthermore, using the mixed-method approach we were also able to analyze the movements of foreign visitors during one large-scale tourism event and evaluate its hinterland. Overall, this study supports the idea that social media data should be combined with other real-time data sources, such as MPD, in order to gain a more precise understanding of the behavior of tourists. The proposed analytical tool can contribute to methodological and conceptual development in the field, and information gained by its application can positively influence not only tourism management and planning but also tourism marketing and placemaking.

1. Introduction

Social media data have gained increasing popularity among researchers for its use in analyzing the spatiotemporal activities of people [1,2]. Open-access geographic data provided by large online social networking systems (e.g., Twitter, Facebook, Instagram) have been proposed as proxies for providing valuable information regarding human mobility dynamics, with high resolution in both space and time [3,4,5,6]. Social media covers a wide range of topics, from something as simple as products, events, or different services to more complex issues related to culture, sports, politics, the environment, or pandemics. Such data offer policy makers a good opportunity to improve their knowledge of the local environment, and to detect people’s flows and the use of services in a certain area. Using this knowledge, they are able to make better and more sustainable decisions [1,7]. In the case of tourism, the use of information and communication technologies (ICT) on both the consumer and the management sides can contribute to a more sustainable development by increasing efficiency and optimizing tourist’s decisions [8,9]. By processing and analyzing real-time data, and developing and implementing appropriate answers, the tourism products of a destination can be flexibly adapted to the needs and desire of consumers [10]. Collecting and analyzing data from social media not only requires less financial resources than surveying visitors, but such data are also more accurate, and due to space- and time-stamps have less limitations in spatial and temporal analysis [11].
One of the most popular online social networking and microblogging systems is Twitter, with a global reach of 500 million tweets transmitted each day by over 340 million total users and 186 million daily active users globally (Twitter, 2020). An important feature for research purposes is that it is possible to capture a small fraction of the streams of Twitter data, subject to limitations imposed by Twitter, and most users understand that contributions to Twitter are published and can be subject to legal sanctions as well as discussion and scrutiny [12]. These features make Twitter an unusually public and readily available form of social media, especially when compared to more tightly controlled platforms, such as Facebook or Instagram. Because of the structure of its content (i.e., the messages are exclusively text strings restricted to 144 characters), it is inherently hard to interpret and analyze Twitter data. However, users can opt to geotag their tweets with their current location via GPS (Global Positioning System), which makes certain spatiotemporal analyses possible. Although, this option is often turned off by users (only 1 percent of tweets are geotagged globally according to Lansley and Longley [13]), it is still a rich source of information in tourism research. Moreover, as an alternative, there are various text mining techniques that allow a quantifiable interpretation of their content (e.g., geographical locations, events), making non-geotagged tweets useful as well.
The main objective of this paper is to present a novel methodology combining two types of tracking technologies (Twitter and mobile phones) in the analysis of international tourist flows in Szeged, a major city of Hungary. Local events are important animators of destination attractiveness and play a key role in destination branding, which is essential given the increasing global competition among touristic destinations [14]. In this study, first Twitter data were used to analyze the temporal patterns of users in order to capture specific events in the investigated period between 1 July and 31 December 2018. We assumed that text messages (tweets) posted by foreigners indicate where they actually are as well as which place they are visiting and for what purpose; we also assumed that periods of mass arrival of foreign tourists can indicate specific events. Second, mobile-cell data of foreign tourists staying in Szeged over the investigated period were analyzed with a special focus on tourist peaks generated by events. We were particularly interested in the spatial patterns and behavior of foreign tourists. Such insights can be useful for understanding the spatiotemporal processes of international tourism and can enhance sustainable tourism planning.
The rest of this paper is organized as follows. The second section discusses existing works that focus on the use of social media and mobile phone data in the study of human mobility with special attention to tourism. The third section introduces the study area and its role in the tourism sector of Hungary, and it presents the methods of data acquisition and the filtering process. A section then follows with the main findings of the research, presenting and comparing the social media and mobile-cell data of foreign tourists visiting Szeged. Finally, we present our conclusions, discuss their wider implications, highlight the limitations of our method, and explore possible future work in the field.

2. The Use of Social Media and Mobile Positioning Data in Tourism Research: A Literature Review

Social media enables individuals to virtually interact and share content about their whereabouts, providing a source of information for understanding and assessing human behavior in space. Such information is especially beneficial to the study of mobility patterns, because of the volume and quality of the available geotagged, real-time data [15]. Consequently, social media data gained increasing popularity in the study of tourism as an alternative data source. Understanding the spatial and temporal aspects of the travel behavior of tourists is essential to comprehending their travel activities [16]. For example, managers and practitioners seeking sustainable tourism development can especially make good use of such user-generated data in their work [11].
Social media data can support product development and destination management in tourism in many different ways [8,17]. In local and low-traffic areas, social media provides a platform for direct communication between the host and the tourist [18]. Information gathered from social media and tourism applications, can help track the movements and the consumption of tourists. Destinations and firms can use refined and accumulated data to make accurate predictions and to respond to new demands effectively [8].
Moreover, the image of a particular tourist destination is influenced by information appearing on social media (i.e., placemaking, city branding), which can even increase demand [19,20]. Targeted marketing strategies can also be effectively implemented through social media platforms, making tourism consumption more sustainable at the individual level [21]. Social media can also function as a platform for protesting against overtourism, as it allows local residents to protest against the phenomenon, as they did in Barcelona in connection with Airbnb [22]. One of the major critiques of social media data is the bias of particular online platforms regarding the age, geographical location, and social class of the users. To avoid this limitation a combination of different social media sources can be a solution, as demonstrated by Salas-Olmedo et al. [23] in their study using Twitter, TripAdvisor, Panoramio, and Foursquare data simultaneously.
Among the various social networking and microblogging systems, Twitter is especially favored in tourism research. Although there are several methodological problems regarding data acquisition, Twitter data can provide useful information about tourist flows [24]. As Guo and Chen [25] argue, a strong filtering of information from Twitter is important, because non-personal accounts, spam users, and junk tweets distort information generated by the real users. Twitter can be a reliable source also for studying the use of urban spaces by different groups of people (e.g., locals and visitors). Su et al. [26] used Weibo, a Chinese microblogging website launched by Sina Corporation, as an alternative to Twitter in 2009 to compare the spatiotemporal concentration and dispersion of day trippers and tourists from Shenzhen as well as from the rest of mainland China in Hong Kong.
Twitter is an important source of information not only in research but also in tourism management. According to Bigné et al. [27], destination marketing organizations (DMOs) that actively use Twitter to promote their own products are able to achieve higher occupancy rates because the number of retweets and replies by the users and the number of event tweets, tourist attraction tweets, and retweets by destination marketing organizations can predict the hotel occupancy rate for a given destination. In addition, Wood et al. [28] were able to estimate the number of visitors to natural areas (quantification of nature-based tourists) that are difficult to measure statistically, based on information from Flickr.
Next to social media, mobile positioning data (MPD) increasingly tends to complement conventional data sources in tourism studies and destination management, as these data are becoming crucial to how a destination utilizes its resources [9,29]. Passive mobile-cell information is generated each time a mobile phone communicates with a network (i.e., by calling, sending messages, or using cell data). Based on the location of the mobile phones, it is possible to track human movement. This information can be extended with personal features of the SIM card owners, such as ethnicity, age, and gender, making the space–time analyses of movements of different groups of people possible [30]. By anonymizing these data, researchers are able to study human mobility with higher efficiency and accuracy compared to traditional research methods, such as surveys, without having to worry about privacy infringement [31,32]. Passive MPD can be used to measure the volume (arrivals and departures) of tourists (both domestic and inbound) to separate tourist movements from the daily rhythms of local residents [33,34] as well as to analyze tourist- and trip-related characteristics (e.g., country of origin, length of stay, and travel diary). It is also possible to create models for the spatiality of users [35] and make typologies for different tourist flows [36,37]. The use of mobile phone tracking technologies in tourism studies has swiftly expanded since the turn of millennium [30,38], enabling more sophisticated analysis of the spatial behavior of tourists [39]. The combination of GPS and mobile phone-based tracking enabled researchers to study various aspects of tourism more effectively [40], such as the seasonality of foreign tourists [41], cross-border mobility [42,43], and customer loyalty to a destination [44]. Using mobile positioning data, Nilbe et al. [45] were able to detect differences in distances travelled by foreign visitors to events and regular (non-event) visitors in Estonia, while Raun et al. [40] identified tourist destinations based on visitor flows. There has been a lot of technological advancement in the field [46,47,48,49,50,51], and there are already countries in the world (Estonia and Indonesia) where MPD is used to produce national tourism statistics [9].
Despite the widespread success in predicting specific aspects of human behavior via social media data or MPD separately, little attention has been paid to the joint application of social media and mobile phone data. A combination of social media (Twitter) and mobile phone data was first applied by Botta et al. [52] for the estimation of the number of real-time visitors in a specific area. Authors, using a football stadium and an airport as case studies, presented evidence of a strong relationship between the numbers of people in restricted areas. Such estimations can not only play an important role for the avoidance of crowd disasters and the facilitation of emergency evacuations, but also offer practical value for a range of business and policy stakeholders. In a case study in the Friuli-Venezia Giulia region in Italy, Sowkhya et al. [1] used geolocated tweets and mobile-cell data to determine people presence, movements, and the number of flows among different tourist destinations, with the help of QuantumGIS. Using the mixed method, the authors were able to capture and explain the presence and the spatiotemporal flows of both foreigners and Italians, considering different weather conditions, holidays, and specific tourist events (e.g., the Friuli Doc wine and food festival). Despite these examples, the advantages of the combination of mobile positioning and social media data in studying tourism have been hardly explored.

3. Research Design

3.1. Study Area

The study area, Szeged, is the third largest city in Hungary, located in the south-eastern part of the country close to the Serbian-Romanian international border. According to the Hungarian Central Statistical Office (KSH), the city had a total population of 164,000 in 2018. Szeged is a major administrative, cultural, and business center in Hungary; the economy of the city is dominated by tertiary activities, including tourism [53,54]. According to official statistics, the number of nights spent by tourists in the city at commercial accommodations was 442,000 in 2018, one third of which was realized by foreign tourists. Disregarding smaller spa towns, such as Hévíz, Hajdúszoboszló, and Balatonfüred, in 2018 Szeged was the third most popular tourist destination among Hungarian cities, after Budapest and Győr. The tourist attractions of the city comprise several festivals (the most important of which is the Szeged Open-Air Festival), sport and cultural events concentrating mainly in the summer season. In addition, Szeged is one of the major university and research centers in Hungary, and international conferences also contribute to a thriving tourist economy there. Yet, there is no reliable information on the spatial and temporal behavior of tourists arriving to the city and to what extent the events (festivals, fairs, conferences, etc.) organized by local stakeholders contribute to the tourism industry of Szeged.

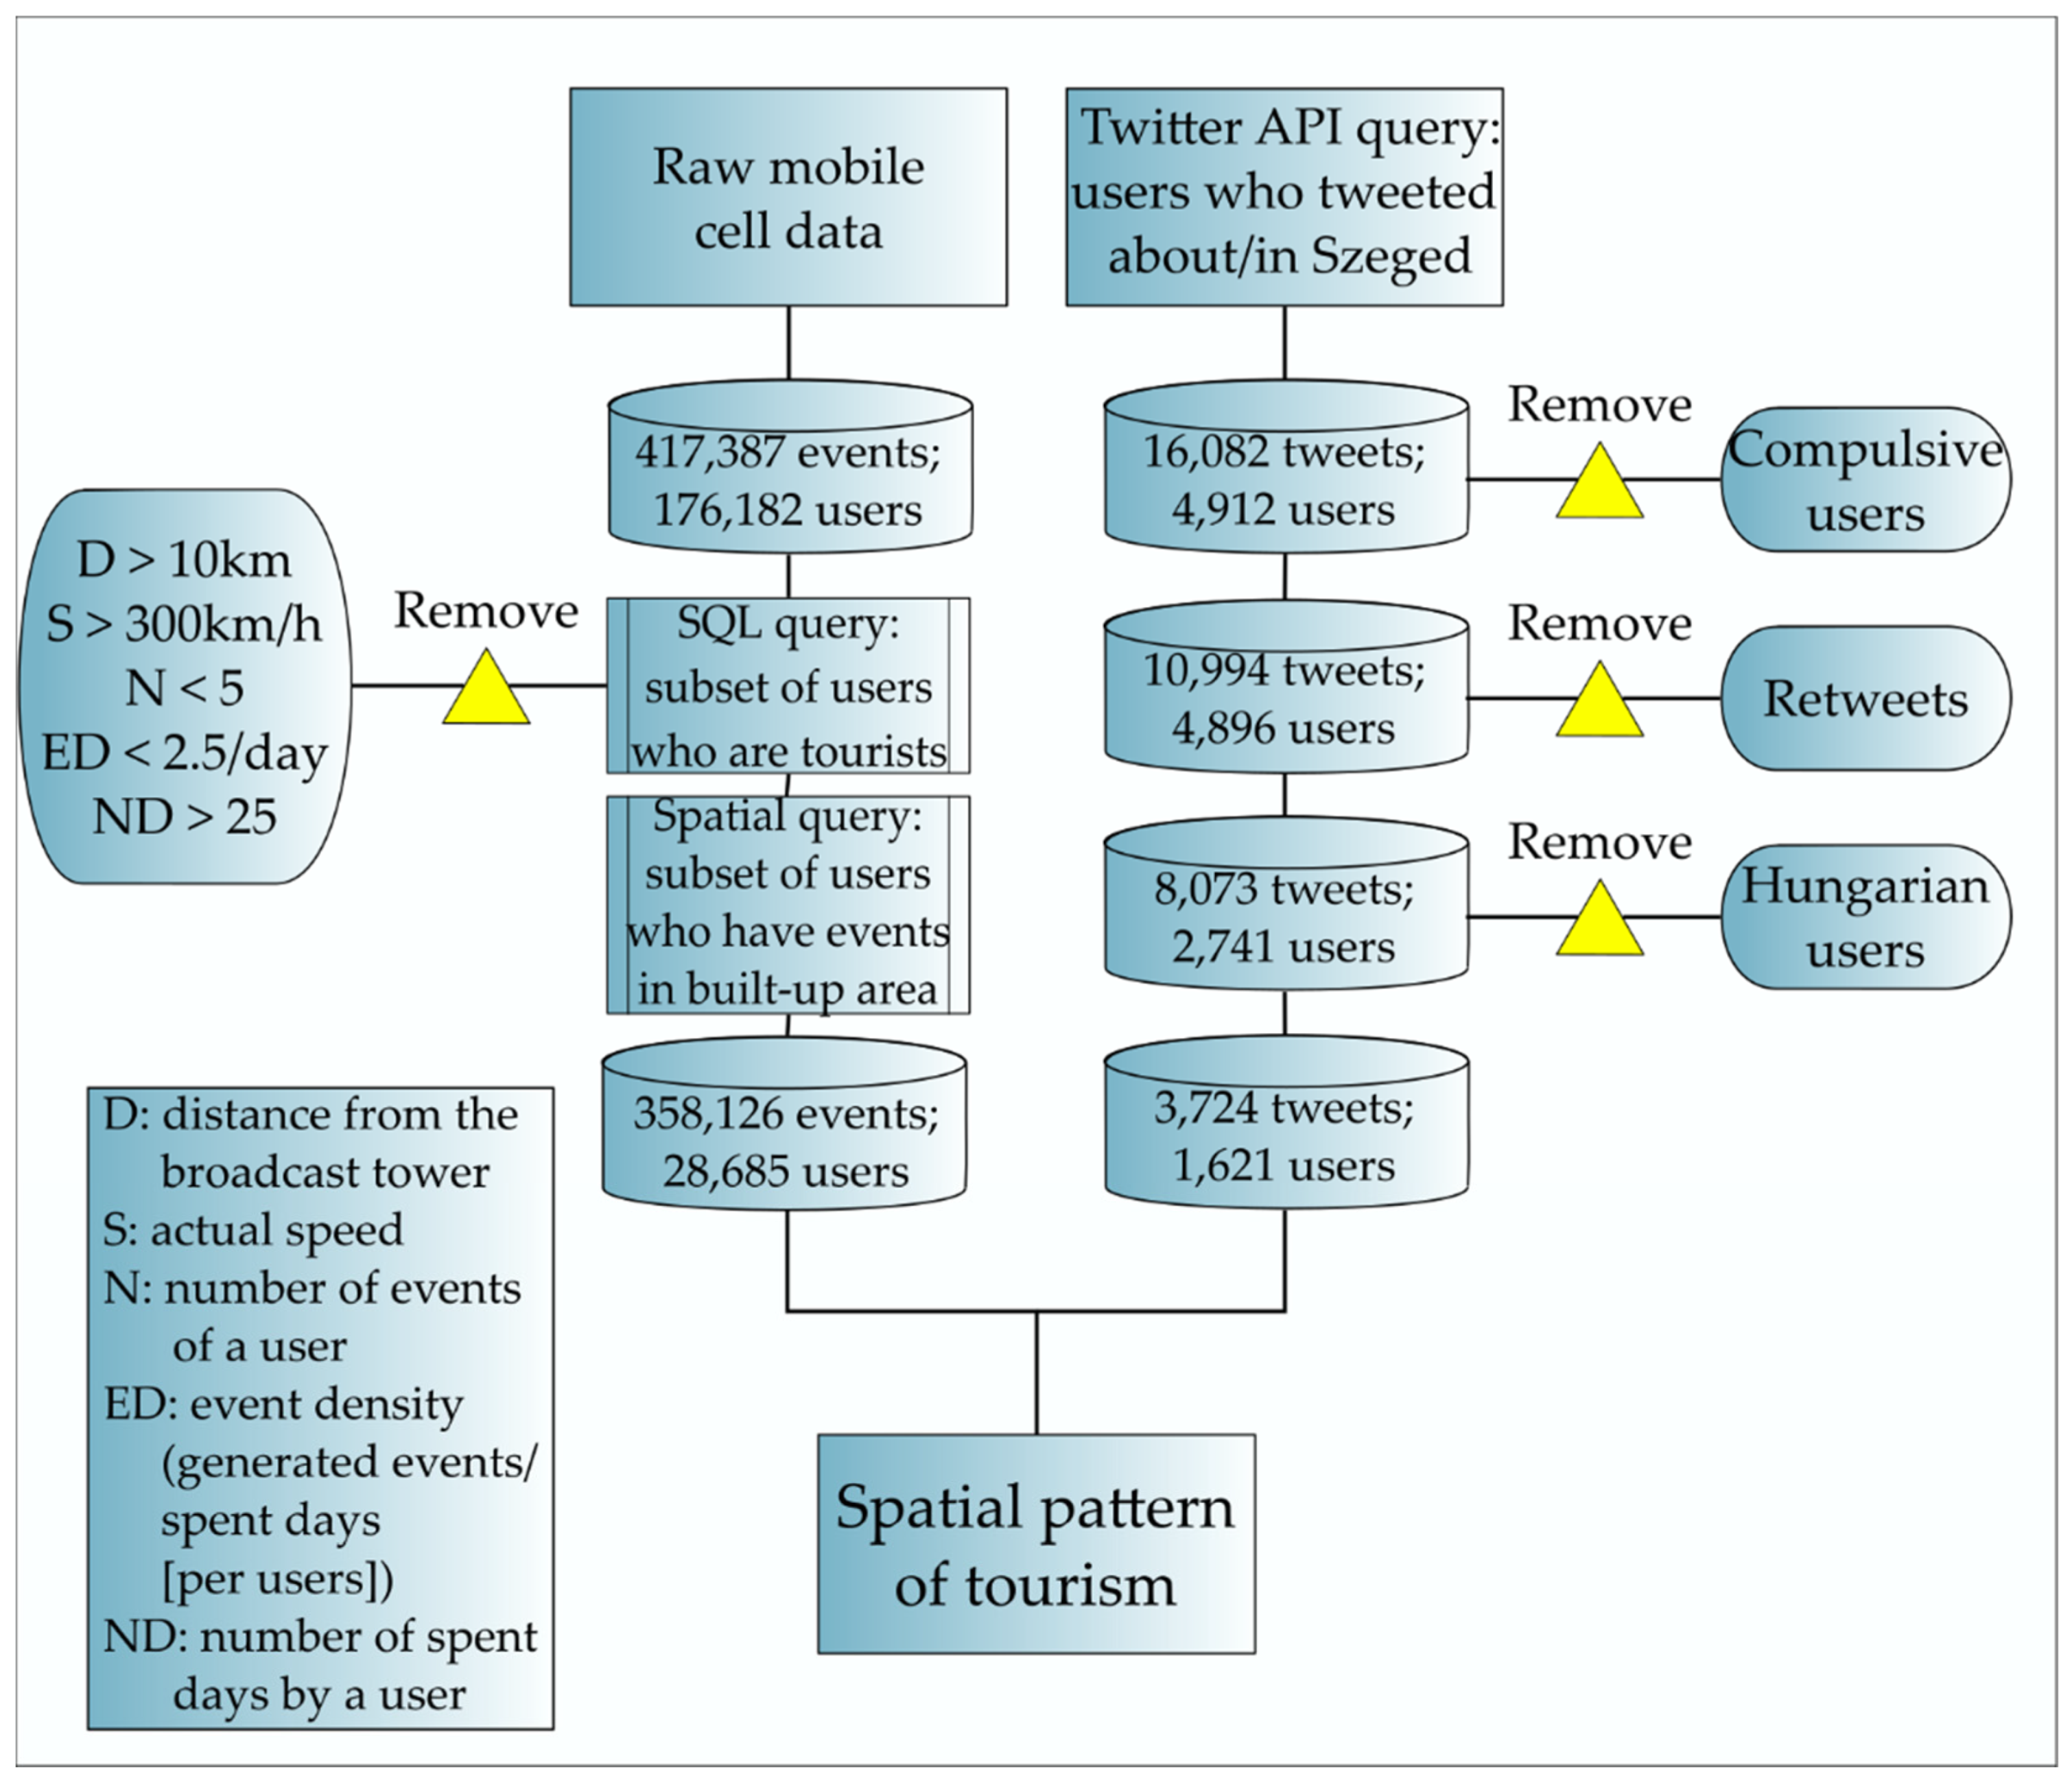
3.2. Data and Methods

Figure 1 describes the data acquisition and processing flow developed for this study as well as the data removed in each step. The preprocessing made the two datasets (Twitter and mobile phone) reliable and useful in studying the behavior of foreign visitors and analyzing their spatial activity pattern.

3.2.1. Twitter Data

Twitter messages (tweets) used for this study were downloaded via the Twitter API using a PHP script over six consecutive months (from 1 July 2018 to 31 December 2018). Tweets were selected according to the following two criteria: on the one hand, geotagged tweets within a 10 km buffer from the center of Szeged (geotagged and assigned to a location); and on the other hand, tweets mentioning the word “Szeged” in their text or metadata. Since the study focuses on international visitors, only non-Hungarian-language tweets were collected. As Twitter is one of the least widespread global social networking sites in Hungary, the probability of mixing Hungarian users with foreigners was very low. From the raw data, which were in JSON format, we extracted the necessary information for the analysis using a PHP script and arranged it into CSV format. These data were stored in a MySQL Server, and a significant part of the preprocessing was also performed in this environment. The dataset was filtered to eliminate tweets according to the following criteria:
  • users with over 100 messages within the sample (compulsive users), who would otherwise have dominated the analysis,
  • Hungarian-language tweets, since we were interested in the spatiotemporal mobility of foreign visitors,
  • retweets, because they do not add new content to the discourse about Szeged, and
  • tweets from users who have posted identical messages more than three times in the data, as these were likely to be fake accounts.
Altogether 16,082 tweets from about five thousand users were collected for the research. After filtering, 3724 tweets remained. Based on these, the average number of tweets was 20 per day in the investigated six-month period. To define specific events as possible tourist attractions, we applied the threshold of 30 tweets or more per day. This threshold was selected empirically; however, we emphasize that this value may vary from city to city. Of the remaining and analyzed tweets, 313 (i.e., 8.5 percent) were geotagged. The share of geolocated tweets can be considered high [55], since normally only 1% of users opt to share their locations based on the coordinates of their devices globally [13]. Thus, our dataset was rather small-scale compared to traditional approaches [13,56] and comprised predominantly (91.5%) non-geotagged tweets; nevertheless, it seemed to be reliable and useful for the purpose of investigation. The filtered tweets were visualized in the QGIS opensource software environment.

3.2.2. Mobile Positioning Data

For the study, we used the depersonalized passive mobile phone data from one of the three major mobile phone operators in Hungary covering six consecutive months (from 1 July 2018 to 31 December 2018). The raw dataset contains mobile-cell information at the event level, i.e., any occasion when the mobile device connects to the network—text messages, calls, or data usage. The events are geotagged based on the position of the nearby broadcast towers and the signal intensity. Each event contains a depersonalized user ID and trajectory analysis can thus be conducted. At this point, due to the huge number of events (80 million per day), the analysis is cumbersome; hence, data reduction was needed. Consecutive events that were generated at one specific location by the same user were merged into one event. Additionally, the elapsed time between events of the same user was added to the event as a new attribute.
In this research only the events of foreign SIM cards were used. It was necessary to filter out any data errors. Thus for those events that were generated during user movement, we assigned a speed value calculated from the distance between the previous and next event and the time elapsed between them. If this speed value exceeded 300 km/h between two places with distance exceeding 10 km, we deleted these events, since they are most likely data errors. In addition, only those users for whom we had sufficient information were retained. Therefore, the users with less than 5 events in total and an event density below 2.5 were filtered out (see Figure 1). Furthermore, additional filtering methods were used to narrow down the dataset for users that arrived possibly for touristic purposes. During the filtering, only those users were kept who did not spend more than 25 days in Hungary (i.e., the difference between the first and last events did not exceed 25 days). In this way, events by foreigners who stayed in Hungary for a longer period (e.g., Erasmus students) or long-distance drivers returning regularly were excluded. There is no consensus in the literature on the maximum length of stay that distinguishes tourists from other (non-tourist) visitors. Depending on the purpose of the research, it can be 14 [57] or even 20 days [50]. In this research we applied the 25-day limit as maximum length of stay in Hungary to identify foreign tourists. At the other end of the scale, one-day tourists were also considered in the research [33], as local events may attract visitors from other destinations in the country (e.g., Budapest). As Lamp et al. [58] demonstrated, it is difficult to separate short-term visitors from transit travelers. Indeed, in the case of Szeged, two nearby motorways leading to Serbia and Romania as main transit corridors concentrated a lot of foreign SIM-card events. Therefore, users who crossed the administrative boundaries but did not have an event within the built-up area of Szeged were disregarded. With this single procedure, 60 percent of users were filtered out from the dataset. Altogether 417,387 events from about 176,000 foreign SIM cards were considered first for the study, which decreased to 358,126 events from 28,000 users after the filtering process.

4. Results

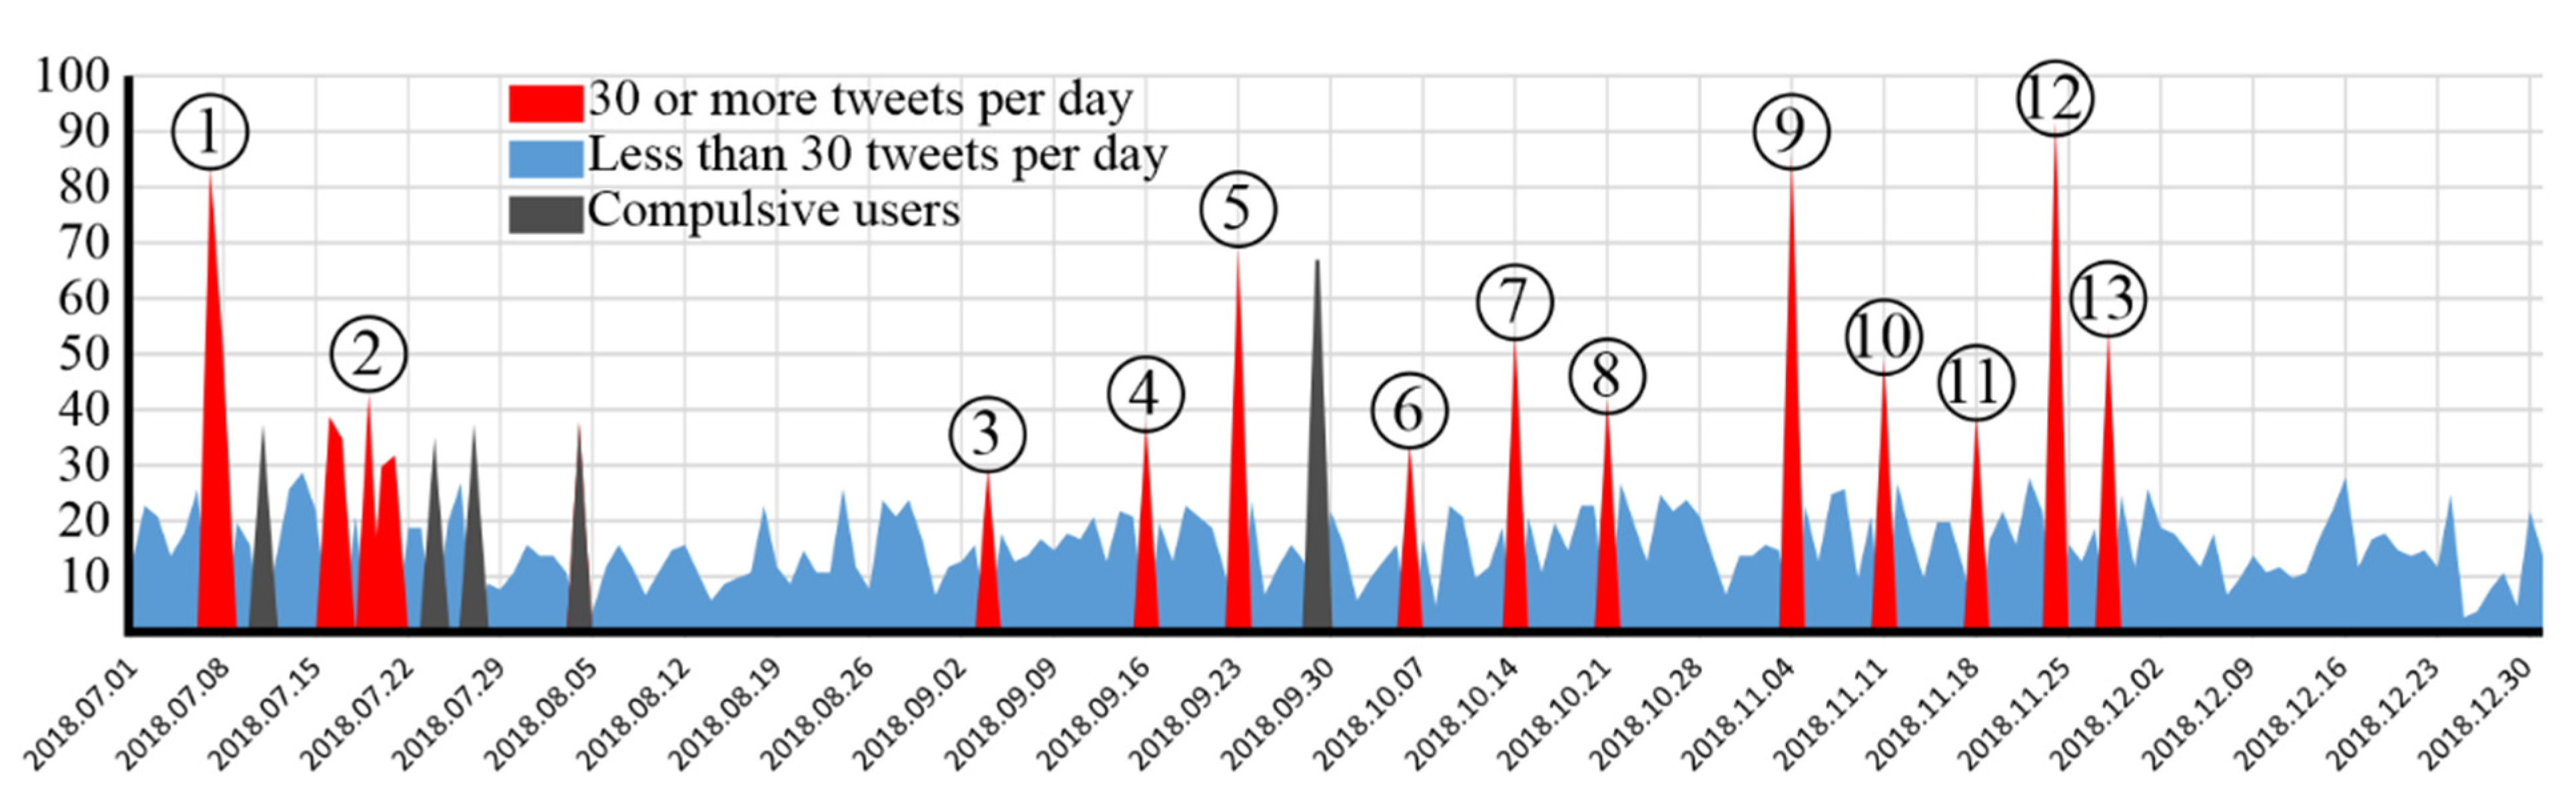
4.1. Analysis of Twitter Data

In the first phase of research the temporal distribution of the tweets was analyzed. Based on the described methodology, altogether 23 days could be identified in the period when the number of tweets exceeded 30, of which five were omitted from the study because they were dominated by one person (a compulsive user) who generated a lot of tweets without any focus on a tourist attraction (Figure 2). From the remaining 18 days, two were adjacent (7–8 July) and the contents of the tweets referred to the same event. These two days were merged, and 16–17 July and 19–21 July were merged for the same reasons. Thus, through the applied classification we were able to identify 13 distinctive tweeting peaks that were considered in the next stages of research.
By analyzing the content of tweets and checking the events calendar of Szeged, we were able to identify the main reasons behind the spikes of tweets. Surprisingly, out of the 13 spikes, 12 could be related to sport events and there was only 1 case for which we could not find a dominant topic. Moreover, out of the twelve sport events ten could be associated with handball. The local handball team Pick Szeged played several (partly Champions League) games in the half-year period; some of them took place at home, but some of them took place away. Obviously, handball games that took place away did not generate tourist arrivals in the city; therefore, we omitted them from further investigation (Table 1).
Altogether, seven events with intense tweeting by foreigners could be identified in the studied period. Next to the five handball games there were two major events, the Rugby Europe Women’s 7s Trophy with 12 national teams from different countries including Hungary, that was held 7–8 July 2018; and the 11th International Dragon Boat Federation Club Crew World Championships, when 6200 paddlers from 140 clubs from 28 different countries competed over six days, between 16–21 July 2018. Both events attracted not only players and paddlers from different countries but also managers, family members, fans, and spectators.

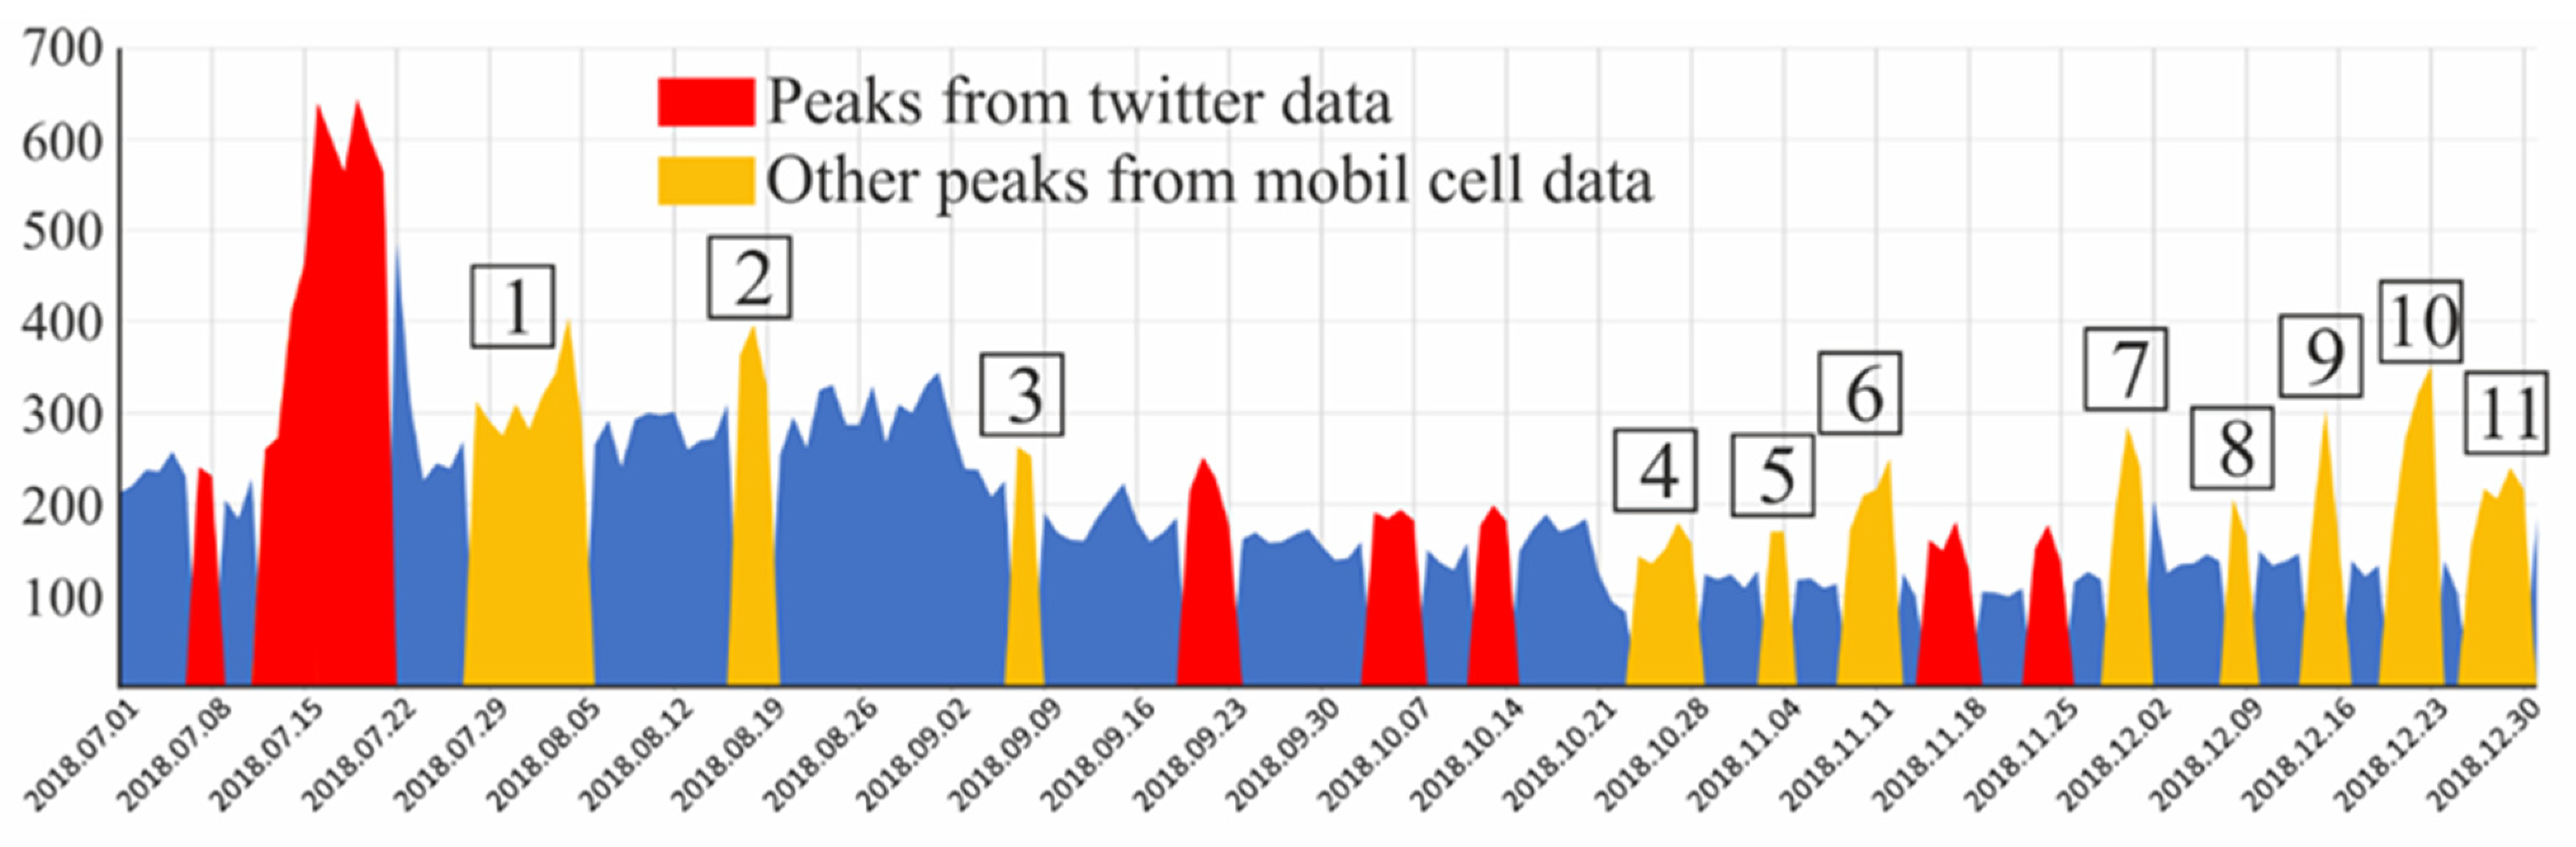
4.2. Analysis of Mobile-Cell Data

The daily amount of cellular network data of foreign mobile phones in Szeged shows that the number of foreign tourists was significantly higher in the summer months (July–August), with a secondary peak in December adjoining the Christmas holidays. This is in accordance with the seasonality of tourism in Hungary in general [59]. As a second step of research, we compared peak periods of tweeting with mobile-cell data of foreigners in Szeged. In addition to the seven sport events found on the basis of tweets, we were able to recognize eleven other spikes when the density of foreign SIM cards was above average (Figure 3). Again, we thoroughly checked the list of local events and we were able to specify four distinct festivals, cultural and youth programs that provided possible major attractions for foreign visitors (Table 2).
Between 28 July and 5 August, the summer school of Hungarology was held for foreign students interested in studying the Hungarian language. At the beginning of the academic year (7–8 September), the Welcome Camp of Freshmen was organized by the university with concerts and other cultural events that attracted foreign visitors (e.g., friends or relatives of foreign students studying in Szeged). The weekend covering 24–28 October 2018 was the peak of the annual cultural festival in the city, with international programs like the Bulgarian folk music festival. The Jazz Festival of Szeged was held between 9–12 November 2018, which also attracted many foreigners. These cultural events could hardly be found in the tweets. The peaks of cellular network-based data of foreign mobile phones that could not be associated with any event normally fell on weekends; thus, these data can be related to ordinary tourists. The spikes of foreign SIM cards in December could also be attributed to the famous Christmas market of the city and the holiday itself, as the end of the year season is traditionally a secondary peak in the annual tourist turnover [59].

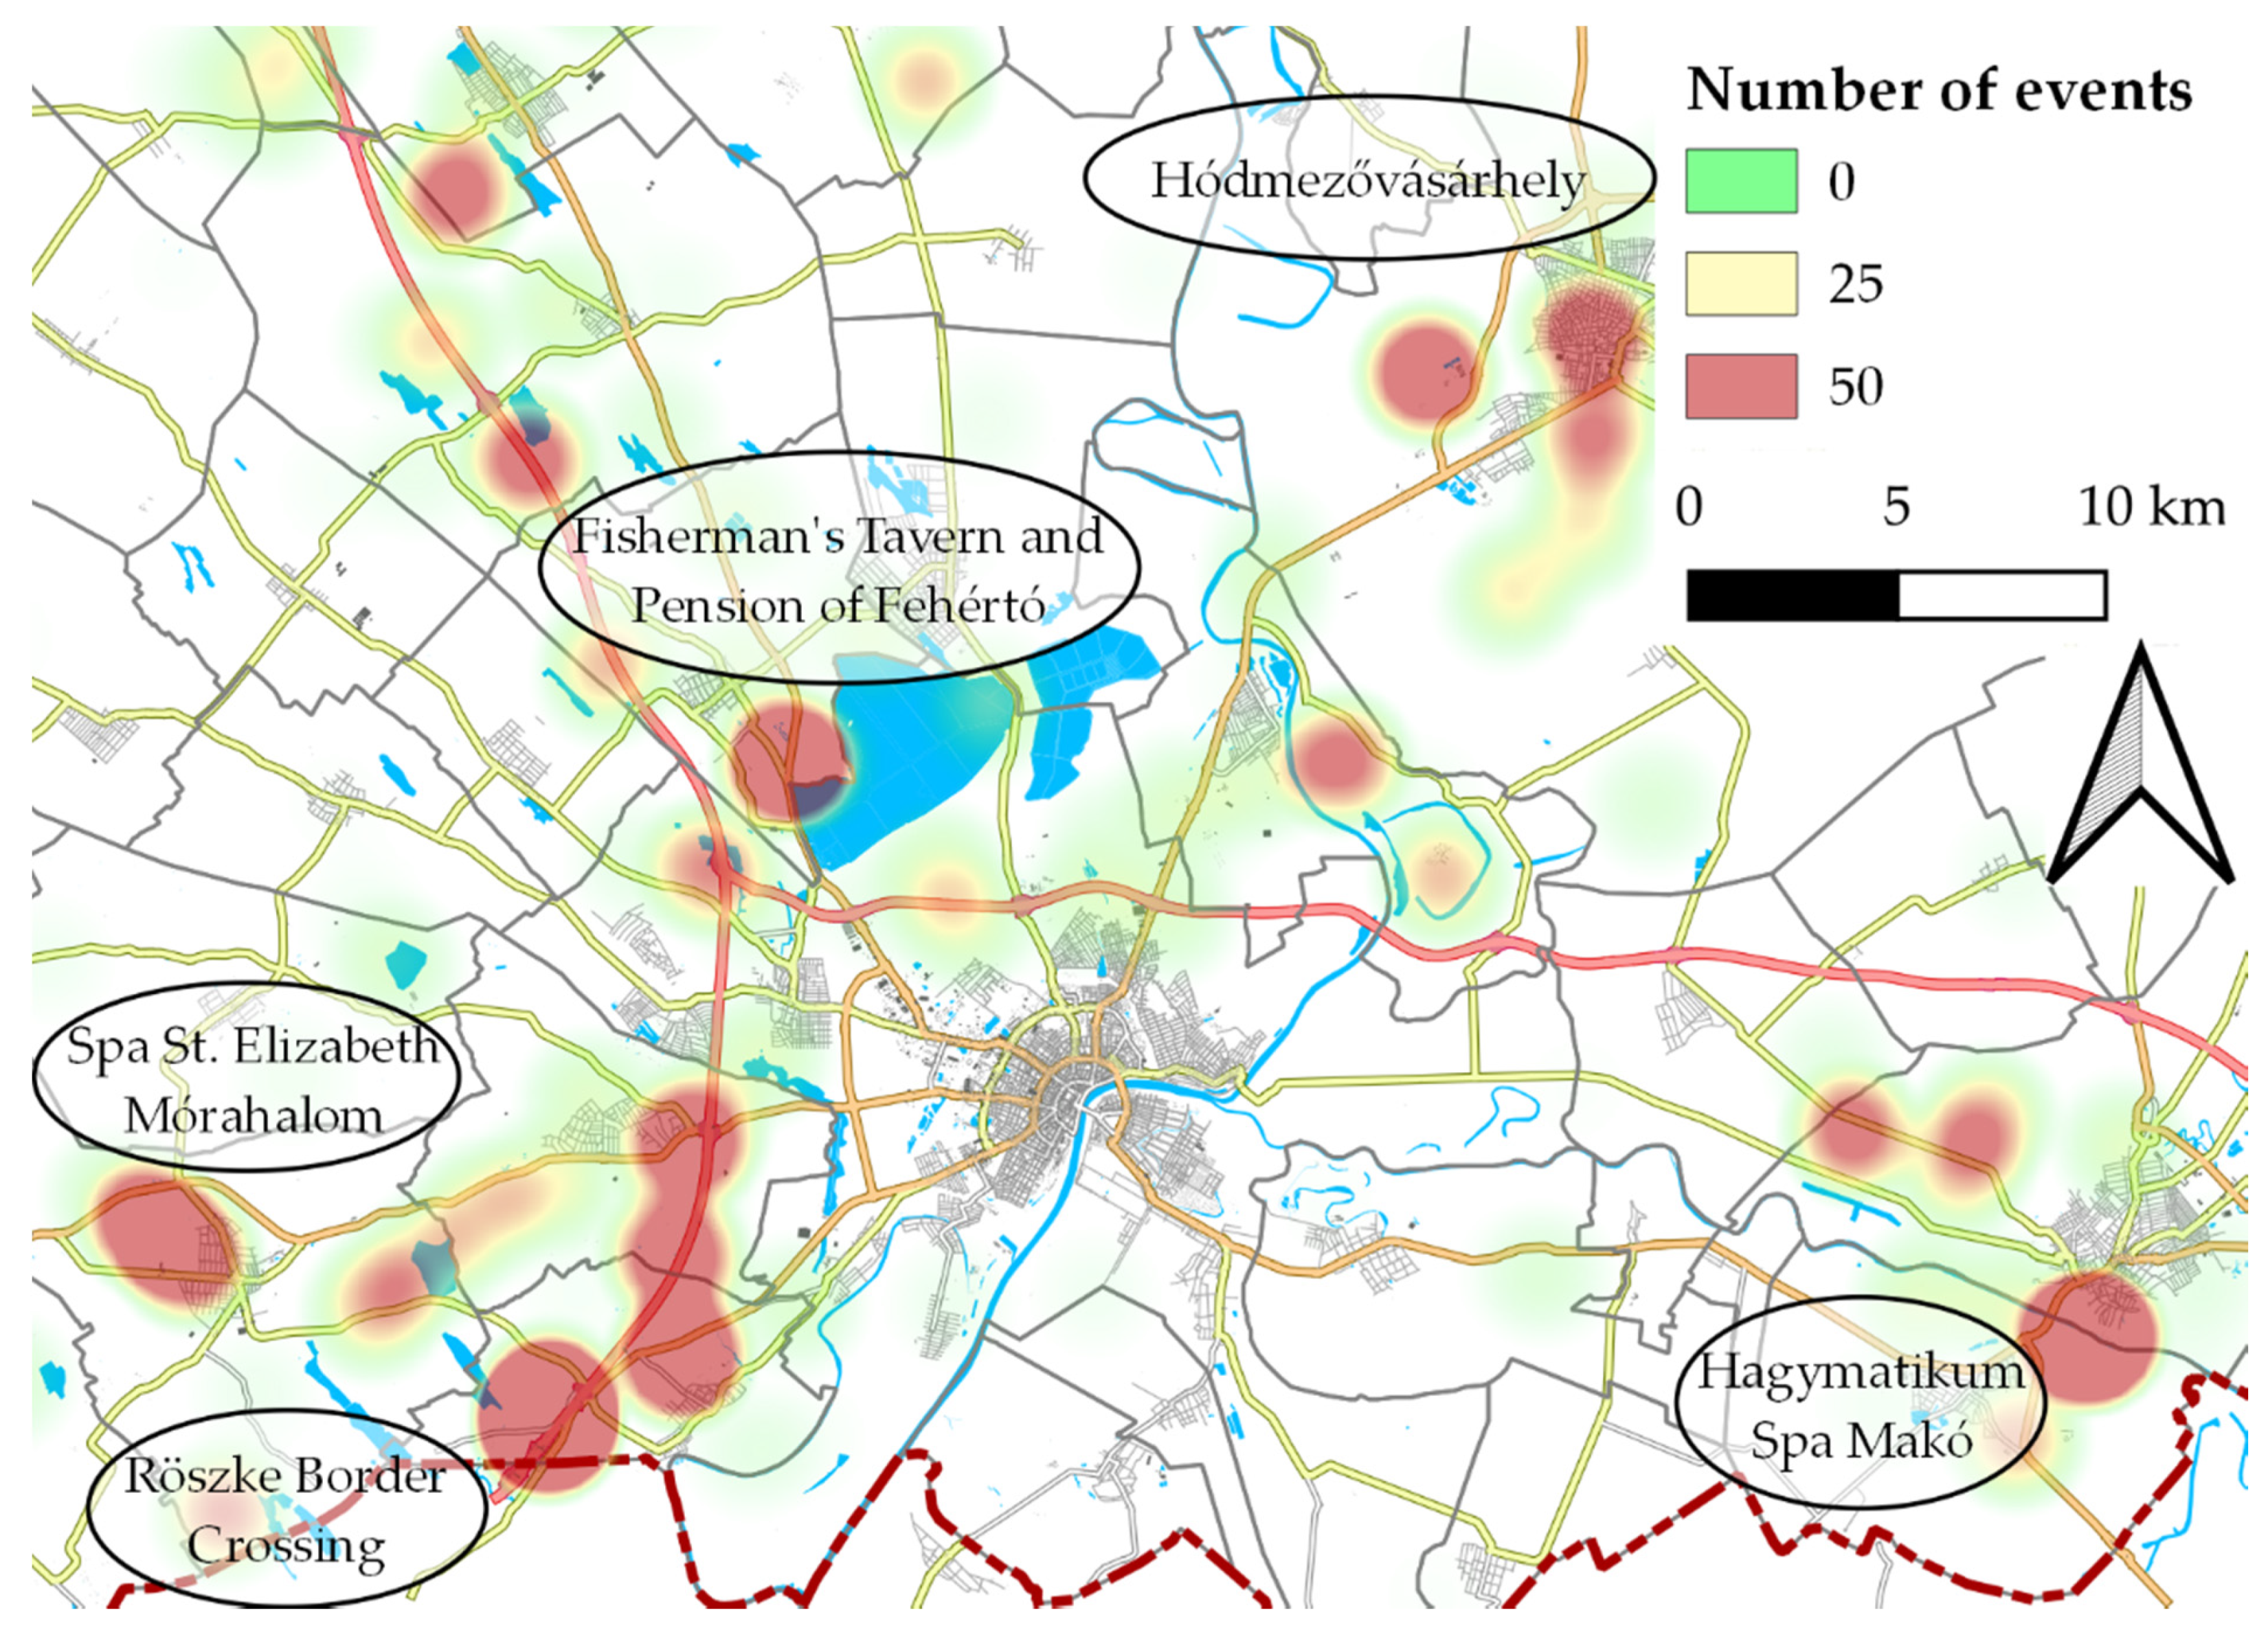
4.3. Tracking the Spatial Movements of Tourists

To extend our results on tourist behavior, we considered a case study of a specific event for which relevant data existed: the 11th International Dragon Boat Federation Club Crew World Championships. Szeged is known as the cradle of paddling sports, with its international standard course, the National Kayak-Canoe and Rowing Olympic Centre at Maty-er, which is located outside the compact city at the western fringe of Szeged. In this study, the passive mobile positioning data of international tourists (i.e., non-Hungarian SIM cards) staying in Szeged during the event were analyzed. Since the location of the dragon boat race (Maty-er) is outside Szeged, approximately 7 km from the main square, we were able to identify those foreign mobile phone users who stayed at the location of the race. As Table 3 shows, their share reached ca. 60 percent of all foreign SIM cards in the period of the event.
Knowing how foreign tourists behave in space and what objects they visit while staying in the city is important for tourism planning. Therefore, we analyzed the movements of those SIM cards that were captured at the location of the dragon boat race (i.e., Maty-er). Altogether, we were able to identify 626 foreign visitors in our dataset during the race (i.e., 10 percent of the registered participants). The greatest numbers arrived from Germany, Canada, USA, Czechia, and Poland. As mobile phone providers and their international roaming partners significantly differ country by country, nationality as an aspect cannot be considered in the analysis. Figure 4 shows the spatial concentrations of identified foreign visitors inside Szeged.
The spatial activity of foreign visitors attending the dragon boat race shows a clear pattern within the city. Next to the Kayak-Canoe and Rowing Olympic Centre at Maty-er, they visited the downtown area where most of the tourist attractions and the bulk of the hospitality industry (restaurants, bars, cafes, etc.) of the city are located. Additionally, some parts of the race were held on the Tisza river near the city-center, attracting many visitors. Next to the downtown, the Napfényfürdő Aquapolis spa and wellness center in Újszeged and the Zoo embedded in large green areas [60] were frequented by foreign tourists during the period of the dragon boat race. These two locations can be perceived as additional tourist attractions, next to the paddling race.
We were also able to capture the movements of tourists in the surrounding of the city (Figure 5). The activity pattern of foreigners is spatially more dispersed and forms several hotspots. Among them, the most important are the border crossing to Serbia (Röszke) and the transit motorway, where some of the foreigners entered or left the country. Hódmezővásárhely is a medium-sized city nearby Szeged with local tourist attractions. There are two thermal spas in Mórahalom and Makó, and there is a famous fish restaurant at the northern edge of Szeged, near Fehértó lake. These locations provided leisure opportunities for tourists while they were visiting for the dragon boat race.

5. Discussion and Conclusions

Big-data approaches provide new opportunities for sustainable tourism studies and open up new ways of understanding key aspects of tourists’ behavior. Methods of traditional travel diary construction rely on surveying or interviewing, which are not only time-consuming and costly but also limited in scale and number of samples [16]. However, the continuous collection of digital data with fine spatial and temporal resolution opens new opportunities to capture reliable information on the spatiotemporal dynamics of tourism.
The main aim of this study was to combine social media and mobile positioning data for the analysis of tourist flows. Such an approach can contribute not only to methodological but also conceptual developments in the discipline. To the best of our knowledge, except for the pioneering experiment of Sowkhya et al. [1], no attempt in tourism literature has been made toward the simultaneous utilization of the data available on social media platforms and the data stored by mobile phone operators, at least not at such fine geographical resolution.
Our results show that data retrieved from social media (Twitter) and mobile phone networks may allow us to gain fine-grained information on the behavior of tourists, their motivations, the purpose of their stay, the places they visit, and the role of tourist events. With the joint application of the social media and mobile positioning analytical tools, we could identify and geographically locate attractions (festivals, sport and cultural events, etc.) that generated international tourism arrivals in the case-study city, Szeged. Our findings offer several opportunities for decision makers, planners, and other stakeholders to expand the tourism potential of a city, forecast travel demands, develop synergies among destinations, combat seasonality, and improve the utilization of tourism resources in city regions.
First of all, tourism management organizations and tourism planners can utilize the knowledge on the spatial and temporal behavior of tourists to appropriately plan and manage tourist flows. The proposed approach can help practitioners better understand the spatiotemporal features of urban tourism and formulate a more reasoned tourism planning policy. The digital movement tracking of visitors offers possibilities to study the routes of tourists inside the city and its surroundings, to identify places that they visit, to delimit tourist hotspots in the city and its hinterland, and to examine the role of different attractions. This knowledge can help local stakeholders organize specific tourist events outside the peak season and better regulate tourist flows both spatially and temporally to mitigate possible conflicts related to tourism (e.g., crowding in public spaces, noise, and overtourism at certain locations) [61,62,63,64]. Festivals and events may lead to crowding in specific areas [65]; therefore, such knowledge is important not only for the planning of tourism development but also for sustainable infrastructure and transport planning and environmental management in city regions.
In addition, planners can trace the perception of urban spaces by various groups of tourists, and they can identify positive images attached to their city, which is very useful for tourism marketing, placemaking, and place branding [47,66]. According to Lew [67], the planner’s role as place-maker and the local’s role as place-maker are well understood; however, the tourist’s role in place-making, and placemaking itself, is more ambiguous. Sharing images [68] and stories through social media [69] means that tourists not only consume place but also actively contribute to placemaking. The construction of positive and charming images [70] is a fundamental tool for attracting global flows of tourists. Such images are important because they help other people to make generalizations and they influence intentions and decisions regarding holiday destinations. The proposed mixed use of social media and mobile positioning data can contribute to better understanding of the tourist phenomena in placemaking and can support place-branding activities to enhance the competitiveness of cities.
The lessons learnt and conclusions drawn from this study clearly reach beyond the town of Szeged. The method outlined may be easily applied in other cities to analyze their touristic potentials, to trace the spatial behavior of tourists with special attention to local attractions, and to involve surrounding municipalities in tourism development. The results also have some implications for peripheral rural municipalities to strengthen regional collaboration, to intensify their economic growth through tourism development, and to create synergies with attractions organized by cities in the region [71]. Moreover, such information can also help tourism planning to define new event-related Tourism Products (4A) inside cities and in their surroundings.
Despite its novelty and usefulness, our methodological approach has certain limitations that should be tackled in future research. As was demonstrated, information derived from Twitter messages enabled us to identify only certain events (predominantly sport events). This is probably linked to the demographic and socioeconomic background of the users. In addition, social media platforms have different levels of penetration across countries. Therefore, the use of a single social media website may lead to bias in the sampling and incomplete conclusions [72]. To get more detailed and balanced information on tourist motivations and the role of attractions, a mix of different social media sources (Twitter, Instagram, Facebook, TripAdvisor, etc.) should be applied. By mixing different sites, a more balanced mix of social media users can be achieved. Next to data collection, another important question relates to data processing and filtering. As it has been demonstrated, with a strict and well-defined preprocessing of data (i.e., the removal of retweets and junk tweets, or mobile cell data of non-tourist visitors) the accuracy of the whole dataset can be improved. On the basis of our research findings, we argue that combined big-data approaches with careful preprocessing of data can offer useful information about the background effects of tourism and the factors influencing tourist flows [73].

Author Contributions

Conceptualization, Z.K., G.V., and T.K.; methodology, T.K.; software, T.K. and Á.E.; validation, T.K. and Z.K.; formal analysis, T.K.; investigation, T.K. and Z.K.; resources, Z.K.; data curation, T.K. and Á.E.; writing—original draft preparation, Z.K.; writing—review and editing, Z.K., Á.E., G.V., and T.K.; visualization, T.K.; supervision, Z.K.; project administration, Z.K. and G.V.; funding acquisition, Z.K. All authors have read and agreed to the published version of the manuscript.

Funding

This research was funded by the Ministry for Innovation and Technology, Hungary, grant number NKFIH-1279-2/2020 and TUDFO/47138-1/2019-ITM; the UNKP 20391-3/2018/FEKUSTRAT project of the Ministry of Human Capacities, Hungary; and the Hungarian Scientific Research Fund (OTKA), grant number K135546.

Acknowledgments

The authors are grateful to the Hungarian Tourism Agency for providing the mobile-cell data. This research was conducted in a collaboration between the University of Szeged and the Hungarian Tourism Agency.

Conflicts of Interest

The authors declare no conflict of interest.

References

  1. Sowkhya, B.; Amaduzzi, S.; Raawal, D. Visualization and analysis of cellular and twitter data using QGIS. ISPRS Int. Arch. Photogramm. Remote Sens. Spat. Inf. Sci. 2018, 42, 199–209. [Google Scholar] [CrossRef] [Green Version]
  2. Chae, J.; Thom, D.; Jang, Y.; Kim, S.; Ertl, T.; Ebert, D.S. Public behavior response analysis in disaster events utilizing visual analytics of microblog data. Comput. Graph. 2014, 38, 51–60. [Google Scholar] [CrossRef]
  3. Jurdak, R.; Zhao, K.; Liu, J.; AbouJaoude, M.; Cameron, M.; Newth, D. Understanding human mobility from Twitter. PLoS ONE 2015, 10, e0131469. [Google Scholar] [CrossRef] [PubMed]
  4. Li, L.; Goodchild, M.F.; Xu, B. Spatial, temporal, and socioeconomic patterns in the use of twitter and flickr. Cartogr. Geogr. Inf. Sci. 2013, 40, 61–77. [Google Scholar] [CrossRef]
  5. Walther, M.; Kaisser, M. Geo-spatial event detection in the Twitter stream. Lect. Notes Comput. Sci. (Incl. Subser. Lect. Notes Artif. Intell. Lect. Notes Bioinform.) 2013, 7814, 356–367. [Google Scholar] [CrossRef]
  6. Xiang, Z.; Gretzel, U. Role of social media in online travel information search. Tour. Manag. 2010, 31, 179–188. [Google Scholar] [CrossRef]
  7. McNeill, G.; Bright, J.; Hale, S.A. Estimating local commuting patterns from geolocated Twitter data. EPJ Data Sci. 2017, 6. [Google Scholar] [CrossRef] [Green Version]
  8. Lew, A.; McKercher, B. Modeling Tourist Movements. Ann. Tour. Res. 2006, 33, 403–423. [Google Scholar] [CrossRef]
  9. Kalvet, T.; Olesk, M.; Tiits, M.; Raun, J. Innovative Tools for Tourism and Cultural Tourism Impact Assessment. Sustainability 2020, 12, 7470. [Google Scholar] [CrossRef]
  10. Kim, D.; Kim, S. The Role of Mobile Technology in Tourism: Patents, Articles, News, and Mobile Tour App Reviews. Sustainability 2017, 9, 2082. [Google Scholar] [CrossRef] [Green Version]
  11. Fisher, D.M.; Wood, S.A.; Roh, Y.-H.; Kim, C.-K. The Geographic Spread and Preferences of Tourists Revealed by User-Generated Information on Jeju Island, South Korea. Land 2019, 8, 73. [Google Scholar] [CrossRef] [Green Version]
  12. Reed, M. Scientific citizens, smartphones and social media—Reshaping the socio-spatial networks of participation: Insects, soil and food. Morav. Geogr. Rep. 2020, 28, 61–67. [Google Scholar] [CrossRef]
  13. Lansley, G.; Longley, P.A. The geography of Twitter topics in London. Comput. Environ. Urban. Syst. 2016, 58, 85–96. [Google Scholar] [CrossRef] [Green Version]
  14. Getz, D.; Page, S.J. Progress and prospects for event tourism research. Tour. Manag. 2016, 52, 593–631. [Google Scholar] [CrossRef] [Green Version]
  15. Osorio-Arjona, J.; García-Palomares, J.C. Social media and urban mobility: Using twitter to calculate home-work travel matrices. Cities 2019, 89, 268–280. [Google Scholar] [CrossRef]
  16. Vu, H.Q.; Li, G.; Law, R.; Zhang, Y. Tourist Activity Analysis by Leveraging Mobile Social Media Data. J. Travel Res. 2018, 57, 883–898. [Google Scholar] [CrossRef] [Green Version]
  17. Leung, D.; Law, R.; van Hoof, H.; Buhalis, D. Social Media in Tourism and Hospitality: A Literature Review. J. Travel Tour. Mark. 2013, 30, 3–22. [Google Scholar] [CrossRef]
  18. Cristófol, F.J.; Aramendia, G.Z.; De-San-Eugenio-Vela, J. Effects of Social Media on Enotourism. Two Cases Study: Okanagan Valley (Canada) and Somontano (Spain). Sustainability 2020, 12, 6705. [Google Scholar] [CrossRef]
  19. Won, J.; Lee, J.Y.; Jun, J.W. Influences of SNS (Social Network Service) Uses and Musical Consumption on City Branding: A Focus on Broadway, New York and the West End, London. Sustainability 2020, 12, 3856. [Google Scholar] [CrossRef]
  20. Hays, S.; Page, S.J.; Buhalis, D. Social media as a destination marketing tool: Its use by national tourism organisations. Curr. Issues Tour. 2013, 16, 211–239. [Google Scholar] [CrossRef]
  21. Luque-Martínez, T.; Faraoni, N.; Doña-Toledo, L. Auditing the Marketing and Social Media Communication of Natural Protected Areas. How Marketing Can Contribute to the Sustainability of Tourism. Sustainability 2019, 11, 4014. [Google Scholar] [CrossRef] [Green Version]
  22. Garay, L.; Morales, S.; Wilson, J. Tweeting the right to the city: Digital protest and resistance surrounding the Airbnb effect. Scand. J. Hosp. Tour. 2020, 20, 246–267. [Google Scholar] [CrossRef]
  23. Salas-Olmedo, M.H.; Moya-Gómez, B.; García-Palomares, J.C.; Gutiérrez, J. Tourists’ digital footprint in cities: Comparing Big Data sources. Tour. Manag. 2018, 66, 13–25. [Google Scholar] [CrossRef] [Green Version]
  24. Chua, A.; Servillo, L.; Marcheggiani, E.; Moere, A. Vande Mapping Cilento: Using geotagged social media data to characterize tourist flows in southern Italy. Tour. Manag. 2016, 57, 295–310. [Google Scholar] [CrossRef]
  25. Guo, D.; Chen, C. Detecting non-personal and spam users on geo-tagged twitter network. Trans. GIS 2014, 18, 370–384. [Google Scholar] [CrossRef]
  26. Su, X.; Spierings, B.; Hooimeijer, P.; Scheider, S. Where day trippers and tourists go: Comparing the spatio-temporal distribution of Mainland Chinese visitors in Hong Kong using Weibo data. Asia Pac. J. Tour. Res. 2020, 25, 505–523. [Google Scholar] [CrossRef]
  27. Bigné, E.; Oltra, E.; Andreu, L. Harnessing stakeholder input on Twitter: A case study of short breaks in Spanish tourist cities. Tour. Manag. 2019, 71, 490–503. [Google Scholar] [CrossRef]
  28. Wood, S.A.; Guerry, A.D.; Silver, J.M.; Lacayo, M. Using social media to quantify nature-based tourism and recreation. Sci. Rep. 2013, 3, 1–7. [Google Scholar] [CrossRef]
  29. Ahas, R.; Aasa, A.; Roose, A.; Mark, Ü.; Silm, S. Evaluating passive mobile positioning data for tourism surveys: An Estonian case study. Tour. Manag. 2008, 29, 469–486. [Google Scholar] [CrossRef]
  30. Shoval, N.; Ahas, R. The use of tracking technologies in tourism research: The first decade. Tour. Geogr. 2016, 18, 587–606. [Google Scholar] [CrossRef]
  31. Phithakkitnukoon, S.; Horanont, T.; Witayangkurn, A.; Siri, R.; Sekimoto, Y.; Shibasaki, R. Understanding tourist behavior using large-scale mobile sensing approach: A case study of mobile phone users in Japan. Pervasive Mob. Comput. 2015, 18, 18–39. [Google Scholar] [CrossRef]
  32. Šveda, M.; Barlík, P. Daily commuting in the Bratislava metropolitan area: Case study with mobile positioning data. Pap. Appl. Geogr. 2018, 4, 409–423. [Google Scholar] [CrossRef]
  33. Mamei, M.; Colonna, M. Analysis of tourist classification from cellular network data. J. Locat. Based Serv. 2018, 12, 19–39. [Google Scholar] [CrossRef]
  34. Olteanu, A.; Trasarti, R.; Couronné, T.; Giannotti, F.; Nanni, M.; Smoreda, Z.; Ziemlicki, C. GSM data analysis for tourism application. In Proceedings of the 7th International Symposium on Spatial Data Quality, ISSDQ 2011, Coimbra, Portugal, 12–14 October 2011; pp. 21–27. [Google Scholar]
  35. Lambiotte, R.; Blondel, V.D.; de Kerchove, C.; Huens, E.; Prieur, C.; Smoreda, Z.; Van Dooren, P. Geographical dispersal of mobile communication networks. Phys. A Stat. Mech. Appl. 2008, 387, 5317–5325. [Google Scholar] [CrossRef]
  36. Ahas, R.; Aasa, A.; Silm, S.; Tiru, M. Daily rhythms of suburban commuters’ movements in the Tallinn metropolitan area: Case study with mobile positioning data. Transp. Res. Part C Emerg. Technol. 2010, 18, 45–54. [Google Scholar] [CrossRef]
  37. Ratti, C.; Frenchman, D.; Pulselli, R.M.; Williams, S. Mobile landscapes: Using location data from cell phones for urban analysis. Environ. Plan. B Plan. Des. 2006, 33, 727–748. [Google Scholar] [CrossRef]
  38. Ahas, R.; Mark, Ü. Location based services—New challenges for planning and public administration? Futures 2005, 37, 547–561. [Google Scholar] [CrossRef]
  39. Shoval, N. Tracking technologies and urban analysis. Cities 2008, 25, 21–28. [Google Scholar] [CrossRef]
  40. Raun, J.; Ahas, R.; Tiru, M. Measuring tourism destinations using mobile tracking data. Tour. Manag. 2016, 57, 202–212. [Google Scholar] [CrossRef]
  41. Ahas, R.; Aasa, A.; Mark, Ü.; Pae, T.; Kull, A. Seasonal tourism spaces in Estonia: Case study with mobile positioning data. Tour. Manag. 2007, 28, 898–910. [Google Scholar] [CrossRef]
  42. Saluveer, E.; Raun, J.; Tiru, M.; Altin, L.; Kroon, J.; Snitsarenko, T.; Aasa, A.; Silm, S. Methodological framework for producing national tourism statistics from mobile positioning data. Ann. Tour. Res. 2020, 81, 102895. [Google Scholar] [CrossRef]
  43. Silm, S.; Jauhiainen, J.S.; Raun, J.; Tiru, M. Temporary population mobilities between Estonia and Finland based on mobile phone data and the emergence of a cross-border region. Eur. Plan. Stud. 2020, 28, 1–21. [Google Scholar] [CrossRef]
  44. Tiru, M.; Kuusik, A.; Lamp, M.L.; Ahas, R. LBS in marketing and tourism management: Measuring destination loyalty with mobile positioning data. J. Locat. Based Serv. 2010, 4, 120–140. [Google Scholar] [CrossRef]
  45. Nilbe, K.; Ahas, R.; Silm, S. Evaluating the Travel Distances of Events Visitors and Regular Visitors Using Mobile Positioning Data: The Case of Estonia. J. Urban. Technol. 2014, 21, 91–107. [Google Scholar] [CrossRef]
  46. Hardy, A.; Hyslop, S.; Booth, K.; Robards, B.; Aryal, J.; Gretzel, U.; Eccleston, R. Tracking tourists’ travel with smartphone-based GPS technology: A methodological discussion. Inf. Technol. Tour. 2017, 17, 255–274. [Google Scholar] [CrossRef]
  47. Kuusik, A.; Tiru, M.; Ahas, R.; Varblane, U. Innovation in destination marketing: The use of passive mobile positioning for the segmentation of repeat visitors in Estonia. Balt. J. Manag. 2011, 6, 378–399. [Google Scholar] [CrossRef]
  48. McKercher, B.; Lau, G. Methodological Considerations when Mapping Tourist Movements in a Destination. Tour. Anal. 2009, 14, 443–455. [Google Scholar] [CrossRef]
  49. Räsänen, T.; Niska, H.; Hiltunen, T.; Tiirikainen, J.; Kolehmainen, M. Predictive system for monitoring regional visitor attendance levels in large recreational areas. J. Environ. Inform. 2009, 13, 45–55. [Google Scholar] [CrossRef] [Green Version]
  50. Setiadi, Y.; Uluwiyah, A. Improving data quality through big data: Case study on big data-mobile positioning data in Indonesia tourism statistics. In Proceedings of the 2017 International Workshop on Big Data and Information Security (IWBIS), Jakarta, Indonesia, 23–24 September 2017; pp. 43–48. [Google Scholar]
  51. Wu, L.; Chen, C.-H.; Zhang, Q. A Mobile Positioning Method Based on Deep Learning Techniques. Electronics 2019, 8, 59. [Google Scholar] [CrossRef] [Green Version]
  52. Botta, F.; Moat, H.S.; Preis, T. Quantifying crowd size with mobile phone and Twitter data. R. Soc. Open Sci. 2015, 2, 1–6. [Google Scholar] [CrossRef] [Green Version]
  53. Mihály, P.D.; Ionel, I.; Makra, L.; Csépe, Z.; Matyasovszky, I.; Sümeghy, Z.; Tusnády, G. Role of education and skills in Eco-Tourism in Szeged, Hungary. A questionnaire-based study. J. Environ. Prot. Ecol. 2015, 16, 1573–1582. [Google Scholar]
  54. Vitt, R.; Gulyás, Á.; Matzarakis, A. Temporal differences of urban-rural human biometeorological factors for planning and tourism in Szeged, Hungary. Adv. Meteorol. 2015, 2015, 987576. [Google Scholar] [CrossRef] [Green Version]
  55. Crampton, J.W.; Graham, M.; Poorthuis, A.; Shelton, T.; Stephens, M.; Wilson, M.W.; Zook, M. Beyond the geotag: Situating ‘big data’ and leveraging the potential of the geoweb. Cartogr. Geogr. Inf. Sci. 2013, 40, 130–139. [Google Scholar] [CrossRef]
  56. Liu, Y.; Liu, X.; Gao, S.; Gong, L.; Kang, C.; Zhi, Y.; Chi, G.; Shi, L. Social Sensing: A New Approach to Understanding Our Socioeconomic Environments. Ann. Assoc. Am. Geogr. 2015, 105, 512–530. [Google Scholar] [CrossRef]
  57. Raun, J.; Shoval, N.; Tiru, M. Gateways for intra-national tourism flows: Measured using two types of tracking technologies. Int. J. Tour. Cities 2020, 6, 261–278. [Google Scholar] [CrossRef]
  58. Lamp, M.-L.; Ahas, R.; Tiru, M.; Saluveer, E.; Aasa, A. Mobile Positioning Data in Emergency Management: Measuring the Impact of Street Riots and Political Confrontation on Incoming Tourism. In Principle and Application Progress in Location-Based Services; Liu, C., Ed.; Springer: New York, NY, USA, 2014; pp. 295–314. [Google Scholar]
  59. Marton, G.; Hinek, M.; Kiss, R.; Csapó, J. Measuring seasonality at the major spa towns of Hungary. Hung. Geogr. Bull. 2019, 68, 391–403. [Google Scholar] [CrossRef]
  60. Kolcsár, R.A.; Csikós, N.; Szilassi, P. Testing the limitations of buffer zones and Urban atlas population data in urban green space provision analyses through the case study of Szeged, Hungary. Urban. For. Urban. Green. 2021, 57, 126942. [Google Scholar] [CrossRef]
  61. Bertocchi, D.; Camatti, N.; Giove, S.; van der Borg, J. Venice and overtourism: Simulating sustainable development scenarios through a tourism carrying capacity model. Sustainability 2020, 12, 512. [Google Scholar] [CrossRef] [Green Version]
  62. Oklevik, O.; Gössling, S.; Hall, C.M.; Steen Jacobsen, J.K.; Grøtte, I.P.; McCabe, S. Overtourism, optimisation, and destination performance indicators: A case study of activities in Fjord Norway. J. Sustain. Tour. 2019, 27, 1804–1824. [Google Scholar] [CrossRef] [Green Version]
  63. Cheung, K.S.; Li, L.H. Understanding visitor–resident relations in overtourism: Developing resilience for sustainable tourism. J. Sustain. Tour. 2019, 27, 1197–1216. [Google Scholar] [CrossRef] [Green Version]
  64. Jang, H.; Park, M. Social media, media and urban transformation in the context of overtourism. Int. J. Tour. Cities 2020, 6, 233–260. [Google Scholar] [CrossRef]
  65. Baji, P. Using Google Maps road traffic estimations to unfold spatial and temporal inequalities of urban road congestion: A pilot study from Budapest. Hung. Geogr. Bull. 2018, 67, 61–74. [Google Scholar] [CrossRef] [Green Version]
  66. Musterd, S.; Kovács, Z. Place-Making and Policies for Competitive Cities; John Wiley & Sons: Oxford, UK, 2013; ISBN 9781118554579. [Google Scholar]
  67. Lew, A.A. Tourism planning and place making: Place-making or placemaking? Tour. Geogr. 2017, 19, 448–466. [Google Scholar] [CrossRef]
  68. Rickly-Boyd, J.M. The Tourist Narrative. Tour. Stud. 2009, 9, 259–280. [Google Scholar] [CrossRef]
  69. Baka, V. Understanding Valuing Devices in Tourism through “Place-making”. Valuat. Stud. 2015, 3, 149–180. [Google Scholar] [CrossRef] [Green Version]
  70. Irimiás, A.; Mitev, A.; Michalkó, G. The multidimensional realities of mediatized places: The transformative role of tour guides. J. Tour. Cult. Chang. 2020, 18, 1–15. [Google Scholar] [CrossRef]
  71. Hruška, V.; Píša, J. Winning and losing rural localities of the post-socialist economic restructuring: Case study of Czechia. Hung. Geogr. Bull. 2019, 68, 373–389. [Google Scholar] [CrossRef]
  72. Zhang, W.; Derudder, B.; Wang, J.; Shen, W.; Witlox, F. Using Location-Based Social Media to Chart the Patterns of People Moving between Cities: The Case of Weibo-Users in the Yangtze River Delta. J. Urban. Technol. 2016, 23, 91–111. [Google Scholar] [CrossRef]
  73. Xu, F.; Nash, N.; Whitmarsh, L. Big data or small data? A methodological review of sustainable tourism. J. Sustain. Tour. 2020, 28, 147–166. [Google Scholar] [CrossRef]
Figure 1. Data acquisition and processing.
Sustainability 13 02926 g001
Figure 2. Daily counts of tweets related to Szeged by foreigners during the period of investigation (1 July–31 December 2018).
Sustainability 13 02926 g002
Figure 3. Mobile-cell data of foreigners in Szeged during the period of analysis (1 July–31 December 2018).
Sustainability 13 02926 g003
Figure 4. The density of mobile phone records of foreigners in Szeged visiting the dragon boat race (16–21 July 2018).
Sustainability 13 02926 g004
Figure 5. The density of mobile phone records of foreigners in the region of Szeged visiting for the dragon boat race (16–21 July 2018).
Sustainability 13 02926 g005
Table 1. Main peaks of tweeting by foreigners about Szeged (1 July–31 December 2018).
No.DateEvent
1.7–8 JulyRugby Europe Women’s 7s Trophy
2.16–21 July11th IDBF Club Crew World Championships
3.4 Septemberno specific event
4.16 SeptemberEHF CL match between PPD Zagreb/Croatia and Pick Szeged
5.23 SeptemberEHF CL match between Pick Szeged HBC and Nantes/France
6.6 OctoberEHF CL match between Pick Szeged and Celje/Slovenia
7.14 OctoberEHF CL match between Pick Szeged and Flensburg/German
8.21 OctoberHandball match between Veszprém/Hungary and Pick Szeged
9.4 NovemberEHF CL match between Paris Saint-Germain/France and Pick Szeged
10.11 NovemberEHF CL match between Skjern Håndbold/Denmark and Pick Szeged
11.18 NovemberEHF CL match between Pick Szeged and Skjern Håndbold/Denmark
12.24 NovemberEHF CL match between Pick Szeged and Paris Saint-Germain/France
13.28 NovemberEHF CL match between Flensburg/German and Pick Szeged
Table 2. Main peaks by number of foreigners from mobile-cell data about Szeged (1 July–31 December 2018).
No.DateEvent
1.28 July–5 AugustSummer nniversity
2.17–19 Augustno specific event
3.7–8 SeptemberWelcome Camp–Freshmen’s Camp
4.24–28 OctoberCultural festivals
5.3–4 Novemberno specific event
6.9–12 NovemberMusic festival (Jazz Days of Szeged)
7.29 November–1 Decemberno specific event
8.8–9 Decemberno specific event
9.14–16 Decemberno specific event
10.20–23 Decemberno specific event
11.26–30 Decemberno specific event
Table 3. The daily number and share of users related to the 11th IDBF Club Crew World Championships.
DateNumber of Users in SzegedNumber of Users Related to the EventShare of Users Related to the Event
12 July2766724%
13 July2866623%
14 July42415136%
15 July48921444%
16 July65537557%
17 July62039664%
18 July58135361%
19 July66640260%
20 July61937761%
21 July58333157%
22 July50524849%
23 July3269930%
24 July2364519%
25 July2624618%
Publisher’s Note: MDPI stays neutral with regard to jurisdictional claims in published maps and institutional affiliations.

