Article

Use-Related and Socio-Demographic Variations in Urban Green Space Preferences

1
Cartography & GIS Research Group, Department of Geography, Vrije Universiteit Brussel, 1050 Brussels, Belgium
2
Building, Architecture & Town Planning (BATir) Department, Université Libre de Bruxelles, 1050 Brussels, Belgium
*
Author to whom correspondence should be addressed.
Sustainability 2021, 13(6), 3461; https://doi.org/10.3390/su13063461
Submission received: 19 February 2021 / Revised: 12 March 2021 / Accepted: 16 March 2021 / Published: 20 March 2021

Abstract

:
This paper explores use-related and socio-demographic variations in the valuation of urban green space (UGS) characteristics in the Brussels Capital Region (BCR), lending insights into the valuation of the cultural ecosystem services provided by UGS. Mismatches in the supply of and demand for UGS characteristics are also identified. Knowledge on the ways in which valuation of UGS characteristics vary and on an inadequate supply of UGS characteristics should guide and inspire planning and management of UGS to ensure that UGS provision meets the unique needs of communities. Online surveys were conducted in the BCR to determine how people use UGS, how they experience these spaces, and whether these spaces fulfil their needs for urban green Our findings indicate that socio-demographic characteristics (namely age and household composition) correspond with distinct patterns of use and valuation. Two subgroupings of users are identified: nature-oriented users and social users. Our accessibility analysis shows that, compared to social users, nature-oriented users tend to travel farther to reach their most frequently used UGS but are more often satisfied with the supply of UGS characteristics. Our findings point to an inadequate supply of nature and overcrowding of UGS in the city centre of Brussels. We recommend that planners not only consider size and distance in UGS standards but also consider the demand for UGS characteristics as well.

1. Introduction

Understanding how urban residents make use of and value urban green spaces (UGS) is crucial for assessing how people relate to and derive benefit from urban nature. Much literature on ecosystem services, or the benefits provided by ecosystems, emphasizes the benefits of regulating ecosystem services (RES), or services gained from the regulation of ecosystem processes, like pollination and climate and water regulation [1]. This literature tends to frame nature as an instrument to be utilized for human well-being. Recent literature instead promotes the relational value of nature, which emphasizes that ecosystem value is derived from people’s relationships and responsibilities to nature [2,3,4]. Within the ecosystem services (ES) framework, exploring cultural ecosystem services (CES), or the intangible, human benefits derived from UGS, can help us understand the relational value people attribute to nature. CES arise from human-ecosystem interactions and are not inherent to biophysical structures [5,6]. They constitute ecosystems’ nonmaterial benefits to people, like recreation, sense of place, inspiration, opportunities for education, and spiritual enrichment [1]. CES are also understood as the “filters of value through which other ecosystem services and nature derive importance” [2] (p. 1463). They contribute to human well-being “in terms of the identities they help frame, the experiences they help enable, and the capabilities they help equip” [6] (p. 212). CES can be important for fostering environmental stewardship and public engagement [7]. Surveying and understanding of the local demand for CES therefore becomes important for a more responsive urban design and planning such that the supply of CES meets unique local demand. As Gehl expresses, the better a city space is, the more it will be used [8]. This is particularly important for UGS, as benefiting from many of the services provided by UGS is dependent upon use. We must also gain an understanding of use-related and socio-demographic variations in UGS valuation to determine which communities are underserviced with existing UGS provisions.
Several frameworks have been developed to explain the link between the ES that emerge from ecosystems and the human benefits derived. One such commonly cited framework by de Groot et al. [9] is the cascade model. In this model, biophysical structures and functions provide regulating and provisioning services. In turn, these services provide benefits, which gain economic or non-economic value based on the socio-cultural context in which they arise. For example, vegetation cover slows the passage of water, which provides flood protection and contributes to human safety and well-being. Value is therefore attributed to the biophysical structure and reflected in the form of protection policy against development on certain vegetated areas [9]. Expanding upon the cascade model, Buchel and Frantzeskaki [10] propose the “enriched cascade model”, in which they identify a context-dependent (i.e., place-specific, subjective) translation between biophysical structures and CES, from which benefits are perceived. Benefits from ES are mediated not only by the characteristics of the physical space but also by the individual characteristics of the people who use them (e.g., age, occupation, gender) and the societal context in which they live (e.g., their cultural background, their social networks) [11]. Perception of ecosystem value is, therefore “the experienced and recognized ecosystem benefits by humans in their local context” [10] (p. 170). Fish, Church, and Winter [6] also make explicit the link between biophysical structures and the CES derived. In the framework which they propose biophysical domains provide opportunities for cultural practices to occur. These cultural practices are the activities performed that anchor people to each other and to their natural surroundings, like walking, relaxing, looking and listening, photography, and food production. Benefits that contribute to users’ sense of identities, experiences, and capabilities emerge from and shape the cultural practices performed in environmental spaces.
Building upon the existing literature on CES we have articulated a scheme (Figure 1) that illustrates our view of the process by which individuals within specific physical and socio-economic contexts come to value ES provided by UGS (adapted from [6,10,11]). Individuals are situated within and formed by societies. The values which they attribute to nature and urban green spaces are also shaped by the neighbourhood they live in. It is through this lens that they come into contact with and perceive UGS. Each UGS has a unique composition of physical characteristics (e.g., trees, water features, benches, paved paths, lawn), which, in conjunction with a user’s characteristics, values and use patterns, create distinct experiences of the space. Through interaction, individuals perceive the benefits provided by UGS. Valuation of UGS and their characteristics emerge as a result of the perceived benefits of these spaces. The CES delivered by a UGS are thus dependent upon the physical characteristics of the UGS and the experience/background of the individual using the UGS. Use is therefore a mediating factor between the supply of and benefits drawn from UGS. In this paper, we will focus on the role of socio-demographic characteristics and use patterns in how people perceive and value UGS. The role of neighbourhood characteristics will not be explicitly addressed in this study.
The use and valuation of UGS have been shown to differ based on the socio-demographic characteristics of users [6,11,12,13,14,15,16]. In Guangzhou, China, Shan [14] found that use and perception of UGS varied by gender, age, and occupation. Ode Sang et al. [16] identified that women associate a greater sense of well-being with UGS than men, which increased with age for women but remained unchanged for men. Kloek et al. [15] conclude that differences in recreational behaviour between cultural groups are complex and substantial.
While there is a growing body of literature pointing to the socio-demographic variations in use and valuation of UGS, little research has been conducted on how socio-demographic variations relate to bundles of CES (or the synergies between CES), rather than individual CES. As such, understanding of the variations in use and valuation by different socio-demographic groups remains understudied. Furthermore, existing research on ES mismatch, defined as “the differences in quality or quantity between the supply and demand of ES” [17] (p. 320), primarily focused on identifying the gaps between supply and demand of regulating and provisioning ES [18,19,20]. Assessment of the mismatch between perceived supply and local demand for CES provided by UGS should be integrated into planning UGS that meet the unique needs of local communities [21,22,23]. In this study, we adopt the definitions of supply and demand of CES proposed by Tratalos et al. [24], where supply is “the availability of opportunities for cultural practices within environmental spaces” and demand is “the needs, desires and intentions of people to exploit these opportunities” (p. 65). As they state, the supply of CES is largely determined by the “location and quality of individual environmental spaces”, while demand is “determined largely by the preferences, values and practices of local populations” (p. 68).
This research explores the valuation of UGS in relation to patterns of use and socio-demographic characteristics of individuals within the Brussels Capital Region. It also evaluates the CES mismatch between UGS supply and demand in the region. We then propose recommendations for urban planning based on the findings of this research. To achieve the research goals, the main research questions are: (1) Do different patterns of use correspond to distinct valuations of certain (bundles of) UGS characteristics? (2) How do socio-demographic characteristics mediate the valuation of UGS characteristics? (3) Are there mismatches between supply and demand of UGS characteristics and accessibility to UGS? (4) For which patterns of use/socio-demographic groups are these mismatches most prominent? (5) How can insights gained from this research inform urban planning? With this research, we aim to contribute to the scholarship on the valuation of nature in urban areas through the lens of CES. We identify whether and how specific socio-demographic variables relate to distinct patterns of use and valuation of UGS characteristics. We explore the notion of CES mismatch in the region to highlight for whom supply does not meet demand. From our findings, recommendations to urban planners are made such that planners can address not only the environmental need for UGS but the human need as well.

2. Materials and Methods

2.1. Study Area

This research was conducted in the Brussels Capital Region (BCR), which encompasses the city of Brussels, the most densely populated city of Belgium. The population of 1.2 million inhabitants is spread unevenly across 19 communes, covering 161 km2. The average regional population density is high (74.4 inhabitants/ha), but varies considerably per commune (233 inhabitants/ha in the most densely populated commune, 19 inhabitants/ha in the least densely populated commune) [25]. The population of Brussels is diverse; approximately 35% of residents of Brussels do not have Belgian citizenship [26]. Although the city claims to offer 26 m2 of public green space per inhabitant [27], access to green is unequal, with green in the city centre of lesser quality and abundance than in the periphery [28,29,30]. Figure 2 shows the amount of green within a 400 m radius of each building block. Large UGS have been highlighted in dark green. The Sonian Forest, which lies along the southeast edge of the city, consists of 5000 ha of forested area and significantly increases measurements of per capita green space provision. A recent study undertaken in the BCR used GIS-based modelling to analyse UGS accessibility and quality. Findings show a concentric pattern of low proximity and low quality in the dense centre of the BCR, meaning nearly two-thirds of the population were found to be without access to high quality urban green [28]. Research on the satisfaction of green spaces in the BCR found that while more families were very satisfied (34%) than dissatisfied (25%), satisfaction differed strongly between neighbourhoods [31], indicating that differences in satisfaction may be related to the spatial distribution of green spaces and/or varying demand in different neighbourhoods.

2.2. Data Collection

2.2.1. Survey Design

To research the use and valuation of UGS in the BCR, a survey of the Brussels population was conducted. Survey responses were collected over a period of five months, between September 2019 and January 2020. The online survey tool Maptionnaire was used to conduct the survey. Our survey design was inspired by Bertram and Rehdanz [32] and Rall et al. [33]. The survey consisted of six main sections, translated into Dutch, French, and English. Respondents were first presented with a welcome screen explaining the content and purpose of the survey, as well as the approximate time expected to complete the survey (15 min). Next, respondent information was collected, including age, gender, employment status, household composition, the highest diploma obtained, income, nationality, and cultural roots. The second section asked respondents to rate the importance of ES benefits provided by UGS, including both regulating and cultural ES (e.g., improving air quality, providing opportunities for recreation) and to rate their preferences for certain green space characteristics (e.g., water features, paved paths, playgrounds). Respondents were then asked to locate and place a point on the building block where they live. The next two sections posed closed-ended questions on use of green spaces in the BCR. Respondents were first asked to select the name of or place a point on the green space they most frequently use and to answer a set of questions about this green space, including how often they visit the UGS, with whom they use the UGS, activities done in the UGS, and likes and dislikes about the UGS. Finally, respondents were given the opportunity to provide additional thoughts in an open-ended question. A distinction was made between the use of large green spaces (>6 ha) and small green spaces (<6 ha). The research reported in this paper pertains to the use of large green spaces only, including parks, large cemeteries, and urban forests. Small green spaces show different use patterns and fulfil different needs [34,35,36,37] and are therefore the subject of a separate study. The survey was revised after a round of piloting before dissemination.

2.2.2. UGS Characteristics as Indicators of CES

Often in literature, the valuation of UGS is assessed in economic terms as a willingness to pay [38,39,40]. However, CES can be difficult or impossible to express in monetary terms [5]. Similar to a survey conducted by Bertram and Rehdanz [32], we asked our survey respondents to identify the UGS characteristics they consider valuable. First, respondents were asked to rate the importance of CES in their ideal UGS on a four-point Likert scale (1 = Not important, 2 = slightly important, 3 = important, 4 = very important). We then had respondents identify their top three motivations for using UGS and select the characteristics that contribute positively or negatively to the experience of their most frequently used UGS. Participants were able to write in their own characteristics if they were missing from the list we provided. The list of UGS uses is shown in Table 1 and the list of positive and negative UGS characteristics can be found in Table 2. Uses and characteristics were selected based on a survey of the literature, notably Plieninger et al. [41], Bertram and Rehdanz [32], and Rall et al. [33].

2.2.3. Survey Dissemination

A link to the survey was disseminated through the networks of several environmental organizations in Brussels and shared on social media pages dedicated to each of the Brussels’ municipalities, and to social media pages for expats and individuals with a shared interest (e.g., hikers, language learners). Stratified sampling was used to select 32 building blocks in areas of Brussels with varying green provision. Flyers advertising the survey were delivered to these building blocks. Posters calling for participants were hung around libraries and university campuses. The link was also sent to several community centres and included in articles on popular Brussels-based French, Dutch, and English news media websites. After the survey had been live for several months, we analysed the pool of survey respondents and identified underrepresented socio-demographic subgroups of the population. We then released targeted Facebook ads to reach these respondents (i.e., males, persons of non-Belgian origin, and persons without higher education).

2.3. Data Analysis

Data were analysed in SPSS Statistics 26 and R (version 3.5.3). Partial responses were included in the analysis as long as one or more of the relationships in question could be examined. All open-ended responses given to questions when the category “other” was selected were coded. Graphs were produced to summarize descriptive statistics of respondent socio-demographic information, use of UGS and valuation of UGS characteristics. Data analysis was divided into two parts: exploring variations in the valuation of UGS characteristics and identifying mismatches in UGS supply and demand.

2.3.1. Relationships between Patterns of Use and Valuation of Most Frequently Visited UGS

Respondents were asked to select their top three motivations for using the UGS they most frequently visit and the characteristics that contribute to a positive experience of the UGS. They were also asked to list up to three features they dislike about this UGS. A multiple correspondence analysis (MCA) was conducted between responses to these questions to explore the link between uses undertaken in a UGS and valuation of the UGS characteristics. Potential bundles of uses and valued characteristics were identified in the MCA output. Statistically significant differences between the valuation of UGS characteristics for groups with dissimilar patterns of use were explored using chi-squared tests for independence. Chi-squared tests were conducted to detect differences in the UGS characteristics that contribute to a negative experience of a UGS between users with dissimilar patterns of use.

2.3.2. Socio-Demographic Variations in Use and Valuation of Most Frequently Visited UGS

Variations in use and valuation were analysed for several socio-demographic groups, based on differences in gender, age, and household composition. Socio-demographic variables were incorporated in the MCA as supplementary variables to explore whether distinct socio-demographic groups tend toward different patterns of use and valuation of UGS characteristics. Chi-squared tests were used to detect statistically significant differences in valuation of UGS characteristics for different socio-demographic groups identified in the MCA analysis.

2.3.3. Identifying Mismatches in UGS Provision

Mismatches of UGS provision were identified by determining the overlap between the UGS characteristics that a respondent identified as important or very important and those that are missing from or contribute negatively to their experience of the UGS they most frequently use. In other words, if a respondent indicated that safety was important but also indicated feeling unsafe in the UGS he/she most frequently uses, this would be identified as a mismatch. Mismatches were identified for respondents with different use patterns, and for different socio-demographic groupings. We also looked at mismatches in terms of accessibility. Within urban planning, accessibility of UGS is often measured in terms of standards, or the quantification of distance from and area of UGS [28,42,43]. Based on a review of literature on UGS proximity standards, Stessens et al. [28] determined that urban residents should have access to a UGS of a minimum of 6ha within a distance of around 1000 m. Accessibility, as perceived by UGS users, may differ though depending on the type of user. To identify mismatches in accessibility, we, therefore, looked at differences in self-reported travel time by respondents in different use categories and socio-demographic groupings. Finally, chi-squared tests were used to determine whether respondents with different perceptions of accessibility differ in their use of UGS and their valuation of different characteristics of UGS.

3. Results

3.1. Survey Respondents

In total, 1751 responses were recorded, of which 1206 are complete (69%) and 547 are partial (31%). Of the respondents who provided socio-demographic information, 67.4% are female and 31.7% male. Compared to the gender makeup of the BCR (50.1% female, 49.9% male) [44], female respondents are clearly overrepresented. The large majority of respondents have completed or are in the process of completing higher education (89%). Most respondents are between the ages 30 and 44 (42.7%), followed by 45 to 64 (27.6%), 18 to 29 (18.3%), and 65 to 80 (9.7%). As very few respondents are under 18 or over 80 (<2%), responses from these age groups have been excluded from the analysis. Compared to the demographic composition of the BCR, 30 to 44-year-olds and 45 to 64-year-olds are overrepresented, while respondents over 80 are slightly underrepresented. Half of the respondents use a UGS weekly (50.3%), followed by monthly (24.5%), daily (18.6%), and yearly (6.5%) users.

3.2. Motivation for Use of UGS and Valuation of UGS Characteristics

Of the reasons mentioned by respondents for visiting the UGS they most frequently use, relaxation is the most cited motivation (selected 850 times), followed by exercise (394), and being close to trees, plants and animals (337). Being around people (73), spiritual reasons/inspiration (63), and cooling down (35) are the least cited reasons. Of the UGS characteristics that contributed to a positive experience of the UGS, spaciousness (23%), enjoyment of trees, plants and animals (22%), and quietness (14%) are cited most often, while feeling safe (4%), availability of facilities/equipment (4%), and paved paths (1%) contribute least to a positive experience of the UGS. Having to cross a busy road (18%), being too far from the respondent’s home, school, or place of work (11%), and busyness (11%) contribute most to a negative experience of a UGS.

3.2.1. Bundling Motivation for Use of UGS and Valuation of UGS Characteristics

An MCA analysis was performed to identify distinct bundles of patterns of use and valuation of UGS characteristics. Motivations for use of UGS selected by fewer than 100 respondents were excluded from the MCA (i.e., cooling down, for spiritual reasons, being around people). The MCA results are presented in Figure 3, in which motivations for use are indicated with a triangle and UGS characteristics with a square. Variables furthest from the origin have the strongest impact on the structuring of the data in feature space (e.g., facilities, attending events, quietness), while those closest to the origin have a small impact (e.g., water features, relaxation). Two distinct groups can be detected: (1) respondents who use and value UGS characteristics with a nature-oriented focus (to the left of the y-axis) and (2) respondents who use and value UGS characteristics with a social focus (to the right of the y-axis).
To delve into the differences between these groups, the valuation of UGS characteristics was examined in more detail for respondents who use UGS for nature-oriented versus social reasons. Respondents who indicated using a UGS to be around trees, plants, and animals or for peace and quiet were included in the nature-oriented group (34% of respondents), while respondents who indicated using a UGS to bring a child to play, for attending events, or to gather with friends and family were included in the social group (36% of respondents). Respondents who indicated using UGS for both nature-oriented and social purposes simultaneously, which represented only 7% of all respondents, were excluded. UGS characteristics that respondents in these groups like and dislike were analysed and chi-squared tests were performed to identify where differences in valuation were statistically significant (see Appendix A Table A1 and Table A2). Nature-oriented users significantly value trees, plants and animals, quietness, and UGS that are not too busy more often than social users, whereas social users more often value the presence of lawns, shaded areas, facilities/equipment, and safety (Figure 4a). Overall, few dislikes are reported by respondents in either group. The most disliked characteristic (“It is usually too busy”) is disliked by 18% of social users (Figure 4b). There are no UGS characteristics that are disliked more by nature-oriented users for which the difference between valuation by nature-oriented and social users is statistically significant. Conversely, several characteristics are significantly more often disliked by social users, including busyness, failure to providing a sense of being in nature, and lack of important facilities.

3.2.2. Motivation for Use of UGS and Valuation of UGS Characteristics in Relation to Socio-Demographic Characteristics

Socio-demographic groupings were defined to examine how variables like age, gender, and household composition affect people’s motivation for visiting UGS as well as like/dislike of certain UGS characteristics. These were added as supplementary variables to the MCA (highlighted in blue in Figure 3) both as individual variables and as composite variables (e.g., age combined with household composition). Figure 3 shows the MCA output with the barycentre of specific socio-demographic profiles overlaid in blue. Age proves to be the most important determinant for differences in the use and valuation of UGS. Gender, occupation, and income did not have a strong impact on the positioning of respondents in MCA feature space and were therefore excluded from the plot. Having a child in the household is a significant factor for the 30 to 44 age group, but not for other age groups.
Graphs were made to highlight differences in valuation of UGS characteristics by socio-demographic groups that, according to the MCA, have different patterns of use and valuation, namely the 18 to 29 and 65 to 79 age groups and the 30 to 44 age group divided into participants with and without children living in the household. Chi-squared tests for independence were conducted to identify statistically significant differences between responses from these groups (See Appendix A Table A3 and Table A4). Respondents in the 18 to 29 age group more often indicate appreciation of spaciousness and presence of lawns, while respondents in the 65 to 79 age group more often value nature-oriented services, like quietness and enjoyment of trees, plants, and animals (Figure 5a). Figure 5b shows the positive valuation of UGS characteristics by respondents in the 30 to 44 year age group with and without children. Respondents with children more often appreciate functional characteristics, like availability of facilities and lawns, while respondents without children appreciate natural characteristics to a greater degree, including the opportunity to be around trees, plants, and animals, and quietness.

3.3. Identifying Mismatches in UGS Provision

3.3.1. Mismatches in UGS Characteristics

Mismatches in UGS characteristics are identified as instances where respondents indicate that a certain characteristic is important (ranked either “important” or “very important”) in their ideal UGS but also express that the characteristic is not present in the UGS they most frequently use. Figure 6 shows the percentage of respondents for each UGS characteristic for which a mismatch is present. A total of 15% of respondents who value a UGS that is not too busy indicate that the busyness of their most frequently used UGS contributes to a negative experience of the UGS. Busyness is followed by mismatches due to noisiness (14%), missing water features (14%), missing facilities (10%), dirtiness (9%), feelings of unsafety (5%), missing paved paths (2%), and lack of shade (1%).
Mismatches were also analysed for subgroupings of respondents with different UGS preferences, as identified in Section 3.2. Compared to nature-oriented UGS users, social users more often experience mismatches due to the busyness of UGS and missing facilities (Figure 7a). Considering the same socio-demographic divisions explored in Section 3.2, differences in mismatches are identified between the age groups 18 to 29 and 65 to 79 and 30 to 44-year-olds with and without children. 18 to 29-year-olds more often experience a mismatch due to UGS being too busy (Figure 7b). Compared to 30 to 44-year-olds with children, 30 to 44-year-old respondents without children more often experience a mismatch due to noisiness. Those with children more often indicate that their UGS is missing important facilities and/or equipment (Figure 7c).

3.3.2. Mismatches in Accessibility

Self-reported accessibility in terms of estimated time taken to travel to a UGS was explored for several subgroupings of respondents. Overall, nature-oriented users travel significantly longer than social users. 55% of social users travel less than 10 min to reach their indicated UGS, while only 43% of nature-oriented users reach their UGS in the same travel time (Figure 8a). Compared to the social use group, nearly twice as many respondents in the nature-oriented category travel 20 to 30 min to reach their UGS (14% compared to 8%). In terms of differences between socio-demographic subgroupings, 30 to 44-year-old respondents without children more often report travelling longer to reach their UGS than respondents with children; 43% of respondents without children travel less than 10 minutes, compared to 59% of respondents with children (Figure 8b).
Comparing those who indicate that a UGS is nearby or too far, there are no significant differences in gender, age, or household composition. However, there were differences identified between perceptions of accessibility based on use patterns and valuation of the UGS characteristics of respondents’ most frequently used UGS. Respondents who indicate that their UGS is too far tend to use their selected UGS more for peace and quiet, fresh air, cooling down, or to gather with friends and family than those who indicate that the UGS they visit is nearby, while those indicating that their UGS is nearby use it more frequently for exercising (Figure 9a). Respondents who indicate that their UGS is too far more often favour spaciousness, the presence of trees, plants, and animals, quietness, water, and spaces that are not too busy compared to respondents who indicate that their UGS is nearby (Figure 9b). See Appendix B Table A8 and Table A9 for the chi-squared test of independence accompanying Figure 9a,b.

4. Discussion

Our analysis shows that the valuation of UGS characteristics is dependent on a complex interplay of use patterns, socio-demographic factors, and accessibility to UGS. In the following section, we outline the main findings on the valuation of UGS characteristics as they vary by patterns of use and socio-demographic factors. We also discuss findings on ES mismatch and their implications for planning UGS that meet the unique demands of local inhabitants.

4.1. Interplay of Use and Socio-Demographic Factors on Valuation of UGS Characteristics

Like several previous studies [5,33,41,45], we identify bundles of UGS characteristics that prove to be related to different types of uses, which further substantiates previously asserted claims that there are synergies between UGS characteristics. Similar to findings by Plieninger et al. [41] and Rall et al. [33], we identify two distinct bundles of use and valuation: a group geared toward nature-oriented uses and another toward social uses. Our findings show that nature-oriented uses correspond to an appreciation for natural characteristics (e.g., enjoyment of trees, plants, and animals, quietness, calmness), while social-oriented uses correspond with an appreciation for characteristics that facilitate specific uses (e.g., lawns, facilities, shaded areas).
Regarding UGS characteristics that contribute negatively to the experience of nature-oriented and social users (Figure 4b), respondents in the social group more often indicate that their UGS is too busy or does not provide a sense of being in nature. According to the MCA output, appreciation of these qualities is more closely aligned with the nature-oriented group. It, therefore, seems that these characteristics are important to social users as well but are often not present in the UGS they use. Nature-oriented users appear to be more satisfied with the supply of the characteristics they value in the UGS they use. Our findings suggest that nature-oriented users may be more selective in their choice of UGS. This is confirmed by the fact that they seem prepared to travel further to reach their most frequently used UGS than social users (see also Section 4.2).
Our research expands upon previous insights into the influence of socio-demographic factors on the use and valuation of UGS characteristics [13,14,16,41]. While some studies find that gender is a significant factor in UGS use [14,16], we did not observe this in our research. In terms of age and household composition, the general trend was that older user groups tend more toward valuing nature, while younger groups value opportunities for social use (similar to Schipperijn et al. [21], Ode Sang et al. [16], and Fischer et al. [46]). Having a child in the household was determined to be an important factor in the use of UGS and the valuation of UGS characteristics. Of respondents in the 30 to 44 age group, those with a child in the household more often appreciate the availability of lawns and facilities when compared to respondents without children. This is likely because these characteristics facilitate playing activities.

4.2. Identification of Mismatches Point to Shortfalls of City Centre UGS

Mismatches are identified as an inadequate supply of UGS characteristics, such that a demand for UGS is not met. We find that mismatch may be explained in part by the time travelled to UGS. Nature-oriented users were found to travel longer to reach UGS than social users and more often indicate that the UGS they visit most frequently is too far away. Most social users make use of UGS within 10 min of their home, school, or place of work, but more often encounter negative UGS aspects like overcrowding. We, therefore, assume that nature-oriented users make the deliberate choice to visit UGS further away that better meet their needs, despite having the option to visit a closer UGS. Less crowded, larger green spaces offering a sense of being in nature are indeed mostly found in the periphery of the BCR or outside the region’s borders [47]. They are thus, for the majority of Brussels’ residents, further away from their place of residence. These observations are in line with Rall et al. [33]. Their research in Berlin found that inner-city green was more often used for recreation and social opportunities, while forested areas along the city’s outer edge were associated with more nature-oriented use. They also found that perceptions of overcrowding were more often found to be experienced in the inner-city, due to the relationship between high population density and provision of urban green space. It is therefore likely that there is a spatial aspect to the choice behaviour of UGS users in the BCR. Future work focusing on a spatially explicit analysis of parks visited by Brussels’ citizens in relation to their place of residence will enable us to explore these findings in more detail.
Unlike Shan [14], who found that respondents who use UGS for “playing with children” were more likely to travel longer than any other use group, we found that respondents with children on average had the shortest travel time. This does however correspond with research from Schipperijn et al. [21], in which it was found that personal factors like having a young child reduce mobility. As a result, respondents without children are able to travel farther to larger UGS while respondents with children typically defaulted to visiting the closest UGS.
Our findings support the framework outlined in the introduction detailing the process by which CES provision translates to valuation (Figure 1). We find that valuation is tied to (overlapping) socio-demographic and UGS characteristics as well as distinct patterns of UGS use. This framework, therefore, has the potential to guide our understanding of the complex process by which individuals come to value UGS and UGS characteristics. With this knowledge, we can better understand the demand for UGS characteristics, with socio-demographic characteristics, patterns of use, and accessibility as key factors to take into consideration. In this article, we have only explored the influence of socio-demographic and UGS characteristics, but future research will integrate societal and neighbourhood characteristics into the analysis. It will also be important to delve further into differences in valuation by respondents with distinct overlapping socio-demographic profiles.

4.3. Implications for Urban Planning and UGS Management

Future planning to improve and increase UGS in cities will require detailed information on ES, including the social valuation of these services [11,48]. Studies like ours are necessary to identify the met and unmet demands of individuals and may inform policymakers and city planners of the UGS provision and management needed to meet users’ needs [21,22,23]. Basic information on wanted and unwanted UGS characteristics provide clear insights to improve UGS. For instance, we find that respondents indicate wanting more water features, while there is little desire for more paved paths. The uniform lack of appreciation for paved paths by all respondents may point rather to a preference for unpaved or “natural” walkways over paved tracks. These basic insights provide a clear starting point for the design elements of future UGS and changes to existing UGS.
One important finding of our research was that nature-oriented users travel farther to reach UGS and more often feel that the UGS they visit is too far. There is a clear need to bring more natural features to city centre UGS in the form of, for example, “pockets” of nature in the city. While space in the city centre, in particular, is in high demand, the pressure to develop must be resisted in favour of expanding green in order to provide for the mental and physical well-being of residents. Planners must identify ways to bring green to the city centre in the form of smaller UGS, satisfying the expressed need for naturalness and quietness in UGS. This will require greening non-traditional spaces, e.g., with the use of nature-based solutions, and finding innovative solutions to problems more often associated with city centre UGS, such as noise pollution. Concepts like the 15-Minute City can serve as frameworks to ensure that green (among other essential provisions) are available to all urban residents within a short, walkable distance [49]. This in particular may benefit groups with limited mobility, for whom nearby UGS is essential, such as parents of young children. Additionally, planners should take steps to improve the quality of city centre UGS in such ways that the needs of both nature-oriented and social users are met. This may involve limiting the activities possible in certain UGS to accommodate different patterns of use (e.g., zones for relaxation, zones for play). It may also be necessary to identify ways to bring feelings of spaciousness to UGS implemented where space is limited, as spaciousness is identified by respondents as an essential trait.
As the use and valuation of UGS are clearly linked to personal and group characteristics, it is necessary not only to include users in the design of UGS but to make them central to the design process. Planners should thus make use of available surveying tools to design UGS that meet the varying demands of communities. It is also important for green space planners to maximise the synergies between certain patterns of use and valuation, while protecting against potential conflicts of use [48]. Animators in UGS must have a good understanding of who is using UGS and for what reasons, what conflicts may arise, which facilities are particularly important, etc. Knowledge of the socio-demographic variations in use may highlight adjustments that should be made to accommodate limitations in mobility. For instance, planners designing UGS for nature-oriented use, which will be widely utilized by older age groups, should be considerate of the availability of benches and shade [46]. Measures should also be taken in city centre UGS to accommodate use by young children.

5. Conclusions

It is clear that the well-being of urban residents depends greatly on the ES provided by UGS. It is therefore imperative that valuation of CES and, in particular, use-related and socio-demographic variations in valuation are better understood. The process by which individuals come to value ES is dependent upon the experiences produced by use, socio-demographic factors, and accessibility to UGS.
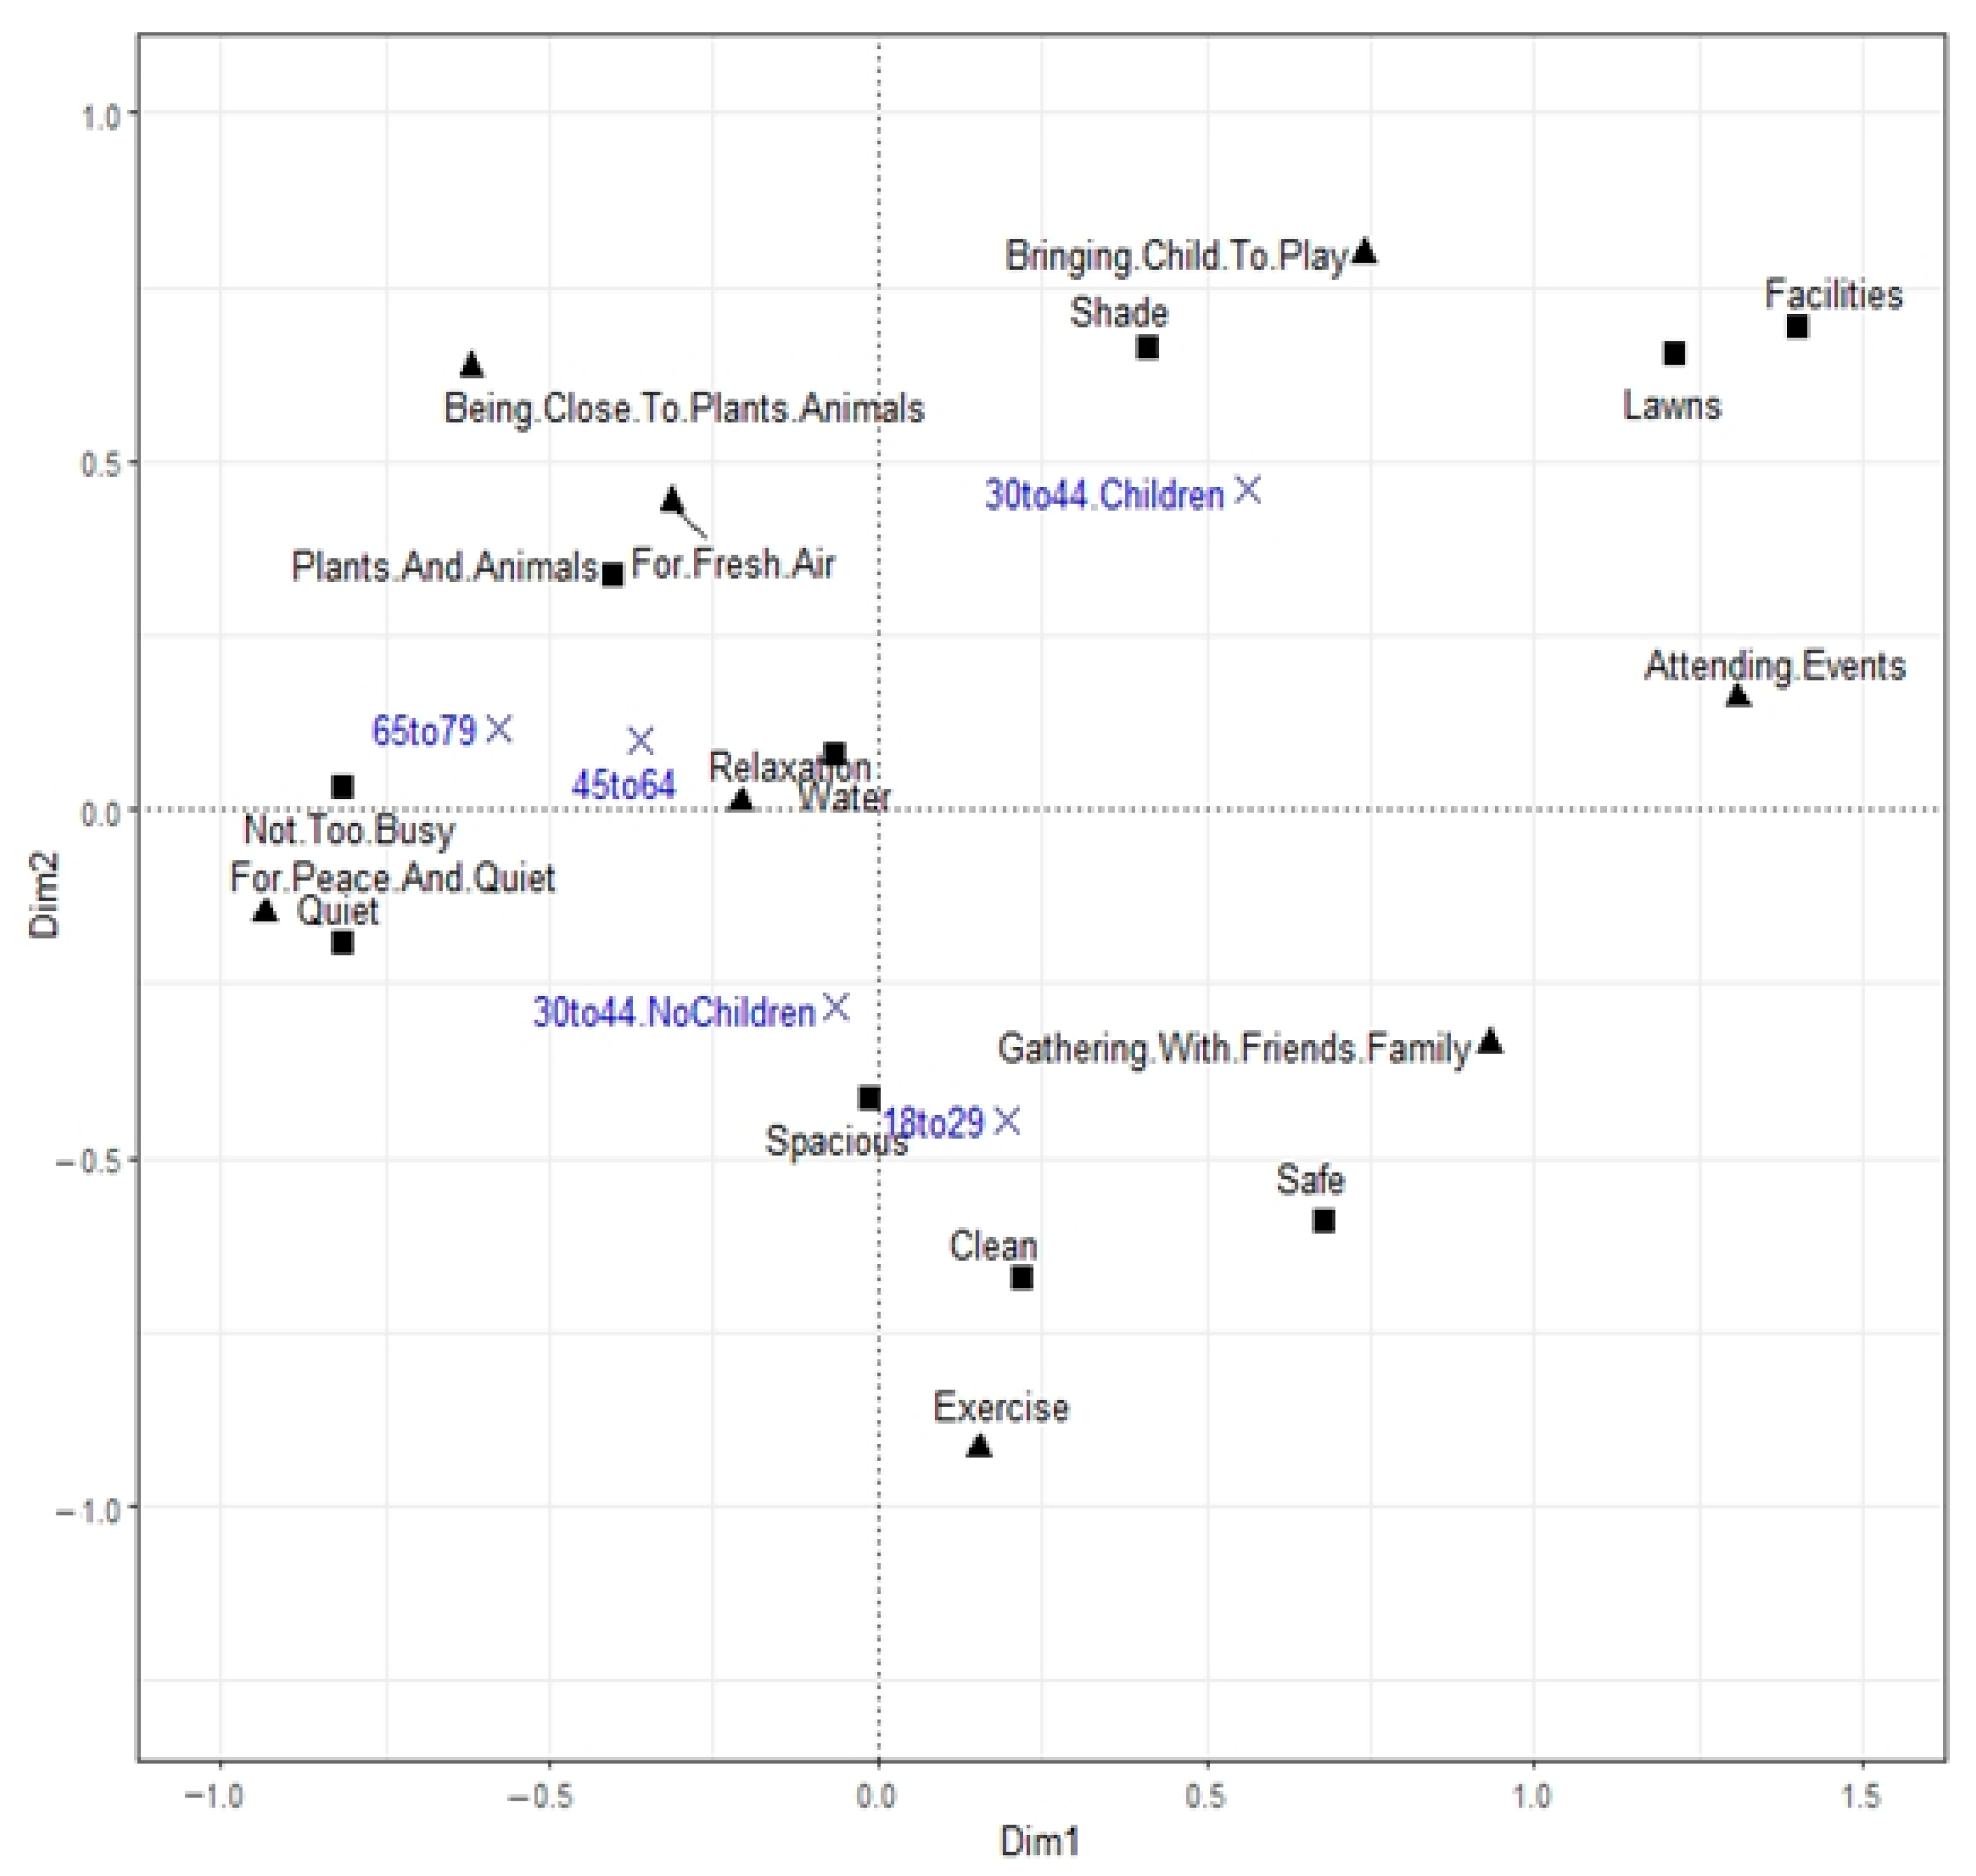
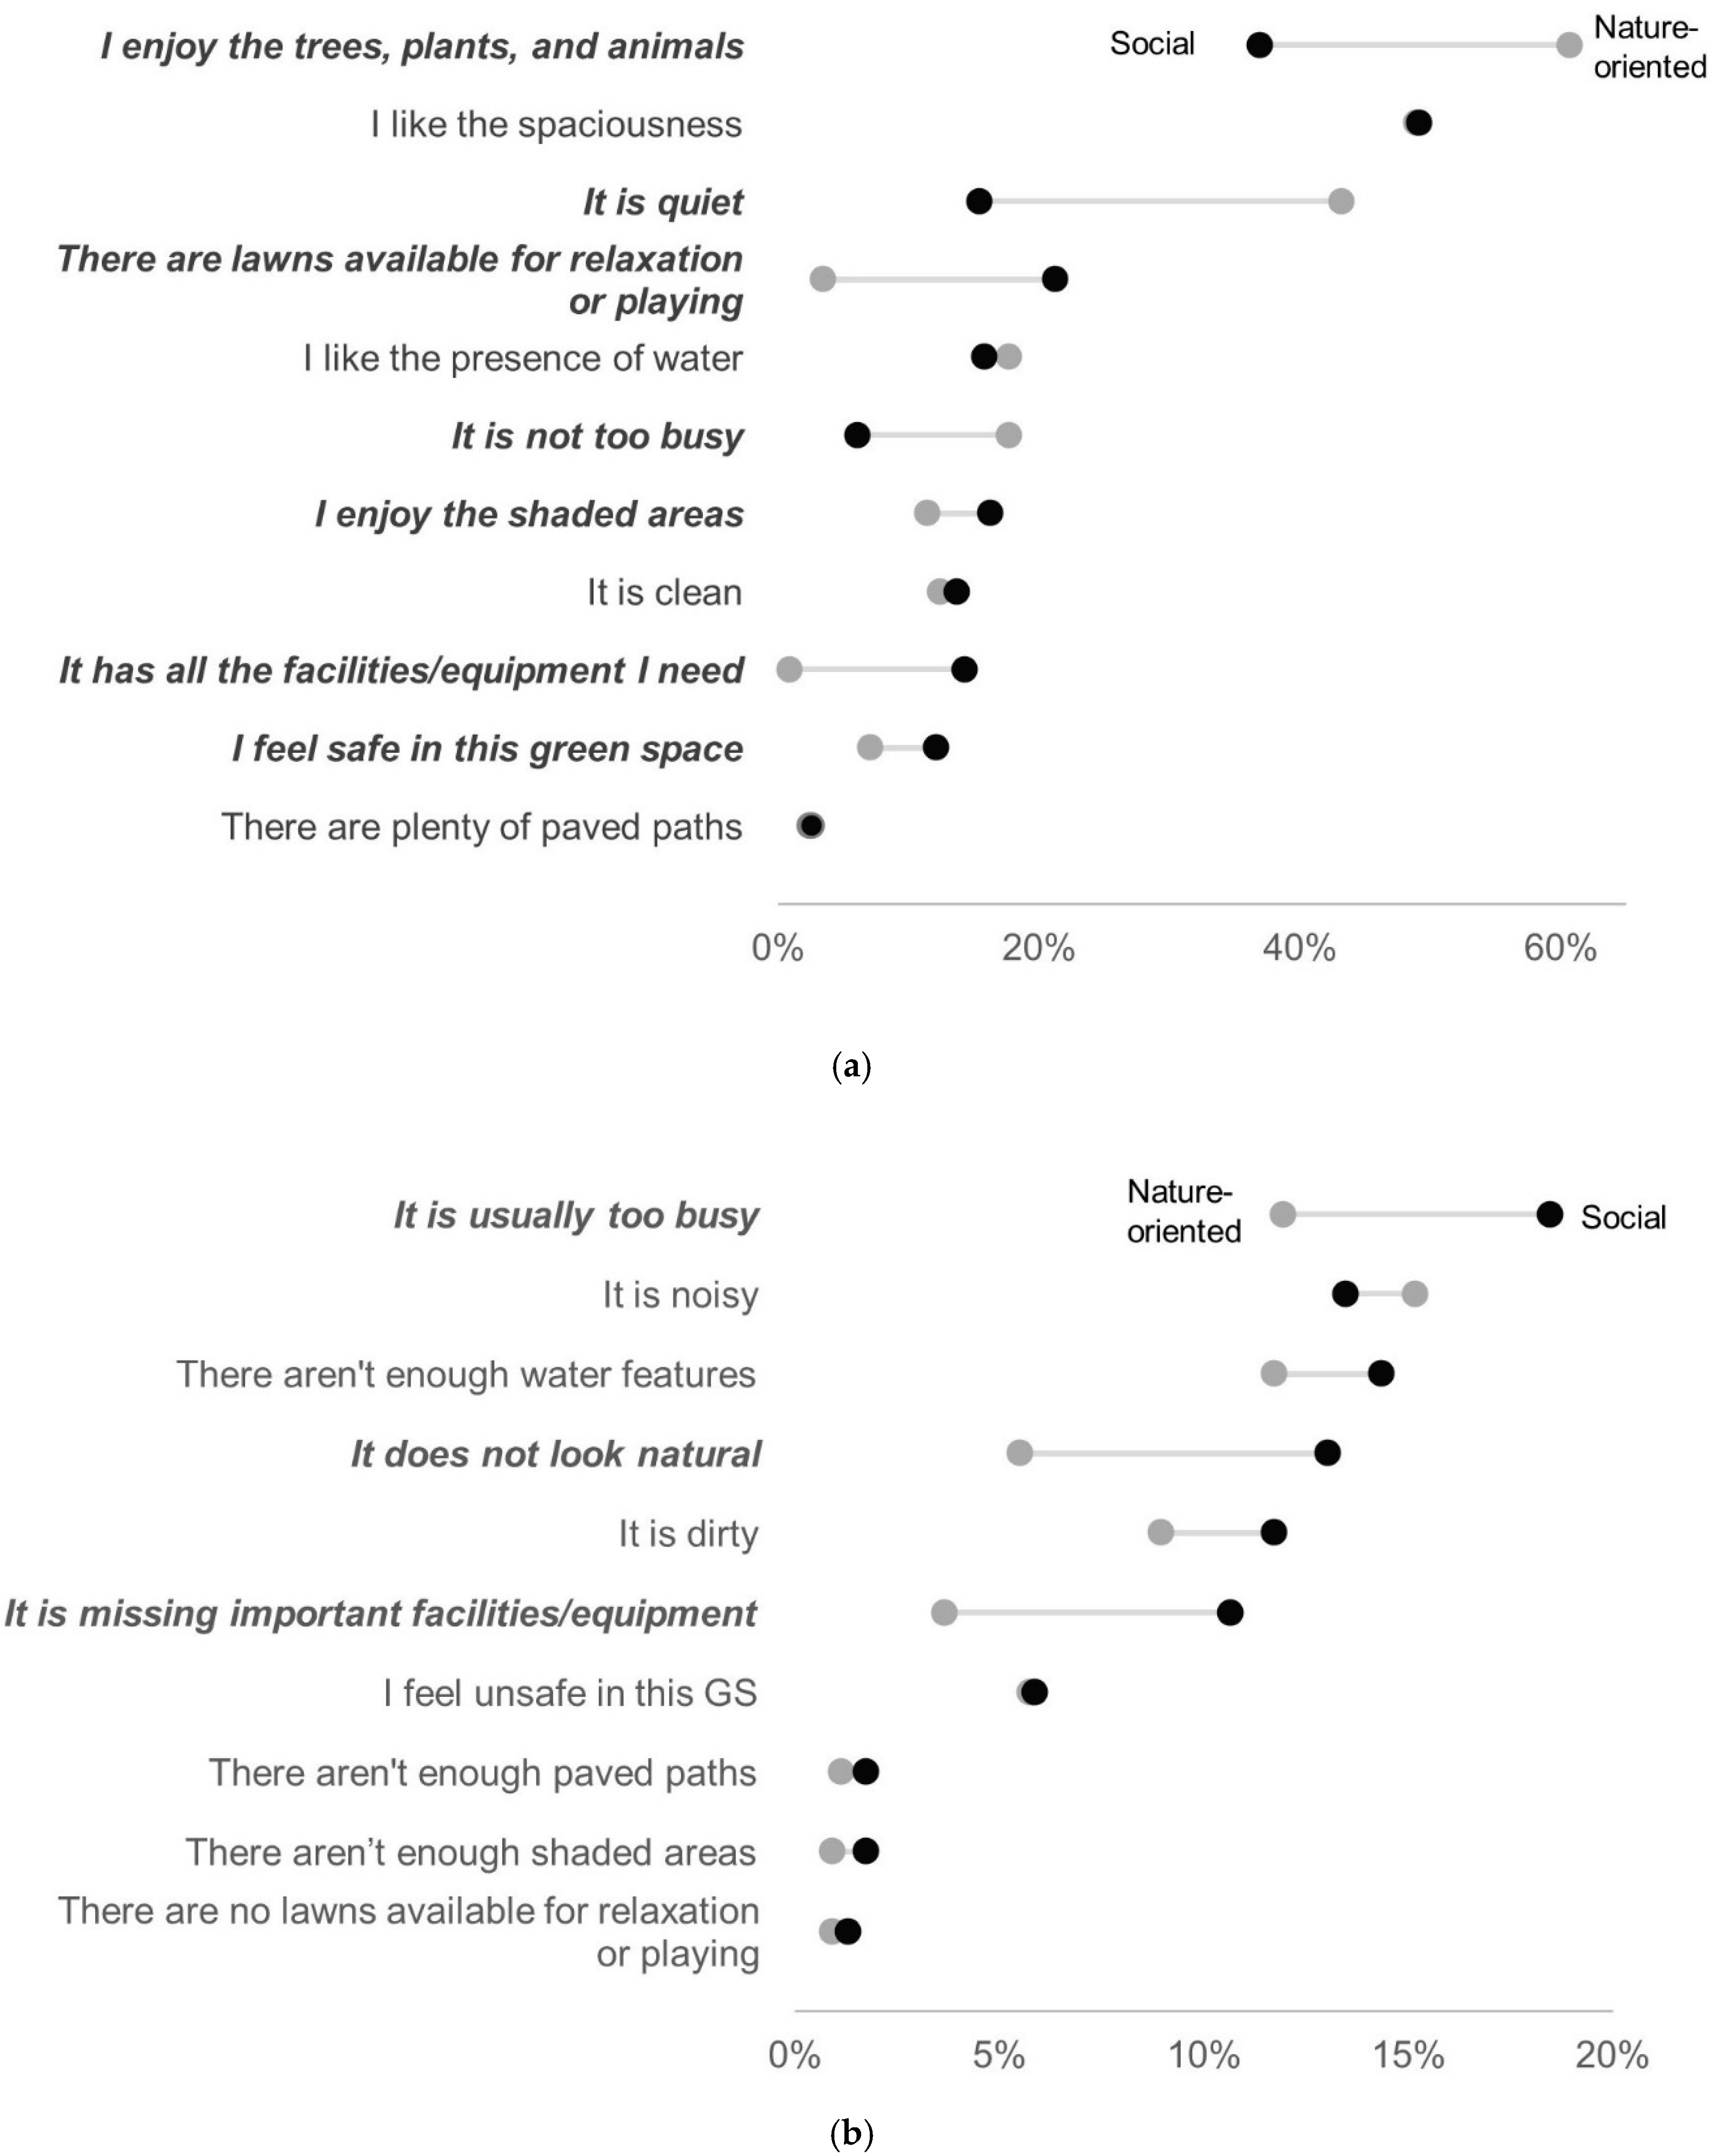
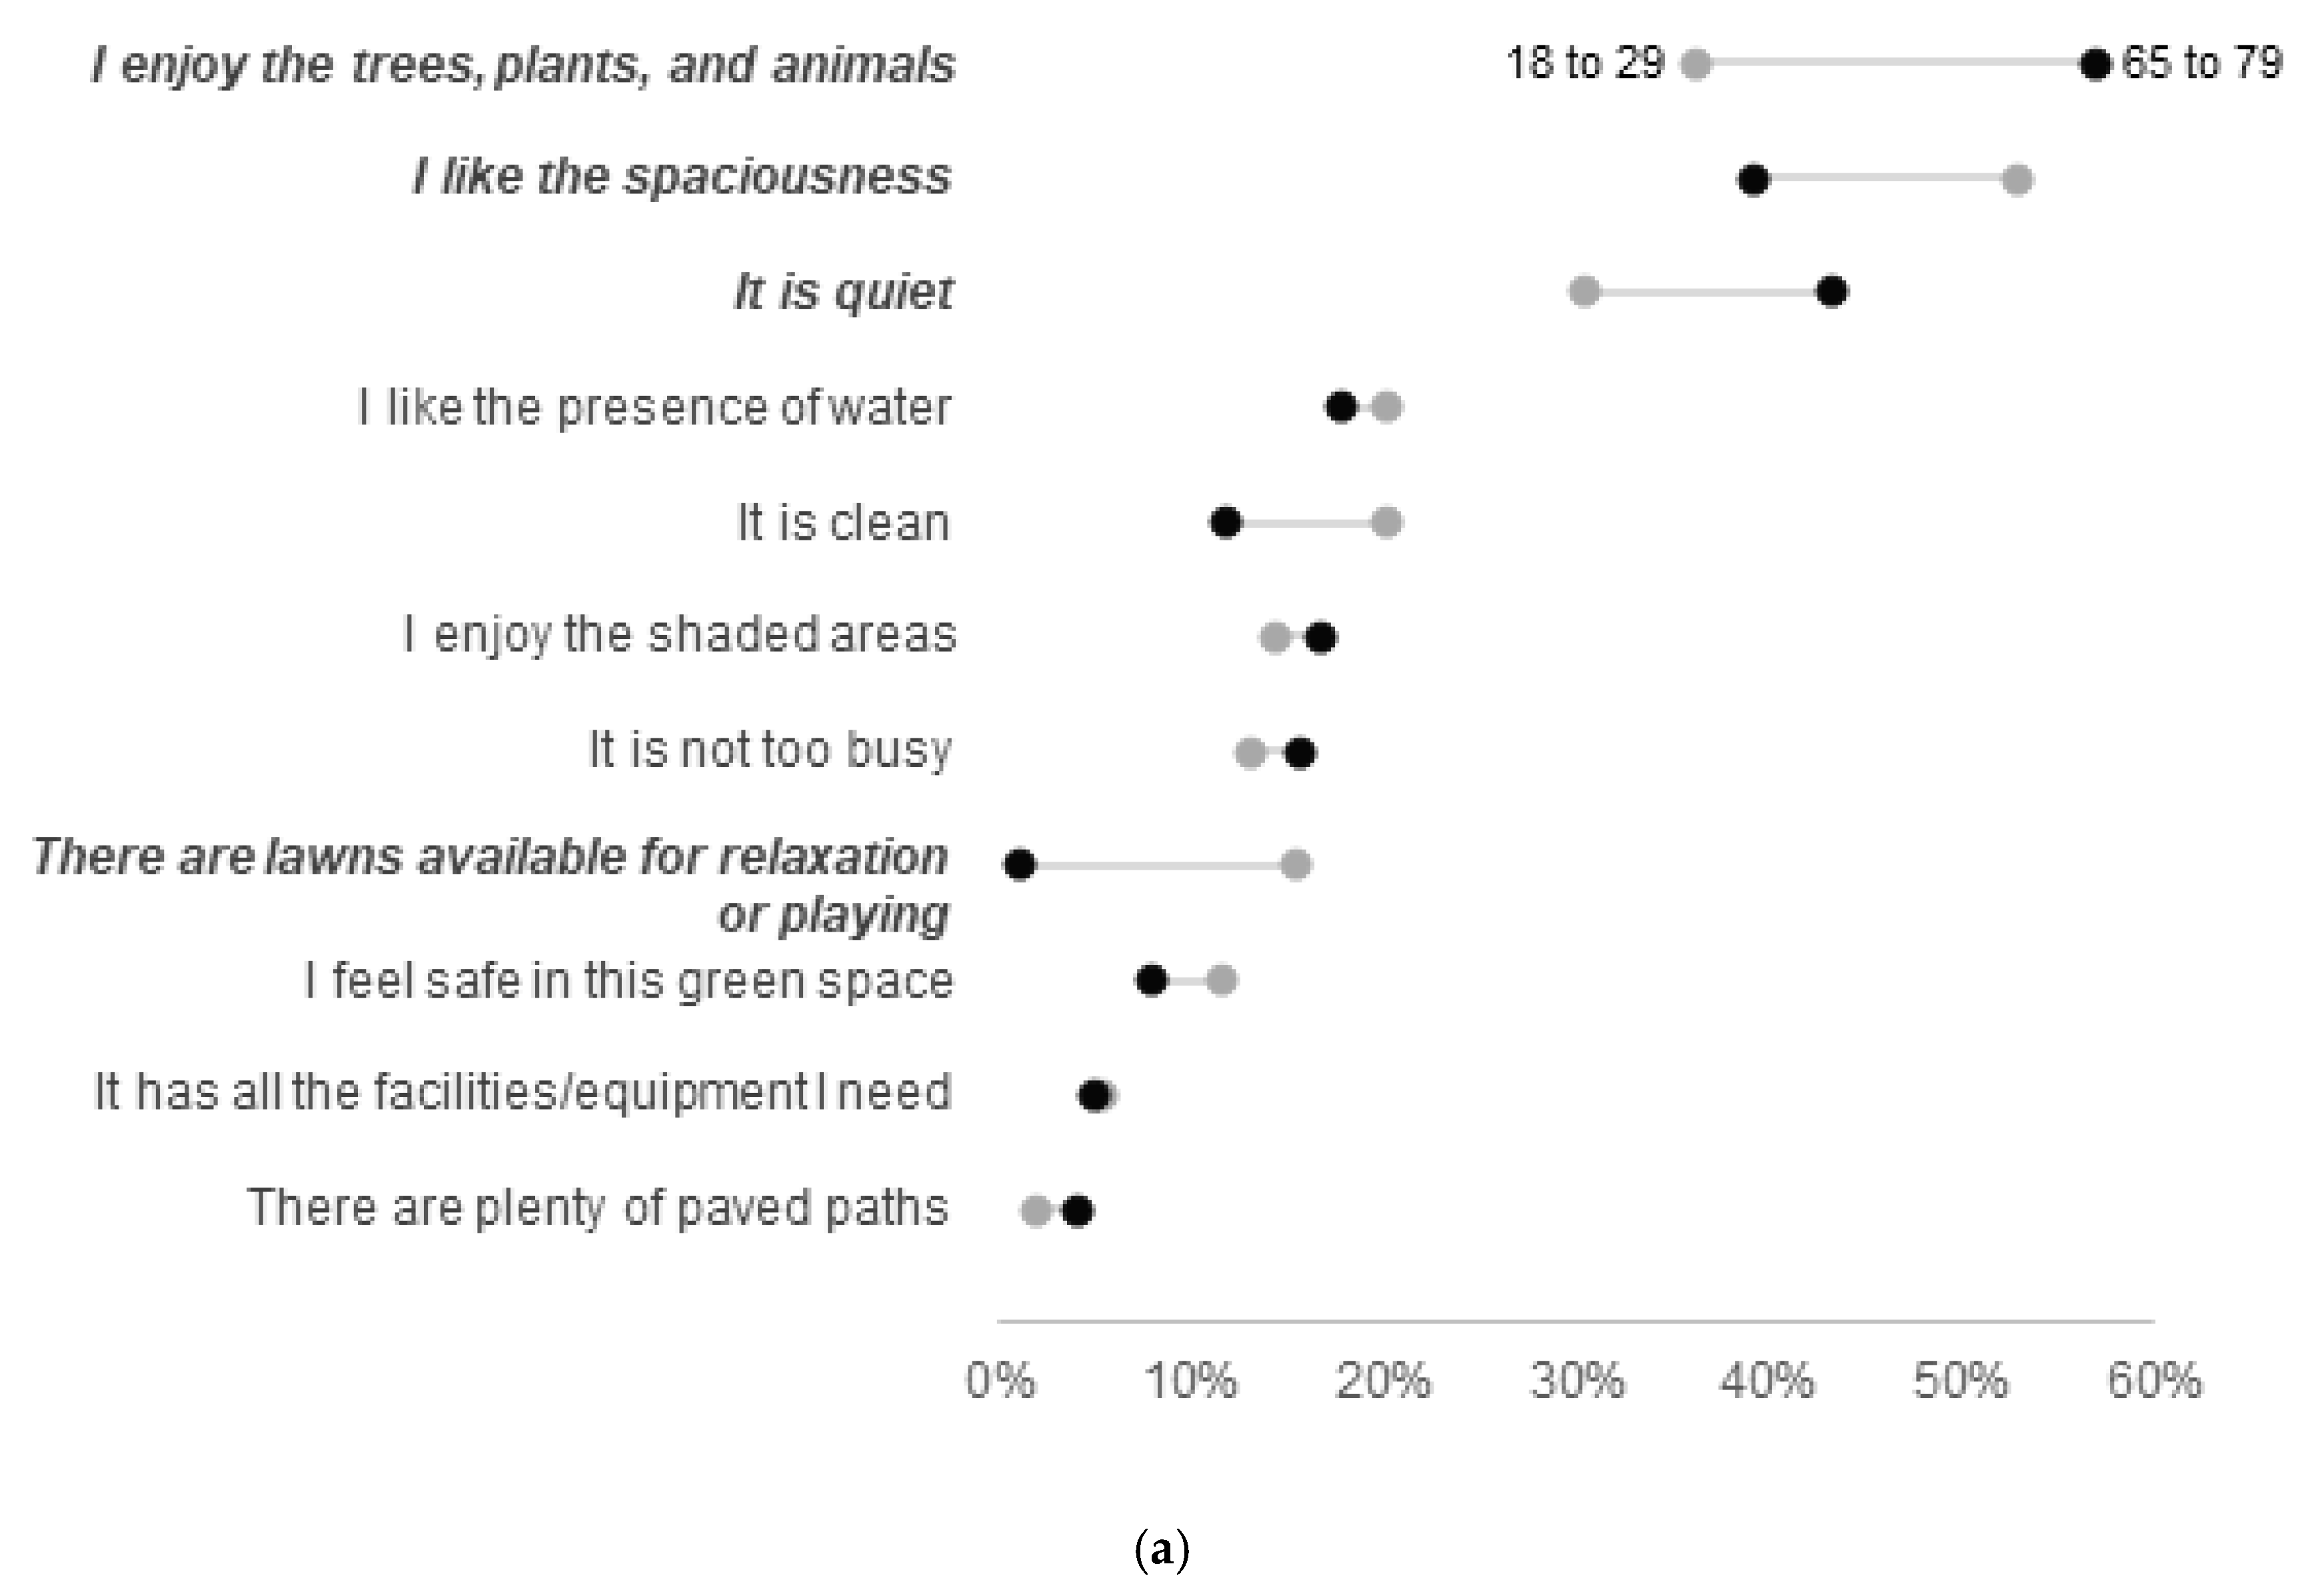
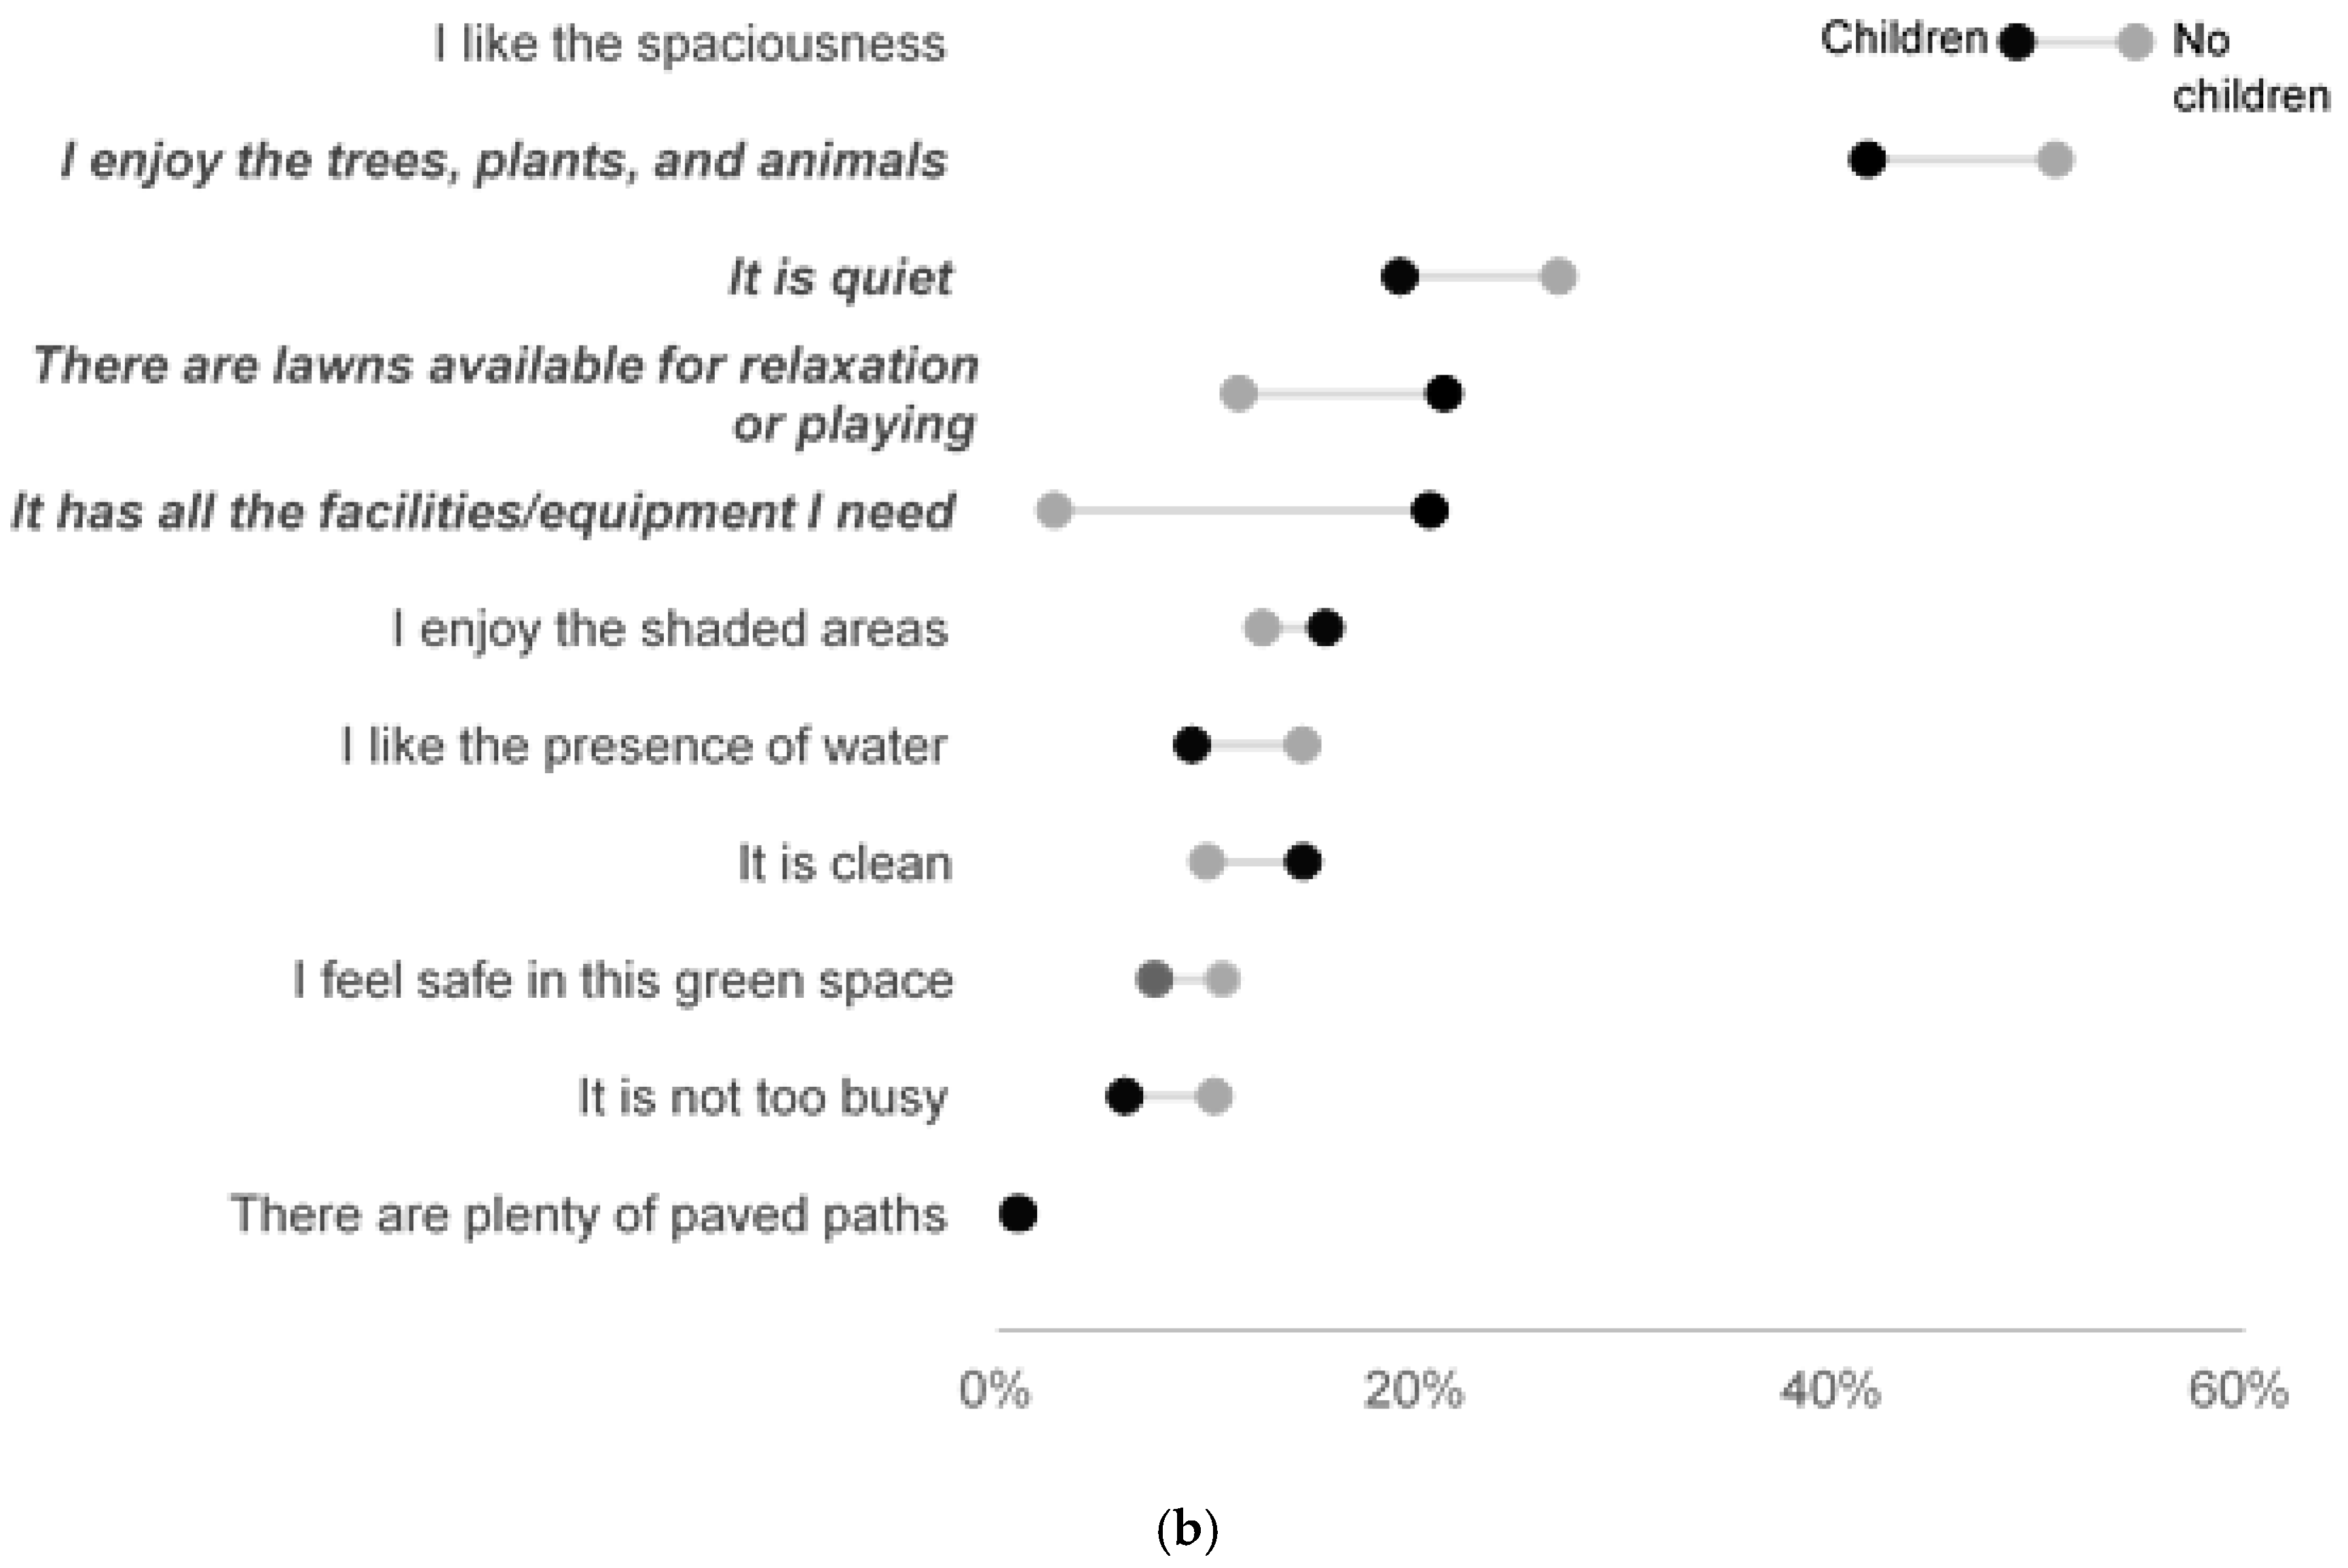
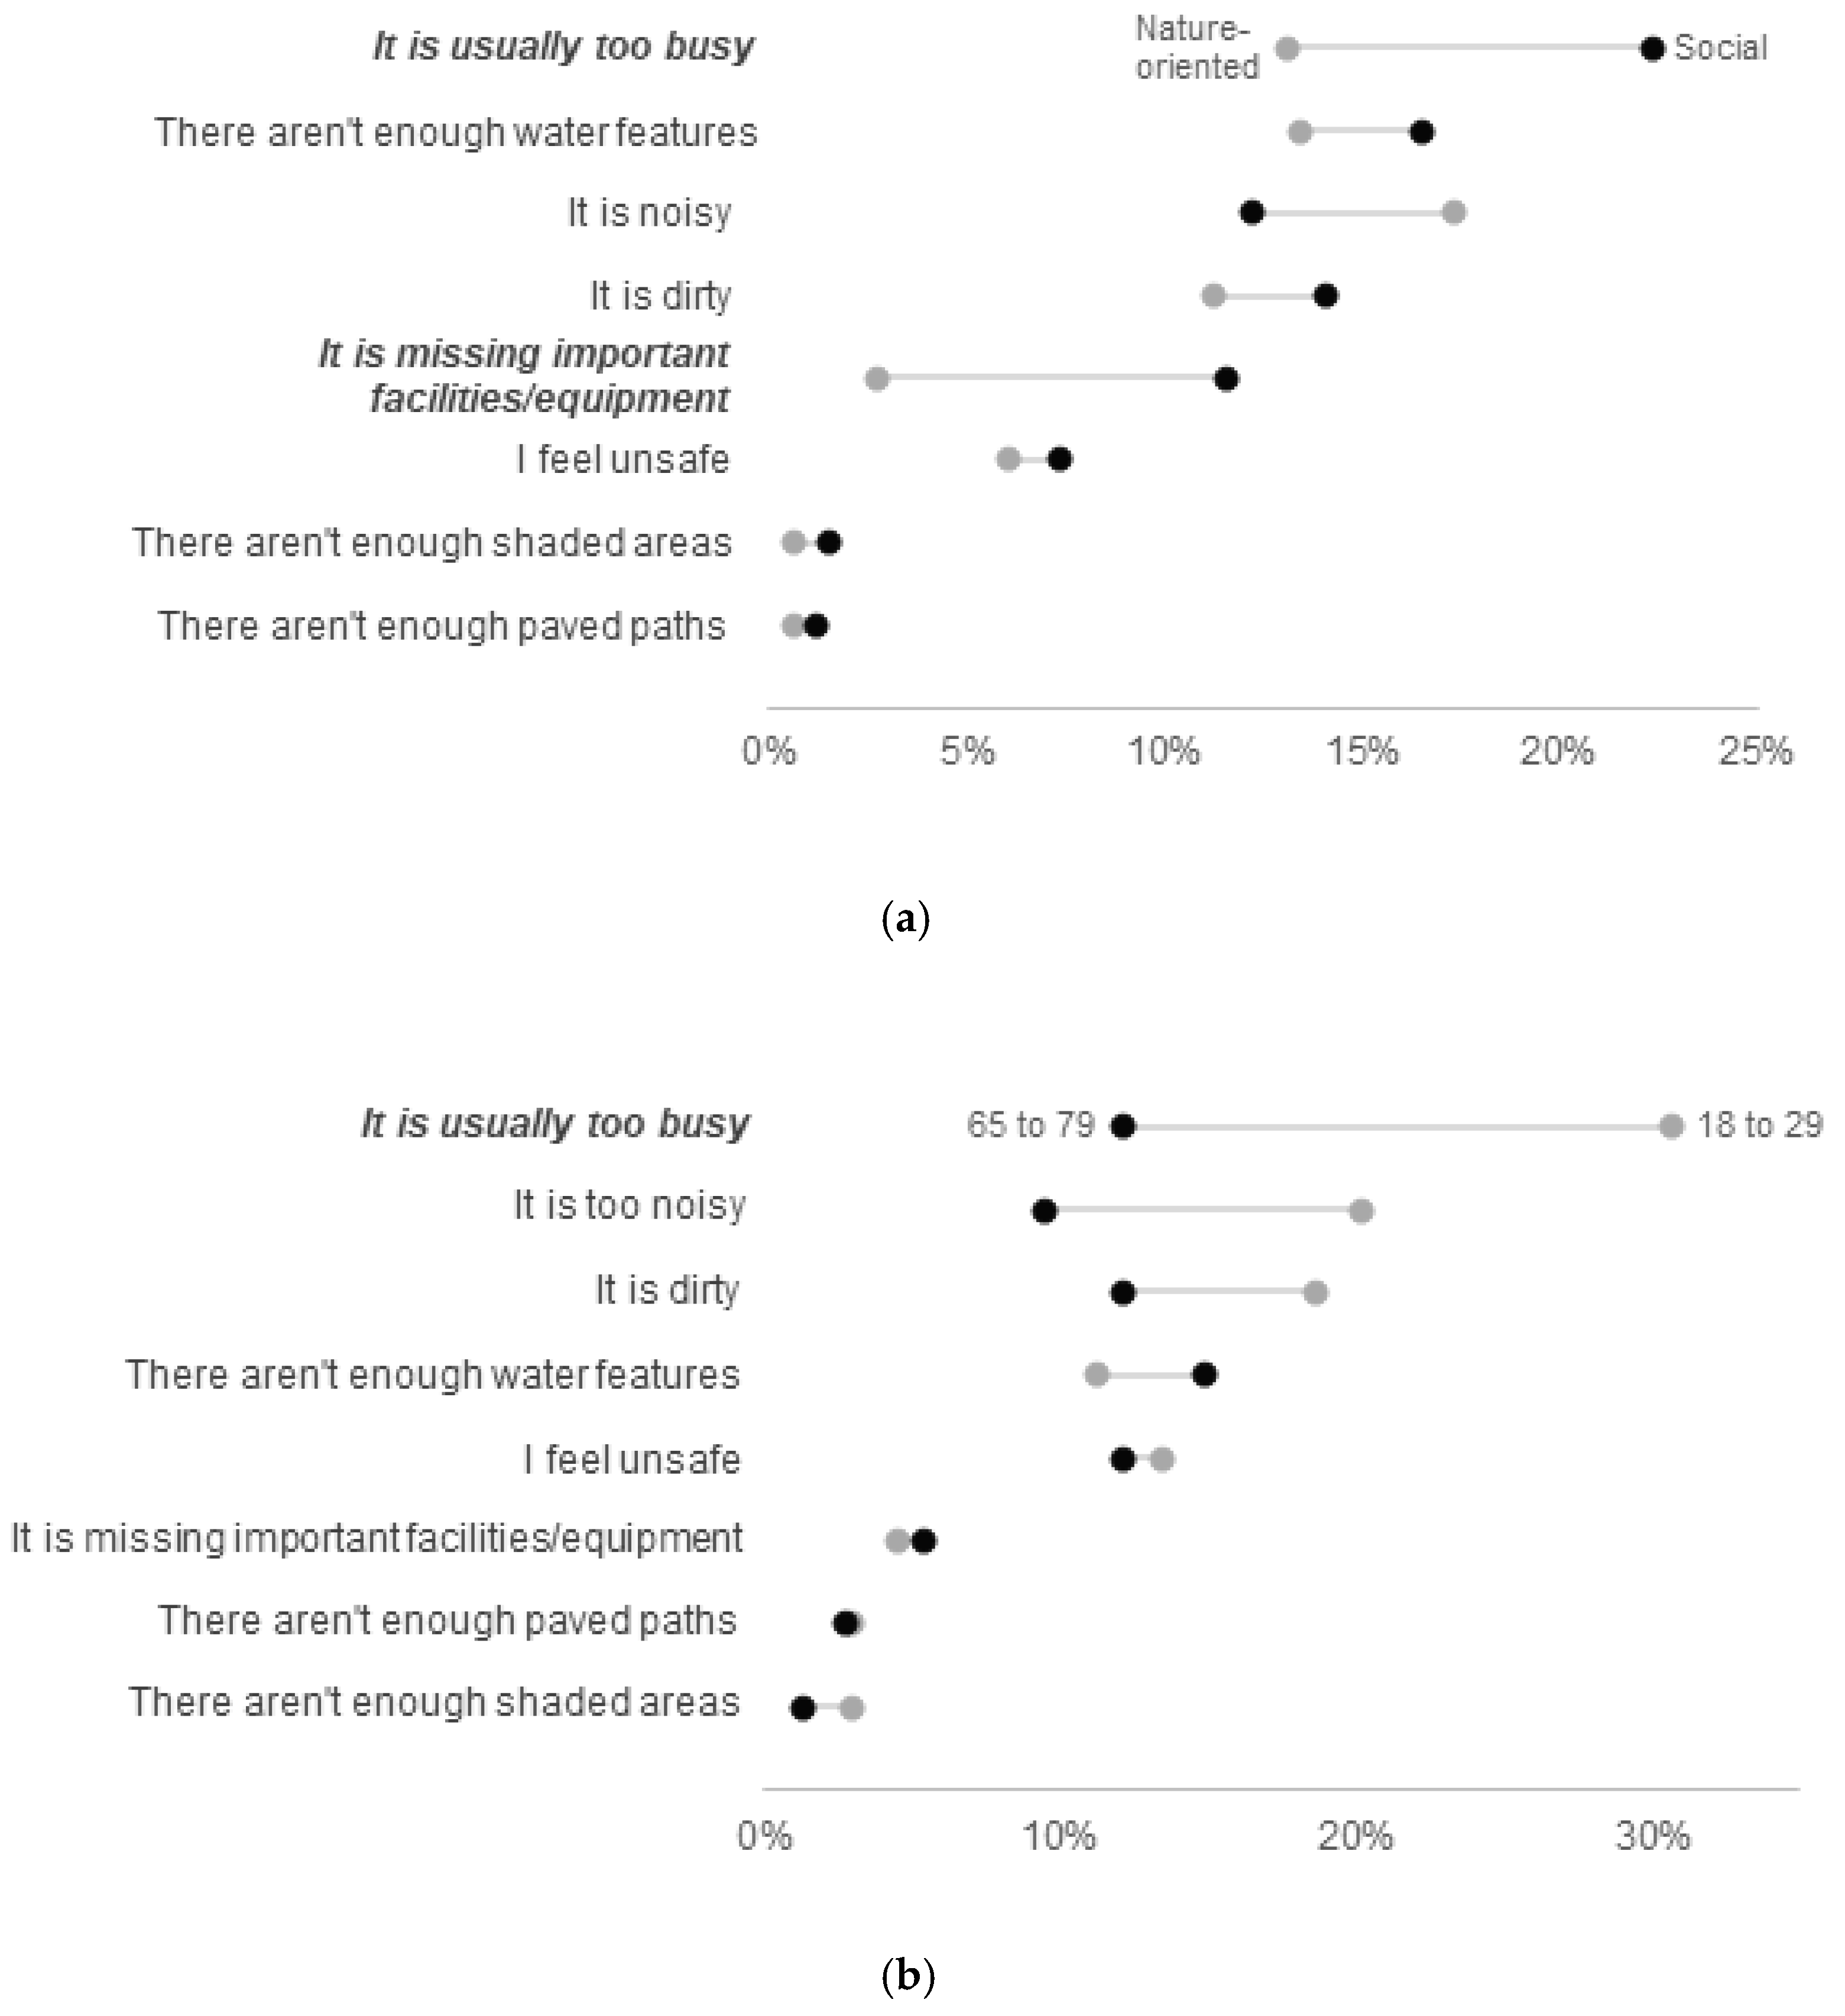
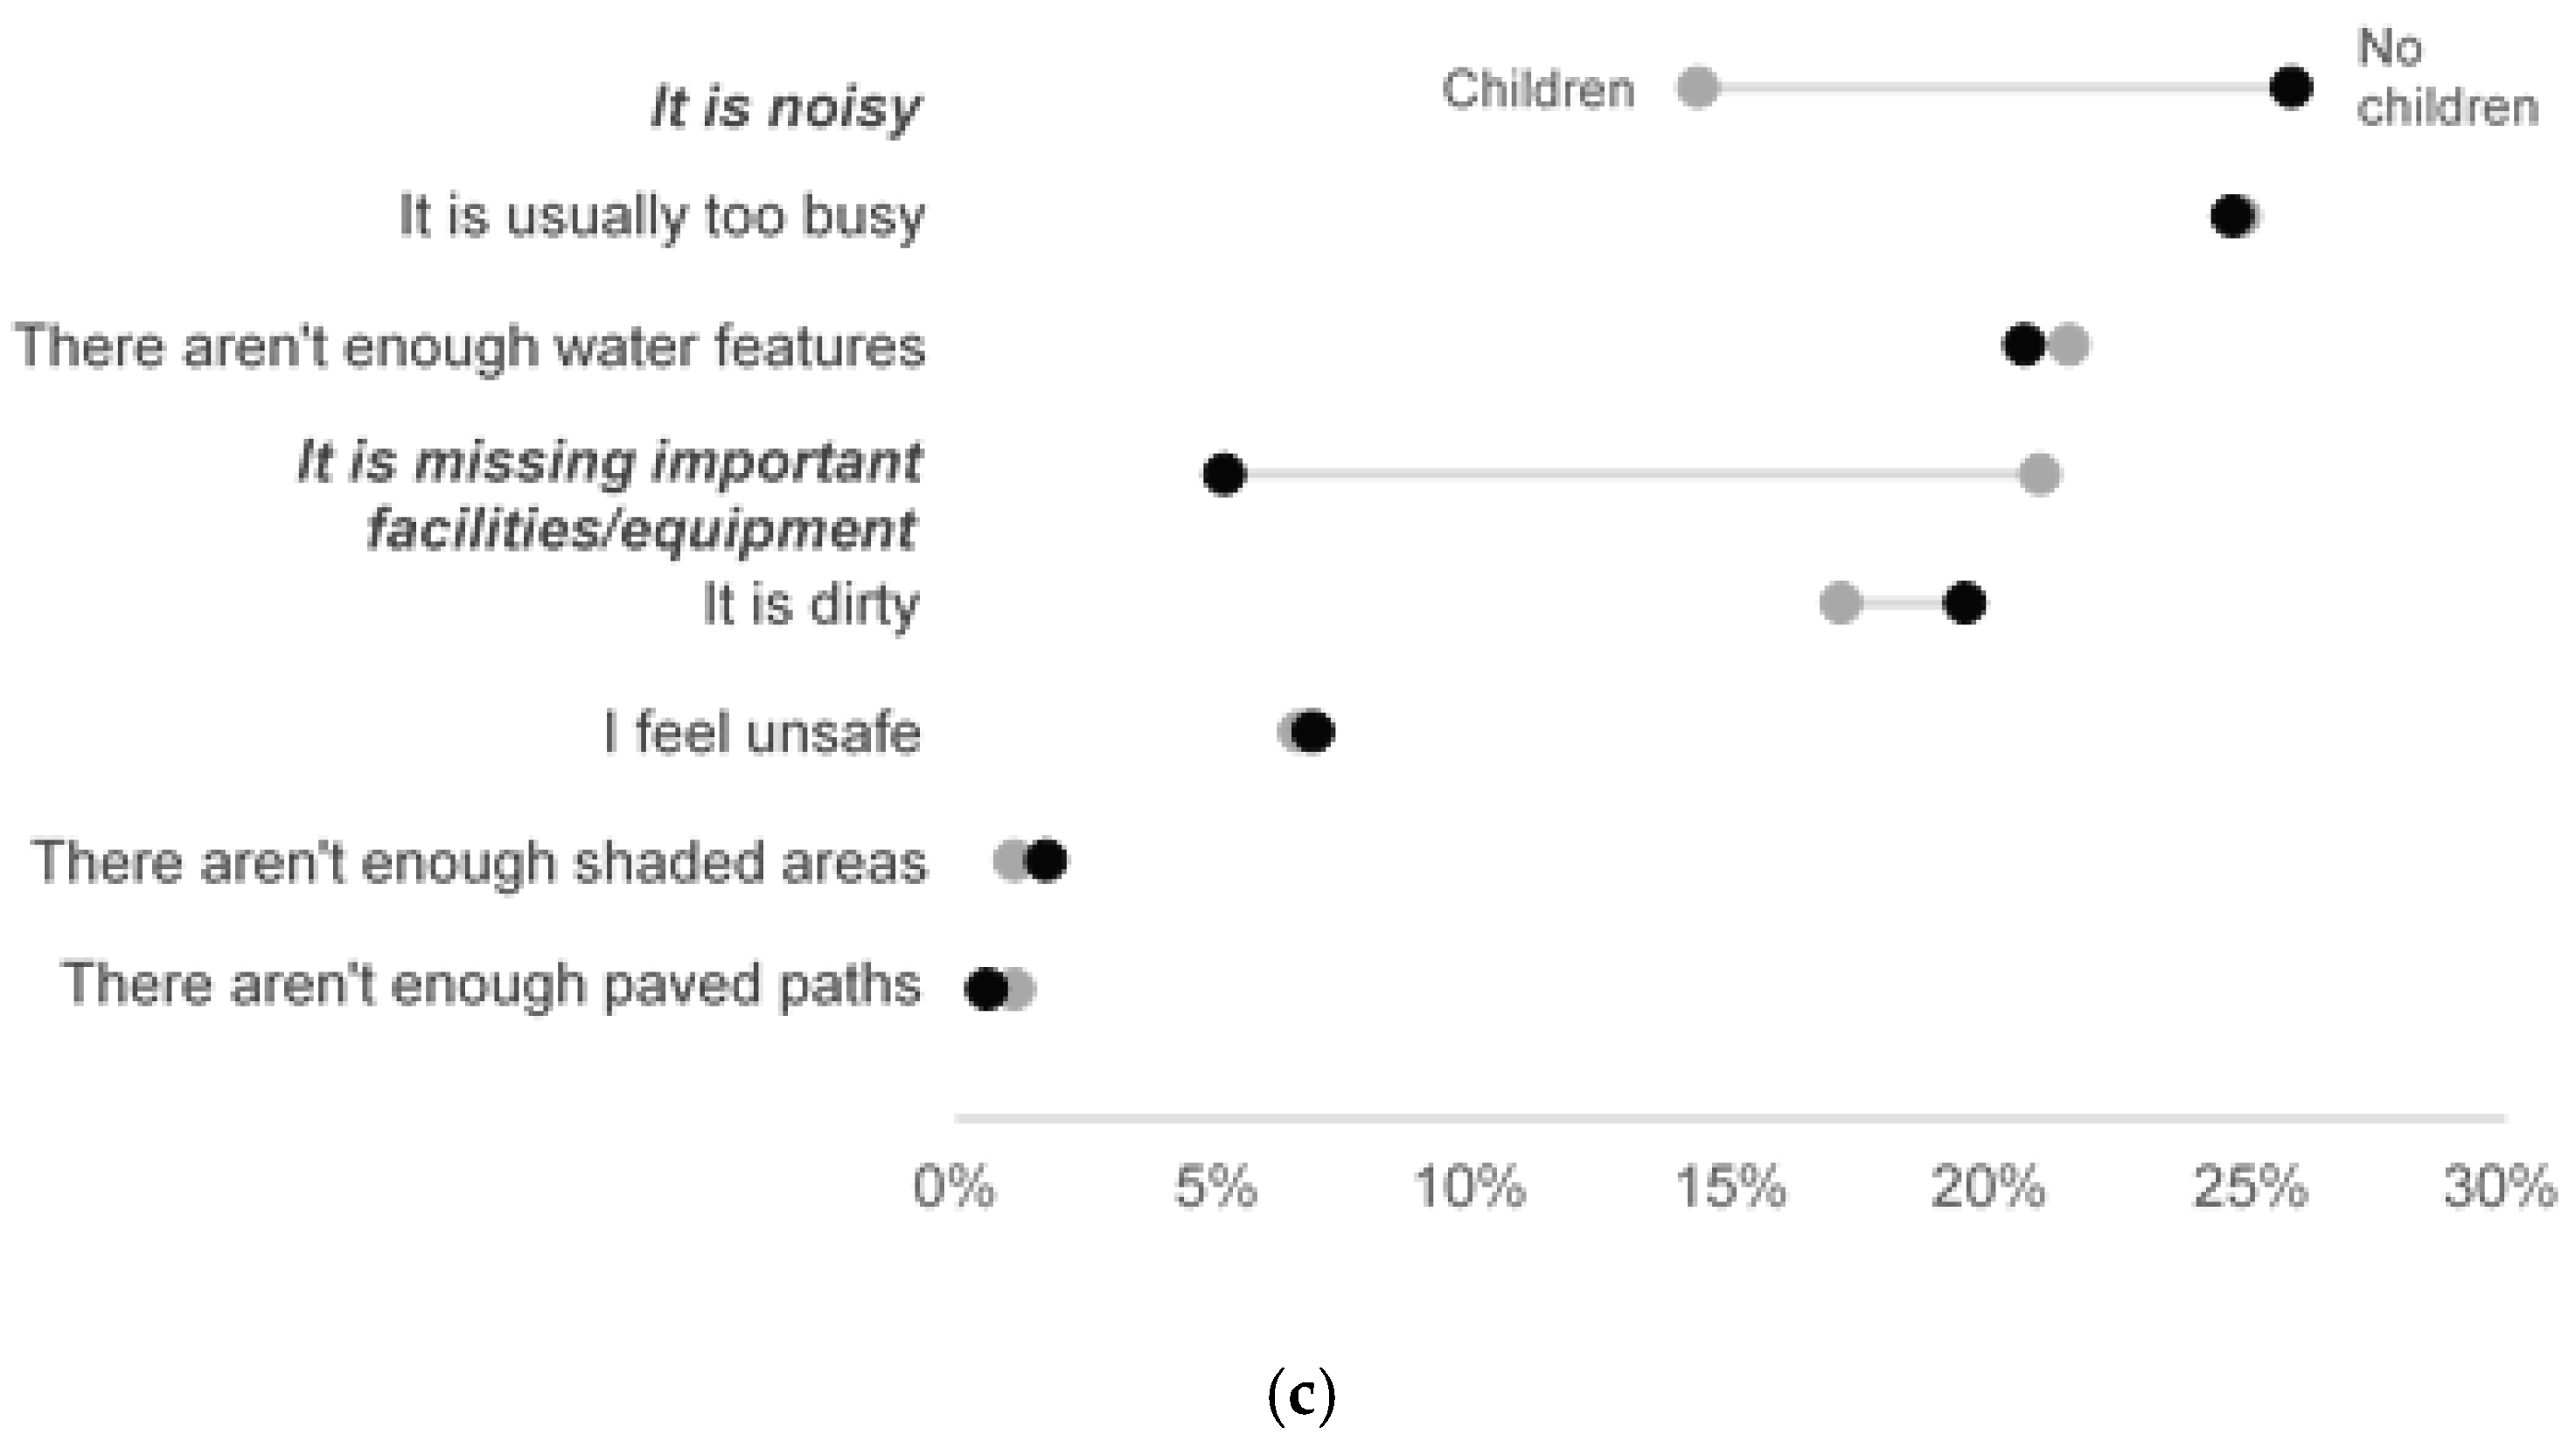
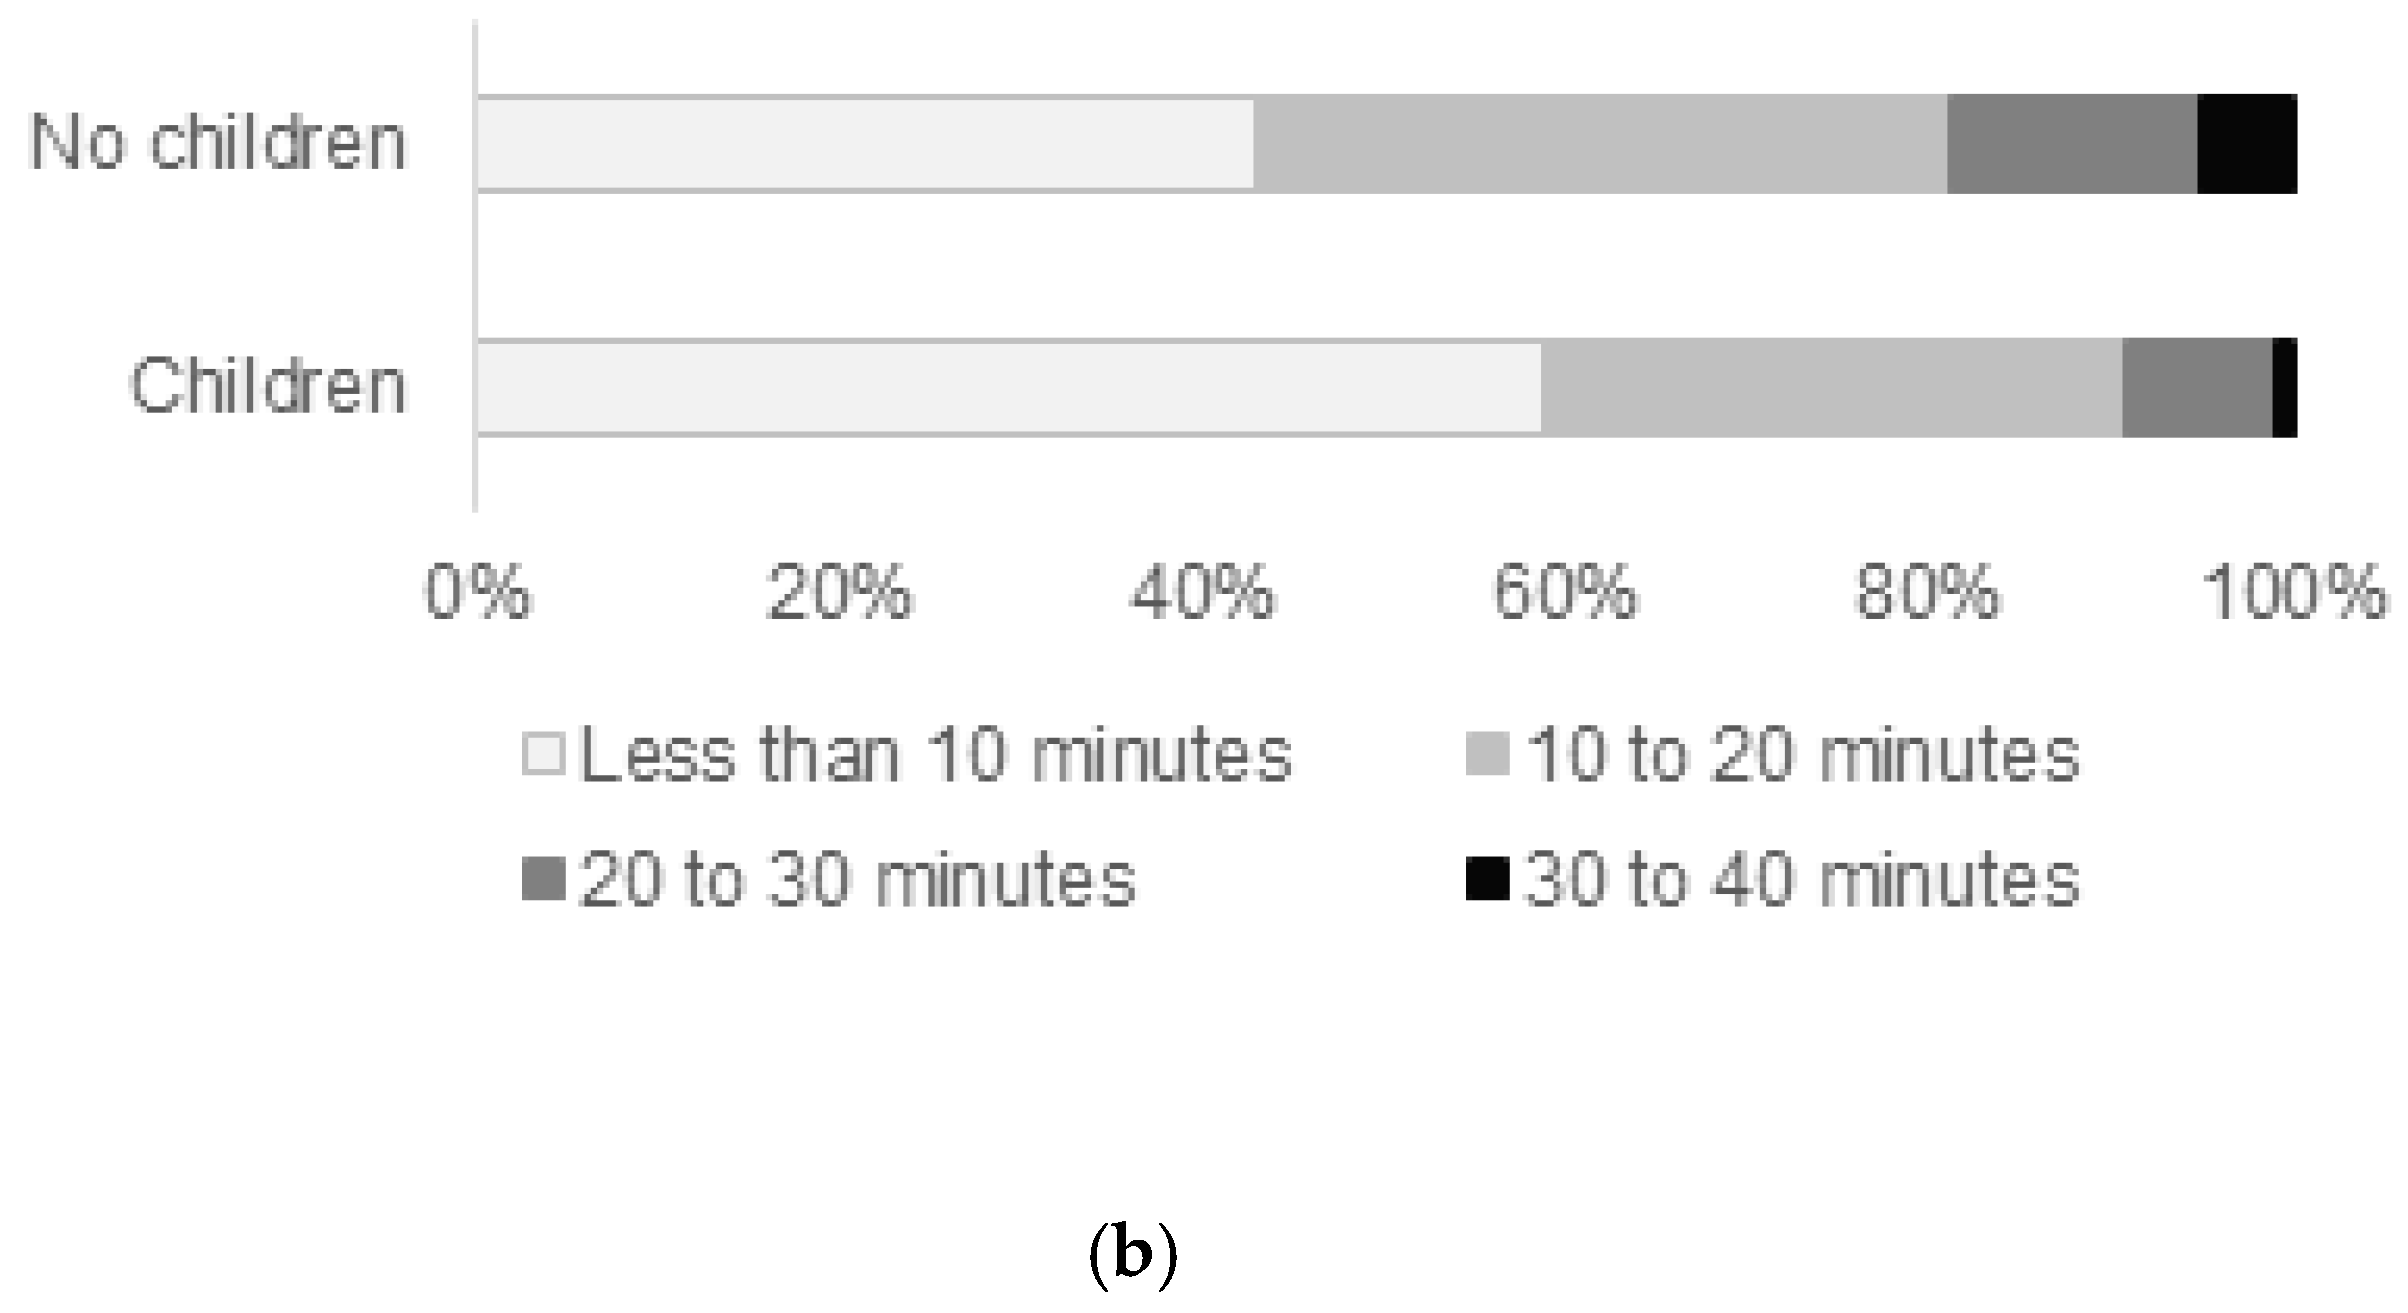
Our study has demonstrated the importance of investigation into variations in the valuation of UGS characteristics. We find two clear bundles of users (nature-oriented and social) and differences in valuation between them. We also find that socio-demographic factors such as age, household composition, and use patterns do play a role in the valuation of UGS characteristics. Certain socio-demographic groups are inclined toward either nature-oriented or social use patterns. Older users tend to use UGS for nature-oriented purposes, while younger users and users with young children living in the household more often use UGS for social purposes. The latter appreciate the functional aspects of UGS, such as the provision of facilities. The presence of a child in the household corresponds with a perception of noise or lack of facilities as a negative characteristic of their UGS. This suggests that one’s living situation can impact liked and disliked UGS characteristics.
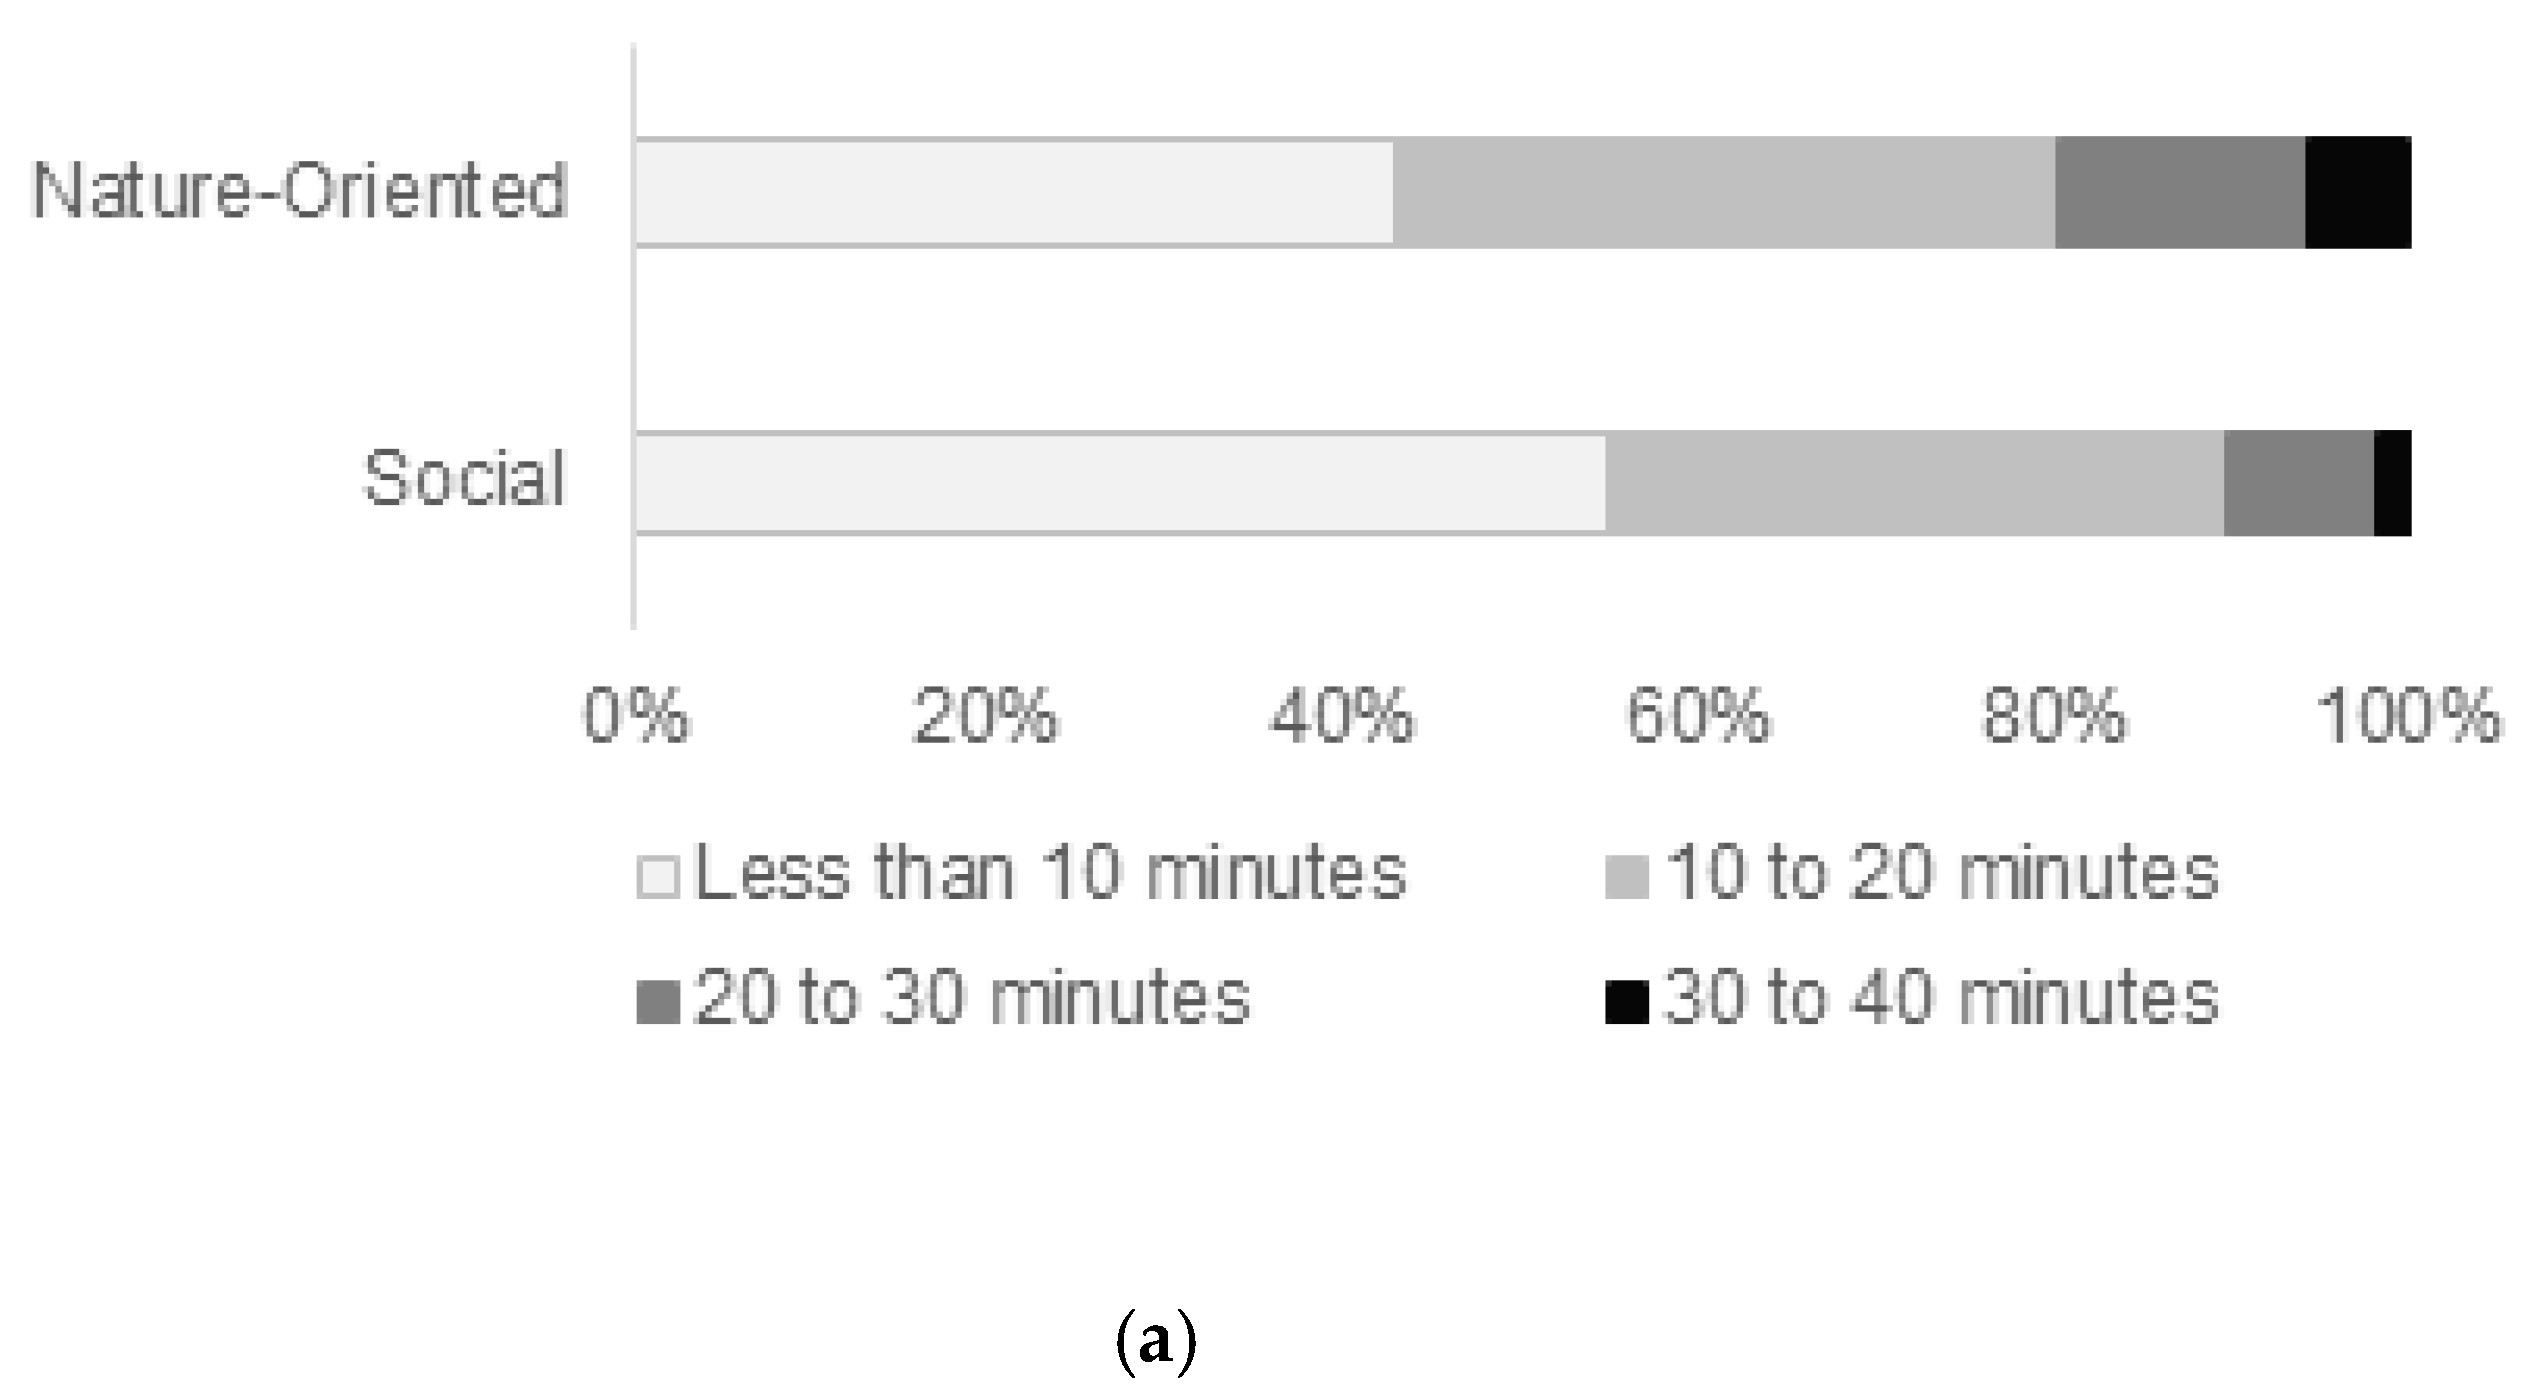
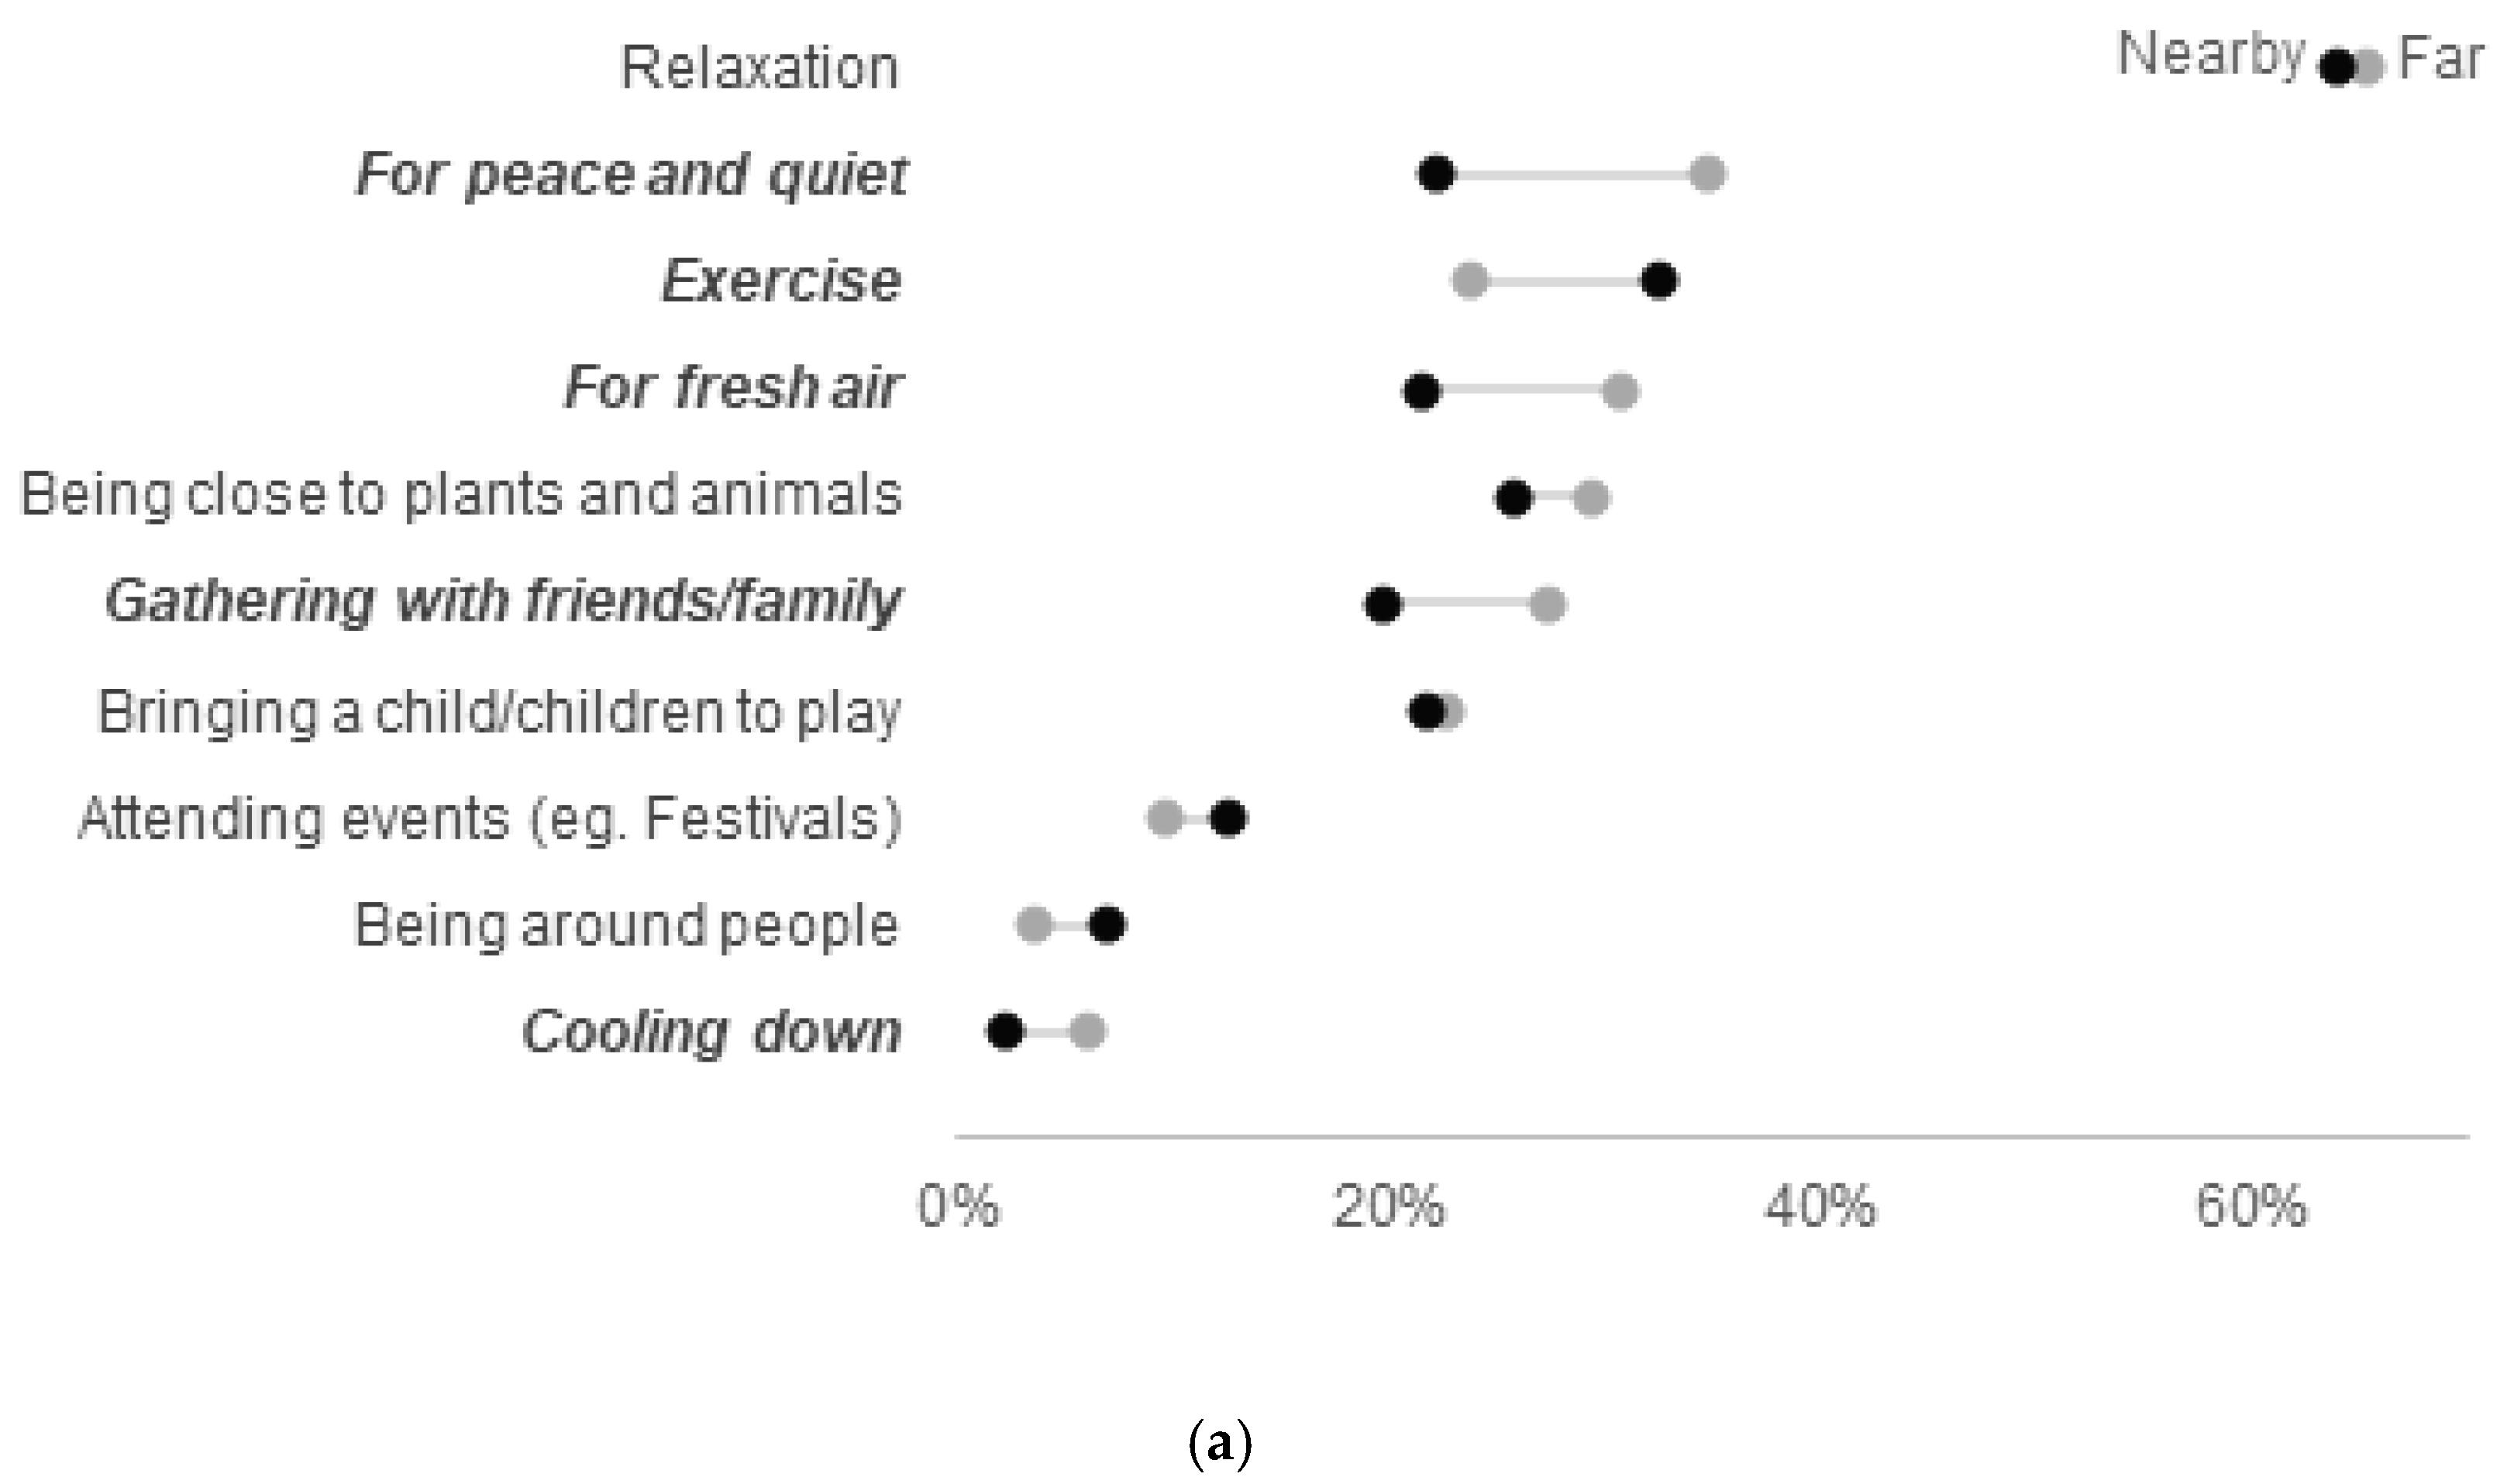
Of the two user groups, social users more often experience mismatch. Social users more often experience their UGS as being too busy, noisy, and lacking important facilities/equipment. We find that nature-oriented users travel farther to reach their most visited UGS. Additionally, nature-oriented users more often indicate that their UGS is too far away. We, therefore, hypothesize that nature-oriented users deliberately visit UGS that are further away, although there is a closer UGS. This may explain why nature-oriented users are more often satisfied with the UGS they use. It might also explain why they are less positive about UGS accessibility. To remedy this, more nature must be incorporated in city centres as, for example, pocket parks, less manicured enclaves within UGS, or zones with defined activities. Respondents with children tend to visit the nearest UGS. This indicates that the presence of a young child in the household may limit mobility to UGS and ultimately have an impact on satisfaction.
One of the limitations of our research is that survey respondents were overwhelmingly well-educated, with an overrepresentation of females. Several studies have found that women respond to surveys in greater proportion than men [50,51,52]. People are also more likely to participate in a survey if they are interested in the topic [53]. The overrepresentation of female respondents in our survey could indicate that women more often found the survey’s subject matter interesting. The overrepresentation of well-educated respondents could be due to the use of a map-based online survey. These surveys have been found to discourage participation by people who do not have computers and/or are not computer literate [54]. In the following stages of research, it will be important to guide excluded populations through the survey in person. Future research will also explore how patterns of use, valuation, and mismatch vary based on the location of survey respondents, the social structure of the neighbourhoods in which they live, and the UGS they use.
Our research has demonstrated that socio-demographic factors and use patterns do relate to the valuation of UGS. Additionally, we find that certain users experience mismatch to a greater degree than others. We suggest that use-related preferences in the demand for UGS and identification of the gaps between supply and demand of UGS characteristics are integrated into planning UGS. This is important for designing UGS that meet the unique demands of communities.

Author Contributions

Conceptualization, A.P., A.Z.K., F.C.; Methodology, A.P., A.Z.K., F.C.; Software, A.P.; Validation, A.P.; Formal Analysis, A.P.; Investigation, A.P.; Data Curation, A.P.; Writing—Original Draft Preparation, A.P., F.C.; Writing—Review and Editing, A.P., A.Z.K., F.C.; Visualization, A.P.; Supervision, A.Z.K., F.C.; Project Administration, A.Z.K., F.C.; Funding Acquisition, A.Z.K., F.C. All authors have read and agreed to the published version of the manuscript.

Funding

This research was funded by the Brussels Capital Region—Innoviris, research contracts 2018-ANTICIPATE-50, 2020-PRB-150.

Institutional Review Board Statement

Not applicable.

Informed Consent Statement

Informed consent was obtained from all subjects involved in the study.

Data Availability Statement

The data presented in this study is not publicly available. Data can be obtained from the corresponding author on reasonable request.

Acknowledgments

The authors would like to thank Florian Barette for his help translating the survey.

Conflicts of Interest

The authors declare no conflict of interest. The sponsors had no role in the design, execution, interpretation, or writing of the study.

Appendix A

Table A1. Chi-squared tests for independence between UGS characteristics liked by nature-oriented and social use groups. Statistically significant differences in response (p < 0.05) are indicated in bold.
Liked UGS CharacteristicsSig.
I like the spaciousness of this green space0.832
This green space is quiet0.000
This green space is clean0.687
This green space is not too busy0.000
I feel safe in this green space0.015
This green space has all the facilities I need0.000
I enjoy the shaded areas in this green space0.045
I like the presence of water in this green space0.149
I enjoy the trees, plants, and animals in this green space0.000
This green space has lawns available for relaxation or playing 0.000
There are plenty of paved paths in this green space0.944
Table A2. Chi-squared tests for independence between UGS characteristics disliked by nature-oriented and social use groups. Statistically significant differences in response (p < 0.05) are indicated in bold.
Disliked UGS CharacteristicsSig.
This green space is noisy0.394
This green space is dirty0.526
This green space is usually too busy0.015
I feel unsafe in this green space0.935
This green space is missing important facilities0.001
There aren’t enough water features in this green space0.489
There aren’t enough shaded areas0.619
This green space does not look natural0.001
This green space does not have lawns available for relaxation/playing0.895
There aren’t enough paved paths in this green space0.448
Table A3. Chi-squared tests for independence between UGS characteristics appreciated by 18 to 29-year-olds and 65 to 79-year-olds. Statistically significant differences in response (p < 0.05) are indicated in bold. There were not enough samples to test the significance of paved paths.
Liked UGS CharacteristicsSig.
I like the spaciousness of this green space0.018
This green space is quiet0.021
This green space is clean0.062
This green space is not too busy0.403
I feel safe in this green space0.303
This green space has all the facilities I need0.845
I enjoy the shaded areas in this green space0.887
I like the presence of water in this green space0.568
I enjoy the trees, plants, and animals in this green space0.001
This green space has lawns available for relaxation or playing 0.000
There are plenty of paved paths in this green space-
Table A4. Chi-squared tests for independence between UGS characteristics appreciated by 30 to 44-year-olds with and without a child living in the household. Statistically significant differences in response (p < 0.05) are indicated in bold. There were not enough samples to test the significance of paved paths.
Liked UGS CharacteristicsSig.
I like the spaciousness of this green space0.121
This green space is quiet0.030
This green space is clean0.112
This green space is not too busy0.090
I feel safe in this green space0.133
This green space has all the facilities I need0.000
I enjoy the shaded areas in this green space0.501
I like the presence of water in this green space0.093
I enjoy the trees, plants, and animals in this green space0.013
This green space has lawns available for relaxation or playing 0.003
There are plenty of paved paths in this green space-

Appendix B

Table A5. Chi-squared tests for independence between UGS characteristic mismatches identified by nature-oriented and social users. Statistically significant differences in response (p < 0.05) are indicated in bold. There were not enough samples to test the significance of shaded areas and paved paths.
Disliked UGS CharacteristicsSig.
This green space is noisy0.064
This green space is dirty0.226
This green space is usually too busy0.002
I feel unsafe in this green space0.539
This green space is missing important facilities0.000
There aren’t enough water features in this green space0.251
There aren’t enough shaded areas-
There aren’t enough paved paths in this green space-
Table A6. Chi-squared tests for independence between UGS characteristic mismatches identified by 18 to 29-year-olds and 65 to 79-year-olds. Statistically significant differences in response (p < 0.05) are indicated in bold. There were not enough samples to test the significance of missing facilities, shaded areas and paved paths.
Disliked UGS CharacteristicsSig.
This green space is noisy0.198
This green space is dirty0.616
This green space is usually too busy0.036
I feel unsafe in this green space0.645
This green space is missing important facilities-
There aren’t enough water features in this green space0.143
There aren’t enough shaded areas-
There aren’t enough paved paths in this green space-
Table A7. Chi-squared tests for independence between UGS characteristic mismatches identified by 30 to 44-year-olds with and without children. Statistically significant differences in response (p < 0.05) are indicated in bold. There were not enough samples to test the significance of shaded areas and paved paths.
Disliked UGS CharacteristicsSig.
This green space is noisy0.002
This green space is dirty0.372
This green space is usually too busy0.599
I feel unsafe in this green space0.736
This green space is missing important facilities0.000
There aren’t enough water features in this green space0.808
There aren’t enough shaded areas-
There aren’t enough paved paths in this green space-
Table A8. Chi-squared tests for independence between uses undertaken by respondents who indicate that their UGS is either nearby or too far. Statistically significant differences in response (p < 0.05) are indicated in bold.
Motivation for Using UGSSig.
Exercise0.005
Relaxation0.268
Gathering with friends/ family0.035
Attending events0.441
For peace and quiet 0.000
Being around people0.091
Bringing a child to play0.937
Being close to plants and animals0.610
For fresh air0.014
Cooling down0.004
Table A9. Chi-squared tests for independence between the UGS characteristics appreciated by respondents who indicate that their UGS is either nearby or too far. Statistically significant differences (p < 0.05) are indicated in bold. There were not enough samples to test the significance of paved paths.
Liked UGS CharacteristicsSig.
I like the spaciousness of this green space0.000
This green space is quiet0.000
This green space is clean0.123
This green space is not too busy0.022
I feel safe in this green space0.788
This green space has all the facilities I need0.776
I enjoy the shaded areas in this green space0.207
I like the presence of water in this green space0.023
I enjoy the trees, plants, and animals in this green space0.005
This green space has lawns available for relaxation or playing 0.322
There are plenty of paved paths in this green space-

References

  1. Millennium Ecosystem Assessment. In Millennium Ecosystem Assessment Report; Island Press: Washington, DC, USA, 2005; ISBN 1597260401.
  2. Chan, K.M.A.; Balvanera, P.; Benessaiah, K.; Chapman, M.; Díaz, S.; Gómez-Baggethun, E.; Gould, R.; Hannahs, N.; Jax, K.; Klain, S.; et al. Why protect nature? Rethinking values and the environment. Proc. Natl. Acad. Sci. USA 2016, 113, 1462–1465. [Google Scholar] [CrossRef] [PubMed] [Green Version]
  3. Klain, S.C.; Olmsted, P.; Chan, K.M.A.; Satterfield, T. Relational values resonate broadly and differently than intrinsic or instrumental values, or the New Ecological Paradigm. PLoS ONE 2017, 12, e0183962. [Google Scholar] [CrossRef] [Green Version]
  4. Knippenberg, L.; de Groot, W.T.; van den Born, R.J.; Knights, P.; Muraca, B. Relational value, partnership, eudaimonia: A review. Curr. Opin. Environ. Sustain. 2018, 35, 39–45. [Google Scholar] [CrossRef] [Green Version]
  5. Chan, K.M.A.; Guerry, A.D.; Balvanera, P.; Klain, S.; Satterfield, T.; Basurto, X.; Bostrom, A.; Chuenpagdee, R.; Gould, R.; Halpern, B.S.; et al. Where are Cultural and Social in Ecosystem Services? A Framework for Constructive Engagement. Bioscience 2012, 62, 744–756. [Google Scholar] [CrossRef]
  6. Fish, R.; Church, A.; Winter, M. Conceptualising cultural ecosystem services: A novel framework for research and critical engagement. Ecosyst. Serv. 2016, 21, 208–217. [Google Scholar] [CrossRef] [Green Version]
  7. Daniel, T.C.; Muhar, A.; Arnberger, A.; Aznar, O.; Boyd, J.W.; Chan, K.M.A.; Costanza, R.; Elmqvist, T.; Flint, C.G.; Gobster, P.H.; et al. Contributions of cultural services to the ecosystem services agenda. Proc. Natl. Acad. Sci. USA 2012, 109, 8812–8819. [Google Scholar] [CrossRef] [PubMed] [Green Version]
  8. Gehl, J. Cities for People; Island Press: Washington, DC, USA, 2010. [Google Scholar]
  9. de Groot, R.S.; Alkemade, R.; Braat, L.; Hein, L.; Willemen, L. Challenges in integrating the concept of ecosystem services and values in landscape planning, management and decision making. Ecol. Complex. 2010, 7, 260–272. [Google Scholar] [CrossRef]
  10. Buchel, S.; Frantzeskaki, N. Citizens’ voice: A case study about perceived ecosystem services by urban park users in Rotterdam, the Netherlands. Ecosyst. Serv. 2015, 12, 169–177. [Google Scholar] [CrossRef]
  11. Scholte, S.S.K.; Van Teeffelen, A.J.A.; Verburg, P.H. Integrating socio-cultural perspectives into ecosystem service valuation: A review of concepts and methods. Ecol. Econ. 2015, 114, 67–78. [Google Scholar] [CrossRef]
  12. Stronegger, W.J.; Titze, S.; Oja, P. Perceived characteristics of the neighborhood and its association with physical activity behavior and self-rated health. Health Place 2010, 16, 736–743. [Google Scholar] [CrossRef] [PubMed]
  13. Jim, C.Y.; Shan, X. Socioeconomic effect on perception of urban green spaces in Guangzhou, China. Cities 2013, 31, 123–131. [Google Scholar] [CrossRef]
  14. Shan, X.Z. The socio-demographic and spatial dynamics of green space use in Guangzhou, China. Appl. Geogr. 2014, 51, 26–34. [Google Scholar] [CrossRef]
  15. Kloek, M.E.; Buijs, A.E.; Boersema, J.J.; Schouten, M.G.C. ‘Nature lovers’, ‘Social animals’, ‘Quiet seekers’ and ‘Activity lovers’: Participation of young adult immigrants and non-immigrants in outdoor recreation in the Netherlands. J. Outdoor Recreat. Tour. 2016, 12, 47–58. [Google Scholar] [CrossRef]
  16. Ode Sang, Å.; Knez, I.; Gunnarsson, B.; Hedblom, M. The effects of naturalness, gender, and age on how urban green space is perceived and used. Urban For. Urban Green. 2016, 18, 268–276. [Google Scholar] [CrossRef]
  17. Geijzendorffer, I.R.; Martín-López, B.; Roche, P.K. Improving the identification of mismatches in ecosystem services assessments. Ecol. Indic. 2015, 52, 320–331. [Google Scholar] [CrossRef]
  18. Kroll, F.; Müller, F.; Haase, D.; Fohrer, N. Rural-urban gradient analysis of ecosystem services supply and demand dynamics. Land Use Policy 2012, 29, 521–535. [Google Scholar] [CrossRef]
  19. Baró, F.; Haase, D.; Gómez-Baggethun, E.; Frantzeskaki, N. Mismatches between ecosystem services supply and demand in urban areas: A quantitative assessment in five European cities. Ecol. Indic. 2015, 146–158. [Google Scholar] [CrossRef] [Green Version]
  20. Palacios-Agundez, I.; Onaindia, M.; Barraqueta, P.; Madariaga, I. Provisioning ecosystem services supply and demand: The role of landscape management to reinforce supply and promote synergies with other ecosystem services. Land Use Policy 2015, 47, 145–155. [Google Scholar] [CrossRef]
  21. Schipperijn, J.; Stigsdotter, U.K.; Randrup, T.B.; Troelsen, J. Influences on the use of urban green space—A case study in Odense, Denmark. Urban For. Urban Green. 2010, 9, 25–32. [Google Scholar] [CrossRef]
  22. Wan, C.; Shen, G.Q. Salient attributes of urban green spaces in high density cities: The case of Hong Kong. Habitat Int. 2015, 49, 92–99. [Google Scholar] [CrossRef]
  23. Madureira, H.; Nunes, F.; Oliveira, J.; Madureira, T. Preferences for Urban Green Space Characteristics: A Comparative Study in Three Portuguese Cities. Environments 2018, 5, 23. [Google Scholar] [CrossRef] [Green Version]
  24. Tratalos, J.A.; Haines-Young, R.; Potschin, M.; Fish, R.; Church, A. Cultural ecosystem services in the UK: Lessons on designing indicators to inform management and policy. Ecol. Indic. 2016, 61, 63–73. [Google Scholar] [CrossRef] [Green Version]
  25. Brussels Environment. De Demografische Evolutie in Het Brussels Gewest. Available online: https://leefmilieu.brussels/barometer-van-het-leefmilieu/verslag-over-de-staat-van-het-leefmilieu/synthese-2015-2016/brusselse (accessed on 25 March 2020).
  26. BISA: Brussels Institute for Statistics and Analysis. Population by Place of Residence, Nationality (Belgian/non-Belgian), Marital Status, Age and Gender. 2020. Available online: https://bestat.statbel.fgov.be/bestat/crosstable.xhtml?view=f2bf9fa3-6609-4955-9627-76180ae20d66 (accessed on 2 March 2020).
  27. Brussels Environment. Brussel Groene Stad, Stad vol Natuur—Stadsplan. 2018. Available online: https://document.environnement.brussels/opac_css/elecfile/MAP_BxlVilleVerte_NL (accessed on 10 March 2020).
  28. Stessens, P.; Khan, A.Z.; Huysmans, M.; Canters, F. Analysing urban green space accessibility and quality: A GIS-based model as spatial decision support for urban ecosystem services in Brussels. Ecosyst. Serv. 2017, 28, 328–340. [Google Scholar] [CrossRef]
  29. Van de Voorde, T. Spatially explicit urban green indicators for characterizing vegetation cover and public green space proximity: A case study on Brussels, Belgium. Int. J. Digit. Earth 2017, 10, 798–813. [Google Scholar] [CrossRef]
  30. Le Texier, M.; Schiel, K.; Caruso, G. The provision of urban green space and its accessibility: Spatial data effects in Brussels. PLoS ONE 2018, 13, e0204684. [Google Scholar] [CrossRef] [PubMed]
  31. Brussels Environment. Natuurplan. 2016. Available online: https://leefmilieu.brussels/sites/default/files/user_files/prog_20160414_naplan_nl.pdf (accessed on 10 March 2020).
  32. Bertram, C.; Rehdanz, K. Preferences for cultural urban ecosystem services: Comparing attitudes, perception, and use. Ecosyst. Serv. 2015, 12, 187–199. [Google Scholar] [CrossRef]
  33. Rall, E.; Bieling, C.; Zytynska, S.; Haase, D. Exploring city-wide patterns of cultural ecosystem service perceptions and use. Ecol. Indic. 2017, 77, 80–95. [Google Scholar] [CrossRef]
  34. Nordh, H.; Alalouch, C.; Hartig, T. Assessing restorative components of small urban parks using conjoint methodology. Urban For. Urban Green. 2011, 10, 95–103. [Google Scholar] [CrossRef]
  35. Peschardt, K.K.; Schipperijn, J.; Stigsdotter, U.K. Use of Small Public Urban Green Spaces (SPUGS). Urban For. Urban Green. 2012, 11, 235–244. [Google Scholar] [CrossRef]
  36. Nordh, H.; Østby, K. Pocket parks for people—A study of park design and use. Urban For. Urban Green. 2013, 12, 12–17. [Google Scholar] [CrossRef]
  37. Peschardt, K.K.; Stigsdotter, U.K. Associations between park characteristics and perceived restorativeness of small public urban green spaces. Landsc. Urban Plan. 2013, 112, 26–39. [Google Scholar] [CrossRef]
  38. Jim, C.Y.; Chen, W.Y. Recreation-amenity use and contingent valuation of urban greenspaces in Guangzhou, China. Landsc. Urban Plan. 2006. [Google Scholar] [CrossRef]
  39. Xiao, Y.; Lu, Y.; Guo, Y.; Yuan, Y. Estimating the willingness to pay for green space services in Shanghai: Implications for social equity in urban China. Urban For. Urban Green. 2017, 26, 95–103. [Google Scholar] [CrossRef]
  40. Schindler, M.; Le Texier, M.; Caruso, G. Spatial sorting, attitudes and the use of green space in Brussels. Urban For. Urban Green. 2018, 31, 169–184. [Google Scholar] [CrossRef]
  41. Plieninger, T.; Dijks, S.; Oteros-Rozas, E.; Bieling, C. Assessing, mapping, and quantifying cultural ecosystem services at community level. Land Use Policy 2013, 33, 118–129. [Google Scholar] [CrossRef] [Green Version]
  42. Van Herzele, A.; Wiedemann, T. A monitoring tool for the provision of accessible and attractive urban green spaces. Landsc. Urban Plan. 2003, 63, 109–126. [Google Scholar] [CrossRef]
  43. Gupta, K.; Roy, A.; Luthra, K.; Maithani, S. Mahavir GIS based analysis for assessing the accessibility at hierarchical levels of urban green spaces. Urban For. Urban Green. 2016, 18, 198–211. [Google Scholar] [CrossRef]
  44. Statbel Structure of the Population. Available online: https://statbel.fgov.be/en/themes/population/structure-population#news (accessed on 8 May 2020).
  45. Raudsepp-Hearne, C.; Peterson, G.D.; Bennett, E.M.; Mooney, H.A. Ecosystem service bundles for analyzing tradeoffs in diverse landscapes. Proc. Natl. Acad. Sci. USA 2010, 107, 5242–5247. [Google Scholar] [CrossRef] [PubMed] [Green Version]
  46. Fischer, L.K.; Honold, J.; Botzat, A.; Brinkmeyer, D.; Cvejić, R.; Delshammar, T.; Elands, B.; Haase, D.; Kabisch, N.; Karle, S.J.; et al. Recreational ecosystem services in European cities: Sociocultural and geographical contexts matter for park use. Ecosyst. Serv. 2018, 31, 455–467. [Google Scholar] [CrossRef]
  47. Stessens, P.; Canters, F.; Huysmans, M.; Khan, A.Z. Urban green space qualities: An integrated approach towards GIS-based assessment reflecting user perception. Land Use Policy 2020, 91, 104319. [Google Scholar] [CrossRef]
  48. Rall, E.; Hansen, R.; Pauleit, S. The added value of public participation GIS (PPGIS) for urban green infrastructure planning. Urban For. Urban Green. 2019, 40, 264–274. [Google Scholar] [CrossRef]
  49. Moreno, C.; Allam, Z.; Chabaud, D.; Gall, C.; Pratlong, F. Introducing the “15-Minute City”: Sustainability, Resilience and Place Identity in Future Post-Pandemic Cities. Smart Cities 2021, 4, 6. [Google Scholar] [CrossRef]
  50. Sax, L.J.; Gilmartin, S.K.; Bryant, A.N. Assessing response rates and nonresponse bias in web and paper surveys. Res. High. Educ. 2003, 44, 409–432. [Google Scholar] [CrossRef]
  51. Dykema, J.; Stevenson, J.; Klein, L.; Kim, Y.; Day, B. Effects of E-Mailed Versus Mailed Invitations and Incentives on Response Rates, Data Quality, and Costs in a Web Survey of University Faculty. Soc. Sci. Comput. Rev. 2013, 31, 359–370. [Google Scholar] [CrossRef]
  52. Busby, D.M.; Yoshida, K. Challenges with Online Research for Couples and Families: Evaluating Nonrespondents and the Differential Impact of Incentives. J. Child Fam. Stud. 2015, 24, 505–513. [Google Scholar] [CrossRef]
  53. Groves, R.M.; Presser, S.; Dipko, S. The role of topic interest in survey participation decisions. Public Opin. Q. 2004, 68, 2–31. [Google Scholar] [CrossRef] [Green Version]
  54. Kahila-Tani, M.; Kytta, M.; Geertman, S. Does mapping improve public participation? Exploring the pros and cons of using public participation GIS in urban planning practices. Landsc. Urban Plan. 2019, 186, 45–55. [Google Scholar] [CrossRef]
Figure 1. Scheme detailing the process by which individuals come to value cultural ecosystem services (CES) (based on earlier frameworks proposed by [6,10,11]). Individuals within specific societal and physical contexts attribute certain values to nature and urban green which will affect their perception of urban green space (UGS). From interaction with UGS, benefits are perceived, and value is derived from perceived benefits. CES delivered by UGS are recognized upon users’ interaction with the UGS. In this paper, we focus on the role of socio-demographic characteristics and use patterns in how people perceive and value UGS.
Sustainability 13 03461 g001
Figure 2. A map of greenness per building block shows there is a clear difference in green provision between the city centre and the periphery of the region.
Sustainability 13 03461 g002
Figure 3. Multiple correspondence analysis (MCA) output for motivations for use (triangle) and UGS characteristics that contribute to a positive experience of selected UGS (square). Variables furthest from the origin have the strongest impact on the structuring of the data in feature space, while variables closest to the origin have a small impact. Variables closest together are more often selected together by survey respondents, while those farther apart were less often selected together. Supplementary variables have been overlaid in blue. These include age and household composition; several supplementary variables were tested (e.g., gender, occupation, income) but only household composition and age were significant.
Sustainability 13 03461 g003
Figure 4. Percentage of respondents in the nature-oriented and social groups who indicate that a certain UGS characteristic contributes to a positive (a) or negative (b) experience of the UGS. Statistically significant differences in valuation are bolded (Appendix A Table A1 and Table A2).
Sustainability 13 03461 g004
Figure 5. Percentage of respondents in the 18 to 29 and 65 to 79 age groups (a) as well as respondents in the 30 to 44 age group with and without children (b) who indicate that a certain UGS characteristic contributes positively. Statistically significant differences in valuation are bolded (Appendix A Table A3 and Table A4).
Sustainability 13 03461 g005aSustainability 13 03461 g005b
Figure 6. Percentage of respondents who indicate that a UGS characteristic is important in their ideal green space but who also indicate that this characteristic contributes negatively to their experience of the UGS.
Sustainability 13 03461 g006
Figure 7. UGS characteristic mismatch for nature-oriented and social users (a), 18 to 29-year-old and 65 to 79-year-old respondents (b), and 30 to 44-year-olds with and without children (c). Statistically significant differences are bolded (Appendix B Table A5, Table A6 and Table A7).
Sustainability 13 03461 g007aSustainability 13 03461 g007b
Figure 8. Time taken for nature-oriented and social users (a) and 30 to 44-year-old respondents with and without children (b) to reach their selected UGS.
Sustainability 13 03461 g008aSustainability 13 03461 g008b
Figure 9. UGS use (a) and valued characteristics (b) by respondents who indicate that their UGS is nearby or too far. Statistically significant differences are bolded (See Appendix B Table A8 and Table A9).
Sustainability 13 03461 g009aSustainability 13 03461 g009b
Table 1. List of UGS uses from which respondents could select their top three motivations for using their selected UGS.
UGS Uses
Exercise (solo or group sports)
Relaxation
Gathering with friends and family
Attending events
For peace and quiet
Being around people
Spiritual reasons/inspiration
Bringing a child/children to play
Being close to trees, plants and animals
For fresh air
Cooling down
Table 2. Respondents were asked to indicate the UGS characteristics that contribute to a positive or negative experience of their selected UGS. Characteristics respondents could select are listed below. Respondents were also able to select “other” and provide their own answer.
Positive CharacteristicsNegative Characteristics
Nearby home, school, place of workToo far from home, school, place of
work
Spacious
QuietNoisy
CleanDirty
Not too busyToo busy
SafetyUnsafe
Facilities (benches, playgrounds, sports fields...)Missing important facilities
Shaded areasNot enough shade
Water features (ponds, fountains…)Not enough water features
Trees, plants and animalsDoes not look natural/provide a sense
of being in nature
Lawns
Paved paths
Publisher’s Note: MDPI stays neutral with regard to jurisdictional claims in published maps and institutional affiliations.

