Abstract
The sustainable exploitation of raw materials, with improved safety and increased productivity, is closely linked to the development of mechanical mining installations. Mine hoists are designed for the transport of material, equipment and personnel between the mine surface and the underground. The mine hoist braking system is of paramount importance in its safe operation. Thus, for both drum and disc brake systems, the temperature of the friction surfaces is important for ensuring efficient braking, as exceeding the temperature threshold causes a decrease in the braking capacity. In this paper we present a numerical calculation model for the temperature of the braking disc of a mine hoist in the case of emergency braking. A real-scale model was built, based on the cable drive wheel and disc brake system of a hoisting machine used in Romania. Real material characteristics were imposed for the brake discs, the cable drive wheel and the brake pads. The simulation was performed for decelerations of 3, 3.5, 4 and 4.5 m/s2. The analysis shows that regardless of the acceleration and time simulated, the disc temperature reaches its maximum after 1.35 s of emergency braking. This value does not exceed the 327 °C limit where, according to previous studies, the braking power starts to fade. It means that the emergency braking is safe for the acceleration and masses under consideration, in the case of the studied mine hoist.
1. Introduction
Sustainability is often identified with the reduction of environment pollutants as the result of human activity. While in developed countries the carbon dioxide emissions represent the main concern, requiring the adjustment of the energy market in order to adapt to new challenges related to ecology [1] and the implementation of innovative solutions in production processes [2], in poor and non-developed countries, pollution is a result of basic human life activity [3]. The alternative usage of closed mines as residual energy resources and/or energy storage facilities is also considered a solution towards sustainability, as a result of the transition towards green energy production [4].
The problem of mining energy efficiency enhancement and resource saving are distinct aspects of sustainability, requiring technical modernization and innovative technological development, among which the most productive and sustainable hoist system is a crucial issue [5]. In this respect, a sustainable hoist of materials from underground to the surface requires the hoist’s brakes to operate more effectively and reliably in a continuously changing operational environment, by a continuous renovation or upgrading of the brake systems of older hoists [6]. The thermal behavior of all the elements of disk brakes is a very important issue, not only for new or developing ore mines, but also for the coal mines reaching their end of life, because the hoists are used even in the closure stage, for the crew access and conveyance of filling material and of the recovered materials, in and from underground.
Mine hoisting machines are complex machinery that are used for the raising of ore and waste rock and for the transport of personnel, materials and various mining equipment between the mine surface and its underground. A standard hoisting machine consists of: the hoist drive, the headframe, the ropes, the conveyances (cages or skips) as well as control and safety devices. Figure 1 shows a multicable mine hoist with a friction wheel that has its hoist drive located on the ground.
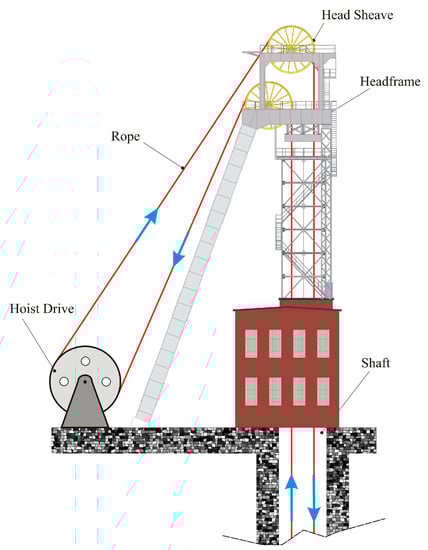
Figure 1.
Multi-rope friction (Koepe) hoist with ground located drive wheel.
One of the most important parts of any vertical transportation system, in general, and in mine hoists in particular, is the braking system. This must be able to continuously control and reduce the hoisting speed during operation, to completely stop the mine hoist in the case of emergency braking and to hold the conveyances (cages or skips) in a stationary position during loading and unloading.
Figure 2 shows a disc brake system, the state of the art solution used nowadays in the case of deep mine hoisting machines.
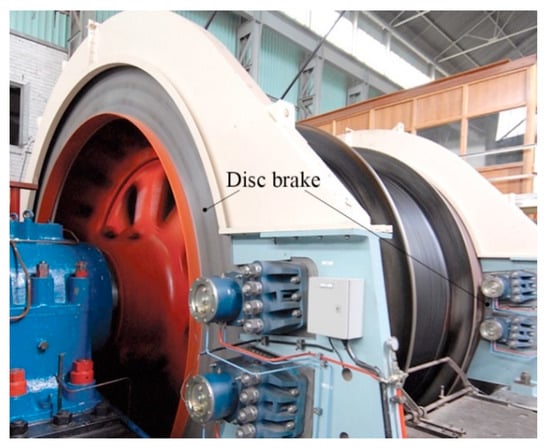
Figure 2.
Disc brake system for a mine hoist (Twiflex manufacturer).
Disc braking systems are the most widespread in the automotive industry, and the influence of heat generated by disc-plate friction on the braking efficiency is intensively studied. In Reference [7], all three modes of heat transfer (conduction, convection and radiation) were analyzed for disc brakes during emergency braking, using COMSOL Multiphysics simulation software. Another approach to show temperature distribution and heat transfer on the disc rotor and brake pad surface was conducted using the Finite element method (FEM) by the authors of [8] with the scope of aiding in the conceptual design and material selection of the disc rotor and brake pad. An analytical approach to heat generation during braking, as a function of time and space, was performed by the authors of [9] using Green’s function, concluding that the heat generated due to friction between the disc and the pad should ideally be dissipated to the environment to avoid decreasing the friction coefficient between the disc and the pad. The evaluation of frictional heat and thermal expansion was accomplished by the authors of [10] by modelling and simulation, using COMSOL Multiphysics simulation software and concluding that both the temperature and stress were below the yield values. Another computer-aided approach using SOLIDWORKS and ANSYS, for the evaluation of the braking performance by thermal analysis is illustrated in [11], where for the same scenarios and assumptions, the maximum temperature rise was simulated for several disc materials. ANSYS was also used to determine disc temperature and analyze the stress concentration, structural deformation and contact pressure of brake disc and pads during a single braking stop event by the authors of [12]. In another study by the authors of [13], ANSYS was used for transient thermal analysis of three different brake disc materials and a comparative analysis of the results was conducted. The studies by the authors of [14,15], where COMSOL Multiphysics simulation software was used once again to compute the temperature profile of the disc surface as a function of time during braking, showed that braking power starts to fade from temperatures above 327 °C, in the case of emergency braking in a car disc brake system.
Compared to automotive disc braking systems, in the case of the mine hoists, emergency braking must ensure that the system stops as quickly as possible, and that the ropes do not slip on the friction surface of the drive wheel. The actual emergency braking is computer controlled in order to maintain deceleration values between 3 and 4.5 m/s2 [16,17,18].
High values of deceleration during emergency braking can cause the temperature to rise above the permissible limits, thus determining brake fading or failure. There are numerous studies on the effects of heat generated by components of the mine hoist disc braking systems during emergency braking. In Reference [19] a finite element (FE) model of the 3D transient thermo-stress field of a brake shoe during mine hoist emergency braking was established, by adopting the sequential thermal–mechanical coupling method, and an experiment was carried out on the X-DM friction tester to verify the FE model. The authors of [20] concluded that there is a serious influence of surface temperature on tribological performance of the brake material during emergency braking. During emergency braking it was determined in study [21] that increases in hoisting acceleration/deceleration and maximum hoisting speed caused increases in the maximum equivalent stress and temperature. The authors of [22] presented a fault diagnosis method for hoist disc brake system based on machine learning, where it was determined that brake disc overheating is one important cause of failure. Investigation of the temperature distribution under braking conditions was investigated in [23] for various numbers and arrangements of brake pads to find the optimum combination. The study of the mine hoist brake in Reference [24] found that the friction heat energy concentrated on the surface layer of the brake shoe and the heat conducting property of the brake disc was better than that of the brake shoe. The results obtained by the authors of [25] showed that the maximum temperature, equivalent Von Mises stress and contact pressure are all located at the average friction radii of the contact surfaces of the brake disc and brake shoe during emergency braking. By comparing simulation results with experimental data, it was demonstrated that the 3D transient temperature field model of the brake shoe proposed by the authors of [26] is valid and practical. The authors of [27] conducted temperature measurements on real brakes and laboratory stands and compared the results with the results of numerical analyses of the operational parameters that occur during braking, in order to enable the design of new solutions of brake discs for the hoisting machines and maintain the reliable operation of these machines. The results of the study by the authors of [28] indicate that the temperature and stress distribution of the brake disc are closely related to the braking initial velocity and braking acceleration.
Mine hoists have a cyclic operation. Figure 3 shows the variation diagrams of acceleration and speed for one transport cycle in which the brake is applied by the emergency control systems. Thus, in the time interval 0 to t2, the acceleration of the skip takes place. The time interval t2 to t3 corresponds to the transport at constant speed. At time t3 there is an emergency situation, which determines the command of immediate emergency braking with constant deceleration, in the time interval t3 to t4.
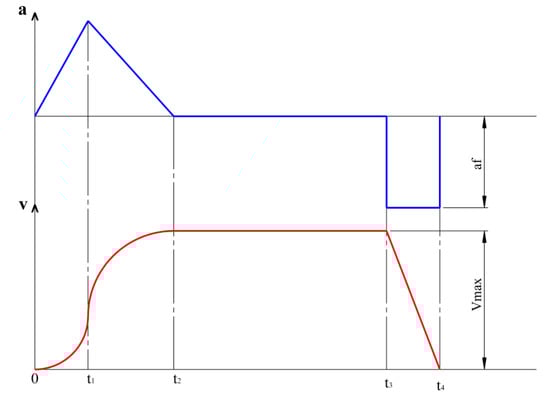
Figure 3.
Diagrams of acceleration (a) and speed (v) variation for one transport cycle.
2. Problem Formulation
During the braking process, the mechanical energy dissipated on the friction surface is transformed into heat, causing the surfaces of the brake disc to heat up. Exceeding the permissible temperature for the friction surfaces causes brake fading, wear of the brake disc and decrease of the friction coefficient [14,15]. Thus, the heating of the surface of the brake discs depends on the ratio between the amount of heat on the friction surfaces, produced by the transformation of kinetic energy into thermal energy, and the amount of heat dissipated on the disc surface. In Figure 4, the mounting location of the brake discs on the cable drive wheel is shown, and in Figure 5, the real dimensions of the analyzed brake disc, the contact surface and the positioning of the brake pads are presented.
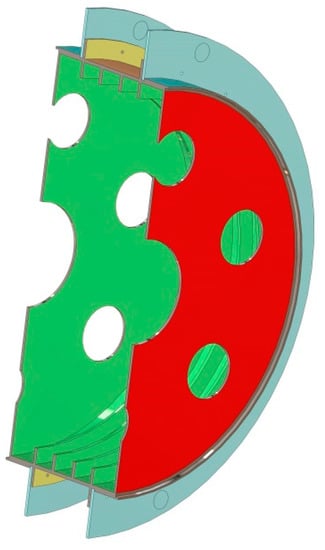
Figure 4.
Placement of the discs on the drive wheel.
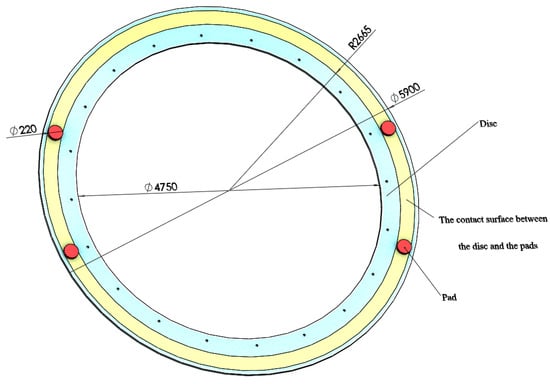
Figure 5.
Brake disc, brake pads positioning and contact surface between the disc and pads.
The simulation of the heating process of the brake discs can be performed for the case of emergency braking of the mine hoist moving at maximum speed. In this case the total kinetic energy is:
where ∑m represents the reduced mass of the moving components of the hoisting system.
In past research [16,17,18] the value of the reduced mass of the moving elements can be approximated based on the payload transported at one hoist as:
where Qu is the nominal payload transported, expressed in kg, and c is a constant used for conveyances transporting ore and waste rock, with values between c = 1… 20.
Assuming that during safety the braking deceleration is constant, the time required to stop the hoisting installation is:
It can be noted that its value represents the duration of the kinetic energy transformation into heat during the braking of the hoisting installation. It depends only on the value of the deceleration.
The braking power is the kinetic energy derivative in relation to time is
The braking system of the hoist has two brake discs, and only about 88% of the braking power is converted into heat on the disc [8,29]; thus, the heat generating power can be expressed as:
3. Theoretical Considerations Regarding Heat Transfer
3.1. Heat Transfer through Conduction
The maximum temperature reached by the braking discs of the hoisting installations depends on the amount of heat developed and on the amount of heat transferred. The evaluation of the energy produced by friction in discs is not a difficult problem; the difficulty appears in the evaluation of the transferred heat flux. Thus, heat transfer can take place through thermal conductivity, radiation and convection.
Thermal conduction determines the leveling of the differences between the kinetic energies of molecules, produced by the oscillation, and the translation and rotation of matter particles in solid media. If the matter displays a regular structure without gaps, as in the case of metals, this leveling of kinetic energies, and therefore of temperatures, is carried out very quickly. If, on the contrary, the material has gaps and discontinuities, as in the case of refractory ceramics, the temperature leveling is slower.
Heat transfer through conduction takes place based on Fourier’s law:
where h is the heat flux intensity, or specific heat flux, in W/m2; dq is the amount of elementary heat, in Ws; dA is the elementary transmission area, in m2; λ is the conductivity through conduction, in W/m·grd; θ is the temperature; t is the current time in s; and is the unit vector, normal to the transmission surface.
Figure 6 shows the physical process of heat transfer through thermal conduction. The vector of the specific heat flux has the opposite direction to the unit vector , which is oriented in the direction of increasing temperatures. Heat transfer takes place from higher temperature surfaces (θ + dθ) to lower temperature surfaces (θ).
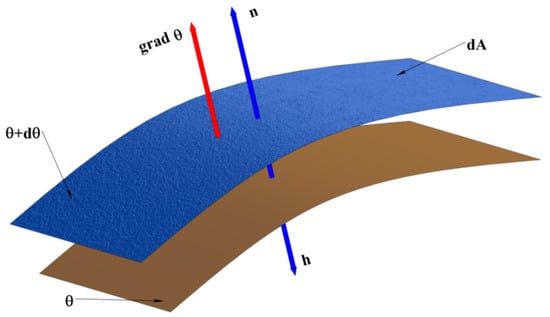
Figure 6.
Representation of the physical process of heat transfer through thermal conduction.
From Equation (6) the expression of the power transmitted locally through the closed surface boundary of the volume V is:
or, according to the Gauss–Ostrogradsky theorem:
In a solid body of volume V, in which there are heat sources and the heat is transferred only by conduction, the amount of heat developed is partly stored and partly transferred by conduction, as:
where p1 is the power per unit volume, in W/m3; c1 is the volume specific heat, in Ws/m3·grd; θ is the temperature; and t is the current time, in s.
If we consider that λ is constant, from Equation (8) the Laplace differential equation of heat transmission in bodies with sources results as follows:
3.2. Heat Transfer through Radiation
A body heated to a temperature T higher than absolute zero transmits heat by electromagnetic radiation to other neighboring bodies, whose temperatures are lower than its own. The specific heat flux transferred by radiation is given by the Stefan–Boltzmann law:
where P1r is the specific radiated heat flux, in W/m2; K = is the Stefan–Boltzmann constant; T1 is the surface temperature of the radiating solid; T2 is the ambient temperature; and et is the radiation coefficient or total emissivity of the body. The total emissivity, et, depends on the nature of the body and the way the surface is processed and treated.
For numerical calculations, Equation (11) can be expressed as:
In Equation (11) it is observed that . After the calculations it can be expressed as:
Equation (8) can be expressed in a simpler way with errors under 20%, when ΔT is between 3 °C and 200 °C, as:
3.3. Heat Transfer to Fluids
Heat transfer from solid media to fluid gases and liquids is achieved through the physical processes of convection and radiation. The physical process of convection involves a transfer of heat through thermal conduction, from the heated solid medium, to the fluid molecules, as well as between the fluid molecules that come in contact. The transport of molecules is performed as a result of a local excess of pressure and a decrease of the specific mass resulting from the local heating of the fluid, in the presence of resistant forces, such as gravitational force, inertia force or viscous friction force.
The power P transferred from the solid bodies to the fluid media is calculated with Newton’s relation:
where α is the total transmissivity, in W/m2·grd; A is the transmission area, in m2; T1 is the solid medium temperature; T2 is the ambient temperature; and T1 − T2 = ΔT is the temperature difference.
The total transmissivity α has a part due to radiation and a part due to pure convection, so its numerical value depends on the treatment of the separation area, on the temperature difference between the two media and on the ambient temperature. On the basis of Equation (15), the physical direction of heat transfer between the solid and fluid media is determined, thus we can determine a total local transmissivity in the form of:
where P1 measured in W/m2 is the specific power transferred.
3.4. Natural Convection
From a numerical point of view, the natural convection is estimated with the help of an invariant, the Nusselt number, expressed as:
where αc is the convection heat transfer coefficient, in W/m2·grd; dc is the characteristic dimension of the body, in m; and λ is the thermal conductivity of the fluid, in W/m·grd.
Nusselt’s number can also be expressed in relation to other invariants such as:
where Grashof’s number can be expressed as:
and Prandtl’s number is:
where ρ is the density of the fluid, in kg/m3; β is the coefficient of expansion of the fluid at constant pressure (≈1/T); μ is the dynamic viscosity (Poiseuille), in N·s/m2; g = 9.80665 m/s2 is the gravitational acceleration; and cp is the specific mass heat of the fluid, under constant pressure, in Ws/kg·grd.
In practice, Equation (18) can be simplified and written in the form:
The specific heat flux corresponding to the convection, based on Equation (21), thus becomes:
where, according to Equation (12):
3.5. Total Specific Power and Transmissivity
The total transmitted power is the sum of the powers transmitted by radiation and convection:
Based on Equations (14) and (22), it can be expressed as:
The equation of the global transmissivity is obtained by dividing Equation (24) to the temperature difference ΔT as:
The dynamic viscosity of air μ is expressed as:
where for the air temperature θ °C. Additionally, for Equation (26), temperature corrections were made for the density ρ and the thermal conductivity λ.
3.6. The Case of Solid Media Limited by Parallel Planes
In a permanent regime, a temperature field resulting from the integration of the differential Equation (9), with the terms and canceled, can be expressed by:
In this case, it is assumed that the heat transfer is performed in only one direction as in Figure 7, where two adjacent and different environments were represented. Thus, taking into account that Equation (27) becomes:
and by integration we obtain:
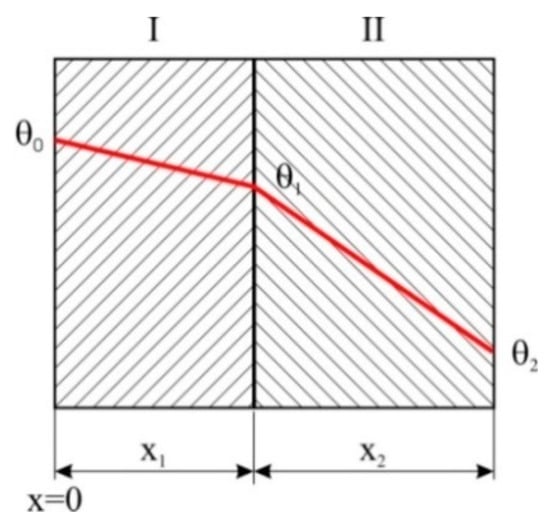
Figure 7.
Parallel plane walls.
The integration constants are determined by the boundary conditions. Based on Figure 7, the overtemperatures θ0 at x = 0, θ1 at x = x1 and θ2 at x = x2 are noted.
They are obtained as follows:
- -
- for ,
- -
- for .
The overall conductivity, for a number of n solid, parallel and adjacent media, is determined by the condition of equal transmitted powers, written according to Fourier’s law:
where A is the constant area of heat transfer; λ1…λn are the conductivities of media 1 to n; and λg is the global conductivity.
By solving the system of Equation (30), with the notations in Figure 8, we obtain:
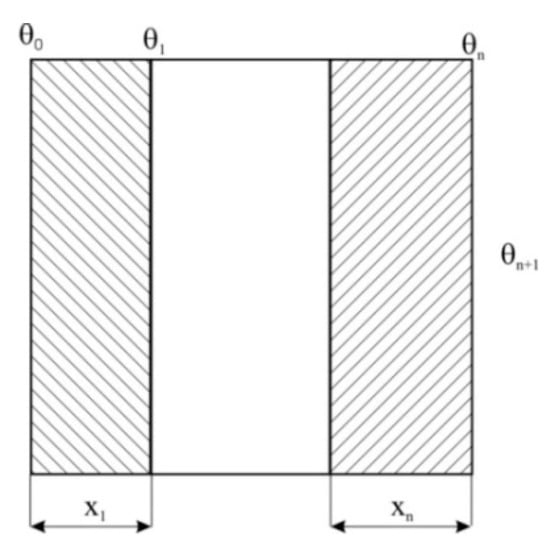
Figure 8.
Regarding the global transmissivity αg.
The global transmissivity αg, when the last solid medium transfers heat to a fluid medium, as in Figure 8, is obtained from the relation of the transferred power conservation:
where θn+1 is the temperature of the fluid medium.
It is expressed as:
4. Presentation of the Research Model
The heating of discs during the emergency braking was analyzed on a model of the cable drive wheel of the MK5x2 (ULKSM company, Donetsk, Russia) type of hoisting machine, used in Romania. This model was built on a one-to-one scale using SOLIDWORKS (Figure 9). The calculations were performed, assuming a uniform pressure distribution between the brake pads and the disc located at the periphery of the drive wheel.

Figure 9.
Drive wheel model for the MK5x2 type of hoisting machine, used in Romania.
Table 1 shows the characteristics of the materials used for the brake discs, the cable drive wheel and the brake pads.

Table 1.
Material properties for the brake elements.
For the analyzed hoisting machine, according to its technical documentation, the maximum transport speed value is vmax = 14 m/s, and the payload is Qu = 13,000 kg. In the case of this type of mine hoisting machine, some of its components have a fixed mass (like the drive motor, drive wheel, rope sheaves and conveyances), while other components have mass depending on the hoisting depth (vertical ropes and tail ropes). Thus, in order to calculate the maximum kinetic energy, we adopted the value c = 20 for the constant c in Equation (2). Based on the values adopted and Equation (1), the calculated value of the maximum kinetic energy was .
5. Results and Discussions
During emergency braking the deceleration is constant, and its value is limited by the non-slip conditions of the ropes on the drive wheel. As shown in the introduction, based on [16,17,18], the upper limit is 4.5 m/s2. For simulations, we considered four values of deceleration in the interval, from 3 to 4.5 m/s2.
Table 2 summarizes the calculated values of the stopping time according to Equation (3), of the braking power for each deceleration considered, given by Equation (4), and of the heat generating power based on Equation (5).
Table 2.
Summary of the calculated values of the stopping time, braking power and heat generating power for each deceleration considered.
During the braking process, inside the discs and between the brake discs and the rope drive wheel, there is heat transfer through conduction. The heat transfer between the discs, the drive wheel and the air takes place through convection and radiation. Furthermore, the heat produced at the boundary between the brake pads and the discs is dissipated by convection and radiation. Due to the short duration of the braking process (few seconds), the heat transfer through radiation can be neglected [29].
For solid, non-ventilated disc brakes, the convection heat transfer coefficient associated with laminar flow may be approximated by:
where λ it is the thermal conductivity of air, D is the outer diameter of the disc and Re is the Reynolds number. For the ambient temperature of 20 °C, the value of λ is 25.87 × 10³ W/mK.
For , the flow characteristics are turbulent and the heat transfer coefficient may be expressed as:
The Reynolds number is calculated as:
where µc is the kinematic viscosity of the air, which is m2/s for the ambient temperature of 20 °C.
Thus, for the present scenario, the Reynolds number is . Because it is higher than , we used Equation (35) for the calculation of the heat transfer coefficient, the result being αc = 442 W/(m2K).
For each of the four deceleration values considered, we performed a thermal simulation for the disc-rope drive wheel assembly model shown in Figure 9. The values summarized in Table 2 were used, as well as the value calculated for the convection heat transfer coefficient.
Figure 10 highlights the temperature distribution at the surface of the brake disc for a deceleration of 4.5 m/s2. It can be seen that the highest values appear at the contact surface between the disc and the pads, where the friction phenomenon takes place.
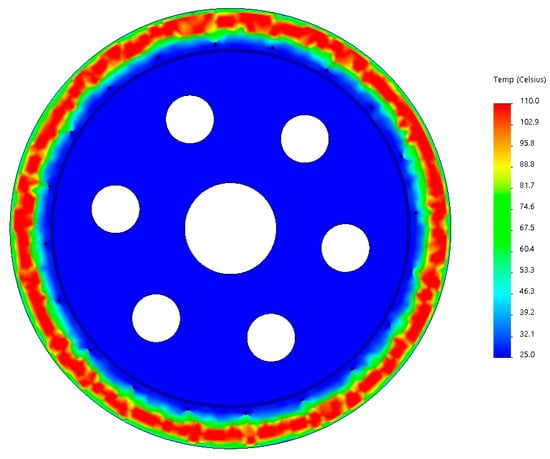
Figure 10.
Temperature variation on the disc surface for a deceleration of 4.5 m/s2.
Figure 11 highlights the temperature distribution in a cross-section of the disc for the deceleration of 4.5 m/s2. It is visible that the temperature of the disc is lower at its contact with the rope drive wheel, compared to the part of the disc in contact with the air. This is explained by the fact that between the disc and the rope drive wheel the heat transfer is through conduction, while between the disc and the air, the heat transfer is through convection.
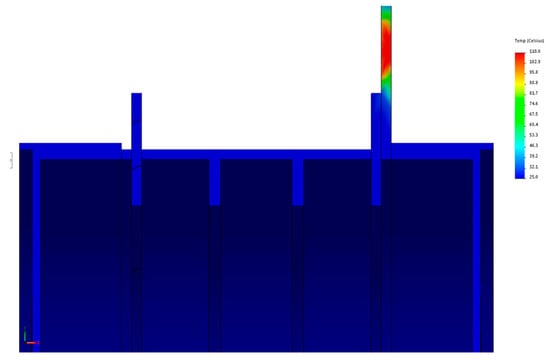
Figure 11.
Temperature variation in a cross-section of the disc for a deceleration of 4.5 m/s2.
For this value of deceleration, the temperature variation graph as a function of time was plotted in Figure 12. It can be observed that there was a temperature increase between 0.1 and 1.35 s, followed by a temperature decrease until the braking time limit of 3.11 s.
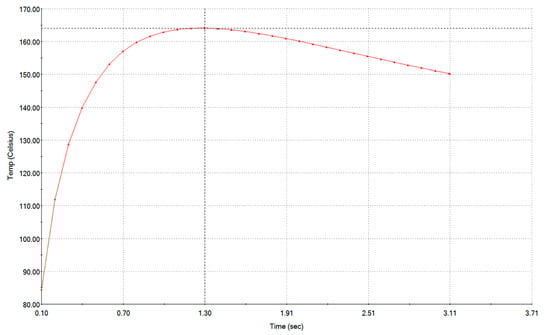
Figure 12.
Variation of temperature as a function of time, for deceleration = 4.5 m/s2.
The temperature variation for the nodes located on a radial direction across the width of the disc is represented in Figure 13 by the thin blue line. The graph corresponding to the Lagrange polynomial of interpolation is also plotted (red-dotted line). At the same time, we highlighted the zones corresponding to the contact between the disc and the pads, as well as those adjacent to it.
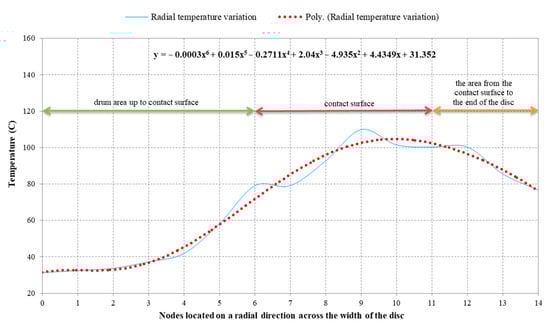
Figure 13.
Temperature variation on a radial direction.
Figure 14 shows the temperature variation diagrams for decelerations of 3, 3.5, 4 and 4.5 m/s2. The analysis shows that, regardless of the acceleration and time simulated, the disc temperature reached its maximum after 1.35 s of emergency braking. The highest temperature, 164.14 °C was obtained for a deceleration of 4.5 m/s2. This value did not exceed the 327 °C limit where the braking power starts to fade, according to [14,15].
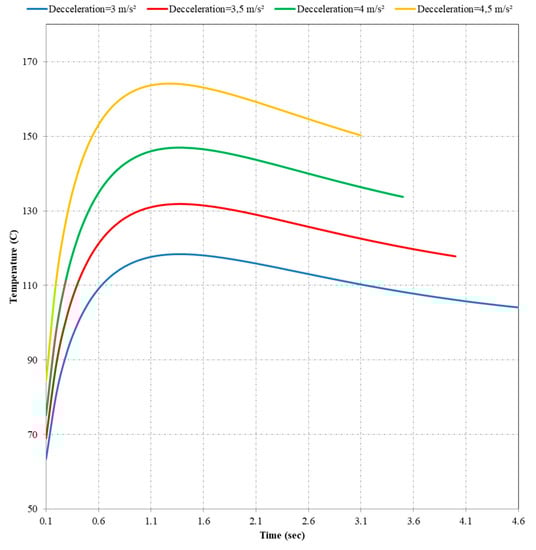
Figure 14.
Diagrams of temperature variation for different decelerations.
Starting from the maximum values of the temperatures for each deceleration, Figure 15 shows the diagram of the maximum temperature variation of the disc as a function of deceleration, for which the corresponding interpolation polynomial was determined. By imposing a value of 327 °C for the temperature, where the braking power starts to fade, it was determined that the third-degree polynomial has two imaginary solutions and a real one, equal to 7.46 m/s2. This means that for decelerations less than 7.46 m/s2, the disc temperature was under the limit value. However, decelerations of such magnitude can cause rope slippage on the drive wheel, which can lead to significant health and safety risks for staff.
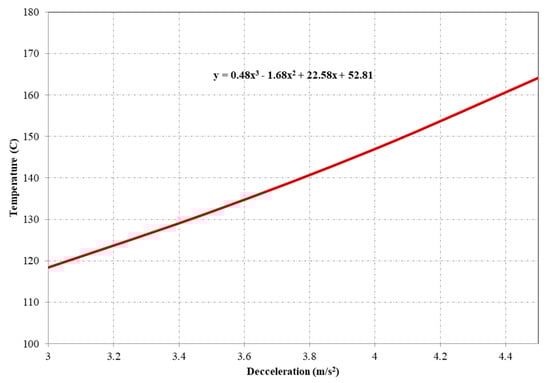
Figure 15.
Maximum temperature variation depending on deceleration.
Figure 16 and Figure 17 show the temperature gradient in X and Y direction in a cross-section view of the disc, for a deceleration of 4.5 m/s2.
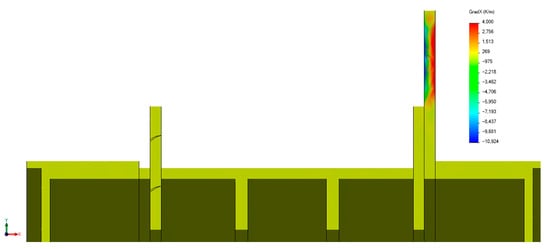
Figure 16.
Temperature gradient for X direction.
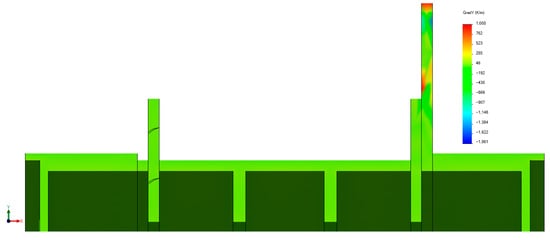
Figure 17.
Temperature gradient for Y direction.
The variation in time of the temperature gradient for the maximum temperature point on the friction surface, for both the X and Y directions, are plotted in Figure 18 and Figure 19, respectively. It can be seen that the temperature gradient for the X direction tended to stabilize after 2.6 s from the start of emergency braking. For the Y direction, the temperature gradient was increasing over the entire braking interval, but the values were almost one order of magnitude smaller than the temperature gradient for X direction.
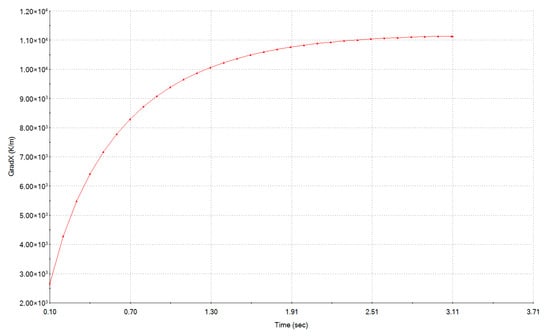
Figure 18.
Variation in time of the temperature gradient for direction X.
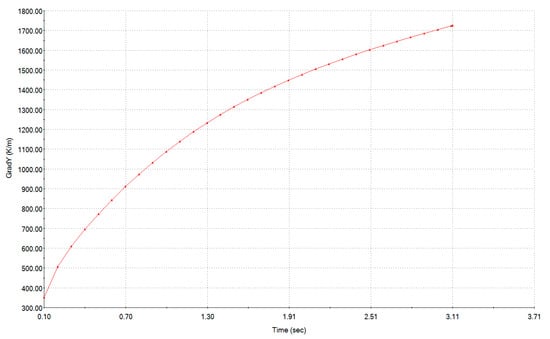
Figure 19.
Variation in time of the temperature gradient for direction Y.
Figure 20 shows the time variation of the heat flux for direction X. The graph has a shape similar to that of the temperature gradient for the same direction. As shown in Figure 21, the maximum values of the heat flux for direction X were in the central area of the contact surface between the disc and the pads, where the heat is dissipated at the boundary between the brake disc and the pads.
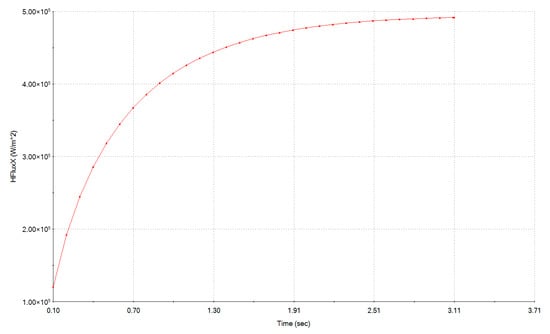
Figure 20.
The time variation of the heat flux for the X direction.
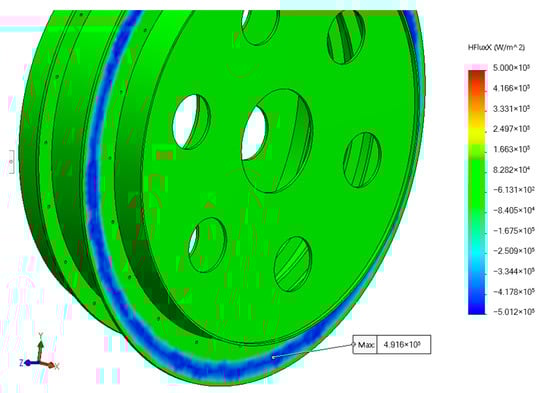
Figure 21.
Distribution of the heat flux for the X direction.
The time variation of the heat flux for the Y direction is shown in Figure 22, while Figure 23 illustrates that the maximum values of the heat flux for the Y direction were located on the outer diameter of the disc, where the heat transfer from the disc to the air is through convection.
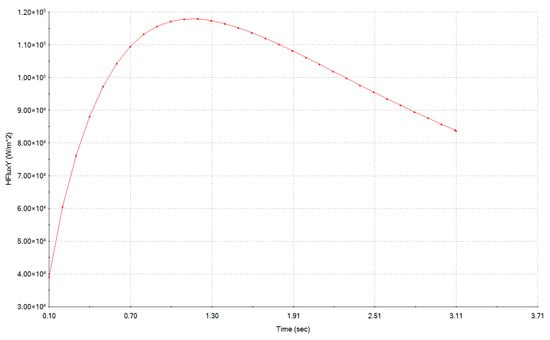
Figure 22.
The time variation of the heat flux for the Y direction.
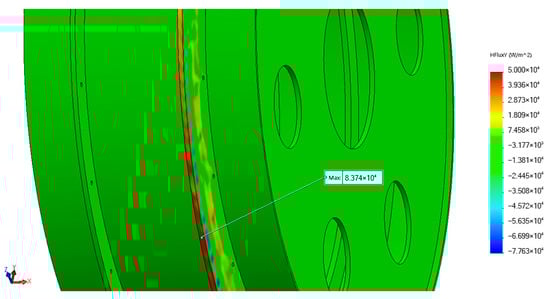
Figure 23.
Distribution of the heat flux for the Y direction.
The amount of generated heat that dissipated into the air was also determined, and Figure 24 presents the diagrams of the total produced heat and of the dissipated heat during the braking period.
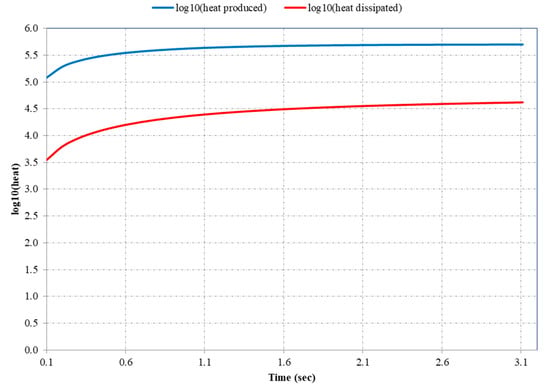
Figure 24.
Comparison of the total heat produced and heat dissipated.
6. Conclusions
In the paper we analyzed the thermal regime of the discs of a MK5x2 mine hoist during the emergency braking for decelerations of 3, 3.5, 4 and 4.5 m/s2. Because emergency braking is supposed to stop the installation as quickly as possible, but without the ropes slipping on the friction surface of the drive wheel, the presented values were chosen accordingly.
The kinetic energy that turns into heat is very high, due to the large masses that are moving. In case of an emergency braking, the conveyances are not stopped in their normal loading/unloading positions, as they remain suspended inside the pit at a random location. Under these conditions, for the immobilization of the mine hoist, it is necessary that the moment of the friction forces between the discs and the pads is greater than the moment of the unbalanced maximum masses. The temperature increase of the brake discs, in case of emergency braking, determines the decrease of the coefficient of friction between the discs and the pads. The peak temperature occurs in the case of emergency braking at maximum speed.
The results of the simulation show that, in case of emergency braking, the maximum temperature of the discs is reached at the contact surface with the pads, and its value is 164.14 °C. This temperature was reached after 1.35 s of emergency braking in the case of the maximum deceleration of 4.5 m/s2, out of the four decelerations simulated. This temperature did not exceed the 327 °C limit where, according to previous studies, the braking power starts to fade. Thus, it can be concluded that emergency braking is safe for the acceleration and masses under consideration.
The aim of the research was to validate a method of temperature modelling using computer simulation. This research can be used for various mine hoists in the phases of design or during the maintenance, improvement or upgrade of the braking systems of older hoists, in order to fulfill newer and more strict safety regulations.
Author Contributions
Conceptualization, F.D.P. and S.M.R.; methodology, F.D.P.; software, F.D.P., A.A. and I.B.; validation, F.D.P., S.M.R. and A.A.; writing—original draft preparation, F.D.P. and A.A.; writing—review and editing, S.M.R., A.A. and I.B.; All authors have read and agreed to the published version of the manuscript.
Funding
This research received no external funding.
Conflicts of Interest
The authors declare no conflict of interest.
References
- Borowski, P.F. Zonal and Nodal Models of Energy Market in European Union. Energies 2020, 13, 4182. [Google Scholar] [CrossRef]
- Borowski, P.F. Innovative Processes in Managing an Enterprise from the Energy and Food Sector in the Era of Industry 4.0. Processes 2021, 9, 381. [Google Scholar] [CrossRef]
- Borowski, P.F. Environmental pollution as a threats to the ecology and development in Guinea Conakry. Environ. Prot. Nat. Resour. 2017, 28, 27–32. [Google Scholar] [CrossRef]
- Menéndez, J.; Ordóñez, A.; Álvarez, R.; Loredo, J. Energy from closed mines: Underground energy storage and geothermal applications. Renew. Sust. Energ. Rev. 2019, 108, 498–512. [Google Scholar] [CrossRef]
- Ryl’nikova, M. Strategy of energy efficiency enhancement for sustainable and environmentally balanced development of gold deposits at its final stage. E3S Web Conf. 2018, 58, 01008. [Google Scholar] [CrossRef]
- Government of Canada (NRCan). Green Mining Initiative CanmetMINING Research Plan 2016–2021. Available online: https://www.nrcan.gc.ca/sites/www.nrcan.gc.ca/files/mining-materials/PDF/CanmetMINING_research_plan_document_access_e.pdf (accessed on 27 February 2021).
- Singh, H.; Shergill, H. Thermal Analysis of Disc Brake Using Comsol. Int. J. Emerg. Technol. 2012, 3, 84–88. [Google Scholar]
- Tsai, H.L.; Teo, H.G.; Gau, C.; Jeng, S.T.; Lee, C.C.; Lin, S.W.; Lin, S.C. Transient Thermal Analysis of a Disk Brake System. In Proceedings of the 14th National Computational Fluid Dynamics Conference, New Taipei City, Taiwan, 27–29 August 2007. [Google Scholar]
- Talati, F.; Jalalifar, S. Analysis of heat conduction in a disk brake system. Heat Mass Transfer 2009, 45, 1047–1059. [Google Scholar] [CrossRef]
- Bashir, M.; Qayoum, A.; Saleem, S. Analysis of frictional heating and thermal expansion in a disc brake using COMSOL. J. Phys. Conf. Ser. 2019, 1240, 012094. [Google Scholar] [CrossRef]
- Satope, S.; Bote, A.K.; Rawool, S.D. Thermal Analysis of Disc Brake. Int. J. Innov. Res. Sci. Technol. 2017, 3, 68–73. [Google Scholar]
- Belhocine, A.; Abu Bakar, A.R.; Bouchetara, M. Thermal and structural analysis of disc brake assembly during single stop braking event. Aust. J. Mech. Eng. 2016, 14, 26–38. [Google Scholar] [CrossRef]
- Belhocine, A.; Abdullah, O.I. A thermomechanical model for the analysis of disc brake using the finite element method in frictional contact. J. Therm. Stresses 2019, 43, 305–420. [Google Scholar] [CrossRef]
- Heat Generation in a Disc Brake Solved with COMSOL Multiphysics 4.3a. Available online: https://cdn.comsol.com/wordpress/2013/02/Step-by-step-guide-for-modeling-heat-generation-in-a-disc-brake.pdf (accessed on 28 December 2020).
- Heat Generation in a Disc Brake Created in COMSOL Multiphysics 5.6. Available online: https://www.comsol.com/model/download/818061/models.heat.brake_disc.pdf (accessed on 28 December 2020).
- Popescu, F.D.; Radu, S.M. Vertical Hoist Systems, New Trends Optimizations; LAP LAMBERT Academic Publishing: Saarbrucken, Germany, 2013. [Google Scholar]
- Popescu, F.D. Instalaţii de Transport pe Vertical; Editura Focus: Petroșani, Romania, 2010. [Google Scholar]
- Popescu, F.D. Minimising the Actuating Power of Vertical Transport Installations by Optimisation of Dynamic and Kinematics parameters. Int. J. Mech. 2013, 3, 262–276. [Google Scholar]
- Zhu, Z.C.; Ma, W.; Peng, Y.X.; Chen, G.A.; Liu, B.B. Transient thermo-stress field of brake shoe during mine hoist emergency braking. T. Can. Soc. Mec. Eng. 2013, 37, 1161–1175. [Google Scholar] [CrossRef]
- Bao, J.; Li, Z.; Hu, D.; Yin, Y.; Liu, T. Frictional Performance and Temperature Rise of a Mining Nonasbestos Brake Material during Emergency Braking. Adv. Mater. Sci. Eng. 2015, 867549. [Google Scholar] [CrossRef]
- Wang, D.; Wang, R.; Zhang, J. Dynamic brake characteristics of disc brake during emergency braking of the kilometer deep coal mine hoist. Adv. Mech. Eng. 2020, 12, 1–23. [Google Scholar] [CrossRef]
- Li, J.; Jiang, S.; Li, M.; Xie, J. A Fault Diagnosis Method of Mine Hoist Disc Brake System Based on Machine Learning. Appl. Sci. 2020, 10, 1768. [Google Scholar] [CrossRef]
- Yang, Y.; Ye, X. Research and Optimization on Thermal Performance of Brake Disc for Ultra Deep Mine Hoist. In Proceedings of the 10th International Conference on Measuring Technology and Mechatronics Automation (ICMTMA), Changsha, China, 10–11 February 2018; pp. 48–51. [Google Scholar] [CrossRef]
- Peng, Y.; Zhu, Z.; Chen, G.; Bao, J.; Liu, B.; Li, Y. Temperature Field of Disc Brake for Mine Hoist. Adv. Sci. Lett. 2011, 4, 2380–2384. [Google Scholar] [CrossRef]
- Wang, D.; Wang, R.; Heng, T.; Xie, G.; Zhang, D. Tribo-Brake Characteristics between Brake Disc and Brake Shoe during Emergency Braking of Deep Coal Mine Hoist with the High Speed and Heavy Load. Energies 2020, 13, 5094. [Google Scholar] [CrossRef]
- Zhu, Z.; Peng, Y.; Shi, Z.; Chen, G. Three-dimensional transient temperature field of brake shoe during hoist’s emergency braking. Appl. Therm. Eng. 2009, 29, 932–937. [Google Scholar] [CrossRef]
- Kowal, L.; Turewicz, K.; Kruczek, T. Measurements of temperature of brake disks in hoisting machines of shaft hoists. In Proceedings of the 11th International Conference on Quantitative InfraRed Thermography, Naples, Italy, 11–14 June 2012. [Google Scholar] [CrossRef]
- Yang, Y.; Ye, C.; Zou, S. Numerical simulation of temperature field and stress field for brake disk in mine hoist. Mech. Strength 2017, 39. [Google Scholar] [CrossRef]
- Limpert, R. Brake Design and Safety, 3rd ed.; SAE International: Warrendale, PA, USA, 2011. [Google Scholar] [CrossRef]


Publisher’s Note: MDPI stays neutral with regard to jurisdictional claims in published maps and institutional affiliations. |
© 2021 by the authors. Licensee MDPI, Basel, Switzerland. This article is an open access article distributed under the terms and conditions of the Creative Commons Attribution (CC BY) license (http://creativecommons.org/licenses/by/4.0/).