Abstract
The waste disposal crisis and development of various types of concrete simulated by the construction industry has encouraged further research to safely utilize the wastes and develop accurate predictive models for estimation of concrete properties. In the present study, sugarcane bagasse ash (SCBA), a by-product from the agricultural industry, was processed and used in the production of green concrete. An advanced variant of machine learning, i.e., multi expression programming (MEP), was then used to develop predictive models for modeling the mechanical properties of SCBA substitute concrete. The most significant parameters, i.e., water-to-cement ratio, SCBA replacement percentage, amount of cement, and quantity of coarse and fine aggregate, were used as modeling inputs. The MEP models were developed and trained by the data acquired from the literature; furthermore, the modeling outcome was validated through laboratory obtained results. The accuracy of the models was then assessed by statistical criteria. The results revealed a good approximation capacity of the trained MEP models with correlation coefficient above 0.9 and root means squared error (RMSE) value below 3.5 MPa. The results of cross-validation confirmed a generalized outcome and the resolved modeling overfitting. The parametric study has reflected the effect of inputs in the modeling process. Hence, the MEP-based modeling followed by validation with laboratory results, cross-validation, and parametric study could be an effective approach for accurate modeling of the concrete properties.
1. Introduction
The cement production process results in the depletion of limited natural resources and also emits a significant amount of carbon dioxide to the atmosphere [1,2,3]. Moreover, due to rapid industrialization, a large amount of waste and by-products are generated whose proper disposal otherwise remains a problem. In this domain, the concept of green concrete is becoming popular to condense the adverse effects of concrete and effectively utilize the waste products. Utilization of alternative materials as a cement replacement contributed to achieving sustainable and durable concrete [4]. The most common waste and supplementary cementitious materials used in the concrete production are fly ash, waste foundry sand, blast furnace slag, glass, rice husk ash, recycled aggregate, silica fume, coal bottom ash and bagasse ash [4,5,6,7]. Sugarcane bagasse is one of the agricultural waste materials that remains after crushing, extraction and is the primary fuel in the cogeneration process for steam and electricity generation in sugarcane agro-industry [8]. A single ton of sugarcane produces nearly 26 percent of bagasse and 0.62 percent of residual ash [9]. The ash is disposed of by dumping in landfills and poses serious environmental issues [10].
A large number of studies have been conducted on the viable use of sugarcane bagasse ash (SCBA) as a cement of replacement in concrete production. Chusilp et al. (2009) [11] reported higher compressive strength of concrete with 20% SCBA. Sobuz et al. (2014) [12] reported that the maximum strength of SCBA concrete could be achieved by replacing 10% cement with SCBA. A study conducted by Jagadesh et al. (2018) [13], reported 50% strength reduction (attributed to larger SCBA particles and pore size) when 30% raw SCBA was incorporated in concrete. The same authors used 10% processed SCBA in concrete by replacing cement, and reported almost a 28% increase in the strength of SCBA concrete. This was attributed to silica content, formation of secondary calcium silicate hydrate, fine SCBA particles and increased packing density of SCBA concrete [13]. Bahurudeen et al. (2015) [4] reported higher strength of SCBA concrete as compared to normal strength concrete. Maximum strength was observed for concrete with 10% SCBA and strength reduced afterward with replacement level up to 25% SCBA. The strength reduction was related to the dilution of the matrix caused by higher SCBA percentage replacement. Moreover, the incorporation of SCBA in concrete has also resulted in improved durability properties such as chloride penetration and conductivity, sorptivity and water permeability [11,14,15,16].
The above discussion highlights that concrete incorporated with varying dosages of SCBA shows anomalous behavior in terms of mechanical properties. This behavior could be attributed to several aspects, i.e., type, composition, and dosage of SCBA, mix proportions and the properties of the concrete constituents. Therefore, it is imperative to correlate and assess the causative factors responsible for variation in the mechanical properties of SCBA concrete prior to frequent practice. Such factors will have momentous effects on the construction industry. The problem can be addressed by using the distinguished features of machine learning models such as support vector regression (SVR), genetic programming, artificial neural network (ANN), and random forest (RF) [17,18,19,20].
The application of the random forest (RF) technique for modeling the mechanical properties of high-strength concrete was reported by Farooq et al. (2020) [21]. The authors revealed good prediction capacity of the RF model. Zhang et al. (2020) [22] developed a RF model for investigating the hardened properties of synthetic-sand concrete. Results of the study reported the reduced performance of RF as compared to other models. A study conducted by Sun et al. (2019) [23] utilized the RF combined with an optimization algorithm for predicting the uniaxial compressive strength of rubberized concrete. The authors reported good accuracy of the model with high correlation. Chou et al. [24] applied support vector machine (SVM) for predicting the compressive strength of high-strength concrete. The output of the study indicated high prediction accuracy of the SVM model. In another study conducted by Deng et al. (2018) [25], where SVM was employed to model the compressive strength of recycled aggregate concrete, based on statistical analysis, the SVM showed an acceptable modeling outcome. Similarly, the artificial neural network (ANN) was applied to predict the compressive strength of silica fume concrete, lightweight concrete, high-performance concrete, foamed concrete, and elastic modulus of recycled aggregate concrete [19,26,27,28,29,30,31]. However, the ANN was reported as a black-box model, though it does not consider information or process of the associated problem [5]. Recently, the gene expression programming (GEP) was applied to predict the properties of concrete-filled steel tubes, RC frame structures, SCBA concrete, waste foundry sand concrete, and high strength concrete [5,32,33,34]. The GEP was also identified as having certain shortcomings due to its incapability to consider a few deviating datasets. For better modeling output, the deviating datasets need to be removed from the data [5].
Considering the drawbacks of several machine learning models, the current study employed an advanced algorithm, i.e., multiple expression programming (MEP), to model the mechanical properties of SCBA concrete. The MEP has the ability to encode multiple chromosomes to a single program. The best possible chromosome can be selected based on evaluating the fitness [35]. MEP is considered as an improved version of the GEP having the capacity to estimate accurate results, given the complexity of the target, as compared to other modeling techniques [36]. It is capable of highlighting and excluding errors from the final expression form and also pre-specifying of final expression is not compulsory. MEP has been rarely used in the civil engineering field despite its distinguished features and could be an effective tool for solving complex problems. In this study, the mechanical properties of SCBA concrete, i.e., compressive strength (CS), splitting tensile strength (ST), and flexural strength (FS), were modeled employing MEP with the most influential parameters as modeling inputs. A large dataset was collected from the literature. The robustness of the developed MEP was validated using the mechanical properties derived from laboratory testing. Furthermore, the behavior of the models, during both training and testing, was judged using various statistical indicators and the modeling output was cross-validated through a 10-fold method. Parametric analysis was performed to find out the effect and most influential input parameters.
2. Methods and Datasets
2.1. Multi Expression Programming
John Holland (1975) was the first one who introduced the genetic algorithm (GA) motivated by the evolutionary theory. Similarly, the genetic programming (GP) was initially proposed by Nichael Cramer (1985) [37,38,39]. The GP is mainly an extended form of GA which can be distinguished by description of the solution. Various genetic operators such as crossover, reproduction, and mutation are brought together in GP with little variation [36,40]. An arbitrary population of the parse trees is created to increase the diversity of the model [41]. Based on fitness criteria, some portion of the trees are killed in the implementation stage. Furthermore, the best individuals are selected as a parent to create a new generation of individuals based on the error assessment criteria. This cyclic process of selecting the best individuals continues when termination criteria is reached or a specified number of iterations are attained [38]. However, the GP algorithm is accompanied by certain shortcomings. Firstly, the tree crossover genetic operators are utilized which creates a huge population of parse trees, resulting in an increased simulation time and space requirement [38]. Secondly, the non-linear structure of GP is based on phenotype and genotype, thus making it difficult to develop practical empirical equations for the output [42]. A single expression of pre-specified length is implemented in the GP process regardless of the problem complexity. Moreover, the process escalates with the number of genes in chromosomes to a certain value and it is practically impossible to enforce a complex chromosome to produce simple expression [35].
Recently, a linear variant of machine learning, i.e., multi expression programming (MEP), has been proposed with individual entities as a variable length [35,43]. The linear variants permit MEP to extricate the genotype and phenotype [44]. This technique is considered advantageous over other techniques due to linear chromosomes and permitting multiple solutions in an individual chromosome. This unique feature allows searching in a wider space to gather the best possible solution. In comparison to the GP technique, the MEP applies simple decoding procedures and is given particular importance in case of unknown complexity of targeted expression [45]. MEP can handle exceptions such as invalid expressions, division by zero. The gene is responsible for generating an exception, then it alters to an arbitrarily terminal symbol; thereby, no infertile individuals enter the next generation. This produces a margin in the structure of chromosomes during the evaluation process [35]. The methodology flowchart of MEP is presented in Figure 1. Which is adapted from [46]. The MEP is decoded similarly to the C and pascal compiler empirical relationship to machine coding. The outcome of the MEP process is a combination of mathematical operators or variables in a linear string of instructions [46]. The chromosome length is governed by several genes per chromosome, whereas the gene encoded the elements in function and terminal set.
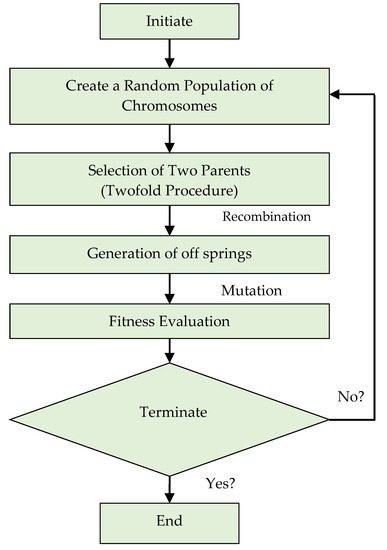
Figure 1.
Schematic diagram of the multiple expression programming.
In order to develop a generalized relationship, the MEP model requires several fitting parameters. In this study, basic mathematical operators were considered to get simple expressions and a trial and error method was used to get the fitting parameters [47]. Population size was used to specify the number of programs required as the high population size can lead to complex and long convergence times, thus often causing over-fitting problems. Moreover, the error can be reduced by running algorithms for an enormous number of generations. Several combinations of parameters were initiated, and the best possible grouping was selected based on model performance. The parameter setting for MEP modeling is presented in Table 1.

Table 1.
Optimum parameter setting for MEP.
A large number of studies have been conducted during the last decade that has focused on neural network and GEP models. The abovementioned advantages of MEP over other methods can lead to accurate and reliable models in many fields. The MEP has been applied in a few research studies to estimate elastic modulus of high and normal strength concrete [44], formulation of compressive strength of Portland cement [48], soil deformation modulus [49], consolidation depth of soil layer [46], and strength of polymer confined concrete columns [36]. In the present study, the SCBA concrete properties have been considered to evaluate the performance of the MEP.
2.2. Modeling Dataset
For this study, a comprehensive dataset of SCBA concrete properties was obtained from the published literature [4,11,12,13,15,16,50,51,52,53,54,55,56,57,58,59,60,61,62,63,64,65,66,67,68,69,70,71] and was analyzed to get the most effective parameters affecting the properties of SCBA concrete. Literature study revealed that the mechanical properties of normal concrete are influenced by mix composition. For concrete with admixtures and supplementary cementitious materials, the type and dosage of the admixtures affect the properties of concrete [72]. Therefore, in this study, the water to cement ratio (w/c), the proportion of bagasse ash (SCBA%), fine aggregate content (FA), cement content (CC), and quantity of coarse aggregate (CA) are chosen as input for the prediction of SCBA concrete mechanical properties. Frequency histograms of the modeling input parameters are shown in Figure 2 to visualize the distribution [73]. The statistical parameters, i.e., mean, minimum, maximum, and standard deviation of input data used are also given in Table 2.
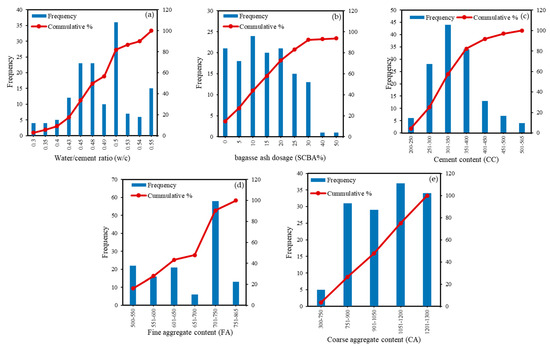
Figure 2.
Frequency histograms of the input data (a) w/c (b) sugarcane bagasse ash (SCBA)% (c) CC (d) FA (e) CA.
Table 2.
Statistics of the input parameters.
2.3. Cross-Validation with k-Fold Algorithm
Evaluating the performance of machine learning models can be a difficult task since the learning models usually fail to produce generalizable results based on data it has not been trained on. Usually, the data are divided into train and test set for models training and testing, respectively, and performance is then evaluated with statistical criteria. However, this method does not go well if a larger dataset is not available. Moreover, overfitting of the data is another problem in machine learning-based modeling. To ensure that the model can perform well on unseen data and to address the modeling overfitting, a resampling technique is used, called k-fold cross-validation. This method distributes the actual data to k subclasses [74]. The enhanced performance and efficiency of the 10-fold cross-validation method is reported in the literature [75]. In the current study, the 10-fold cross-validation is adopted by randomly dividing the dataset into ten subsets. Among all the ten subsets, each subset is used for validation to examine the grouping model and the same method is repeated for all the remaining subsets. The accuracy of the final model is then expressed in terms of mean accuracy obtained by the ten-fold method in ten individual rounds.
2.4. Performance Measures
The developed models are evaluated employing statistical checks, i.e., correlation coefficient (R), Nash Sutcliff efficiency (NSE), mean absolute error (MAE), relative root mean squared error (RRMSE), relative squared error (RSE), performance index (ρ), and root means squared error (RMSE) [44,76]. The high values of R and NSE and low values of RMSE and MAE indicate better performance. The indicator R quantifies the linear relationship between input and output [30] and an R-value of more than 0.8 signifies an excellent correlation between predicted and actual data [77]. Despotovic et al., (2016) [78] reported that a model can be considered excellent if the value of RRMSE is between 0 and 0.10; good if the values are between 0.11 and 0.20. The expressions for the statistical indicators are shown below (Equations (1)–(7)).
where , show a number of data points, predicted data, measured data, mean of predicted data, and mean of measured data, respectively. The T and TE represent the training and testing datasets, respectively.
3. Experimental Methods
3.1. Sugarcane Bagasse Ash (SCBA) Characterization
The waste SCBA was obtained from sugar industry located in Khyber Pakhtunkhwa, Pakistan. It has been reported in the literature that fibrous and unburnt content in waste bagasse ash reduces the pozzolanic activity. Removal of unburnt particles, proper characterization, and grinding up to cement fineness considerably increases its pozzolanic activity [4,79]. Therefore, the obtained SCBA was sieved from the #200 sieve and afterward grinded to reduce the particle size. Grinding was carried out in a ball mill machine and a grinding media (ceramic balls)-to-ash ratio of 5 by weight was kept constant. The grinding was done for different time periods, i.e., 15, 30, 45, and 60 min. The surface area of SCBA was determined according to ASTM C204 for each successive grinding period. It can be seen in Figure 3 that increasing the duration to 60 min, the specimen SCBA gives more surface area compared to cement.
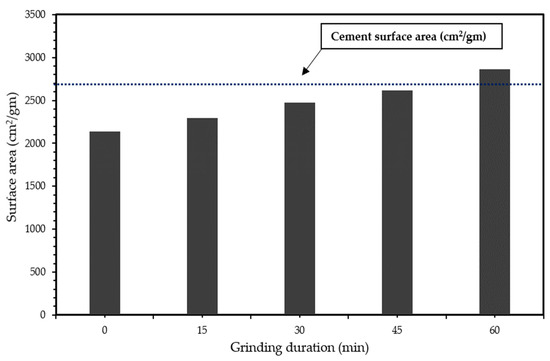
Figure 3.
Effect of grinding time on the surface area of SCBA.
The chemical composition and amorphous nature of SCBA was evaluated through X-ray fluorescence (XRF) and X-ray diffraction (XRD). The chemical composition of SCBA is given in Table 3. According to the available literature [80,81], the pozzolanic activity mainly depends on the silica and alumina content in a pozzolanic material. It can be inferred from XRF results that the quantity of silica, alumina, and iron oxide is above 70%, which qualifies the ASTM C618–05 standard for pozzolan.
Table 3.
XRF results of processed ash (SCBA).
The XRD pattern of SCBA exhibits the amorphous nature of ash with few pronounced peaks. The SCBA was already processed and fibrous and unburnt contents were removed which enhances its properties. One peak at 2θ = 26° was observed and is termed as cristobalite [4]. This is formed due to high and long temperature burning and is classified as a crystalline polymorph of silica. XRD pattern of SCBA is shown in Figure 4.
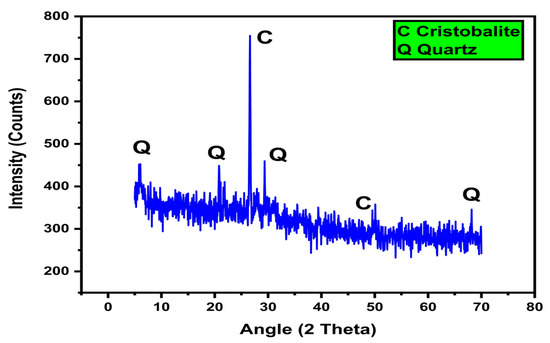
Figure 4.
Diffraction pattern of SCBA.
Scanning electron micrographs of SCBA are shown in Figure 5. X500 to X5000. In the micrographs, the heterogeneous nature of SCBA is prominent. The SCBA exhibited various shape particles such as elongated, needle, flat, oval, and irregular. The size of needle and oval shape particles are found up to 50 μm. Likewise, 10 μm size of irregular particles can also be observed. The irregular shape particles are mainly silica-rich [82]. Furthermore, voids over the surface are also visible in the form of black spots and size ranges from 5 to 10 μm. The voids in the SCBA particles may be due to excessive grinding. Overall, the size of different particles ranges from 5 to 50 μm which can be observed in Figure 5.
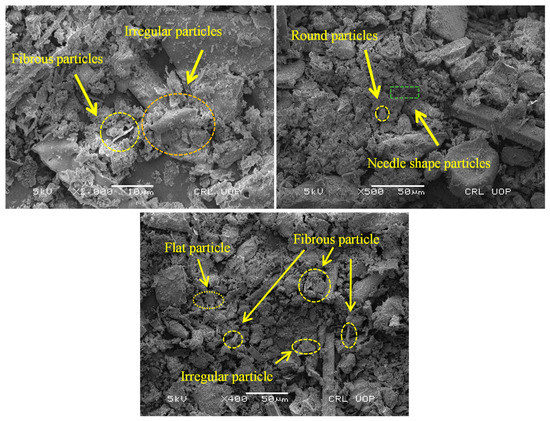
Figure 5.
SEM images of SCBA at different magnifications.
3.2. Mix Proportions and Specimen Preparation
Experimental testing of SCBA concrete was conducted to verify the behavior of the model through the validation requirement. SCBA was incorporated in concrete as 0, 10, 20, 30, and 40% by replacing cement. Concrete specimens were casted, and comparison of hardened properties was made between SCBA modified matrix (BC) and control specimens (CM). The water-to-cement ratio for all the specimens was kept constant to compare the modified matrix with a non-modified matrix. The detailed mix design with the formulation is depicted in Table 4. Concrete specimens were prepared and tested for compressive strength (CS), splitting tensile strength (ST), and flexure strength (FS) at the curing age of 28 days in accordance with ASTM C39, ASTM C496, and ASTM C293, respectively. The results obtained from laboratory tested concrete were used for validation of the MEP models.
Table 4.
Mix Proportions of the concrete mix.
4. Results and Discussion
4.1. Mechanical Properties of SCBA Concrete
Concrete specimens were prepared in the laboratory with 0, 10, 20, 30 and 40% cement replaced with SCBA to determine the compressive, splitting tensile and flexural strength. The results of mechanical properties are given in Table 5. It can be observed (Table 5) that the strength of modified concrete (BC) increases up to 10% SCBA replacement and consistently decreases afterward. The maximum strength gained is at 10% SCBA replacement and may be due to the fine SCBA particles dispersed all over the concrete mix. Moreover, the silica content reacts with lime (resulted from cement hydration) and produces more calcium silicate hydrate (CSH) [53,83]. The decrease in strength as compared to CM is 6.5, 17.3, and 30.3% for 20BC, 30BC, and 40BC, respectively. This may be attributed to non-availability of adequate calcium hydroxide, which consequently reduced the formation of secondary CSH.
Table 5.
Results of mechanical properties obtained from experimental testing.
Similar results were observed for ST and FS as shown in Table 5. In comparison with CM, the increase in ST is 25.3 and 15.8% for 10BC and 20BC, respectively. Moreover, the decrease in ST of SCBA concrete is 7.9 and 23.8% for 30BC and 40BC, respectively. For the case of FS, the maximum strength is achieved by 10BC concrete. When compared to CM, the reduction in FS for 20BC, 30BC and 40BC is 15.5, 28.8 and 42.5%, respectively. The decrease in ST and FS for 30% and 40% replacement level maybe due to less formation of CSH gel and calcium aluminate. The maximum strength gain by 10BC may be due to the microfibrous nature of SCBA which is related to secondary CSH formation. In addition, the formation of aluminates take place which interlocks between hydrated pastes and directly contributed to ST and FS [84,85]. In a nutshell, the improved properties of SCBA concrete may be due to the formation of more hydrated products, improved interfacial transition zone, and filling effect [84,86,87].
4.2. Modeling Results of SCBA Concrete
4.2.1. Formulation of Compressive Strength (CS)
The output of MEP model (based on five input variables) for compressive strength (CS) is given in Figure 6 for models training, testing and validation phase. The modeling results were decoded to get the empirical expressions for the prediction of the CS. The developed equation is shown Equation (8) and can be used to predict the 28 days CS. Figure 6 graphically demonstrates the comparison of model predicted and actual CS for training, testing, and validation. The expressions for regression line are also shown in the graph. It is known that the slope of the line should be nearly equal to 1 for an ideal situation. It can be deduced that the model took the effect of the inputs and retains a strong relationship as obvious from the slope, i.e., 0.8951, 0.9315, and 0.9014 for training, testing, and validation, respectively. The statistical indicators for CS model are shown in Table 6. The value of indicator, i.e., R, is 0.91 and 0.94 during training and testing, respectively. The RMSE and MAE are considerably low which highlighted the high accuracy of the model. From statistical analysis, it can be also inferred that the model retains a high generalized relationship.
where
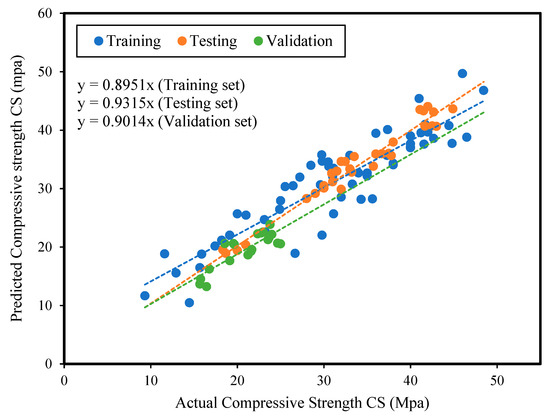
Figure 6.
Comparison of actual and predicted compressive strength (CS) using MEP.
Table 6.
Statistical indicators for the training, testing, and validation dataset.
4.2.2. Formulation of Splitting Tensile Strength (ST)
The splitting tensile strength (ST) of SCBA concrete at 28 days curing age can be predicted using Equation (9). A comparative assessment graph between MEP prediction and actual ST is presented in Figure 7. An excellent correlation exists among experimental and predicted data to estimate ST. The respective slope of the regression line is close to the ideal fit, i.e., 0.9351, 0.8903, and 0.9273 for training, testing, and validation, respectively. The model for ST performs exceptionally well on the training dataset. Table 6 shows the performance measures of the developed MEP model for ST. The NSE and R values for ST model are above 0.9 for model training as well as testing. The minimum and maximum value of RRMSE is 0.09 and 0.10, respectively. The performance index (ρ) is nearly equal to zero for ST model, hence revealing that the issue of over-fitting by the model has also been reduced to a large extent. It has been reported in the literature [88] that the performance of a model depends on the number of data points incorporated in the modeling process. In this study, 110 ST data points have been selected to model the tensile strength. Therefore, an accurate model with minimum error has been achieved.
where
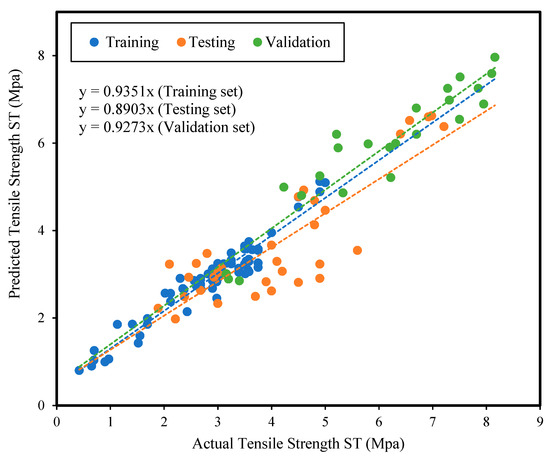
Figure 7.
Comparison of actual and predicted splitting tensile strength (ST) using MEP.
4.2.3. Formulation of Flexural Strength (FS)
The MEP modeling output for flexural strength (FS) is graphically presented in Figure 8. The slopes of the regression line are observed to be 0.9494, 0.9026, and 0.9332 for training, testing and validation data, respectively. FS can also be predicted using Equation (10) derived by MEP. Comparing with the models for compressive and tensile strength, an excellent estimate is observed between experimental and MEP model predicted data for FS as illustrated in Figure 8. The MEP model for FS also performs exceptionally well as illustrated in Table 6. The R values for FS model are above 0.85 during both training and testing. Minimum and maximum MAE values for FS model are 1.87 and 2.87, respectively. Moreover, the RMSE values are also less than 4 MPa, highlighting the accurate prediction capacity of the developed model.
where
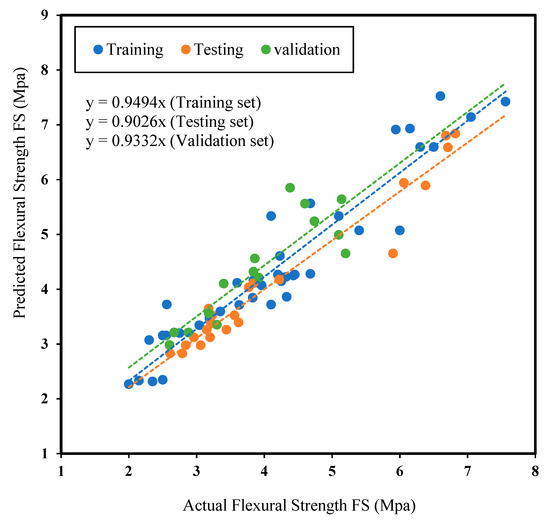
Figure 8.
Comparison of actual and predicted flexural strength (FS) using MEP.
4.3. Models Error Assessment
To infer the absolute error between the model predicted and actual data, the data points are plotted in Figure 9 showing the absolute error. The mean absolute error for CS, ST, and FS are 2.87 MPa, 0.405 MPa, and 0.675 MPa, respectively. The minimum and maximum absolute errors are 0.1 MPa and 7.76 MPa for CS model, 0.08 MPa and 2.15 MPa for ST model, and 0.075 MPa and 1.95 MPa for FS model, respectively. Moreover, almost 80% of the data have an absolute error below 3 MPa, 0.5 MPa, and 0.6 MPa, for CS, ST, and FS models, respectively.
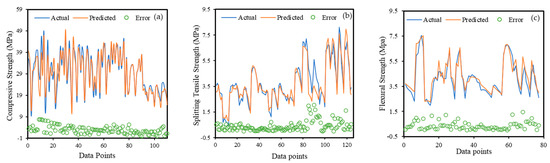
Figure 9.
Description of the absolute error among model predicted and actual data for (a) CS (b) ST (c) FS.
4.4. Model Cross-Validation Results
The results of cross-validation are graphically shown in Figure 10, Figure 11 and Figure 12, for CS, ST and FS models, respectively, using R and RMSE as assessment criteria. A variation in results can be observed at the individual level, however, the validation results demonstrated good mean accuracy. The average R-value obtained for CS, ST and FS models are 0.85, 0.89, and 0.85, respectively. In the entire 10-fold cross-validation process, the maximum and minimum R value of 0.72 and 0.91, respectively, were achieved by ST model. Similarly, the mean RMSE values of 4.54, 3.89, and 4.78 were accomplished by CS, ST, and FS, respectively. For the individual subset, the lowest RMSE, i.e., 1.86 was attained by ST. Overall, the results from 10-fold cross-validation show the accurate performance, generalized capability, and robustness of the MEP models.
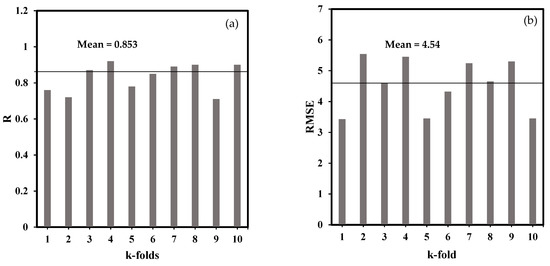
Figure 10.
Cross-validation results for CS model based on (a) R (b) RMSE.
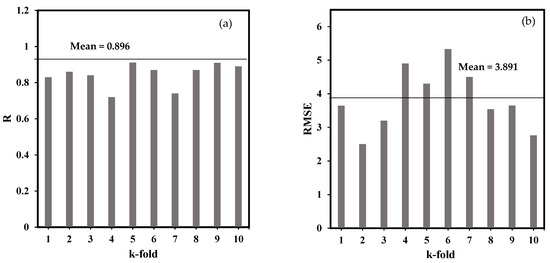
Figure 11.
Cross-validation results for ST model based on (a) R (b) RMSE.
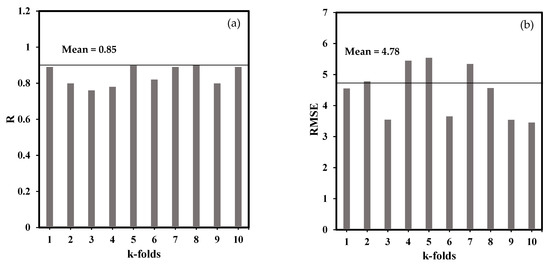
Figure 12.
Cross-validation results for FS model based on (a) R (b) RMSE.
4.5. Parametric Analysis
In machine learning-based modeling, it is essential to perform several checks and analyses to ensure that the models have considered the effect of all the physical phenomena and inputs. Parametric analysis has been recommended in literature studies to evaluate the robustness and accuracy of the final models. In the current study, the same method has been used by plotting the variation of the model output with a single input variable. The same procedure is applied to the individual input parameter. Figure 13 illustrates the parametric study results for the developed compressive strength (CS) model. The same patterns were observed for ST and FS as well. Therefore, parametric study results are discussed in detail for CS only in the below section.
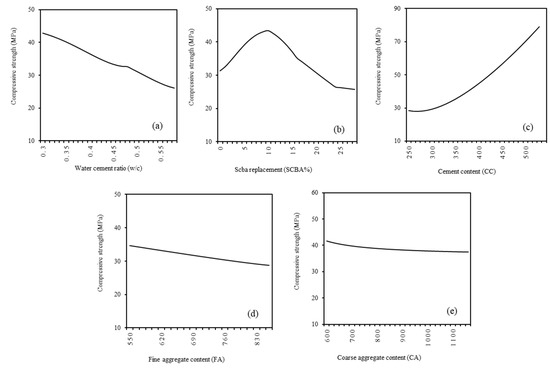
Figure 13.
Parametric analysis results for (a) w/c (b) SCBA% (c) CC (d) FA (e) CA.
An increase in w/c decreases the strength parameters of concrete [88,89]. It can be observed in Figure 13a that the increased w/c reduced the concrete strength. The decrease in CS with increased w/c may be attributed to the dilution of the cement matrix. Moreover, the available literature revealed that the properties of SCBA concrete depend on its oxide composition and SCBA replacement percentage [4]. Figure 13b shows that the compressive strength of SCBA concrete increases with an increase in SCBA replacement up to 10%. Afterward, the strength decreases for higher replacement level. Maximum compressive strength has been achieved at 10% SCBA replacement. The same results were obtained during experimental analysis of SCBA concrete where maximum strength gain was attained by 10BC. Therefore, the output of the parametric study is parallel with laboratory testing and same findings were reported in the literature [4,12,13].
Figure 13c shows the variation of compressive strength with increasing cement content. The increasing trend can be observed as the higher cement content produces more calcium silicate hydrate which forms a dense structure, thereby directly increasing the compressive strength. Figure 13d,e illustrate the variation of compressive strength with fine and coarse aggregate content, respectively. Both the figures demonstrate that CS decreases with an increase in FA and CA content. As the aggregates are inert materials and used as a filler in concrete production, when keeping all the parameters constant, the properties of concrete decrease with the increase in aggregate quantity.
5. Conclusions
The present study conducted experimental testing on sugarcane bagasse ash (SCBA)-incorporated sustainable concrete and adopted a machine learning technique to model the strength properties of SCBA concrete. The specific conclusions of this study are as follows.
- The SCBA showed good pozzolanic properties when processed, i.e., passed from sieve #200 and grinded up to cement fineness.
- Microfibrous structure and irregular shape particles were observed in the SEM images of processed SCBA.
- The concrete showed maximum strength when cement was replaced with 10% SCBA. Afterward, strength reduction was observed for higher replacement levels.
- The multi expression programming (MEP) was found to be very efficient in modeling the strength properties of SCBA concrete. The parametric study showed that the developed MEP models for SCBA concrete are accurate and revealed the effect of input parameters in the modeling output.
Moreover, the work presented in the current study has certain shortcomings. The key focus of this study was to examine the effect of concrete constituents on the mechanical properties of SCBA concrete. Indeed, other important factors also need to be investigated that are important to mechanical viewpoints such as curing conditions, type of cement, reactivity, type of ash, and testing conditions. It is recommended that further research should be conducted with an extensive dataset for model training and testing. Moreover, some deep learning techniques, i.e., convolutional neural network, neuro-fuzzy system, and ensemble modeling, should be considered for comparative analysis and assessment of concrete properties.
Author Contributions
Conceptualization, data analysis, writing original draft preparation, M.I.S.; Formal analysis and modeling, M.N.A.; supervision, review and editing, K.K.; investigation and review, M.S.K.N.; methodology, review and editing, F.A.; software, validation check and supervision, R.A.; validation check, supervision, M.F.J.; validation, controlling results, revisions, proofreading, A.M. All authors have read and agreed to the published version of the manuscript.
Funding
This research in part is supported by the Alexander von Humboldt Foundation.
Institutional Review Board Statement
Not applicable.
Informed Consent Statement
Not applicable.
Data Availability Statement
Not applicable.
Acknowledgments
Open access funding by the publication fund of the TU Dresden.
Conflicts of Interest
The authors declare no conflict of interest.
References
- Bahurudeen, A.; Marckson, A.V.; Kishore, A.; Santhanam, M. Development of Sugarcane Bagasse Ash Based Portland Pozzo-Lana Cement and Evaluation of Compatibility with Superplasticizers. Constr. Build. Mater. 2014, 68, 465–475. [Google Scholar] [CrossRef]
- He, Z.; Zhu, X.; Wang, J.; Mu, M.; Wang, Y. Comparison of CO2 Emissions from OPC and Recycled Cement Production. Constr. Build. Mater. 2019, 211, 965–973. [Google Scholar] [CrossRef]
- Mao, L.-X.; Hu, Z.; Xia, J.; Feng, G.-L.; Azim, I.; Yang, J.; Liu, Q.-F. Multi-Phase Modelling of Electrochemical Rehabilitation for ASR and Chloride Affected Concrete Composites. Compos. Struct. 2019, 207, 176–189. [Google Scholar] [CrossRef]
- Bahurudeen, A.; Kanraj, D.; Dev, V.G.; Santhanam, M. Performance Evaluation of Sugarcane Bagasse Ash Blended Cement in Concrete. Cem. Concr. Compos. 2015, 59, 77–88. [Google Scholar] [CrossRef]
- Iqbal, M.F.; Liu, Q.-F.; Azim, I.; Zhu, X.; Yang, J.; Javed, M.F.; Rauf, M. Prediction of Mechanical Properties of Green Concrete Incorporating Waste Foundry Sand Based on Gene Expression Programming. J. Hazard. Mater. 2020, 384, 121322. [Google Scholar] [CrossRef]
- Frontera, P.; Malara, A.; Mistretta, M. Recent Trends in Sustainability Assessment of “Green Concrete”. In Smart Innovation, Systems and Technologies; Bevilacqua, C., Calabrò, F., Della Spina, L., Eds.; New Metropolitan Perspectives: Reggio di Calabria, Italy, 2020; Volume 178, pp. 1402–14127. [Google Scholar]
- Bajare, D.; Būmanis, G.; Upeniece, L. Coal Combustion Bottom Ash as Microfiller with Pozzolanic Properties for Traditional Concrete. Procedia Eng. 2013, 57, 149–158. [Google Scholar] [CrossRef]
- Pippo, W.A.A.; Luengo, C. Sugarcane Energy Use: Accounting of Feedstock Energy Considering Current Agro-Industrial Trends and Their Feasibility. Int. J. Energy Environ. Eng. 2013, 4, 10. [Google Scholar] [CrossRef]
- Cordeiro, G.C.; Toledo Filho, R.D.; Fairbairn, E.M.; Tavares, L.M.; Oliveira, C.H. Influence of Mechanical Grinding on the Pozzolanic Activity of Residual Sugarcane Bagasse Ash. In Proceedings of the International RILEM Conference on the Use of Recycled Materials in Building and Structures, Barcelona, Spain, 8–11 November 2004; pp. 731–740. [Google Scholar]
- Pedersen, K.; Jensen, A.; Skjothrasmussen, M.; Damjohansen, K. A Review of the Interference of Carbon Containing Fly Ash with Air Entrainment in Concrete. Prog. Energy Combust. Sci. 2008, 34, 135–154. [Google Scholar] [CrossRef]
- Chusilp, N.; Jaturapitakkul, C.; Kiattikomol, K. Utilization of Bagasse Ash as a Pozzolanic Material in Concrete. Constr. Build. Mater. 2009, 23, 3352–3358. [Google Scholar] [CrossRef]
- Hasan, N.M.S.; Sobuz, H.R.; Tamanna, N.; Slah, M. Properties of Concrete by Using Bagasse Ash and Recycle Aggregate. Concr. Res. Lett. 2014, 5, 768–785. [Google Scholar]
- Jagadesh, P.; Ramachandramurthy, A.; Murugesan, R. Evaluation of mechanical properties of Sugar Cane Bagasse Ash con-crete. Constr. Build. Mater. 2018, 176, 608–617. [Google Scholar] [CrossRef]
- Bahurudeen, A.; Santhanam, M. Performance Evaluation of Sugarcane Bagasse Ash-Based Cement for Durable Concrete. In Proceedings of the 5th International Conference on the Durability of Concrete Structures, Purdue University, West Lafayette, IN, USA, 24–26 July 2014. [Google Scholar]
- Bahurudeen, A.; Wani, K.; Basit, M.A.; Santhanam, M. Assesment of Pozzolanic Performance of Sugarcane Bagasse Ash. J. Mater. Civ. Eng. 2016, 28, 04015095. [Google Scholar] [CrossRef]
- Rerkpiboon, A.; Tangchirapat, W.; Jaturapitakkul, C. Strength, Chloride Resistance, and Expansion of Concretes Containing Ground Bagasse Ash. Constr. Build. Mater. 2015, 101, 983–989. [Google Scholar] [CrossRef]
- Khan, M.I. Predicting properties of High Performance Concrete Containing Composite Cementitious Materials Using Artificial Neural Networks. Autom. Constr. 2012, 22, 516–524. [Google Scholar] [CrossRef]
- Dantas, A.T.A.; Leite, M.B.; Nagahama, K.D.J. Prediction of Compressive Strength of Concrete Containing Construction and Demolition Waste Using Artificial Neural Networks. Constr. Build. Mater. 2013, 38, 717–722. [Google Scholar] [CrossRef]
- Golafshani, E.M.; Behnood, A.; Arashpour, M. Predicting the Compressive Strength of Normal and High-Performance Concretes Using ANN and ANFIS Hybridized with Grey Wolf Optimizer. Constr. Build. Mater. 2020, 232, 117266. [Google Scholar] [CrossRef]
- Parichatprecha, R.; Nimityongskul, P. Analysis of Durability of High Performance Concrete Using Artificial Neural Networks. Constr. Build. Mater. 2009, 23, 910–917. [Google Scholar] [CrossRef]
- Farooq, F.; Nasir Amin, M.; Khan, K.; Rehan Sadiq, M.; Faisal Javed, M.; Aslam, F.; Alyousef, R. A Comparative Study of Random Forest and Genetic Engineering Programming for the Prediction of Compressive Strength of High Strength Concrete (HSC). Appl. Sci. 2020, 10, 7330. [Google Scholar] [CrossRef]
- Zhang, J.; Li, D.; Wang, Y. Toward Intelligent Construction: Prediction of Mechanical Properties of Manufactured-Sand Concrete Using Tree-Based Models. J. Clean. Prod. 2020, 258, 120665. [Google Scholar] [CrossRef]
- Sun, Y.; Li, G.; Zhang, J.; Qian, D. Prediction of the Strength of Rubberized Concrete by an Evolved Random Forest Model. Adv. Civ. Eng. 2019, 2019, 5198583. [Google Scholar] [CrossRef]
- Chou, J.-S.; Chiu, C.-K.; Farfoura, M.; Al-Taharwa, I. Optimizing the Prediction Accuracy of Concrete Compressive Strength Based on a Comparison of Data-Mining Techniques. J. Comput. Civ. Eng. 2011, 25, 242–253. [Google Scholar] [CrossRef]
- Deng, F.; He, Y.; Zhou, S.; Yu, Y.; Cheng, H.; Wu, X. Compressive Strength Prediction of Recycled Concrete Based on Deep Learning. Constr. Build. Mater. 2018, 175, 562–569. [Google Scholar] [CrossRef]
- Ashteyat, A.; Obaidat, Y.T.; Murad, Y.Z.; Haddad, R. Compressive Strength Prediction of Lightweight Short Columns at Elevated Temperature Using Gene Expression Programing and Artificial Neural Network. J. Civ. Eng. Manag. 2020, 26, 189–199. [Google Scholar] [CrossRef]
- Behnood, A.; Golafshani, E.M. Predicting the Compressive Strength of Silica Fume Concrete Using Hybrid Artificial Neural Network with Multi-Objective Grey Wolves. J. Clean. Prod. 2018, 202, 54–64. [Google Scholar] [CrossRef]
- Sadrmomtazi, A.; Sobhani, J.; Mirgozar, M. Modeling Compressive Strength of EPS Lightweight Concrete Using Regression, Neural Network And ANFIS. Constr. Build. Mater. 2013, 42, 205–216. [Google Scholar] [CrossRef]
- Öztaş, A.; Pala, M.; Özbay, E.; Kanca, E.; Çağlar, N.; Bhatti, M.A. Predicting the Compressive Strength and Slump of High Strength Concrete Using Neural Network. Constr. Build. Mater. 2006, 20, 769–775. [Google Scholar] [CrossRef]
- Nguyen, T.; Kashani, A.; Ngo, T.; Bordas, S. Deep Neural Network with High-Order Neuron for the Prediction of Foamed Concrete Strength. Comput. Civ. Infrastruct. Eng. 2019, 34, 316–332. [Google Scholar] [CrossRef]
- Getahun, M.A.; Shitote, S.M.; Gariy, Z.C.A. Artificial Neural Network Based Modelling Approach for Strength Prediction of Concrete Incorporating Agricultural and Construction Wastes. Constr. Build. Mater. 2018, 190, 517–525. [Google Scholar] [CrossRef]
- Javed, M.F.; Amin, M.N.; Shah, M.I.; Khan, K.; Iftikhar, B.; Farooq, F.; Aslam, F.; Alyousef, R.; Alabduljabbar, H. Applications of Gene Expression Programming and Regression Techniques for Estimating Compressive Strength of Bagasse Ash based Concrete. Crystals 2020, 10, 737. [Google Scholar] [CrossRef]
- Aslam, F.; Farooq, F.; Amin, M.N.; Khan, K.; Waheed, A.; Akbar, A.; Javed, M.F.; Alyousef, R.; Alabdulijabbar, H. Applications of Gene Expression Programming for Estimating Compressive Strength of High-Strength Concrete. Adv. Civ. Eng. 2020, 2020, 8850535. [Google Scholar] [CrossRef]
- Javed, M.F.; Farooq, F.; Memon, S.A.; Akbar, A.; Khan, M.A.; Aslam, F.; Alyousef, R.; Alabduljabbar, H.; Rehman, S.K.U. New Prediction Model for the Ultimate Axial Capacity of Concrete-Filled Steel Tubes: An Evolutionary Approach. Crystals 2020, 10, 741. [Google Scholar] [CrossRef]
- Oltean, M.; Grosan, C. A Comparison of Several Linear Genetic Programming Techniques. Complex Syst. 2003, 14, 285–314. [Google Scholar]
- Arabshahi, A.; Gharaei-Moghaddam, N.; Tavakkolizadeh, M. Development of Applicable Design Models for Concrete Columns Confined with Aramid Fiber Reinforced Polymer Using Multi-Expression Programming. Structures 2020, 23, 225–244. [Google Scholar] [CrossRef]
- Cramer, N.L. A Representation for the Adaptive Generation of Simple Sequential Programs. In Proceedings of the First International Conference on Genetic Algorithms, Carnegic-Mellon University Pittsburgh, Pittsburgh, PA, USA, 24–26 July 1985. [Google Scholar]
- Koza, J.R.; Koza, J.R. Genetic Programming: On the Programming of Computers by Means of Natural Selection; MIT Press: Cambridge, MA, USA, 1992. [Google Scholar]
- Holland, J.H. Adaptation in Natural and Artificial Systems. Adapt. Nat. Artif. Syst. 1992, 561. [Google Scholar] [CrossRef]
- Sarıdemir, M. Prediction of Compressive Strength of Concretes Containing Metakaolin and Silica Fume by Artificial Neural Networks. Adv. Eng. Softw. 2009, 40, 350–355. [Google Scholar] [CrossRef]
- Nazari, A.; Torgal, F.P. Modeling the Compressive Strength of Geopolymeric Binders by Gene Expression Programming-GEP. Expert Syst. Appl. 2013, 40, 5427–5438. [Google Scholar] [CrossRef]
- Ferreira, C. Gene Expression Programming: Mathematical Modeling by an Artificial Intelligence; Springer: Amsterdam, The Netherlands, 2006; p. 21. [Google Scholar]
- Oltean, M.; Dumitrescu, D. Multi Expression Programming. Technical Report; Babeş-Bolyai University: Cluj-Napoca, Romania, 2002. [Google Scholar]
- Gandomi, A.; Faramarzifar, A.; Rezaee, P.G.; Asghari, A.; Talatahari, S. New Design Equations for Elastic Modulus of Concrete Using Multi Expression Programming. J. Civ. Eng. Manag. 2015, 21, 761–774. [Google Scholar] [CrossRef]
- Oltean, M.; Groşan, C. Evolving Evolutionary Algorithms Using Multi Expression Programming. In Proceedings of the Constructive Side-Channel Analysis and Secure Design; Springer International Publishing: Amsterdam, The Netherlands, 2003; pp. 651–658. [Google Scholar]
- Sharifi, S.; Abrishami, S.; Gandomi, A.H. Consolidation Assessment Using Multi Expression Programming. Appl. Soft Comput. 2020, 86, 105842. [Google Scholar] [CrossRef]
- Mousavi, S.; Gandomi, A.; Alavi, A.; Vesalimahmood, M. Modeling of Compressive Strength of HPC Mixes Using a Combined Algorithm of Genetic Programming and Orthogonal Least Squares. Struct. Eng. Mech. 2010, 36, 225–241. [Google Scholar] [CrossRef]
- Zhang, Q.; Yang, B.; Wang, L.; Zhu, F. Predicting Cement Compressive Strength Using Double-Layer Multi-Expression Programming. In Proceedings of the Fourth International Conference on Computational and Information Sciences, Chongqing, China, 17–19 August 2012; pp. 94–97. [Google Scholar]
- Alavi, A.H.; Mollahasani, A.; Gandomi, A.H.; Bazaz, J.B. Formulation of Secant and Reloading Soil Deformation Moduli Using Multi Expression Programming. Eng. Comput. 2012, 29, 173–197. [Google Scholar] [CrossRef]
- Srinivasan, R.; Sathiya, K. Experimental Study on Bagasse Ash in Concrete. Int. J. Serv. Learn. Eng. Humanit. Eng. Soc. Entrep. 2010, 5, 60–66. [Google Scholar] [CrossRef]
- Patel, J.A.; Raijiwala, D. Experimental Study on Use of Sugar Cane Bagasse Ash in Concrete by Partially Replacement with Cement. Int. J. Innov. Res. Sci. Eng. Technol. 2015, 4, 2228–2232. [Google Scholar]
- Neeraja, D.; Jagan, S.; Kumar, S.; Mohan, P.G. Experimental Study on Strength Properties of Concrete by Partial Replacement of Cement with Sugarcane Bagasse Ash. Nat. Environ. Pollut. Technol. 2014, 13, 629. [Google Scholar]
- Ganesan, K.; Rajagopal, K.; Thangavel, K. Evaluation of Bagasse Ash as Supplementary Cementitious Material. Cem. Concr. Compos. 2007, 29, 515–524. [Google Scholar] [CrossRef]
- Subramani, T.; Prabhakaran, M. Experimental Study on Bagasse Ash in Concrete. Int. J. Appl. Innov. Eng. Manag. 2015, 4, 163–172. [Google Scholar]
- Rukzon, S.; Chindaprasirt, P. Utilization of Bagasse Ash in High-Strength Concrete. Mater. Des. 2012, 34, 45–50. [Google Scholar] [CrossRef]
- Cordeiro, G.C.; Toledo Filho, R.D.; Tavares, L.M.; Fairbairn, E.D.M.R. Ultrafine Grinding of Sugar Cane Bagasse Ash for Appli-Cation as Pozzolanic Admixture in Concrete. Cem. Concr. Res. 2009, 39, 110–115. [Google Scholar] [CrossRef]
- Kumar, T.S.; Balaji, K.; Rajasekhar, K. Assessment of Sorptivity and Water Absorption of Concrete with Partial Replacement of Cement by Sugarcane Bagasse Ash (SCBA) and Silica Fume. Int. J. Appl. Eng. Res. 2016, 11, 5747–5752. [Google Scholar]
- Amin, N.-U. Use of Bagasse Ash in Concrete and Its Impact on the Strength and Chloride Resistivity. J. Mater. Civ. Eng. 2011, 23, 717–720. [Google Scholar] [CrossRef]
- Hailu, B.; Dinku, A. Application of Sugarcane Bagasse Ash as a Partial Cement Replacement Material. Zede J. 2012, 29, 1–12. [Google Scholar]
- Mangi, S.A.; Jamaluddin, N.; Ibrahim, M.H.W.; Abdullah, A.H.; Awal, A.S.M.A.; Sohu, S.; Ali, N. Utilization of Sugarcane Bagasse Ash in Concrete as Partial Replacement of Cement. In Proceedings of the IOP Conference Series: Materials Science and Engineering; IOP Publishing: Bristol, UK, 2017; Volume 271, p. 012001. [Google Scholar]
- Dhengare, S.W.; Raut, S.P.; Bandwal, N.V.; Khangan, A. Investigation into Utilization of Sugarcane Bagasse Ash as Supple-Mentary Cementitious Material in Concrete. Int. J. 2015, 109. [Google Scholar]
- Hussein, A.A.E.; Shafiq, N.; Nuruddin, M.F.; Memon, F.A. Compressive Strength and Microstructure of Sugar Cane Bagasse Ash Concrete. Res. J. Appl. Sci. Eng. Technol. 2014, 7, 2569–2577. [Google Scholar] [CrossRef]
- Reddy, M.V.S.; Ashalatha, K.; Madhuri, M.; Sumalatha, P. Utilization of Sugarcane Bagasse Ash (SCBA) in Concrete by Partial Replacement of Cement. IOSR J. Mech. Civ. Eng. 2015, 12, 12–16. [Google Scholar]
- Ganesan, K.; Rajagopal, K.; Thangavel, K. Evaluation of Bagasse Ash as Corrosion Resisting Admixture for Carbon Steel in Concrete. Anti-Corros. Methods Mater. 2007, 54, 230–236. [Google Scholar] [CrossRef]
- Yashwanth, M.K.; GB, A.; Raghavendra, A.; Kumar, B.N. An Experimental Study on Alternative Cementitious Materials: Bagasse Ash as Partial Replacement for Cement in Structural Lightweight Concrete. Indian Concr. J. 2017, 91, 51–58. [Google Scholar]
- Shafiq, N.; Hussein, A.A.E.; Nuruddin, M.F.; Al Mattarneh, H. Effects of Sugarcane Bagasse Ash on the Properties of Concrete. In Proceedings of the Institution of Civil Engineers—Engineering Sustainability; Thomas Telford Ltd.: London, UK, 2018; Volume 171, pp. 123–132. [Google Scholar]
- Priya, K.L.; Ragupathy, R. Effect of Sugarcane Bagasse Ash on Strength Properties of Concrete. Int. J. Res. Eng. Technol. 2016, 5, 159–164. [Google Scholar]
- Praveenkumar, S.; Sankarasubramanian, G. Mechanical and Durability Properties of Bagasse Ash-Blended High-Performance Concrete. SN Appl. Sci. 2019, 1, 1664. [Google Scholar] [CrossRef]
- Xu, Q.; Ji, T.; Gao, S.-J.; Yang, Z.; Wu, N. Characteristics and Applications of Sugar Cane Bagasse Ash Waste in Cementitious Materials. Materials 2018, 12, 39. [Google Scholar] [CrossRef]
- Arenas-Piedrahita, J.; Montes-García, P.; Mendoza-Rangel, J.; Calvo, H.L.; Valdez-Tamez, P.; Martínez-Reyes, J. Mechanical and Durability Properties of Mortars Prepared with Untreated Sugarcane Bagasse Ash and Untreated Fly Ash. Constr. Build. Mater. 2016, 105, 69–81. [Google Scholar] [CrossRef]
- Cordeiro, G.; Filho, R.T.; Tavares, L.; Fairbairn, E. Experimental Characterization of Binary and Ternary Blended-Cement Concretes Containing Ultrafine Residual Rice Husk and Sugar Cane Bagasse Ashes. Constr. Build. Mater. 2012, 29, 641–646. [Google Scholar] [CrossRef]
- Siddique, R.; Singh, G. Utilization of Waste Foundry Sand (WFS) in Concrete Manufacturing. Resour. Conserv. Recycl. 2011, 55, 885–892. [Google Scholar] [CrossRef]
- Gandomi, A.H.; Roke, D.A. Assessment of Artificial Neural Network and Genetic Programming as Predictive Tools. Adv. Eng. Softw. 2015, 88, 63–72. [Google Scholar] [CrossRef]
- Raju, K.S.; Murty, M.R.; Rao, M.V.; Satapathy, S.C. Support Vector Machine with K-Fold Cross Validation Model for Software Fault Prediction. Int. J. Pure Appl. Math. 2018, 118, 321–334. [Google Scholar]
- Kohavi, R. A Study of Cross-Validation and Bootstrap for Accuracy Estimation and Model Selection; Ijcai: Montreal, QC, Canada, 1995. [Google Scholar]
- Azim, I.; Yang, J.; Javed, M.F.; Iqbal, M.F.; Mahmood, Z.; Wang, F.; Liu, Q.-F. Prediction Model for Compressive Arch Action Capacity of RC Frame Structures under Column Removal Scenario Using Gene Ex-pression Programming. Structures 2020, 25, 212–228. [Google Scholar] [CrossRef]
- Gandomi, A.H.; Alavi, A.H.; MirzaHosseini, M.R.; Nejad, F.M. Nonlinear Genetic-Based Models for Prediction of Flow Number of Asphalt Mixtures. J. Mater. Civ. Eng. 2011, 23, 248–263. [Google Scholar] [CrossRef]
- Despotovic, M.; Nedic, V.; Despotovic, D.; Cvetanovic, S. Evaluation of Empirical Models for Predicting Monthly Mean Hori-Zontal Diffuse Solar Radiation. Renew. Sustain. Energy Rev. 2016, 56, 246–260. [Google Scholar] [CrossRef]
- Cordeiro, G.; Filho, R.T.; Fairbairn, E. Effect of Calcination Temperature on the Pozzolanic Activity of Sugar Cane Bagasse Ash. Constr. Build. Mater. 2009, 23, 3301–3303. [Google Scholar] [CrossRef]
- Bumanis, G.; Vitola, L.; Stipniece, L.; Locs, J.; Korjakins, A.; Bajare, D. Evaluation of Industrial by-Products as Pozzolans: A Road Map for Use in Concrete Production. Case Stud. Constr. Mater. 2020, 13, e00424. [Google Scholar] [CrossRef]
- Agarwal, S. Pozzolanic Activity of Various Siliceous Materials. Cem. Concr. Res. 2006, 36, 1735–1739. [Google Scholar] [CrossRef]
- Bahurudeen, A.; Santhanam, M. Influence of Different Processing Methods on the Pozzolanic Performance of Sugarcane Bagasse Ash. Cem. Concr. Compos. 2015, 56, 32–45. [Google Scholar] [CrossRef]
- Akram, T.; Memon, S.A.; Obaid, H. Production of Low Cost Self Compacting Concrete Using Bagasse Ash. Constr. Build. Mater. 2009, 23, 703–712. [Google Scholar] [CrossRef]
- Jagadesh, P.; Ramachandramurthy, A.; Murugesan, R.; Sarayu, K. Micro-Analytical Studies on Sugar Cane Bagasse Ash. Sadhana 2015, 40, 1629–1638. [Google Scholar] [CrossRef]
- De Souza, L.M.S.; Fairbairn, E.D.M.R.; Filho, R.D.T.; Cordeiro, G.C. Influence of Initial CaO/SiO 2 Ratio on the Hydration of Rice Husk Ash-Ca(Oh) 2 and Sugar Cane Bagasse Ash-Ca(Oh) 2 Pastes. Química Nova 2014, 37, 1600–1605. [Google Scholar] [CrossRef]
- Cordeiro, G.; Filho, R.T.; Tavares, L.; Fairbairn, E. Pozzolanic Activity and Filler Effect of Sugar Cane Bagasse Ash in Portland Cement and Lime Mortars. Cem. Concr. Compos. 2008, 30, 410–418. [Google Scholar] [CrossRef]
- Macedo, P.C.; Pereira, A.M.; Akasaki, J.L.; Fioriti, C.F.; Payá, J.; Pinheiro, J.L. Performance of Mortars Produced with the Incorporation of Sugar Cane Bagasse Ash. Rev. Ing. Construcción 2014, 29, 187–199. [Google Scholar] [CrossRef]
- Gholampour, A.; Gandomi, A.H.; Ozbakkaloglu, T. New Formulations for Mechanical Properties of Recycled Aggregate Concrete Using Gene Expression Programming. Constr. Build. Mater. 2017, 130, 122–145. [Google Scholar] [CrossRef]
- Du, H. Properties of Ultra-lightweight Cement Composites with Nano-Silica. Constr. Build. Mater. 2019, 199, 696–704. [Google Scholar] [CrossRef]


Publisher’s Note: MDPI stays neutral with regard to jurisdictional claims in published maps and institutional affiliations. |
© 2021 by the authors. Licensee MDPI, Basel, Switzerland. This article is an open access article distributed under the terms and conditions of the Creative Commons Attribution (CC BY) license (http://creativecommons.org/licenses/by/4.0/).