Abstract
The processing of meat industry waste into meat-and-bone meal (MBM) provides the opportunity to use it as fertiliser in the cultivation of agricultural crops. This study was conducted in the years 2014–2017 at the Experimental Station in Tomaszkowo, Poland to assess MBM effects on yield and quality of maize cultivated for grain. An example of the effective use of nutrients contained in MBM applied at doses of 2.0 and 3.0 t ha is the cultivation of maize in 2016, which was affected by favourable weather conditions. The effect of the accumulation of MBM doses and, consequently, the provision of a greater amount of nutrients ensure sufficient amounts to obtain yields, greater than those provided by mineral fertilisation only. The macronutrient concentration in the maize grains following the application of MBM was similar to the composition of the grains of maize fertilised with mineral N, P and K fertilisers. With the MBM, micronutrients are introduced in amounts that are able to satisfy plants with these components, yet this study failed to demonstrate any effect of increased MBM doses on the concentration of the analysed elements in the maize grains.
1. Introduction
The use of organic waste in agriculture is an important economic, environmental and social factor. Waste, especially biomass, is a large reservoir of materials that can be recovered using various technologies and used for manufacturing different fertilisers [1]. Waste processed in a controlled manner into the form of animal meat-and-bone meals in rendering plants, for example, poses no hazard to the environment [2,3]. The increasing specialisation of agricultural farms and the related reduced production of natural fertilisers (manure) forces farmers to search for alternative sources of organic substances for the purpose of supplying nutrients [4]. This opportunity is provided by the use of unconventional organic fertilisers, which are the by-products of human activities, including animal meals [5,6].
Meat-and-bone meal (MBM) is a by-product of the rendering industry and is considered an excellent potential organic fertiliser due to the balanced availability of nutrients. Animal MBMs are rich in organic substance (50–80%), total nitrogen (67 g kg−1), phosphorus (40 g kg−1) and calcium (19 g kg−1) [7] and poor in potassium (4 g kg−1), magnesium (2 g kg−1), copper (10 mg kg−1), iron (510 mg kg−1), manganese (3 mg kg−1) and zinc (100 mg kg−1) [8]. The rather high variability of the chemical composition results, inter alia, from the waste processing and storage technologies applied in rendering plants and from the starting material, i.e., the animal species [9].
When using MBM in plant production, one notes that the nutrients in MBM are found in a biological form [10]. Since mineralisation proceeds gradually, the effect of these fertilisers is long term, so that they have a beneficial effect on plants with a long growth and development period, e.g., maize, yet their effect is noticeable only in the years following their application [11].
The beneficial effect of organic fertilisers results, inter alia, from increasing the soil fertility. Nitrogen provided to crops in the form of MBM is already available in the first year and is able to meet 80% of cereal fertilisation needs for this element [12]. However, according to Wołoszyk et al. [13], the total use of nitrogen from organic fertilisers by plants in the first rotation link ranged, on average, from 25.5 to 27.3%, and the consequent effect of organic fertilisation is largely determined by the weather.
Animal MBM can be an efficient plant fertiliser that may replace inorganic fertilisers in providing plant nutrients [5]. High fertilisation value and the use of MBM in the fertilisation of crops were confirmed by the results of field experiments mainly conducted in Europe [5,8,14]. Scientific knowledge of the efficiency of nutrient use from MBM by maize (Zea mays L.) is incomplete. Maize is a crop with a long growing season that enables the full use of organic fertilisers.
The study aimed to assess the effect of meat-and-bone meal (MBM) and its consequent effect on the yield and quality of maize cultivated for grain.
2. Materials and Methods
2.1. Site and Experimental Set-Up
The study results originate from a controlled, static field experiment established in a random block system in four replications. The experiment using MBM was conducted in the years 2014–2017 at the Experimental Station in Tomaszkowo (53°71′ N, 20°43′ E), Poland. The study involving the annual use of MBM was carried out in a four-year continuous maize cultivation. The area of sowing plots was 15.0 m2, and the harvesting plots covered 11.25 m2. The sowing, cultivation measures and the crop harvest were conducted in accordance with the agrotechnical requirements specific to maize. Weeds were controlled using the herbicide Lumax 537.5 SE at a dose of 4.0 L ha−1 (terbuthylazine 187.5 g L; mesotrione 37.5 g L; metolachlor 312.5 g L). To control pests, seed dressing Mesurol 500 FS at a dose of 1 L per 100 kg grains (methiocarb 500 g L) was used. Since the harmfulness thresholds have not been exceeded, no disease control was conducted.
The top genetic levels in the field under study exhibit the granulometric composition of loamy sand, while the illuvial horizons have a prismatic structure of light loams. The soil was classified as the IIIa class (good arable land). Chemical analyses of the soil at the beginning of the study (2014) were conducted by methods generally accepted for this type of analyses in a certified laboratory of the Chemical and Agricultural Station. The pH was determined potentiometrically in a mixture of soil and 1 M KCl solution (1:5). On all plots, the soil was characterised by a pH of 4.9, an average organic carbon concentration of 10.0 g kg−1 and a concentration of N of 1.00 g kg−1, P of 68.0, K of 128, Mg of 78.0, Cu of 2.39, Fe of 1180, Zn of 6.0 and Mn of 143 (mg kg−1).
2.2. Meat-and-Bone Meal (MBM)
Animal MBM were applied before sowing at doses of 1.0, 2.0 and 3.0 t∙ha−1 each year. The experimental scheme and the doses of nutrients introduced with MBM are presented in Table 1. For comparison purposes, plots without fertilisation and with mineral fertilisers (NPK) were introduced. Animal MBM contained small amounts of potassium, which is why it was classified as a nitrogen–phosphorus fertilizer. The MBM used in the study was in the form of powder and classified as category 3, which comprises animal by products derived from manufacture of products intended for human consumption, and it was purchased from the Animal By-Products Disposal Plant SARIA, Poland. Animal MBM contained on average 90% dry matter; 66.9 g C; 61.0 g N; 31.3 g P; 4.0 g K; 48.5 g Ca; 3.0 Mg (g kg−1 in dry matter); 8.0 Cu, 1189 Fe; 86.5 Zn; 29.0 Mn (mg kg−1 in dry matter). Along with MBM, potassium in the form of a 49.8% potassium salt was applied to even out the dose to 83.1 kg K ha−1 (like the one applied on the plot fertilised with mineral fertilisers).

Table 1.
Field experiment scheme. The amount of micro and macronutrients introduced into soil with fertilizers (average in kg ha−1 of 2014–2017). * MBM—meat-and-bone meal. ** Kmin.—K mineral.
2.3. Grain Yield and Analysis of Elements in Grain
When harvesting maize two outer rows were discarded. Colb was collected by hand and then harvested used a maize combine (Wintersteiger Classic 1540, Austria). The moisture of the grain was measured, and then, the maize grain yields were determined at a humidity of 15%. Grain samples, ground using a laboratory mill (GM 300, Retsch, Germany), were mineralised in H2SO4 with the addition of H2O2 as an oxidising agent to determine macronutrients. Phosphorus concentration was determined by the colorimetric method with vanadium–molybdenium as complexing (UV-1600), Ca and K by atomic emission spectrometry (AES) (Jenway LTD PFP 7, UK) and Mg by AAS. The micronutrient (Cu, Fe, Zn, Mn) concentration in the grains were determined by the flame atomic absorption spectroscopy method using an iCE 3000 SERIES-THERMO atomic absorption spectrometer (Thermo-Scientific, Hemel Hempstead, Hertfordshire, UK) following previous mineralisation in a mixture of acids (65% HNO3 and 70% HClO4) in a 4:1 volumetric ratio.
In grain samples weighing 1.0 kg, protein, fat and starch concentrations were determined using a NIR System Infratec 1241 Analyzer apparatus (Foss, Hillerod, Denmark).
2.4. Statistical Analyses
Data for grain yield and grain protein, fat, starch and nutrient concentrations were analysed statistically using Statistica v.13.1 software. The differences between fertilisation methods were determined using a one-way analysis of variance (ANOVA) and Tukey’s test was applied to identify the homogeneous groups. The calculations were performed at the significance level α = 0.05 [15]. The dependent variables were corn yield, protein, starch and micro and macro components and, as a qualitative factor, the year of cultivation in particular groups of fertilizer variants used or fertilizer doses used in individual years of maize cultivation.
The analyses concerning the concentrations of selected micro- and macronutrients in maize grain were supplemented by determination of correlations between the aforementioned factors. To achieve this goal, the factor analysis method (PCA) was employed, which enabled the determination of correlation strength and direction between measurement variables [16]. The after-effect was determined as the difference between: (a) the first (2014) and the second (2015), the third (2016) and the fourth (2017) years of cultivation, (b) the second (2015) and the third (2016) and the fourth (2017) the cultivation years, (c) the third (2016) and fourth (2017) cultivation years.
3. Results
3.1. Plant Growth and Weather Conditions
The warmest growing season occurred in 2014 (an average of 13.7 °C); the temperature was higher by 0.7 °C than in the years 1981–2010. This was determined by higher temperatures during the growing season, with the exception of June and August (Figure 1). The growing season that was most similar to that in the years 1981–2010 in terms of the temperature was the year 2015, with the same average and a similar distribution of temperatures in the months of the study. In Poland, the maize yields are determined to a greater extent by the amount and distribution of precipitation in the growing season than by the thermal conditions [17]. The growing seasons in the years 2014–2017 varied in terms of precipitation both in relation to the multi-annual average, and between one another (Figure 2). The most humid (147% of the multi-annual norm) was the growing season in 2017, while the driest (approx. 70% of the multi-annual norm) occurred in 2014 and 2015. The highest demand of maize for water occurs during the period from stem elongation-scale BBCH-scale 30 to the flowering BBCH-scale 69 (BBCH scale -Biologische Bundesanstalt, Bundessortenamt und Chemical Industry, Germany) [18], which takes place from the beginning of June to mid-August [19]. The best period to meet water demand was during the rainfalls that occurred in June and July 2016 (a total of 200 mm) and in 2017 (a total of 182 mm). However, in the plants experience droughty conditions in the initial growth period (germination BBCH 01-09, the leaf growth BBCH 10-14), the high levels of precipitation occurring in the later period (which took place in 2017) are not able to compensate for that.
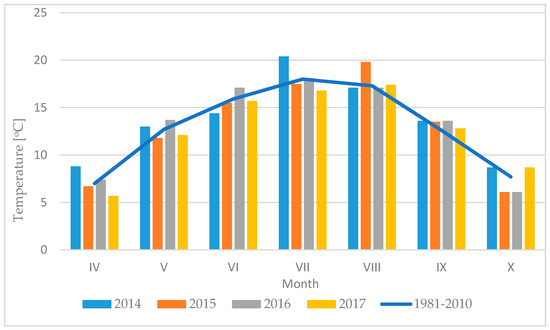
Figure 1.
Monthly air temperature in 2014–2017 season. Meteorological data against the years 1981–2010.
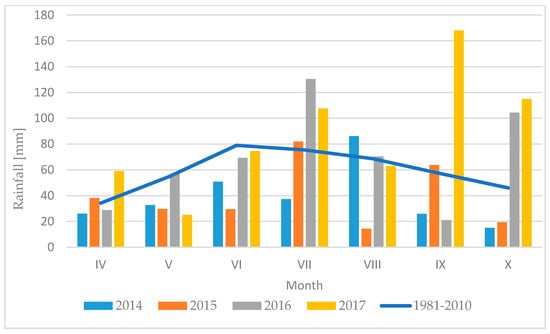
Figure 2.
Monthly rainfall in 2014–2017 season. Meteorological data against the years 1981–2010.
In August 2015, high temperature combined with low precipitation levels aggravated the drought phenomenon, which was intensified by water shortages occurring in the period of the initial growth of maize (May and June). After the end of flowering and the cob setting, the demand for water decreases gradually. However, drought during this period accelerated the ripening, while restricting the transpiration and grain filling.
3.2. Yield of Grain, Concentration of Protein and Starch
The effect of year on the maize grain yield was demonstrated (Table 2). Irrespective of the experimental factors, the maize grain yield ranged from 2.95 to 8.34 t·ha−1. The lowest grain yield was obtained in 2015 (an average of 4.28 t ha−1), while the highest was obtained in 2016 (an average of 6.61 t ha−1). The consequent effect of higher MBM doses (2.0 and 3.0 t ha−1) contributed to a higher grain efficiency (Figure 3) than their direct effect (Table 2). In the first year of the study, comparable grain yields were obtained on non-fertilised plots and following the application of MBM at doses of 2.0 and 3.0 t ha−1. The effect of the accumulation of the minerals contained in MBM at doses of 2.0 and 3.0 t ha−1 manifested itself with an increase in the yields up to the fourth year of their application; however, no increase in the yields was noted between the third and the fourth year. No statistically significant differences in the yields were demonstrated between the NPK mineral fertilisation and fertilisation with MBM in an amount of 2.0 and 3.0 t ha−1 (which may indicate a balance of minerals in these variants).
Table 2.
Yield of grain of maize, t ha−1. * MBM—meat-and-bone meal.
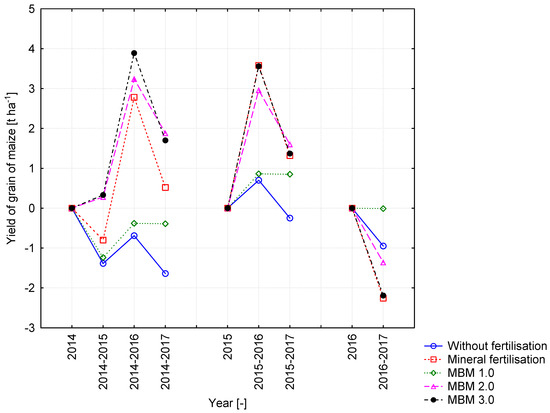
Figure 3.
Consequent effect of fertilization on yield of grain of maize, t ha−1.
Irrespective of the weather conditions prevailing in the years of the study and the consequent effects, mineral fertilisation (NPK) and the fertilisation with MBM in an amount ranging from 1.0 to 3.0 t ha−1 contributed to an increase in the protein concentration (Table 3, Figure 4). In the years of study, 2015–2017, a decrease in protein concentration and an increase in starch concentration (Table 4, Figure 5) were noted on all plots, as compared to the first year of cultivation. In 2016, following the application of 2.0 and 3.0 t ha−1 of MBM, the highest grain yields were obtained, as well as low protein concentrations and a high starch concentration in the maize grain, as compared to other years. Irrespective of the year of the study, following the application of MBM at a dose of 3.0 t ha−1, higher protein concentrations were observed than those in the other fertilisation variants (with the exception of a similar concentration obtained following the NPK fertilisation in 2016.
Table 3.
Concentration of protein in grain of maize, %. * MBM—meat-and-bone meal.
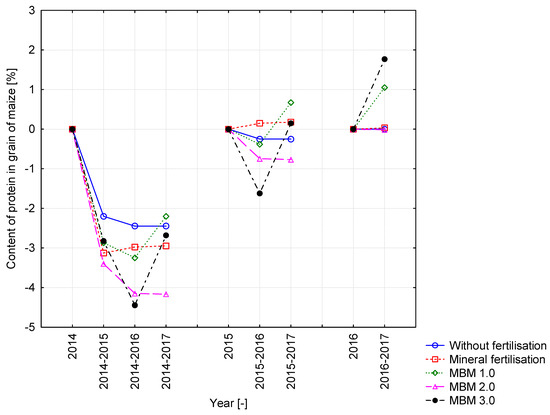
Figure 4.
Consequent effect of fertilization on concentration of protein of maize, %.
Table 4.
Concentration of starch in grain of maize, %. * MB—meat-and-bone meal.
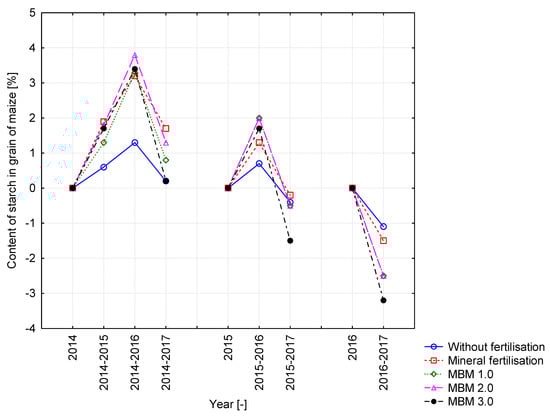
Figure 5.
Consequent effect of fertilization on concentration of starch in grain of maize, %.
3.3. Mineral Composition Of grain
In the third year of the study (2016), an increase was demonstrated in the p concentration in the maize grains in all experimental variants, in relation to 2015, by an average of 33% (Table 5, Figure 6). The application of 1.0 t ha−1 MBM in 2016 and 2017 increased the p concentration in relation to the first and second year of the study. The applied MBM had no effect on the K or Mg concentrations in the maize grains (Table 6 and Table 7, Figure 7 and Figure 8).
Table 5.
Concentration of P in grain of maize, g kg−1. * MBM—meat-and-bone meal.
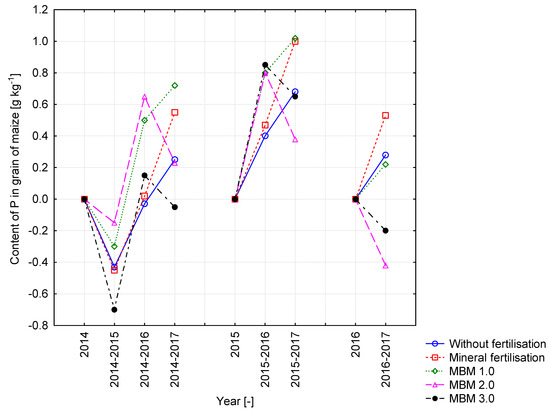
Figure 6.
Consequent effect of fertilization on concentration of P in grain of maize, g kg−1.
Table 6.
Concentration of K in grain of maize, g kg−1. * MBM—meat-and-bone meal.
Table 7.
Concentration of Mg in grain of maize, g kg−1. * For explanation see Table 1.
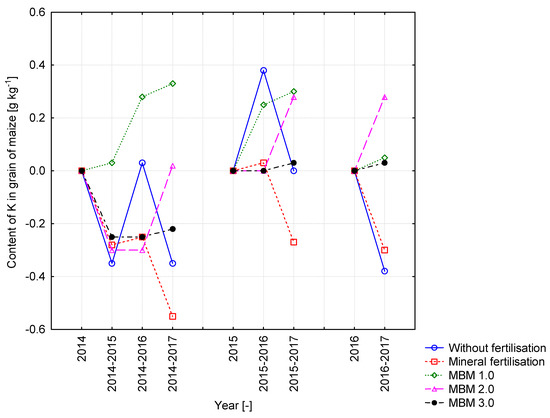
Figure 7.
Consequent effect of fertilization on concentration of K in grain of maize, g kg−1.
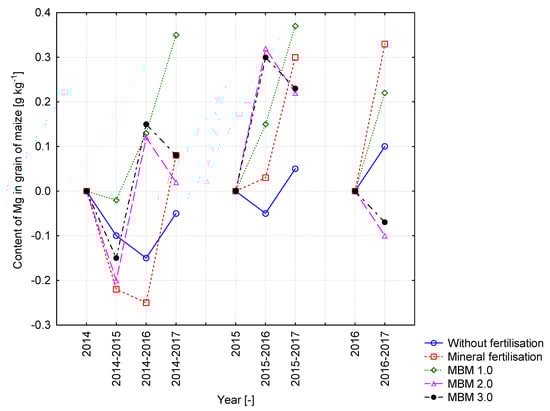
Figure 8.
Consequent effect of fertilization on concentration of Mg in grain of maize, g kg−1.
In the years of the study, no identical impact of fertilisation variants on the Ca concentration in the grains was demonstrated (Table 8, Figure 9). The greatest decrease in the Ca concentration in the grains was found following the application of 2.0 t ha−1 MBM in 2017, in relation to the first year. The lowest Ca concentration was demonstrated in the maize grains obtained in the 3rd year of the study as a result of the application of 3.0 t MBM.
Table 8.
Concentration of Ca in grain of maize, g kg−1. * MBM—meat-and-bone meal.
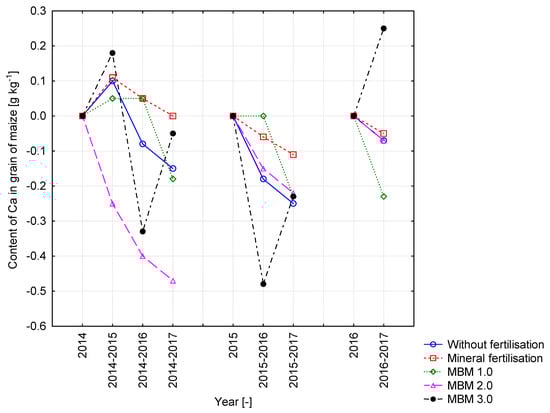
Figure 9.
Consequent effect of fertilization on concentration of Ca in grain of maize, g kg−1.
No significant differences were detected in the Cu concentration between fertilisation variants. The differences due to the application of MBM (in 2016 and 2017, of 1.0 t ha−1), in relation to other variants of the experiment (Table 9, Figure 10) were the only exception. In 2017, as a result of the application of an MBM dose of 1.0 t ha−1 and the accumulation of its subsequent use from the previous years, the Cu concentration in the maize grains increased by 37.5%.
Table 9.
Concentration of Cu in grain of maize, mg kg−1. * MBM—meat-and-bone meal.
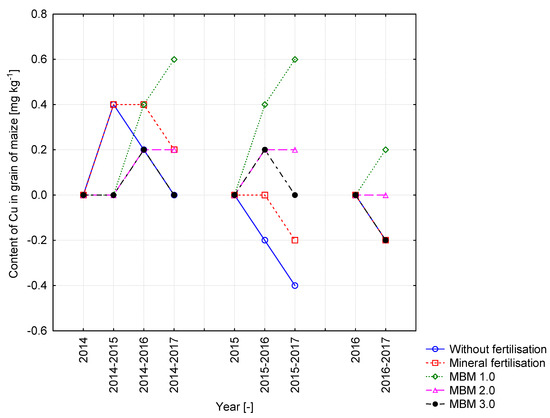
Figure 10.
Consequent effect of fertilization on concentration of Cu in grain of maize, mg kg−1.
No fertilisation on the control plot reduced the Fe concentrations in the maize grains in the final two years of the study (Table 10, Table 11 and Table 12; Figure 11, Figure 12 and Figure 13). The application of MBM at doses of 1.0 and 3.0 t ha−1 resulted in the greatest Fe accumulation in the fourth year of application in relation to the previous years. The application of MBM resulted in a decrease in the Zn concentration in the maize grains from the second year of cultivation, as compared to 2014. The exception was the slight increase in the Zn concentration in the grains of maize cultivated in the fourth year following the application of 1.0 t ha−1 MBM.
Table 10.
Concentration of Fe in grain of maize, mg kg−1. * MBM—meat-and-bone meal.
Table 11.
Concentration of Zn in grain of maize, mg kg−1. * MBM—meat-and-bone meal.
Table 12.
Concentration of Mn in grain of maize, mg kg−1. * MBM—meat-and-bone meal.
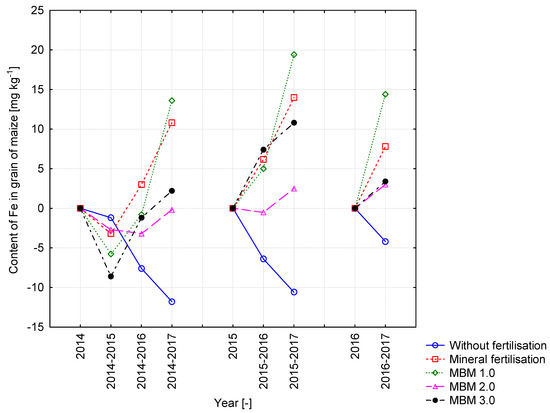
Figure 11.
Consequent effect of fertilization on concentration of Fe in grain of maize, mg kg−1.
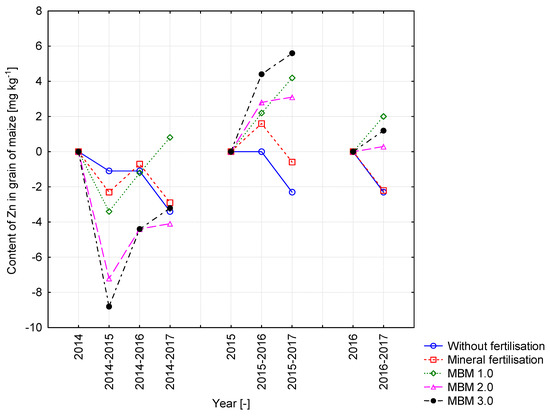
Figure 12.
Consequent effect of fertilization on concentration of Zn in grain of maize, mg kg−1.
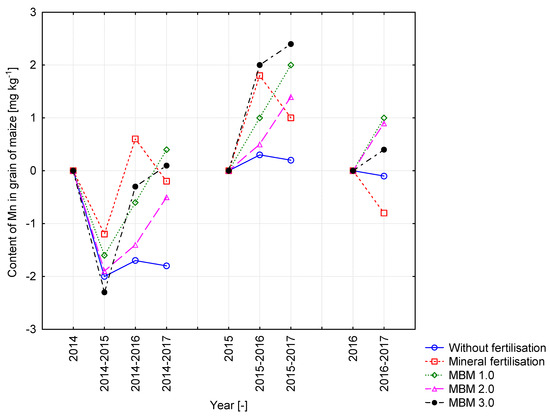
Figure 13.
Consequent effect of fertilization on concentration of Mn in grain of maize, mg kg−1.
From the second year of the application of MBM at doses of 2.0 and 3.0 t ha−1, lower Zn concentrations in the grains in relation to the MBM dose of 1.0 t were demonstrated. In the fourth year of the application of MBM (1.0, 2.0 and 3.0 t ha−1), higher Zn concentrations in relation to the control variant (with no fertilisation and NPK) were noted.
In 2017, as a result of the application of all MBM doses, higher Mn concentrations in relation to the control variant (with no fertilisation and NPK) were found. The application of 3.0 t ha−1 MBM in 2014, 2016 and 2017 increased the Mn concentration in relation to the other variants fertilised with MBM. Following the application of BM (1.0, 2.0 and 3.0 t ha−1) in the 2nd and 3rd year, a reduction was noted in the concentration of this element in relation to the first year of the study.
3.4. Correlation between the Factors
The analyses concerning the yielding, the grain quality and the weather conditions were supplemented by the determination of correlations between the aforementioned factors (Figure 14). The first main component carries 38.78% of information contained in the analysed variables. The second variable explains 29.44% of the data variability. In total, 67.81% of the total variance of the original variables. Based on the conducted PCA analysis, a strong correlation was demonstrated between the air temperature and the protein concentration in the maize grains. The amount of precipitation was correlated with the grain yield and the Cu, P and Mg concentrations in the grains. The maize grain yield was most strongly correlated with the Cu, P, Mg and starch concentrations, and the least correlated with the concentrations of Ca and protein in the maize grains. There is also a high correlation between the concentrations of the following components: Zn, Mn, Fe, Mg and P in the maize grains.
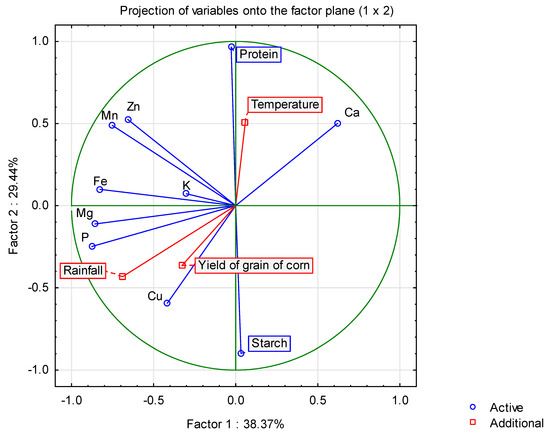
Figure 14.
Graph illustrating the correlation of micro and macro components in the yield of corn grain.
The location of the groups formed by various fertilization treatments in individual years (2014, 2015 and 2016) indicates the effect of weather conditions in maize cultivation on the concentrations of selected macro- and micronutrients, protein, starch and the grain yield (Figure 15). The application in 2017 of MBM in the amount of 3.0 t ha−1 resulted in the maize grain yield and its chemical composition becoming similar to the cultivations conducted in 2014 in all fertilisation variants.
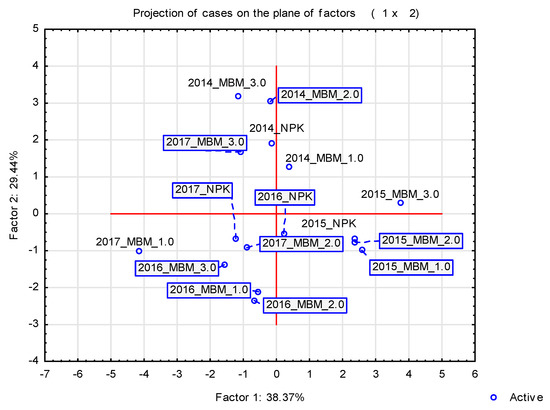
Figure 15.
Graph illustrating the variation in the use of annual fertiliser doses.
4. Discussion
Maize is currently the most productive and prospective cereal plant, which makes good use of nutrients from mineral and organic fertilisers [20,21]. The amount and quality of the harvested maize grain yield are largely determined by agrotechnical [22,23,24] and agroclimatic factors [25,26], with the availability of soil moisture and nitrogen at critical growth stages having relatively large effects [27,28].
The yield of maize grains, irrespective of the experimental factors, ranged from 2.95 to 8.34 t ha−1. The lowest grain yield was obtained in 2015 (an average of 4.28 t ha−1), while the highest was in 2016 (an average of 6.61 t ha−1).
Such low yields in 2015 were caused by water shortages in the period of the initial growth of maize (May and June) and high temperatures in August, which combined with low precipitation exacerbated the losses from initial growth period. Consequently, it led to reduced use of nutrients contained in the mineral fertilizer or MBM.
One of the possible ways to minimize the drought impact is to develop plant tolerance by effective management of plant nutrients [29]. The primary impact of drought on a crop is a reduction in yield as well as the quality of produce, which occurs due to decline in available macro- and micronutrients and associated microbial activities [30,31]. Maize cultivated in 2016 was exposed to favourable moisture and temperature conditions and MBM in doses of 2.0 and 3.0 t ha−1 enhanced the yield of grain as compared with the 1.0 t ha−1 MBM and no fertilisation treatments.
The provision of optimum conditions for nitrogen nutrition using exclusively organic fertilisers is complex because mineralisation enhanced the yield of grain as compared with the 1.0 t ha−1 MBM, and no fertilisation treatments coincide with the dynamics of nitrogen uptake by crops [32]. Therefore, when considering fertilisation with organic fertilisers, including MBM, not only the direct effect but also the consequent effect needs to be taken into account [4,8,33,34,35,36].
In the present study, the effect of 2.0 and 3.0 t ha−1 MBM treatments and, consequently, the accumulation of nutrient amounts ensure sufficient amounts to obtain high yields (2016 and 2017), which are even higher than those following the mineral fertilisation. However, according to Kivelä [37] and Kivalä et al. [38], the supply of nitrogen from MBM for production of sugar beet (Beta vulgaris L. subsp. vulgaris) is not sufficient to obtain the same yields as for mineral fertilisers. According to Kivalä [37], the efficiency of using nitrogen from MBM in the fertilization of sugar beet amounted to 83% compared to that obtained following fertilisation with mineral fertilisers.
Irrespective of the fertilisation, grains had the highest protein concentration and the lowest starch concentration in 2014, the first year of the study. The high temperature that occurred in July 2014 in the grain filling period, combined with available water as compared with other months and years, determined the greater accumulation of nitrogen in the grains. The relationships between the protein concentration in the grains and the temperature are confirmed by studies by Ashraf [39] and Tomás et al. [40].
In 2016, following the application of 2.0 and 3.0 t ha−1 of MBM, the highest grain yields were obtained, as well as low protein concentrations and an increase in the starch concentration in the maize grains, as compared to other years. The relationships between protein and starch can be affected by the interactions between nitrogen and phosphorus [41]. Moreover, the large supply of phosphorus contributes to an increase in the starch concentration at the expense of protein [42].
Following the application of MBM at a dose of 3.0 t ha−1, higher protein concentrations were demonstrated than in other fertilisation variants (with the exception of a similar concentration obtained after NPK fertilisation in 2016). The effect of fertilisation with high MBM doses on the greater accumulation of protein as compared to those fertilised with mineral fertilisers was confirmed by studies by Nogalska et al. [43], Stępień and Wojtkowiak [44]. According to Nogalska et al. [45], the results of study show that the maximum MBM dose (2.5 t ha−1 year−1) met the fertilizer requirements of maize with respect to nitrogen.
The maize grains, depending on the fertilisation variants, contained from 0.200 to 0.313 g P kg−1, from 0.400 to 0.463 g K kg−1, from 0.105 to 0.140 g Mg kg−1 and from 0.040 to 0.103 g Ca kg−1. The macronutrient concentration in the maize grains following the application of MBM was similar to the composition of grains fertilised with mineral fertilisers. Similar effects of the comparable action of MBM with mineral fertilisation on the macronutrient concentration in the maize grains were confirmed by Nogalska [43].
The P concentration in these organic sources is high, not all P is in soluble form and, thus, is not directly available for plants. Rock phosphates and MBM contain approximately 20–30% P as hydroxyl apatite, the bioavailability of which is low [46]. According to Chung and Jeong [47] the effectiveness of powdered bone meal as a phosphorus fertiliser is at least 90%.
The application of 1.0 t ha−1 MBM in 2016 and 2017 increased the P concentration in relation to the 1st and 2nd year of the study. Jeng et al. [33], Valenzuela et al. [48] and Nogalska et al. [49] claim that the MBM can be regarded as the main source of this component for plants cultivated in subsequent years, due to the low assimilability of phosphorus in the first growing season. The reason for the greater increase in the P concentration in subsequent years following the application of the lowest MBM dose, in relation to higher doses, may have been a lower supply of nitrogen with this meal dose, which failed to increase the yield and the dilution of phosphorus in the grains. In the third year (2016), an increase was demonstrated in the P concentration in the maize grains following the application of higher meal doses, in relation to the previous years. According to Ylivalnio et al. [10], in the first year following the application of MBM, only 20% of phosphorus is converted into assimilable forms, while after three years, it reaches 60%. On the other hand, according to Jenga et al. [33], as early as the first year of the introduction of meal, 50% of this component is available.
The potassium accumulation in plants is mostly determined by the weather conditions, the variety and the nitrogen and phosphorus supply [50,51,52]. The applied MBM with supplemented potassium in the form of a mineral fertiliser had no effect on the K and Mg concentrations in the maize grains.
Meat-and-bone meal [7] and bone meal [11] may be an alternative to natural, organic and mineral fertilisers as it is rich in calcium but in an amount that is not always sufficient to satisfy plants with this component. The total amount of calcium in MBM originates mainly from the bones, and approx. 99% of it occurs in the bound form as apatites [2], while the remaining 1% is directly available to plants in the form of (Ca2+) ions. In the years of the study, no significant differences in the Ca concentration between fertilisation variants or the identical effects of MBM in the accumulation of this element in the grains were demonstrated.
With the MBM, micronutrients are introduced in amounts that are able to satisfy plants with these components [8,38]; in the second year of the study (as compared to the first one), a lower micronutrient concentration in the grains was noted. An effect of this process could have been the drought that occurred in 2016, which did not promote the mineralisation of the meal in the soil or the availability of nutrients. Although the mineral concentration in the meal implies a good fertiliser value, the study failed to demonstrate a clearly defined effect of increased MBM doses on the concentration of the analysed element in the maize grains. Higher grain concentrations in subsequent years of the study were demonstrated following the application of a lower dose (1.0 t ha−1), which may be a result of lower nitrogen availability as a consequence of the lower grain yield and the oversupply of micronutrients [8].
When assessing MBM, the fact that the release of minerals is spread over years should be taken into account. The effect of the accumulation of higher MBM doses and, consequently, the accumulation of nutrient amounts ensure sufficient amounts to obtain high yields (even higher than those following mineral fertilisation). The nutrients contained in MBM are found in the biological form, while nutrients available for the plant are found only after mineralisation that takes place under optimal soil moisture conditions.
Author Contributions
Conceptualization, A.S.; methodology, A.S., K.W., E.K.; formal analysis, A.S., K.W.; statistical analyses, E.K.; writing—original draft, A.S., K.W., E.K.; writing—review and editing, A.S., K.W. All authors have read and agreed to the published version of the manuscript.
Funding
The results presented in this paper were obtained as part of a comprehensive study financed by the University of Warmia and Mazury in Olsztyn, Faculty of Agriculture and Forestry, Department of Agroecosystems and Horticulture (grant N° 30.610.015-110).
Institutional Review Board Statement
Not applicable.
Informed Consent Statement
Not applicable.
Data Availability Statement
Not applicable.
Conflicts of Interest
The authors declare no conflict of interest.
References
- Chojnacka, K.; Gorazda, K.; Witek-Krowiak, A.; Moustakas, K. Recovery of fertilizer nutrients from materials-Contradictions, mistakes and future trends. Renew. Sust. Energy Rev. 2019, 110, 485–498. [Google Scholar] [CrossRef]
- Möller, K. Assessment of Alternative Phosphorus Fertilizers for Organic Farming: Meat and Bone Meal. IMPROVE-P Factsheet. 2015, pp. 1–8. Available online: https://orgprints.org/29505/1/moeller2015-factsheet-Meat-and-bone-meal.pdf (accessed on 5 March 2021).
- Kowalski, Z.; Banach, M.; Makara, A. Optimisation of the co-combustion of meat–bone meal and sewage sludge in terms of the quality produced ashes used as substitute of phosphorites. Environ. Sci. Pollut. Res. 2021, 28, 8205–8214. [Google Scholar] [CrossRef] [PubMed]
- Chen, L.; Kivelä, J.; Helenius, J.; Kangas, A. Meat bone meal as fertiliser for barley and oat. Agric. Food Sci. 2011, 20, 235–244. [Google Scholar] [CrossRef]
- Jatana, B.S.; Kitchens, C.; Ray, C.; Tharayil, N. Regulating the nutrient release rates from proteinaceous agricultural byproducts using organic amendments and its effect on soil chemical and microbiological properties. Biol. Fertil. Soils 2020, 56, 747–758. [Google Scholar] [CrossRef]
- Mäkelä, P.S.A.; Wasonga, D.O.; Hernandez, A.S.; Santanen, A. Seedling growth and phosphorus uptake in response to dierent phosphorus sources. Agronomy 2020, 10, 1089. [Google Scholar] [CrossRef]
- Nogalska, A.; Załuszniewska, A. The effect of meat and bone meal applied without or with mineral nitrogen on macronutrient content and uptake by winter oilseed rape. J. Elem. 2020, 25, 905–915. [Google Scholar] [CrossRef]
- Stępień, A.; Wojtkowiak, K. Effect of meat and bone meal on the content of microelements in the soil and wheat grains and oilseed rape seeds. J. Elem. 2015, 20, 999–1010. [Google Scholar] [CrossRef]
- Kantorek, M.; Jesionek, K.; Polesek-Karczewska, S.; Ziόłkowski, P.; Stajnke, M.; Badur, J. Pilot installation for thermal utilization of meat-and-bone meal using the rotary kiln pyrolyzer and the fluidised bed boiler. In Proceedings of the E3S Web of Conferences, EDP Sciences, Bucharest, Romania, 26–29 May 2019; Volume 137, p. 01013. [Google Scholar]
- Ylivainio, K.; Uusitalo, R.; Turtola, E. Meat bone meal and fox manure as P sources for ryegrass (Lolium multiflorum) grown on a limed soil. Nutr. Cycl. Agroecosyst. 2008, 81, 267–278. [Google Scholar] [CrossRef]
- Balawejder, M.; Szostek, M.; Gorzelany, J.; Antos, P.; Witek, G.; Matłok, N. A study on the potential fertilization effects of microgranule fertilizer based on the protein and Calcined bones in maize cultivation. Sustainability 2020, 12, 1343. [Google Scholar] [CrossRef]
- Jeng, A.; Haraldsen, T.; Vagstad, N. Meat and bone meal as nitrogen fertilizer to cereals in Norway. Agric. Food Sci. 2004, 13, 268–275. [Google Scholar] [CrossRef]
- Wołoszyk, C.; Krzywy-Gawronska, E.; Iżewska, A. Yielding of plants and the use of nitrogen in two elements of plant rotation depending on different organic fertilization. Zesz. Probl. Post. Nauk Roln. 2011, 565, 393–403. (In Polish). Available online: http://zppnr.sggw.pl/565.pdf (accessed on 5 March 2021).
- Salomonsson, L.; Salomonsson, A.C.; Olofsson, S.; Jonsson, A. Effects of organic fertilizers and urea when applied to winter wheat. Acta Agric. Scand. Sect. B Plant Soil Sci. 1995, 45, 171–180. [Google Scholar] [CrossRef]
- Stanisz, A. Accessible Course in Statistics Based on the STATISTICA PL Software on Examples from Medicine. Tome 1. Basic Statistics; StatSoft Polska: Kraków, Poland, 2007. (In Polish) [Google Scholar]
- Wątroba, J. Statystyka i Data Mining w Badaniach Naukowych, Wyd; StatSoft Polska: Kraków, Poland, 2006. (In Polish) [Google Scholar]
- Ptaszyska, G.; Sulewska, H. Yield variation of maize hybrids with different growing period in climatic conditions of central Wielkopolska region. Acta Sci. Pol. Agric. 2008, 7, 93–103. (In Polish) [Google Scholar]
- Meier, U. (Ed.) Growth Stages of Mono- and Dicotyledonous Plants. BBCH Monograph; Julius Kühn-Institut (JKI): Quedlinburg, Germany, 2018. [Google Scholar] [CrossRef]
- Li, Y.; Tao, H.; Zhang, B.; Huang, S.; Wang, P. Timing of water deficit limits maize kernel setting in association with changes in the source-flow-sink relationship. Front. Plant Sci. 2018, 9, 1326. [Google Scholar] [CrossRef]
- Gao, C.; El-Sawah, A.M.; Ali, D.F.I.; Alhaj Hamoud, Y.; Shaghaleh, H.; Sheteiwy, M.S. The integration of bio and organic fertilizers improve plant growth, grain yield, quality and metabolism of hybrid maize (Zea mays L.). Agronomy 2020, 10, 319. [Google Scholar] [CrossRef]
- Kandil, E.E.; Abdelsalam, N.R.; Mansour, M.A.; Ali, H.M.; Siddiqui, M.H. Potentials of organic manure and potassium forms on maize (Zea mays L.) growth and production. Sci. Rep. 2020, 10, 8752. [Google Scholar] [CrossRef]
- Jagła, M.; Szulc, P.; Ambroży-Deręgowska, K.; Mejza, I.; Kobus-Cisowska, J. Yielding of two types of maize cultivars in relation to selected agrotechnical factors. Plant Soil Environ. 2019, 65, 416–423. [Google Scholar] [CrossRef]
- Széles, A.; Huzsvai, L. Modelling the effect of sowing date on the emergence, silking and yield of maize (Zea mays L.) in a moderately warm and dry production area. Agron. Res. 2020, 18, 579–594. [Google Scholar] [CrossRef]
- Szulc, P.; Wilczewska, W.; Ambroży-Deręgowska, K.; Mejza, I.; Szymanowska, D.; Kobus-Cisowska, J. Influence of the depth of nitrogen-phosphorus fertiliser placement in soil on maize yielding. Plant Soil Environ. 2020, 66, 14–21. [Google Scholar] [CrossRef]
- Gaile, Z.; Arhipova, I. Influence of meteorological factors on maize performance in Latvia. Proc. Latv. Acad. Sci. B 2015, 69, 68–76. [Google Scholar] [CrossRef]
- Ngoune Tandzi, L.; Mutengwa, C.S. Estimation of maize (Zea mays L.) yield per harvest area: Appropriate methods. Agronomy 2020, 10, 29. [Google Scholar] [CrossRef]
- Szczepaniak, W. Evaluating nitrogen use efficiency (NUE) indices on the background of mineral status of the seed crop at maturity: A case study of maize. Pol. J. Environ. Stud. 2016, 25, 2129–2138. [Google Scholar] [CrossRef]
- Marković, M.; Šoštarić, J.; Josipović, M.; Barač, Ž.; Brkić, A. Yield and yield components of maize (Zea mays L.) hybrids as affected by irrigation scheduling and meteorological conditions. Agric. Conspec. Sci. 2018, 83, 39–44. [Google Scholar]
- Sharma, S.B.; Gobi, T.A. Impact of drought on soil and microbial diversity in different agroecosystems of the semiarid zones. In Plant, Soil and Microbes; Volume 1: Implications in Crop Science; Hakeen, K.R., Akhtar, M.S., Abdullah, S.N.A., Eds.; Springer International Publishing: Cham, Switzerland, 2016; pp. 149–162. [Google Scholar]
- Kundel, D.; Bodenhausen, N.; Jørgensen, H.B.; Truu, J.; Birkhofer, K.; Hedlund, K.; Mäder, P.; Fliessbach, A. Effects of simulated drought on biological soil quality, microbial diversity and yields under long-term conventional and organic agriculture. FEMS Microbiol. Ecol. 2020, 96, 1–16. [Google Scholar] [CrossRef] [PubMed]
- Siebert, J.; Sünnemann, M.; Auge, H.; Berger, S.; Cesarz, S.; Ciobanu, M.; Guerrero-Ramírez, N.R.; Eisenhauer, N. The effects of drought and nutrient addition on soil organisms vary across taxonomic groups, but are constant across seasons. Sci. Rep. 2019, 9, 1–12. [Google Scholar] [CrossRef] [PubMed]
- Delin, S.; Engström, L. Timing of organic fertiliser application to synchronise nitrogen supply with crop demand. Acta Agric. Scand. Sect. B Plant Soil Sci. 2010, 60, 78–88. [Google Scholar] [CrossRef]
- Jeng, A.S.; Haraldsen, T.K.; Grønlund, A.; Pedersen, P.A. Meat and bone meal as nitrogen and phosphorus fertilizer to cereals and rye grass. Nutr. Cycl. Agroecosyst. 2006, 76, 183191. [Google Scholar]
- Chaves, C.; Canet, R.; Albiach, R.; Marin, J.; Pomares, F. Meat and bone meal: Fertilizing value and rates of nitrogen mineralization. Nutr. Carbon Cycl. Sustain. Plant Soil Syst. 2005, 1, 177–180. [Google Scholar]
- Venegas, F. Meat and bone meal as phosphorus source to production of maize (Zea mays L.). Ens. Cienc. Cienc. Biol. Agrar. Saude 2009, 23, 63–76. [Google Scholar]
- Sempiterno, C.; Fernandes, R.; Calouro, F. Meat and bone meal as nitrogen and phosphorus supplier to ryegrass (Lolium multiflorum L. var. Helen); I—Dry matter yield. N and P uptake and apparent N and P recovery. Treatment and use of organic resi-dues in Agrculture: Challenges and opportunitites towards sustainable management. In Proceedings of the 14th Ramiran International Conferece Lisbon, Lisboa, Portugal, 12−15 September 2010. [Google Scholar]
- Kivelä, J. Effects of meat bone meal as fertilizer on leaf nitrogen status in sugar beet and on soil nitrate concentrations. Acta Fytotech. Zootech. 2016, 18, 71–73. [Google Scholar] [CrossRef][Green Version]
- Kivela, J.; Chen, L.; Muurinen, S.; Kivijarvi, P.; Hintikainen, V.; Helenius, J. Effects of meat bone meal as fertilizer on yield and quality of sugar beet and carrot. Agric. Food Sci. 2015, 24, 68–83. [Google Scholar] [CrossRef]
- Ashraf, M. Stress-induced changes in wheat grain composition and quality. Crit. Rev. Food Sci. Nutr. 2014, 54, 1576–1583. [Google Scholar] [CrossRef]
- Tomás, D.; Viegas, W.; Silva, M. Effects of post-anthesis heat waves on the grain quality of seven European wheat varieties. Agronomy 2020, 10, 268. [Google Scholar] [CrossRef]
- Li, Z.; Zhang, R.; Xia, S.; Wang, L.; Liu, C.; Zhang, R.; Fan, Z.; Chen, F.; Liu, Y. Interactions between N, P and K fertilizers affect the environment and the yield and quality of satsumas. Glob. Ecol. Conserv. 2019, 19, e00663. [Google Scholar] [CrossRef]
- Zhang, R.; Li, C.; Fu, K.; Li, C.; Li, C. Phosphorus alters starch morphology and gene expression related to starch biosynthesis and degradation in wheat grain. Front. Plant Sci. 2018, 8, 2252. [Google Scholar] [CrossRef] [PubMed]
- Nogalska, A.; Skwierawska, M.; Nogalski, Z.; Kaszuba, M. The effect of increasing doses of meat and bone meal (MBM) applied every second year on maize grown for grain. Chil. J. Agric. Res. 2013, 73, 430–434. [Google Scholar] [CrossRef]
- Stępień, A.; Wojtkowiak, K. Composition of gluten protein in spring and winter wheat grain cultivated under conditions of varied fertilization. Acta Agric. Scand. Sect. B Plant Soil Sci. 2013, 63, 588–594. [Google Scholar] [CrossRef]
- Nogalska, A.; Czapla, J.; Nogalski, Z.; Skwierawska, M.; Kaszuba, M. The effect of increasing doses of meat and bone meal (MBM) on maize (Zea mays L.) grown for grain. Agric. Food Sci. 2012, 21, 325–331. [Google Scholar] [CrossRef][Green Version]
- Hable, M. Mycorrhizal fungi and plant nutrition. In Plant Nutrient Management in Hawaii’s Soils, Approaches for Tropical and Subtropical Agriculture; Silva, J.A., Uchida, R., Eds.; College of Tropical Agriculture and Human Resources, University of Hawaii at Manoa: Honolulu, HI, USA, 2000; pp. 127–132. [Google Scholar]
- Chung, J.B.; Jeong, B.R. Relative effectiveness of bone meal as a phosphorus fertilizer compared with fused phosphate. Korean J. Environ. Agric. 2017, 36, 1–6. [Google Scholar] [CrossRef]
- Valenzuela, H.R.; Goo, T.; Hamasaki, R.H.; Radovich, T. The effect of bone meal on the yield of jicama, Pachyrhizus erosus, in Oahu Hawaii. In Proceedings of the Florida State Horticultural Society, Lake Buena Vista, FL, USA, 23–25 July 2000; Volume 113, pp. 222–226. [Google Scholar]
- Nogalska, A.; Krzebietke, S.J.; Zalewska, M.; Nogalski, Z. The effect of meat and bone meal (MBM) on the nitrogen and phosphorus content and pH of soil. Agric. Food Sci. 2017, 26, 181–187. [Google Scholar] [CrossRef]
- Römheld, V.; Kirkby, E.A. Research on potassium in agriculture: Needs and prospects. Plant Soil 2010, 335, 155–180. [Google Scholar] [CrossRef]
- Wang, M.; Zheng, Q.; Shen, Q.; Guo, S. The critical role of potassium in plant stress response. Int. J. Mol. Sci. 2013, 14, 7370–7390. [Google Scholar] [CrossRef] [PubMed]
- Bąk, K.; Gaj, R.; Budka, A. Accumulationof nitrogen, phosphorus and potassium in mature maize under variable rates of mineral fertilization. Fragm. Agron. 2016, 33, 7–19. [Google Scholar]


Publisher’s Note: MDPI stays neutral with regard to jurisdictional claims in published maps and institutional affiliations. |
© 2021 by the authors. Licensee MDPI, Basel, Switzerland. This article is an open access article distributed under the terms and conditions of the Creative Commons Attribution (CC BY) license (http://creativecommons.org/licenses/by/4.0/).