Article

Empirical Analysis on the Performance of Rural Credit Cooperative’s Shareholding Reform Based on the Rationale of Isomorphic Incentive Compatibility

College of Finance and Statistics, Hunan University, Changsha 410079, China
*
Author to whom correspondence should be addressed.
Sustainability 2021, 13(5), 2844; https://doi.org/10.3390/su13052844
Submission received: 8 January 2021 / Revised: 24 February 2021 / Accepted: 2 March 2021 / Published: 5 March 2021

Abstract

:
Rural economic development helps reduce the income inequality in China. Existing studies show the positive effects of rural reforms, however, whether the rural credit cooperative’s shareholding reform promotes rural economic development and whether effects are exerted through the synergism between agricultural producers and rural financial institutions remain unclear yet. Employing the rationale of isomorphic incentive compatibility from system science, we analyze the necessity and influencing conduit of rural credit cooperative’s shareholding reform theoretically. Analysis shows that only the financial services from rural commercial banks can promote the modernized production, and thus the synergism between them drives rural economic development. Then we make empirical analysis on the effect with a Chinese provincial sample. Comparing to provinces with lower reform progress, the provinces with greater reform progress are influenced more prominently by this reform. Applying coupling coordination degree model, the coordination between agricultural production and rural banking development shows obvious increase, especially after the formal implementation of shareholding reform on rural credit cooperative. Empirical results indicate that this synergism plays positive roles in promoting agricultural growth and reducing the urban–rural income gap. In addition, these effects are more pronounced after the formal implementation of shareholding reform.

1. Introduction

The rural China has undergone several institutional changes of banking in the last century [1]. In addition, rural credit cooperative has become a dominant supplier of credit to farm production and SMEs (small and medium enterprises) in rural China since the middle of 1990s [2]. (Cooperative is a kind of organization tackling things with cooperation or serving members based on the common interest or objective that the cooperative is intended to achieve [3,4]. Chinese guiding document in 1999 defines rural credit cooperative is an organization aiming at solving credit shortages of members in livelihood and agricultural production, whose members are usually rural households and offer a majority of founding capital [5]). With continued poor performance of rural credit cooperative due to depressed prices of agricultural products and a long-lasting downturn of rural households’ income [6], the Chinese government was forced to implement the RCC (rural credit cooperative) shareholding reform in 2003. Although led by the government, this institutional change has been transforming the institutional form of rural credit cooperative in the city and county level actually [7]. (Chinese administrative districts consist of four levels from large to small, province, city, county, and township. Counties incorporate townships and rural areas). Depending on the operating environment and specific condition of institutions, rural credit cooperative can choose from three institutional forms: rural commercial bank based on shareholding system (a common institution of modern enterprise), rural cooperative banks based on cooperative shareholding system, or just make some improvements based on cooperative ownership before 2012. Transforming the institutional form into a shareholding system became the only choice for the rest of rural credit cooperatives and rural cooperative banks in 2012, which is regarded as the formal implementation of RCC shareholding reform [8]. In 2019, there were 1423 headquarters and 77,258 branches of rural commercial banks [9]. Over 80% of them are located at county areas.
Policymakers intend to realize two goals in RCC (rural credit cooperative hereafter) shareholding reform: The one is achieving financial viability through improvement of corporate governance in the shareholding system; the other is establishing small and locally owned commercial banks mainly for rural households and businesses, which has been documented as the booster of local economic development [10,11,12,13]. However, some scholars and banking staff cast doubt whether the reform is fundamental enough to achieve these goals, or formalistic, even just by changing the information in the signboards and licenses [14]. This is because a majority of rural commercial banks look like they are keeping the same outlets location, shareholder, executive board, staff, and service after the reform [15,16]. The controversy leads to confusion about the effect of this reform on rural economic development. Apart from this, related empirical studies focus on the effect of RCC shareholding reform on the institution’s operating performance [6,17,18,19,
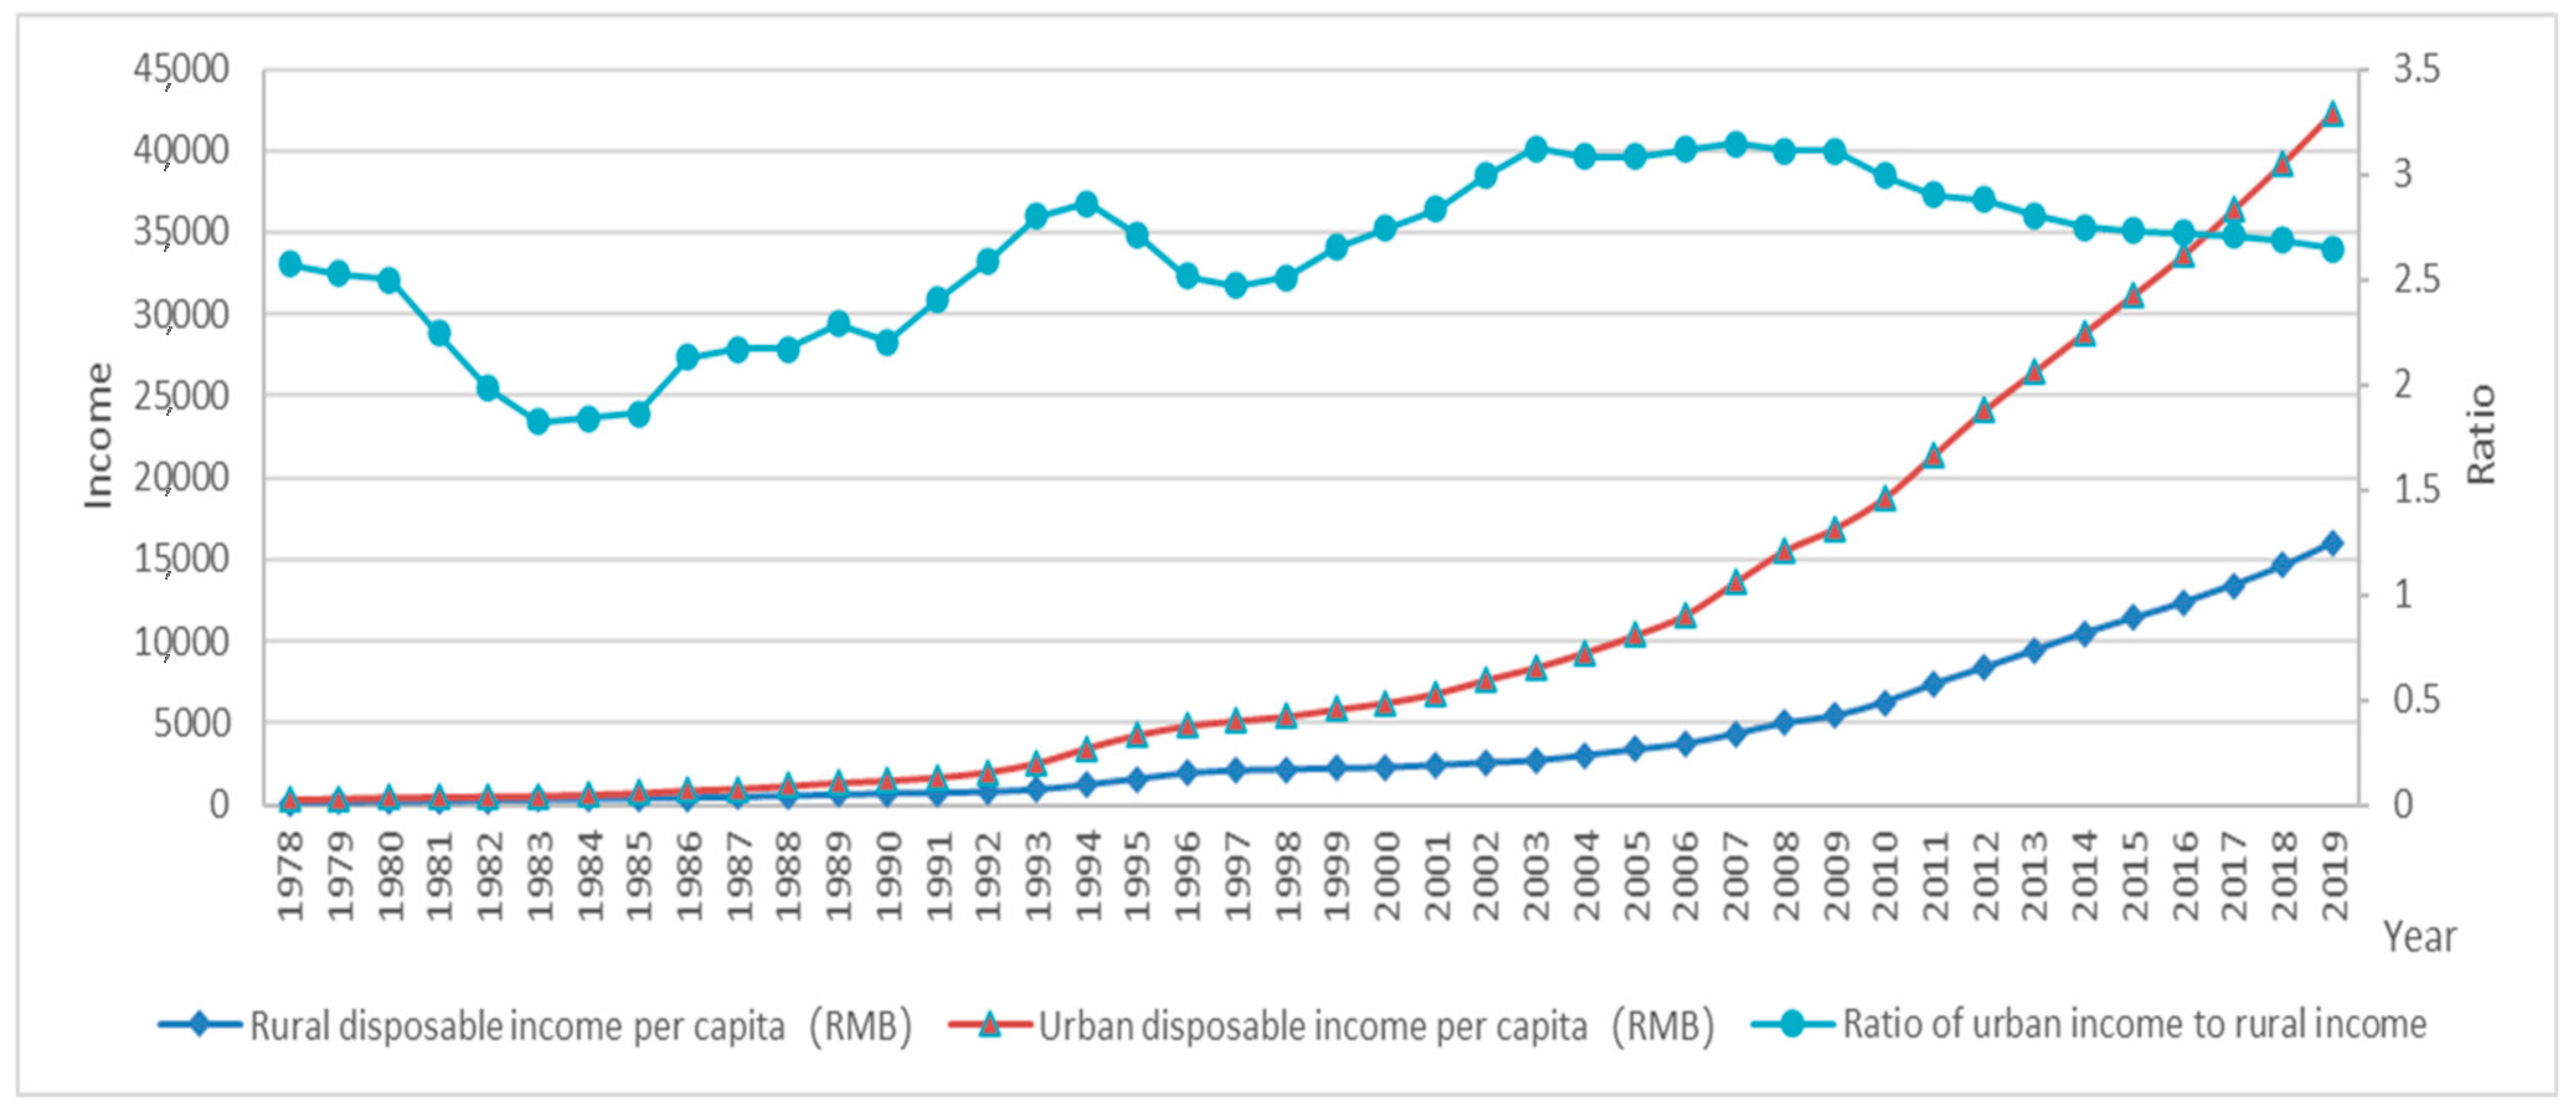
20], while its effect on rural economic development remains unanswered, which also intensifies the voice of doubt. In the context of prominent rural–urban income gap (Figure 1), (Among several income gaps in China, urban-rural income gap is the most prominent one. It has been slightly enlarging over the past decades and the urban disposable income has been nearly 2.6 times the rural disposable income in 2019) transforming the agricultural production method into modernized mode, such as agricultural industrialization, is one of the crucial measures as it can improve agricultural productivity through specialized division of labor, scale, and intensive production and technique upgrades [21,22,23,24]. (As a modernized production, agricultural industrialization is a relationship mode for realizing a combination of production, processing, and sales, which is characterized by standardization, scale production, and specialization, and where decisions at the front-end of the supply chains are based on knowledge of the markets’ needs [23,24,25]. The leading enterprise is the core part of agricultural industrialization. In January of 2021, Chinese Ministry of Agriculture and Rural Affairs released a policy to regulate the transfer of land management right in order to add further momentum to agricultural industrialization [26]). It is urgent to establish specialized financial institutions that serve rural revitalization as China has entered the transition phase of rural revitalization after winning the battle against poverty. This confused cognizance hinders the rural commercial bank from identifying its function or responsibility clearly, and thus providing enough support to agricultural industrialization and rural revitalization firmly. According to a survey in China Family Panel Studies conducted by Peking University in 2018, only about 15% of producers engaging in scale production have access to banking loans [27]. Therefore, we attempt to discuss the necessity of RCC shareholding reform and evaluate its performance from the perspective of rural economic development. The related results could not only strengthen the confidence of the rural commercial bank to offer stronger credit support but provide practical reference for deepening reform and promoting further development of the rural commercial bank.
Figure 1. Chinese Rural Disposable Income, Urban Disposable Income and Urban-Rural Income Ratio from 1978 to 2019. Source: this figure is accessed from Li [28].
Sustainability 13 02844 g001
Some empirical studies have provided evidences that the institutional change contributes to economic growth, despite the absence of technology upgrade sometimes [29,30]. There are also researches documenting the positive effect of financial institutional change on economic development [31,32,33,34]. These suggest that RCC shareholding reform may play a positive role in rural economic development. Moreover, rural commercial bank has more adequate capital and higher financial viability after relinquishing bad loans and negative equity comparing to rural credit cooperative, which strengthens their capacity to support agricultural production as well as rural economy with more capital. (The average capital adequacy ratio of rural banking institutions has increased from −8.45% in 2002 (pre-reform) to 12.97% in 2019 (in the reform). [35]). More adequate capital of rural commercial banks enables peasants, especially smallholders, to have better access to credit. In addition, it brings more inputs, educated labor, and techniques upgrade, and thus promotes economic development in rural areas [36,37,38,39,40,41,42,43,44]. Meanwhile, institutions after the reform have more freedom as the regulation released in the RCC shareholding reform prevents local government from interfering in the operation and management [45]. Less intervention from the government could lower risk-taking and avoid policy lending and the resultant productivity erosion [46,47,48,49,50]. Furthermore, Chinese Banking and Insurance Regulatory Commission (CBIRC) has tightened the regulation on the operating zone and prohibited the rural commercial bank from operating across regions, such as setting up branches at places different to the headquarters [51,52]. CBIRC also sets a base line on the proportion of credit extending to businesses involved with agriculture, and small and micro businesses [53]. They both enable the funds of rural commercial bank to retain at the local areas and support rural economic development. Hence, we propose the first hypothesis that RCC shareholding reform can promote rural economic development.
To identify the channel through which RCC shareholding reform exerts an effect, we employ the approach of system science. The investigated subjects of system science are characterized by relatively large-scale, complicated behaviors, inside interactions, and facing randomness from outside [54,55,56]. Studies in social science, like economy and education, have employed this approach [57,58,59,60,61,62]. Following the previous study, we regard Chinese rural economy as an organic system with functions of providing agricultural products, raw materials, and jobs, which consists of an agricultural production subsystem and rural banking subsystem. (The system is defined as an organic whole with a specific function in system science [54,55,63]. Elements are the basic constituents of the system and there are subsystems made up of elements in some complicated systems [63,64]). The evolution of a system is driven by not only the selection made by the system’s interaction with the environment, but the synergism resulting from coordinated interaction between the inside elements or subsystems [63,
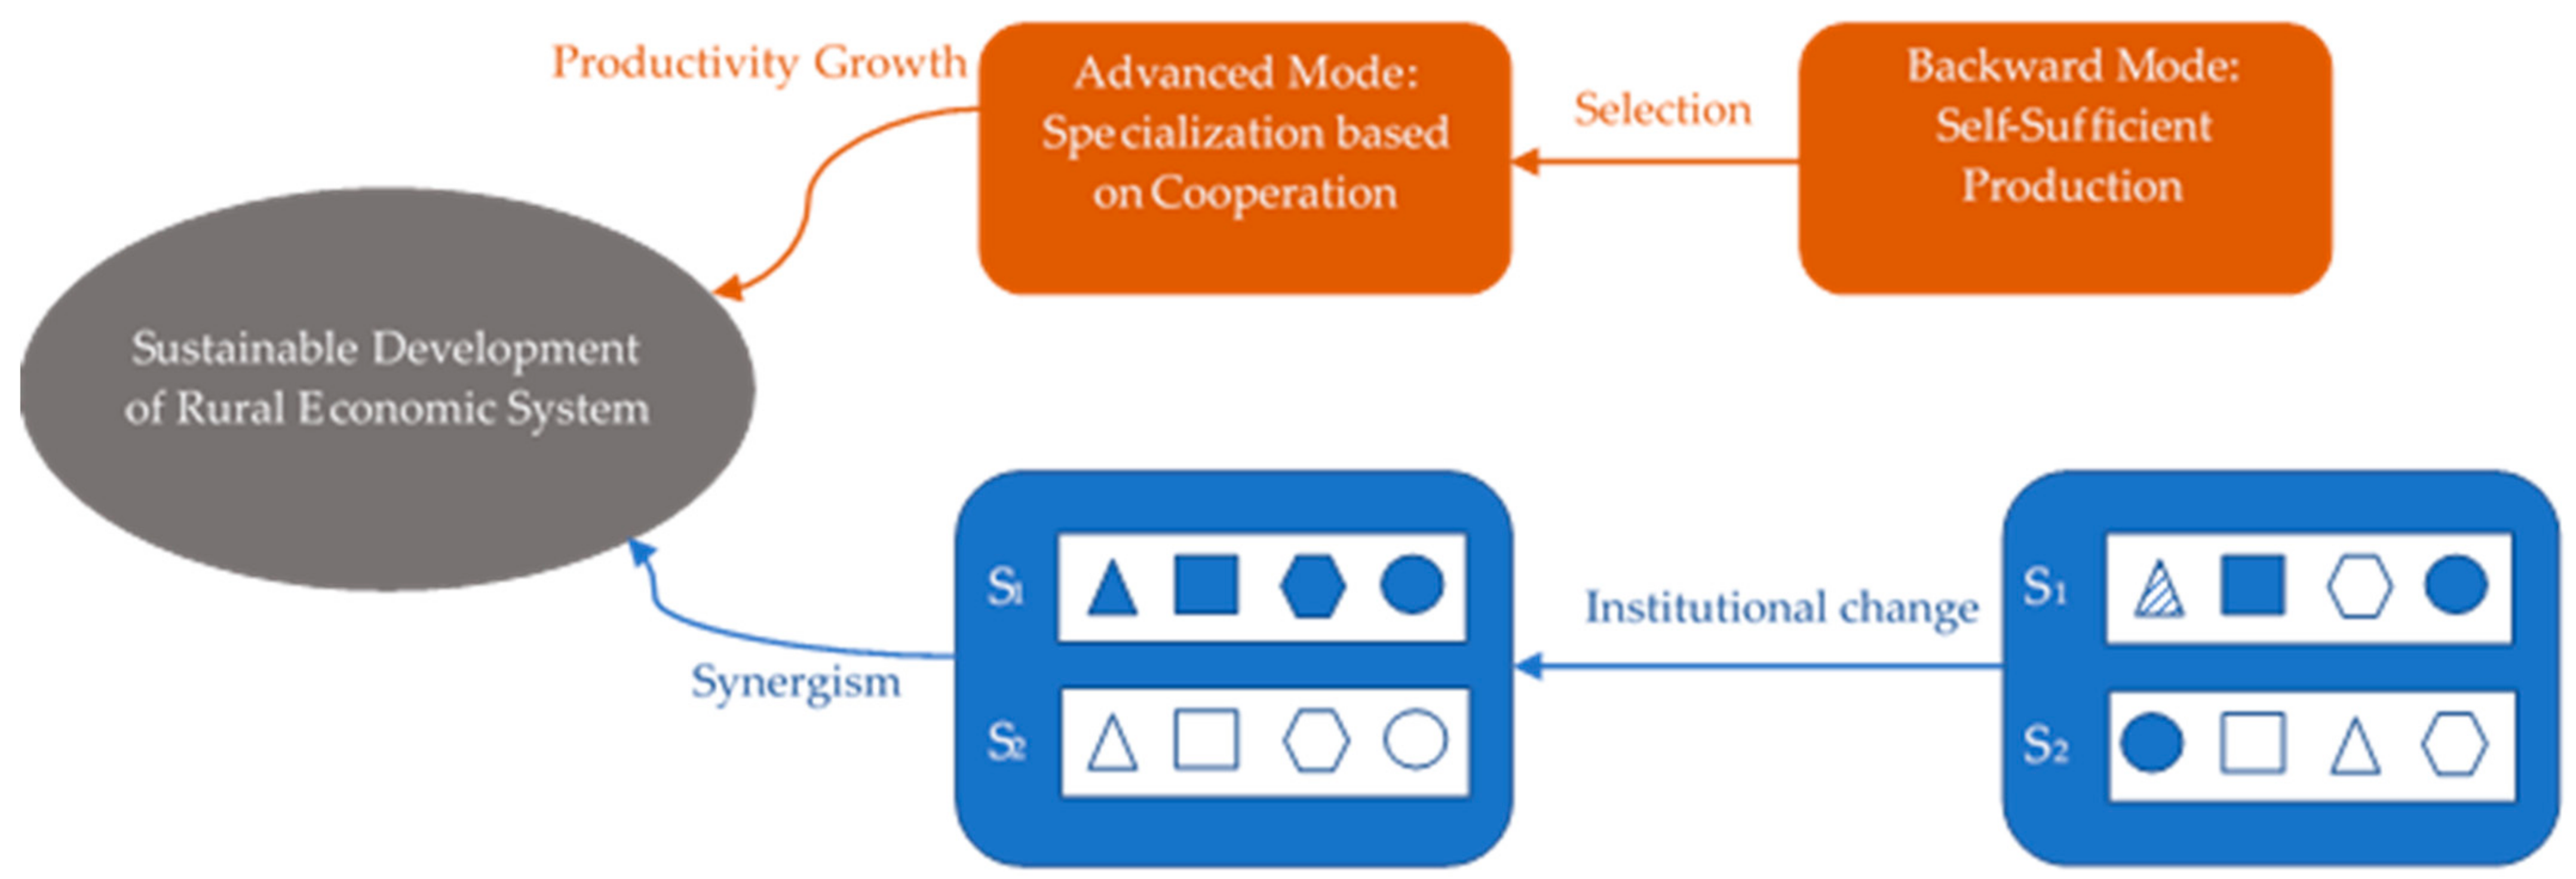
65]. Thus, in addition to the production method selected by agricultural producers and consequent productivity growth, rural economic development lies in the synergism between subsystems inside (Figure 2). The rationale of isomorphic incentive compatibility underscores that subsystems can realize the coincidence of interests, coordinated interaction, and resultant synergism when there is an isomorphic relationship, namely high similarity and order in their inner structures [63,64,
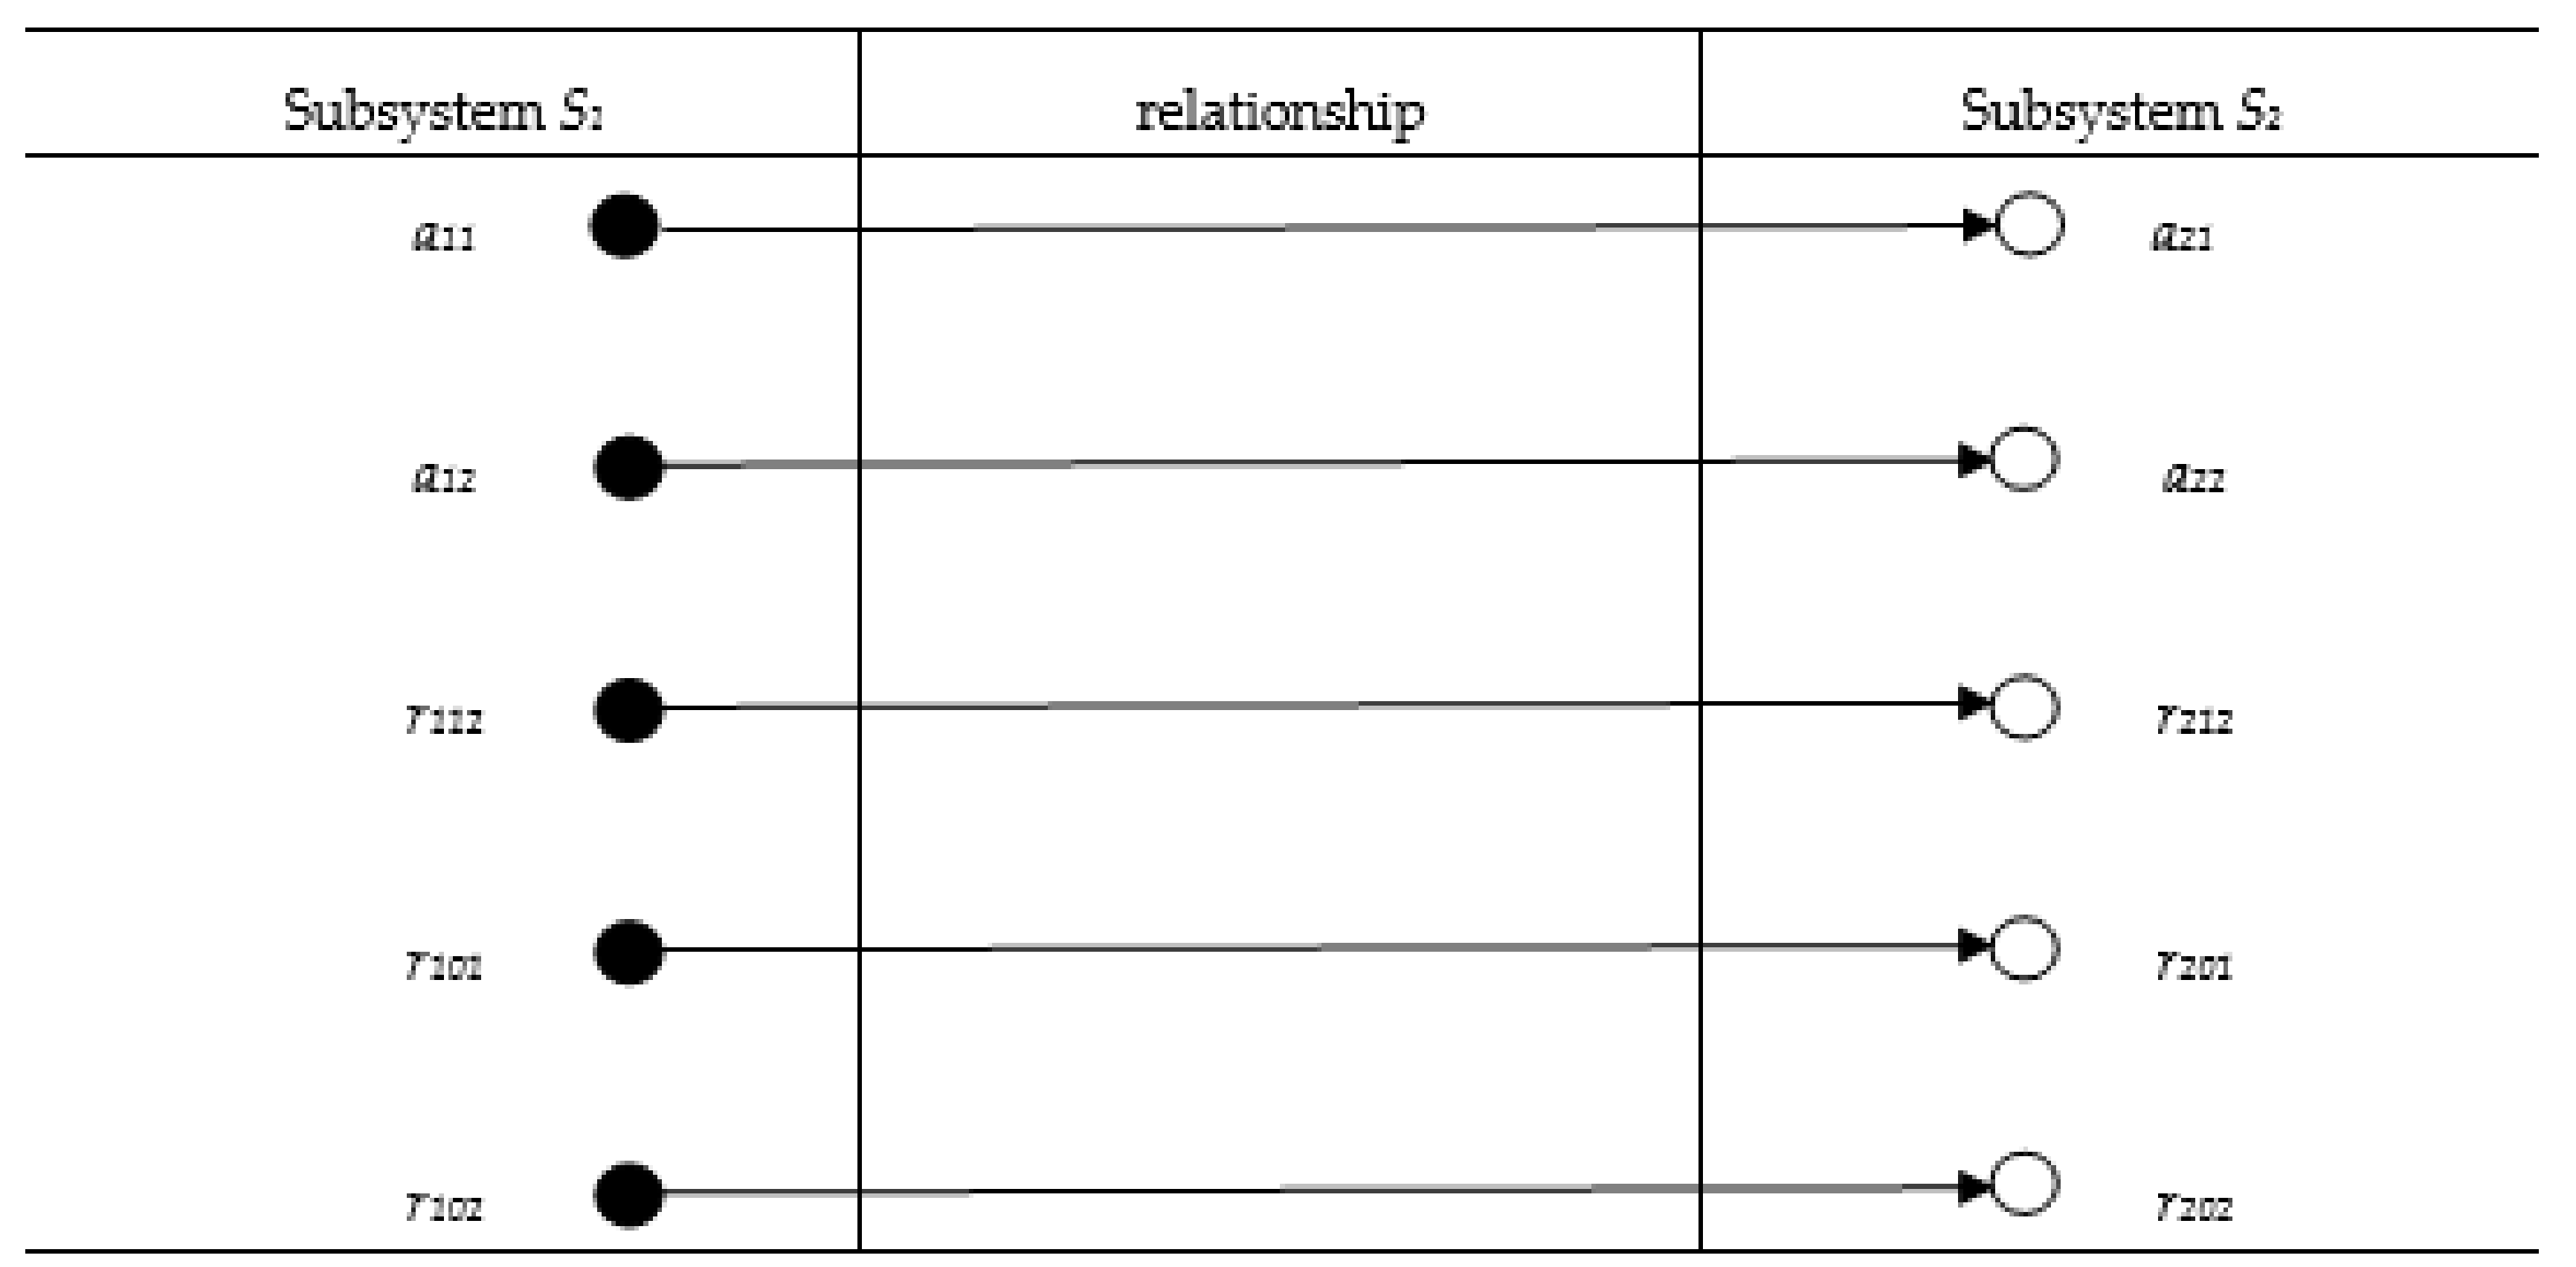
65]. (The isomorphic relationship between systems shows that an element in a system only corresponds to a related element in another system [64,66]. We give a more detailed explanation in Section 2). Institutional change usually aims at the game equilibrium among interest-related parties through shaping their interaction [67]. Particularly, the rural commercial bank makes operating decisions such as loans granting, based on the principle of one-share-one-vote to gain maximum profits, rather than operating under one-member-one-vote for mutual aid in RCC’s period [68,69]. In addition, the decrement in the number of members, namely shareholders after the reform, makes ownership structure more concentrated [69,70]. (A survey in Shanxi Province shows that the rural credit cooperatives there have over 3000 members on average before the RCC shareholding reform [69]. Some studies show that the shareholders’ number of rural commercial banks has decreased by over 75%, comparing to the number in the RCC period [
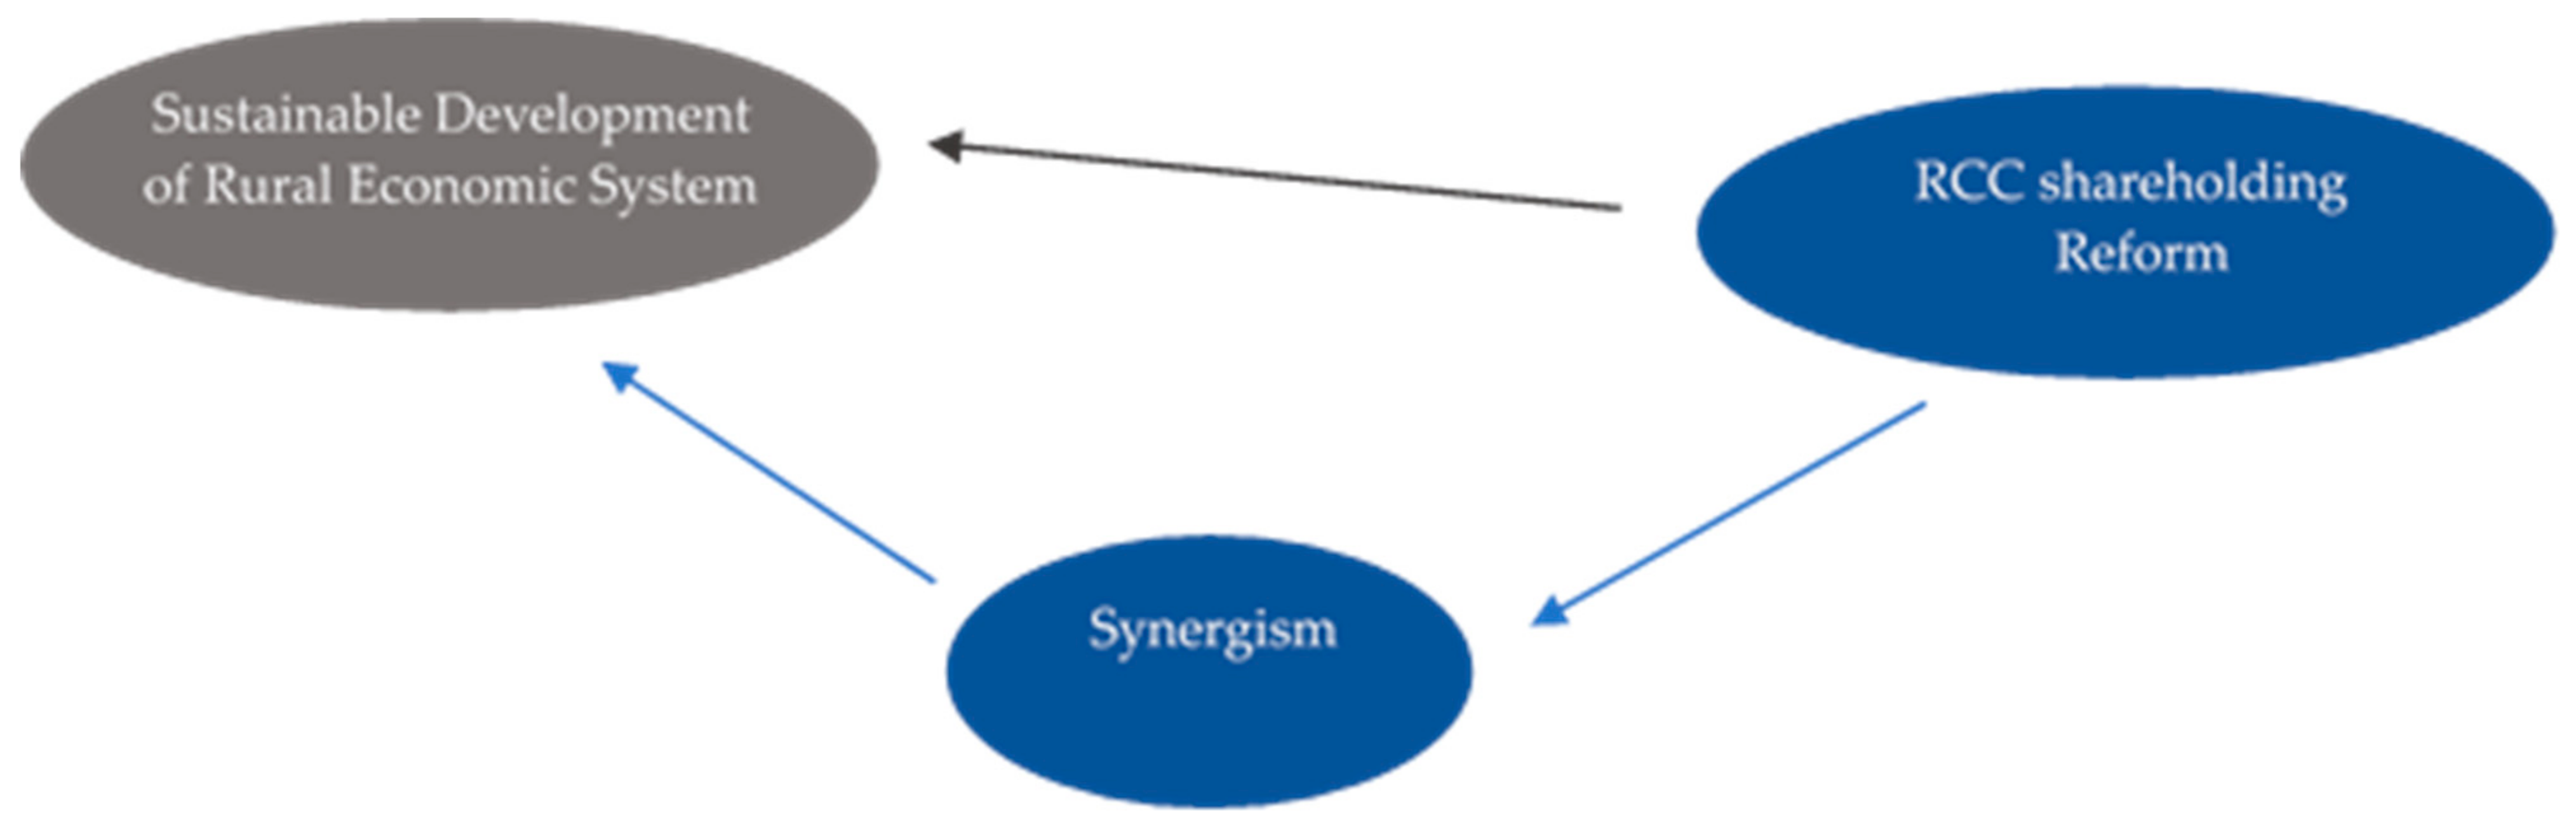
70]). Both of them make shareholders’ interests more coincident, bringing facilitation in decision-making and monitoring, and greater effectiveness of operation. Therefore, we propose the second hypothesis that promoting the synergism between rural banking institutions and agricultural producers is a plausible mechanism through which RCC shareholding reform promotes rural economic development.
To verify the two hypotheses above, we conduct this study with a sample of 30 Chinese mainland provinces, autonomous regions, and municipalities. The remainder of our study is organized as follows. Section 2 discusses the necessity and influencing mechanism of shareholding reform. Methodology and data description are presented in Section 3. We present empirical results and discussion in Section 4. Conclusions are shown in the last section.

2. Necessity and Influencing Mechanism of RCC Shareholding Reform

2.1. Necessity of RCC Shareholding Reform

2.1.1. Rationale of Isomorphic Incentive Compatibility

We propose the rationale of isomorphic incentive compatibility on the basis of the cybernetics, the dissipative structure theory, and the non-addition theory in the system science to explain the necessity of RCC shareholding reform. We also apply it to illustrate the theoretical mechanism through which this reform promotes rural economic development. This rationale describes that a system could go forward where subsystems are in isomorphic relationship. We start with the isomorphic relationship.
Isomorphic relationship shows an extremely similar structure between systems or subsystems inside a system, where elements are sequenced in order. It is a concept in mathematics originally representing a bijective linear map between two root systems in the Euclidean space [71]. Cybernetics defines isomorphic relationship as an element in a system (or subsystem) that only corresponds to a related element in another system (or subsystem) [55,64,66]. To better illustrate the isomorphic relationship between subsystems, we describe it with the help of mathematical expression following Klír and Valach [64] and Peng [66].
We assume two subsystems S1 and S2 constituting the whole system S. Subsystem S1 can be denoted as a set: S 1 = A 1 , R 1 . A1 is a set of all the elements in subsystem S1, illustrated as A 1 = a 11 , , a 1 i . R 1 is a set of r i j i , j = 0 , 1 , , n , and r i j represents all the information linkages among the elements, and between elements and external environment a 10 . Likewise, subsystem S2 can also be illustrated as a set. Namely, S 2 = A 2 , R 2 , where A 2 = a 21 , , a 2 k , r p q p , q = 0 , 1 , , m .
If subsystem S1 is isomorphic to subsystem S2, then the relationship can be illustrated as:
1. There is one-to-one correspondence between elements in set A 1 and elements in set A 2 .
2. There is one-to-one correspondence between elements in set R 1 and elements in set R 2 .
Particularly, if a 11 corresponds to a 21 , a 1 i corresponds to a 2 k , then r 11 i corresponds to r 21 k .
Figure 3 plots the isomorphic relationship between subsystem S1 and subsystem S2 when they consist of two elements and related information linkage.
Dissipative structure theory has been applied to explain the development of human-earth system, environment–tourism–economy system, and urban development system and the like [72,73,74]. According to the dissipative structure theory, an isolated system is characterized by the unordered sequence of elements (or subsystems) and movements, and lack of information (or materials, energy) exchange [56,63]. It does not differentiate with the outside environment and is not functional. Prigogine [58] denotes the process of entropy increase as that system tends to be unordered inside and lose exchange with the outside. (Entropy is a measure of disorder within a macroscopic system [72]. When there is information (or material, energy) exchange, the value of the entropy decreases. Otherwise, it increases [56]). The linkages with the environment or other systems enable the elements (or subsystems) inside the system to be ordered, which is the process of negentropy [56]. Isomorphic relationship is a type of linkage and brings the process of negentropy. Incentive compatibility denotes the exchange of information and material such as funds. As a result, there is highly ordered sequence of elements (or subsystems) as isomorphic relationship requires the correspondence between every element and between every element and environment.
From the perspective of system science, the sequence of elements and subsystems reflects the structure of the system and is an important determinant of the property and quality of a system’s function [54,63]. As Bertalanffy [54] noted, the more ordered elements or subsystems are, the higher level that they reinforce each other. Based on his non-addition theory, the new collective driving force goes beyond adding up the forces of single subsystems (elements) simply if there is ordered sequence or coordinated interaction between elements (subsystems) [54]. In this case, the whole system is driven by a much greater power, namely the synergism between the elements (or subsystems). In addition, it can also perform its function better.

2.1.2. Analysis on the Necessity of RCC Shareholding Reform

We apply the rationale of isomorphic incentive compatibility to analyze the necessity of RCC shareholding reform. The rural economy is a system consisting of agricultural production subsystem and rural banking subsystem. Before the shareholding reform formally started, the Chinese government explored the transformation of agricultural production method and conducted agricultural industrialization project (Table 1). Different to small-peasant production characterized by self-sufficiency and diversified, the method of agricultural industrialization is intensive, including gathering production capital, tools, and workforce to several lands. Besides resources concentrated, there is information exchange to realize optimal allocation in resources in this intensive production method. (The concentrated resource is relative to small-peasant production, which is different to monopoly). In addition, agricultural producers in agricultural industrialization can also exchange information as they are all connected to the market. From the perspective of dissipative structure, agricultural industrialization is differentiated to the environment and has the function of improving agricultural productivity. On the contrary, rural credit cooperative aims at mutual aid among members and rarely gathers their funds to several enterprises. Members also make decision under the principle of one-person-one-vote, which is hard to exchange information as fluent as agricultural industrialization and to realize the optimal allocation of funds. When the rural banking subsystem is composed of rural credit cooperatives, it is undifferentiated and close to an isolated system, and cannot perform its function well from the view of Prigogine.
Table 1. Value of Agricultural Industrialization Project (10,000 CNY) 1.
Year20032004200520062007200820092010
Value of agricultural industrialization932,272.51,062,7091,323,4361,550,3211,703,8221,658,7461,588,0211,588,021
Year2011201220132014201520162017
Value of agricultural industrialization1,322,836975,492.51,112,5802,105,4062,138,7991,297,5441,003,587
1 The agricultural industrialization project is carried out by Chinese government in the procedure of Agricultural Comprehensive Development. Source: Almanac of China’s Agricultural Comprehensive Development (2004–2018) [75].
In this case, the rural economic system is not a stable whole, not to mention the development of the whole system. The unordered sequence could even destroy the whole system. Changing the institutional form through shareholding reform of rural credit cooperative can make the rural banking subsystem function, exchange information and funds, and adjust its behaviors under the coincident interest. More importantly, reform can help the realization of ordered sequence between the rural banking subsystem and agricultural production subsystem inside the rural economic system. In addition, coordinated interaction, like reinforcement, can achieve synergism between subsystems and produce greater power to drive the whole system development. Therefore, it is necessary to implement the RCC shareholding reform.
Historic experience also indicates the necessity of RCC shareholding reform in the context of agricultural industrialization. We take the relationship between the first industrial revolution and the rapid development of shareholding bank in Britain as an example to illustrate the necessity of reform. Textile industry in Britain is the pacemaker of the industrial revolution, where many workshops were founded on shareholding system at the beginning of this revolution [76]. (There were at least 30 workshops adopting shareholding system at the beginning of the first industrial revolution). These workshops concentrated capital and machines, and satisfied large market needs through scaled production decided by coincident interest. The shareholding workshops are more common in other industries needing more capital. In addition, the techniques and productivity are easier to be upgraded in this institutional form. On the banking side, although the first shareholding bank, Bank of England (1694), was established before the first industrial revolution (the middle of 18 century), it had franchise rights and took the responsibility of central bank eventually. (This franchise right of Bank of England banned other banks, usually country banks, from being established based on shareholding systems or partnerships including over six partners [77]). There are mainly country banks, namely banks relative to Bank of England and other private banks, providing credit support. However, country banks could not resist risk and went bankrupt, while shareholding banks in the pilot did a better job in the 1825 crisis. Shareholding banks became the major suppliers of credits supporting British industry and expanded faster as shareholding companies after issuing the Bank Act of 1826 [76]. Similar to the shareholding company, the shareholding system enables shareholders of banks to concentrate their funds and interests. From the perspective of the isomorphic incentive compatibility, the widespread shareholding bank is the result of negentropy process, making the industry system ordered. The needs of shareholding companies in British industry bring the development of shareholding banks, and shareholding banks support shareholding companies. To some extent, this incentive compatibility (or reinforcement) promotes the first industrial revolution moving forward and achieving remarkable productivity increase.

2.2. Influencing Mechanism of RCC Shareholding Reform

2.2.1. Theoretical Model

Path analysis accounts for the complex relationships between the variables, including the relationships between explaining variables and the relationship between the explained variable and explaining variables [78]. It decomposes the correlation coefficients in the multiple regression, and uses direct path, indirect path, and total path coefficients to indicate respectively the direct, indirect, and total effects of independent variables on the dependent variable [79].
Following the hypotheses and the related literature in the introduction, there is a direct and indirect relationship between the development of rural economic systems and RCC reform (Figure 4). The direct effect of RCC shareholding reform on rural economic development results from stronger credit support of post-reform institutions, viz. rural commercial bank [33,34,35,36,37,38,39,40,41,42,43,44,45,46,47,48,49,50,51,52]. In addition, the indirect effect lies in that RCC shareholding reform promotes the development of rural economic system through an isomorphic relationship and consequent synergism between subsystems [63,64,65,66,67,68,69,70]. Hence, we construct a simplified theoretical model with the reference of path analysis and illustrate the development of a rural economic system with parameters in the model.
We assume a rural economic system composed of an agricultural production subsystem and rural banking subsystem. The development of a rural economic system is reflected by an exponential function as Equation (1):
  C 3 = f P , C 2 = P δ 1 C 2
where   C 3 , P , and C 2 denote the growth ratio of rural economic system (%), agricultural productivity growth (%), and the synergism between the agricultural production subsystem and rural banking subsystem, relatively. We assume P Z for concise discussion.
Following Brunn [78], Chai [79] and Park [80], we take the RCC shareholding reform into account. Equation (1) can be extended to Equations (2) and (3).
C 2 = b + δ 21 C 1
C 3 = P δ 31 C 1 + δ 32 C 2   =   P δ 31 + δ 32 δ 21 C 1 + δ 32 b
  C 1 represents RCC shareholding reform.   C 1 denotes the implementation of reform with a value of 1, otherwise it equals to 0. b is a dummy variable, capturing the initial status of interaction between subsystems. b equals to 1 when there is synergism, otherwise it equals to −1. They are all captured by dummies to make concise discussion. Meanwhile, δ 31 and δ 32 δ 21 capture direct effect and indirect effect, respectively. Their values belong to set Z + .

2.2.2. Effect of Isomorphic Relationships between Two Subsystem on Rural Economic Development in Pre-reform and Post-reform Situations

Based on the evolution of a rural economic system, the agricultural production subsystem mainly incorporates traditional small-peasant production based on self-sufficiency and modernized production based on specialization and cooperation, such as agricultural industrialization. In addition, the rural banking subsystem mainly incorporates rural credit cooperatives based on cooperative ownership and rural commercial banks based on shareholding system. There are three situations totally in Chinese reality.
Situation 1: There are small-peasant production (S11) and rural credit cooperative (S21) in the whole system.
Situation 2: There are modernized production (S12) and rural credit cooperative (S21) in the whole system.
Situation 3: There are modernized production (S12) and rural commercial bank (S22) in the whole system.
Situations 1 and 2 exist before the RCC shareholding reform while Situation 3 depicts post-reform situation. Then, this study discusses the development of a rural economic system in three situations above and shows how RCC shareholding reform changes the synergism between subsystems. Our focus is the indirect path in the theoretical model.

Isomorphic Relationship and Rural Economic System Development in Situation 1

The small-peasant production refers to the rural households or smallholders works as a unit of production pursing agricultural livelihoods, with the purpose of self-sufficiency. Production materials in this production mode, like farming tools, are owned by households [7,81]. The small-peasant production is scale-restricted, vulnerable to natural disasters, produces a single type of product, and barely employs machines or techniques extensively. In addition, it has low dependence on the market since small-peasant production aims at achieving self-sufficiency rather than profit maximization.
As noted in the introduction, rural credit cooperative is established based on funds from its members, namely peasants, and makes operating decisions under the principle of one-member-one-vote [69,70,82]. Under the purpose of mutual aid, rural credit cooperative focuses on the dispersed and small-amount credit needs of members, rather than gaining the greatest profits in the whole financial market. Its absence from market competition brings relatively single financial products and services, which barely requires staff to improve skills.
From this purpose, it is clear that there is coincident interest between small-peasant production and rural credit cooperative. The correspondence in other elements, like corporate governance, capital source, and marketization, is concluded in the first two columns of Table 2. The corresponding elements indicate that there is an isomorphic relationship between the agricultural production subsystem represented by small-peasant production, and the rural banking subsystem represented by rural credit cooperative. The similar structure enables them to interact harmoniously and brings synergism. Specifically, due to the self-sufficient purpose and relatively fixed scale, small-peasant production requires little external funding and a low variety of financial products. The credits extended to agricultural production are characterized by dispersed location, small amount, long period, lack of collateral, and are hard to monitor, thus leading to the higher operation cost and default risk. Commercial banks cannot satisfy the credit needs as a result of higher transaction costs, causing the rural credit cooperative to be the optimal choice. As the local bank, rural credit cooperative costs fewer in information collection and credit operation based on the relative advantage in soft information and reciprocal monitoring of members.
The agricultural production subsystem and rural banking subsystem have not concentrated their resources, nor do they have information or funds exchanges in this situation. Although there is an isomorphic relationship between them, the effect of incentive compatibility and coordinated interaction does not exist. In fact, due to biological attributes of crops and high transaction cost, peasants usually achieve simple reproduction under fixed scale and techniques for self-sufficient purpose. It makes them unable to select a modernized production method based on cooperation and specialization (exchange informations and materials) and thus enter into the stage of productivity growth.
In Situation 1, there is synergism between subsystems but stagnant agricultural productivity growth. Namely, b = 1 and P = 0 . Meanwhile,   R 1 = 0 indicates the pre-reform period. The growth ratio of rural economic system can be calculated as Equation (3). Specifically,
R 3 = 0 δ 31 + δ 32 δ 21 · 0 + δ 32 · 1 = 0
The result indicates that the rural economic system remains stagnant.

Isomorphic Relationship and Rural Economic System Development in Situation 2

Agricultural industrialization is a representative of modernized production. It connects producers, and especially smallholders, with advanced techniques and modern production modes through supply chains or other organizational cooperation, such as enterprise-smallholders [23,24,25]. The transaction cost is cut down through these connections, which is conducive to promote specialization and enlarge production scale and market scale. Village enterprises, specialized production cooperatives, and production chains connected with leading enterprises and workforce inside gradually substitute the traditional smallholders. In addition, they get efficiency improvement and technique upgrades during this process. Adopting this new method of production is necessary to change the dual economic structure, improve agricultural productivity, and transform China into an agricultural powerhouse.
Existing studies provide evidence that transforming agricultural production into modes with higher levels of specialization and cooperation needs financial support [23,41,83]. Points in neoclassical economics also indicate that the specialization depends on transaction efficiency, which can be improved by financial development [84,85,86]. However, agricultural industrialization conflicts with the rural credit cooperative in some specific elements. First, the organization and enterprises are established based on the shareholding system, where one share owns one vote in corporate governance and interests concentrate on profit maximization. The cooperative ownership of the rural credit cooperative conflicts with agricultural industrialization. Second, agricultural industrialization pursues higher transaction efficiency and specialization while the rural credit cooperative lacks the motivation of improving specialization. Third, agricultural industrialization requires more funds to enlarge scale and upgrade techniques for increasing efficiency and profit. There is a mismatch in the purpose as rural credit cooperative pursues mutual aid, rather than profit maximization. Meanwhile, agricultural industrialization is involved with more departments from seed cultivation and plantation to transportation and sales, thus requiring not only loans but also other services like discounts, factoring, foreign exchange, and financial lease. It is also mismatched with services and products of the rural credit cooperative. Finally, with the higher degree of specialization in agricultural industrialization, the related workers including peasants and executives all have skills improvements while this improvement is not critical to rural credit cooperatives. We summarize the conflicts above in the middle columns of Table 2. The conflicted elements cannot bring similarity into the structure. According to the rationale of the isomorphic incentive compatibility, this conflict hampers coordinated interaction between two subsystems.
In Situation 2, there is conflict between subsystems as well as an increase in agricultural productivity. Namely, b = 1 and P Z + . Meanwhile,   R 1 = 0 indicates the pre-reform period. The growth ratio of rural economic system can be calculated as:
R 3 = P δ 31 + δ 32 δ 21 · 0 + δ 32 · 1 = P δ 32
The result indicates that the rural economic system grows at a speed lower than agricultural productivity growth in Situation 2. To achieve synergism between subsystems and enjoy the related benefit, the rural credit cooperative should be transformed into a new form isomorphic to agricultural industrialization.

Isomorphic Relationship and Rural Economic System Development in Situation 3

Different to rural credit cooperative, achieving maximum profits is the operating purpose of rural commercial banks. Under the shareholding system, shareholders’ interests are concentrated [69,70]. They both enable the rural commercial banks to be isomorphic to agricultural industrialization naturally. There is more adequate capital and stronger resistance to default risk in a rural commercial bank compared with a rural credit cooperative generally. Meanwhile, the corporate governance in rural commercial banks is more efficient as the decision is made under the principle of one-share-one-vote. The better corporate governance helps improve specialization and efficiency. Besides, accompanied with more extensive services and clients, the requirements on staff and their skills also enhance. The last two columns of Table 2 present the one-to-one correspondence between rural commercial banks and agricultural industrialization.
With the new isomorphic relationship, agricultural production subsystem and rural banking subsystem interact with each other harmoniously. In particular, the incentive compatibility lies in the following aspects:
(1)
Production scale. Rural commercial bank reduces the transaction cost of agricultural industrialization through various financial services and products, which promotes specialization and enlarges production scale. Continuously enlarging production scale provides more effective demands, bringing an increase in banks’ scale and benefits from scale economy.
(2)
Revenue and earnings. Agricultural industrialization improves agricultural productivity and producers’ income, ensuring the loans and interest to be recovered and promoting performance. Continuous profit also helps rural commercial banks strengthen themselves, leading to stronger support for agricultural industrialization.
(3)
Market scope. Funds from the rural commercial bank help the extension in chains of agricultural industrialization and the participant into more markets and larger spaces. The market enlargement of agricultural industrialization also brings the extension in the market and business scope of rural commercial banks.
(4)
Risk control. The product contracts or other stable channels to market enable income or cash flows to be relatively expected and more information to be documented, which decreases transaction costs and keeps default risk under control. The better risk control and steady risk evaluation of a rural commercial bank help the frequent needs of credit to be satisfied on time.
(5)
Staff skills. Funds from rural commercial banks reduce transaction cost and thus promote specialization and enlarge production scale, leading to improvements in skills of producers and participants in agricultural industrialization. The higher specialization in agricultural industrialization and increasing departments also requires a skill upgrade of staff in rural commercial banks.
(6)
Corporate governance. The better corporate governance and efficient operation make rural commercial banks adjust services and products to coincide with the needs of agricultural industrialization on time. Better corporate governance in agricultural industrialization also promotes the innovation of financial services and products, strengthening the competitiveness of rural commercial banks.
Due to concentrated resources and interest, both agricultural production subsystem and rural banking subsystem are differentiated with environment to perform better function. The incentive compatibility shows the funds and information exchange between them. This indicates that a rural economic system can become highly ordered in Situation 3. Hence, there is synergism between subsystems and an increase in agricultural productivity. Namely, b = 1 and P Z + . Meanwhile,   R 1 = 1 indicates the post-reform period. And the growth ratio of the rural economic system can be calculated as:
R 3 = P δ 31 + δ 32 δ 21 · 1 + δ 32 · 1 = P [ δ 31 + δ 32 δ 21 + 1 ]
The value of C 3 indicates that the rural economic system grows at a speed higher than agricultural productivity growth after RCC shareholding reform. This shows that the overall effect of the rural economy system is greater than the sum of its subsystems’ effect.
The analysis on the effect of an isomorphic relationship between the agricultural production subsystem and rural banking subsystem in three situations indicates that synergism between subsystems is a plausible conduit through which RCC shareholding reform promotes rural economic development.

3. Materials and Methods

3.1. Sample and Data Source

Although RCC shareholding reform mainly implements at the Chinese counties, it is difficult to measure the synergism between two subsystems, owing to the unavailability of data on the rural banking subsystem at the county level. To verify the influencing mechanism of reform empirically, we employ Chinese provincial data to conduct our research. We examine a sample of 30 mainland provinces, autonomous regions, and municipalities for the period 2005 to 2017 in China. Owing to data availability, our sample does not include Tibet, Hong Kong, Macao, or Taiwan.
As no database provides information about the county rural commercial banks’ founding, the data on reform progress are counted manually based on the disclosure of bank opening approval and financial license information released by China Banking and Insurance Regulatory Commission. The variables used to measure agricultural production and the data on control variables all come from the EPS database.

3.2. Methodology and Model

3.2.1. Measurement of Agricultural Production Level

Constructing a reasonable index system and using an appropriate method to calculate the weights of the indicators are significant in the estimation of agricultural production level (APL). Referring to Peng and Xu [25], we construct an index of agricultural production containing five dimensions. The five dimensions are the condition, efficiency, scale, structure, and profit, relatively.
Following Huang [87], Sun [88] and Lou [89], we select specific indicators to capture the five dimensions above. The condition dimension reflects the physical condition where agriculture produces and develops. It contains the proportion of mechanical cultivation, the proportion of effective irrigated area, and the average agriculture mechanical power since they show the utilization of machineries and equipment. The efficiency dimension measures the agricultural production efficiency through per capita indicator and is captured by the average output of agriculture, forestry, animal husbandry and fishery, and the average agricultural output. The scale dimension measures the scale of agricultural production. The average sown area and the average agricultural fixed asset investment are employed to capture the level of scale in land and capital. The proportion of animal husbandry and fishery output represents structure dimension, aiming at capturing the structure. It shows whether there are larger proportions of animal husbandry and fishery and thus increased types of agricultural products. The last dimension is profit dimension and proxied by the commercial rate of agricultural products. It reflects the degree of agricultural products converted into commodities generating economic profit. The specific definitions of all the indicators are shown in Table 3.
Owing to the differences in their unit and range, the original agricultural production indicators must be normalized before we calculate the composite index. The normalization method is shown in Equation (4):
  X i j t = x i j t x i t m a x / x i t m a x x i t m i n
where x i j t is the original data of the indicator i in province j at time t. X i j t is the normalized value of x i j t . x i t m a x is the maximun value of the indicator i of all the provinces in year t.   x i t m i n is the minimun value of the indicator i of all the provinces at time t. After normalization, the value of X i j t ranges from zero to one.
We adopt the entropy method to calculate the weights of the indicators in our index. This method allows us to gauge the degree of uncertainty or variation in relation to the amount of information used, and is widely used in socio-economic studies [41,69,90]. When the information is rich or the degree of uncertainty is low, the value of the entropy should be small, and vice versa.
There are four steps in gauging the weight in year t, shown in Equations (5)–(9). First, we calculate the value of p i j t , which represents the normalized i t h indicator of the j t h province in year t as a percentage of the sum of the i t h indicator across all provinces in year t :
p i j t = x i j t j = 1 m x i j t
Then, we calculate the information entropy e i t , as
e i t = 1 L n m × j = 1 m p i j t L n ( p i j t )
We can obtain the entropy redundancy of the i t h indicator in year t through Equation (4):
r i t = 1 e i t
The weight of the i t h indicator in year t can be calculated as Equation (5):
w i t = r i t i = 1 k r i t
We compose the index of agricultural production as follows:
A P L j t = i = 1 k w i t × X i j t
The value of agricultural production index ranges from zero to one. Higher index value indicates that the agricultural production is more modernized or that the level of agricultural industrialization gets higher at the end of the sample period.

3.2.2. Measurement of Rural Banking Development

In this study, rural banking institutions include rural commercial bank, rural shareholding cooperative bank, and rural credit cooperative. We also construct an index system containing four dimensions to reflect the level of rural banking development (RBD).
The four dimensions are scale, market, utility, and structure, respectively. The scale dimension illustrates the average sizes of deposit and loan in rural banking institutions. It contains the average deposit of rural banking institutions and the average loan of rural banking institutions. The market dimension reflects the market shares of rural banking institutions in Chinese deposit and loan markets. The ratio of deposit from rural banking institutions to gross deposit and the ratio of loan from rural banking institutions to gross loan are common proxies of scale [91]. The utility dimension measures the support of deposits and loans from the rural banking system to agricultural development. We employ the ratio of deposit (loan) from rural banking institutions to output of agriculture, forestry, animal husbandry, and fishery [41]. In addition, the ratio of rural commercial banks to rural banking institutions captures the structure of banking ownership, which can also reflect the progress of shareholding reform of rural credit cooperatives. The higher the proportion, the greater the progress of the reform is. The specific definitions of all the indicators are presented in Table 4.
Following the method on index calculation in Section 3.2.1, we compose the index of rural banking development. Similarly, the higher value of the index implies greater progress of the development of rural commercial banks.

3.2.3. Measurement of Synergism between Subsystems

The coupling coordination degree model is an important method for assessing the complicated interaction of two or more systems, reflecting the degree of coordination between systems or elements in the development process [92,93]. Therefore, we quantify the synergism between the agricultural production subsystem and rural banking subsystem through this model.
The coupling coordination degree model is comprised of the coupling method and the coordination method. We introduce the concept and calculation of coupling at first. Coupling is a term that originated in the capacitive coupling coefficient model of physics, refering to the interaction of two or more systems and their influences on each other [94]. The coupling among systems in physics is illustrated by Equation (10):
C n = u 1 · u 2 · u n / u i + u j 1 / n
where C n is the coupling among n systems, u n captures the level of system.
And the coupling between agricultural production subsystem and rural banking subsystem can be expressed through Equation (10), when n = 2 . Specifically,
C j t = 2 A P L j t × R B D j t / A P L j t + R B D j t 2 1 2
where A P L j t , R B D j t , and C j t are the level of agricultural production subsystem, the level of rural banking subsystem, and the degree of coupling betweem two subsystems in province j at time t, respectively.
Because the coupling method can only evaluate the strength of an interaction but cannot reflect the development of systems, it integrates the comprehensive coordination method to remedy this defect [93,95]. The comprehensive coordination index captures the overall level of agricultural production and rural banking development. The computation formula of comprehensive coordination index T j t in province j at time t is presented in Equation (12):
T j t = α × A P L j t + β × R B D j t
where both α and β are set as 0.5 to reflect the equal significance of the agricultural production subsystem and rural banking subsystem to rural economic development.
The degree of coupling and the level of comprehensive coordination index are integrated as follows:
D j t = C j t × T j t
Equations (11)–(13) show the calculation of coupling coordination degree. Besides, the levels of agricultural production and rural banking development should all be normalized as Equation (4) before calculating the coupling coordination degree.

3.2.4. Impact of Reform on Agricultural Development

As the RCC shareholding reform is gradual, we cannot identify the unified time of all the counties. In addition, we cannot distinguish the control group and the treated group at the provincial level, either. It is unsuitable to employ a policy evaluation method, such as difference-in-difference, with a provincial panel. Hence, this study uses the proportion of counties finishing institutional form change to all the counties ( P r o g r e s s j t ) in j t h province at year t as the proxy of process of reform. The higher value indicates greater progress in this reform at provincial level, and we trisect the value of P r o g r e s s j t from high to low and each group contains 10 provinces. Then we make a comparison between a group with higher- P r o g r e s s j t and the group with the lower- P r o g r e s s j t to capture the effect of RCC shareholding reform preliminarily.
We also take year 2012 as a dividing time and compare whether the coupling coordination degree increases. If it increases, we can make a preliminary judgement on the effect of reform on the synergism between two subsystems. Based on the measurement of coupling coordination degree D j t , we investigate the impact of the synergism between the agricultural production subsystem and rural banking subsystem on the development rural economy system. Our empirical model is shown in Equation (14).
G j t = β 0 + β j t D j t + γ X j t + ε j t
where G j t represents the indicators proxying the development of the rural economy system of j t h province in year t , namely the growth of the output of agriculture, forestry, animal husbandry and fishery ( A G j t ); the growth of average rural household income ( H I G j t ); and the urban–rural income gap ( G a p j t ). X j t is the control variables matrix used to control differences among sample provinces. Specifically, we choose the loan-to-deposit ratio of rural banking institutions, the non-performing loan ratio, the growth of fixed asset investment, the structure of industries, the intervention of government, the urbanization ratio, the economic openness, and the price level.
And the coefficient β j t is our focus. Employing the growth of the output of agriculture, forestry, animal husbandry, and fishery, and the growth of rural households’ income as dependent variables, the positive value indicates that the coordination of two subsystems can promote the growth and the development of rural economy systems. In addition, taking the urban–rural income gap as the dependent variable, the negative value indicates this coordination plays a positive role in the development of the rural economy system.
All the variables in empirical models are displayed in Table 5.

4. Results

4.1. Sample and Data

We study a sample of 30 Chinese mainland provinces, autonomous regions, and municipalities. Owing to data availability, our sample does not include Tibet, Hong Kong, Macao, or Taiwan. Our data mainly ranges from 2005 to 2017. The statistics descriptions of all the variables used in measurement and empirical model are presented in Table 6.
Table 6 shows that the average growth in output of agriculture, forestry, animal husbandry, and fishery (AG) is 9.1% during the sample period. The average growth in household income (HIG) is higher than the former, with the value of 12.4%. The mean of Gap shows that the average household income in the urban is nearly three times the income of the rural household from 2005 to 2017, and it is evident to see that the average degree of coupling coordination of 30 provinces is 0.469.
From the mean of loan-to-deposit ratio (LDR), we find that 67% of deposits are granted as loans on average. The average NPL ratio is 3%. And the maximum and minimum proportions are 24.6% and 0.4% relatively. This great difference lies in different years, showing asset quality improvement resulting from RCC shareholding reform. In terms of economic variables at the macro level, the average growth in fixed asset investment is 19.6%. The minimum value is −62.7% while the maximum value is up to 59.5%. The mean of SI indicates that the output of secondary industry is around 1.165 times the output of tertiary industry. The average value of a variable reflecting the intervention of government is 2.249, showing the fiscal expenditure is around 2.25 times more than fiscal revenue on average. The average values of urbanization ratio and economic openness are 53% and 15.2%, respectively. The mean value of the price index is 102.712%.

4.2. Estimation Results of Agricultural Production and Rural Banking Development

We estimate the levels of agricultural production, rural banking development, and related dimensions based on the method introduced in Section 3.2.1 and Section 3.2.2. The estimation results are presented in Table 7.
It is evident that the average levels of agricultural production and rural banking development are 0.183 and 0.371, relatively. We also exhibit the index levels by regions. In terms of agricultural production, the mean of the eastern region is the highest (0.278), and the mean of the western region is the lowest (0.107). There is considerable disparity among the provinces. For instance, Beijing (0.773) has the highest level of agricultural production, while Hainan (0.156) in the same region is the lowest in agricultural production. As for rural banking development, the mean of eastern region (0.418) is also the highest among three regions. Beijing has the greatest value. The means of central region (0.354) and the western region (0.341) are nearly at the same level.
The trend of agricultural production level is depicted in Figure 5. We also plot the trends of three regions. The levels of the index are annual averages of all sample provinces. It is clear that the level of Chinese agricultural production nearly stays the same level at the end of sample period but trends upward after 2008. The levels of central region and western region trend upward while the level of eastern region shows a downward trend during the whole sample period. In addition, the trend lines show that agricultural production gets more modernized during the sample period in most provinces.
We depict the levels of Chinese rural banking development of whole sample and different regions in Figure 6. Although showing a violent decline in 2012, all the levels trend up during the sample period. Moreover, Figure 6 also shows that rural banking development in western China has undergone the largest progress among the three regions, as the trend line is located at the bottom in 2005 but turns to be the top in 2017. Generally, the increasing trends indicate that the rural banking subsystem turns out to be a greater shareholding system at the end of the sample period.
Figure 7 plots the index of agricultural production (APL) and shareholding ratio (N7) under different quantiles. It is evident that the level of agricultural production increases accompanied with the rising proportion of rural commercial banks. It implies that there is a positive correlation between the level of agricultural production and the progress of shareholding reform on rural cooperative banks. As the higher level of agricultural production index indicates more modernized production, it can be preliminary inferred that there is synergism between agricultural industrialization and rural commercial banks in China.

4.3. Estimation Results of Coupling Coordination Degree

The results of couple degree (C), the comprehensive coordination index (T), and the coupling coordination degree (D) from 2005 to 2017 are reported at Table 8. The coupling coordination degree of two subsystems trends up during the whole period, showing the increasing synergism between agricultural production and rural banking development.
Specifically, the coupling coordination degree (D) is lower than the critical value of 0.5, showing the conflict between agricultural industrialization and rural credit cooperative. (When the couple coordination degree (D) is lower than 0.5, there is unbalanced development between the agricultural production subsystem and rural banking subsystem. Otherwise, there is balanced development between two subsystems). In addition, the coupling coordination degree leaps over the critical value (0.5) after 2012, the formal implementation of the shareholding reform. The leaping degree indicates that the formal implementation of shareholding reform alleviates the conflict between agricultural industrialization and rural credit cooperative obviously. Therefore, the shareholding reform plays a positive role in the interaction of the agricultural production subsystem and rural banking subsystem indeed.
This leaping trend in our estimation is in line with previous studies. Particularly, Peng and Xu [25] estimate the coupling coordination degree between inclusive financial system and agricultural production system. The degree also leaps after 2012 and shows a more balanced interaction between two systems from 2013 to 2017 in China. Wang et al. [96] conducted research on the coupling coordination between rural credit, agricultural insurance, and rural household income. The estimation shows a leap in 2014, which indicates there is balanced development between three systems.

4.4. Empirical Analysis

Before the regression analysis, the provinces in different phases of RCC shareholding reform are compared to make more explanations on the effect of reform. We use the proportion of counties finishing institutional transformation to all the counties (Progress) in j t h province at year t as the proxy of process of reform. The higher value indicates greater progress in this reform at the provincial level. In addition, we trisect the value of P r o g r e s s j t from high to low and each group contains 10 provinces. Then we make a comparison between a group with the higher- P r o g r e s s j t and the group with the lower- P r o g r e s s j t . (Before 2011, there are rural commercial banks only in pilot provinces. After 2017, most provinces finish the institutional form change at the county level, and the provinces in these periods cannot be trisected). The comparisons in different periods are reported in Table 9.
From Table 9, it is clear to see that the difference between two groups in the agricultural growth decreased from −0.029% in 2011 to −0.027% in 2017 despite a downward trend in agricultural growth ratio. It implies that the reform supports agricultural growth generally and reduces the original difference between the two groups before the formal implementation. For rural household income, there is also a reducing difference between provinces with greater reform progress and provinces with lesser progress. However, this difference is nonsignificant. The difference in the urban–rural gap between two groups decreases sharply at first and increases near the end of sample period, indicating the reform exerts greater effect on provinces with greater progress finally. Since RCC shareholding reform is the only institutional form reform in rural areas during this period, these comparisons can reflect that RCC shareholding reform can promote rural economic development.
Based on comparison results, we estimate the panel data with regression. Panel data have the characteristics of both cross-sectional data and time series data, which means that heteroscedasticity or autocorrelation may exist in the error terms and lead to inefficient estimation [77,78]. Thus, it is necessary to test the existence of heteroscedasticity, autocorrelation, and cross-section dependence in the sample data. Then we choose the suitable estimation approach based on the test results.
Following Kim [97], the modified Wald test and the Wooldridge test are conducted to identify heteroscedasticity and autocorrelation, respectively. Considering the missing data in our sample, we employ the Pesaran’s CD test to identify cross-section dependence [79,80]. The test results are reported in Table 10 and p-value for statistics are shown in the parentheses. It is clear that there is heteroscedasticity in all the test regressions, and autocorrelation exists in regression taking HIG as the explained variable while cross-dependence exists in regression taking Gap as the explained variable.
We apply feasible generalized least square (FGLS) approach to estimate Equation (14). This approach allows the provinces’ differences to change the standard errors of each coefficient, and thus can address these issues simultaneously [78,81]. We also control differences from the cross-sectional heteroscedasticity and time series heteroscedasticity through individual and time dummies following Arshed and Kalim [98]. Table 11 reports the FGLS regression results. Three columns report results applying the AG, HIG, and Gap as dependent variables.
When taking AG as the dependent variable, the coefficient of coupling coordination degree (D) is 0.2239 and significant at 5% level. This indicates that the coordination between the agricultural production subsystem and rural banking subsystem promotes the agricultural growth. A 1% increase in the coupling coordination degree could improve the agricultural growth by 0.2239 percent. The second column shows that the coupling coordination degree (0.0046) plays a positive role in the growth of rural residential income, but this positive effect is nonsignificant. The coefficient of D is −0.2083 and significant at 15% level in the third column, implying that the coordination of two subsystems helps reduce the urban–rural income gap. As the synergism (coupling coordination degree) increases after the formal implementation of RCC shareholding reform, these regression results support the first hypothesis.
Table 11 also displays the effects of the control variables. It is clear that the increase in fixed asset investment (FIG) is conducive to promote the growth of agriculture and rural income significantly. In addition, the government intervention (IG) and economic openness (EO) play negative roles in the agricultural growth. Meanwhile, both proportion of tertiary industry (SI) and urbanization ratio (UR) have a significantly negative effect on the urban–rural income gap. CPI also has significant impacts.
From Table 11, we find the positive effects of the synergism between the agricultural production subsystem and rural banking subsystem on agricultural growth and income gap reduction for the period 2005–2017. The coupling coordination degree uplifted obviously after 2012 when shareholding reform on rural credit cooperative was formally implemented. Thus, we assume that the positive effects in post-reform period (2013–2017) may be stronger than the pre-reform one (2005–2012). On the basis of standardizing variables, we divide our sample into two parts with different periods and regress them by FGLS approach. The regression results are presented in Table 12.
Panel A displays results in the pre-reform period. The coefficient of D is significant in the first column, showing the positive effect of coordination on agricultural growth from 2005 to 2012. In the pre-reform period, the coordination between two subsystems has nonsignificant effects on the rural household’s income growth and the urban–rural income gap. Panel B presents the results in the post-reform period. In addition, the coordination plays a significantly positive role in agricultural growth and income gap reduction. The greater value of coefficients in the first and third columns implies that these effects are more pronounced for the post-reform period compared to the pre-reform period. Therefore, the second hypothesis exists in Chinese reality.
The positive effect on economic development in our empirical result is consistent with the previous study investigating the effect of financial reform. Berglof and Lehmann [99] document the positive effect of expansion in the financial system after reform in Russia. Ang [31,32] shows that financial deepening, such as interest rate liberalization, helps stimulate economic growth via increasing technological innovation in India. And Tyers and Golley [34] show the positive effect of financial reform on Chinese economy and the necessity of reform continuation.

5. Conclusions and Policy Implications

Applying the rationale of system isomorphic incentive compatibility, this study evaluates the effect of Chinese RCC shareholding reform on rural economic development. We investigated whether the shareholding reform can promote agricultural growth, farmer income growth, and urban–rural gap reduction through the synergism between the agricultural production subsystem and rural banking subsystem. The theoretical analysis shows that the financial services from rural commercial banks can promote the agricultural industrialization due to their isomorphic relationship, and the similarity and order in their structures leads to the effect of incentive compatibility, which brings the synergism between two subsystems and resultant rural economic development.
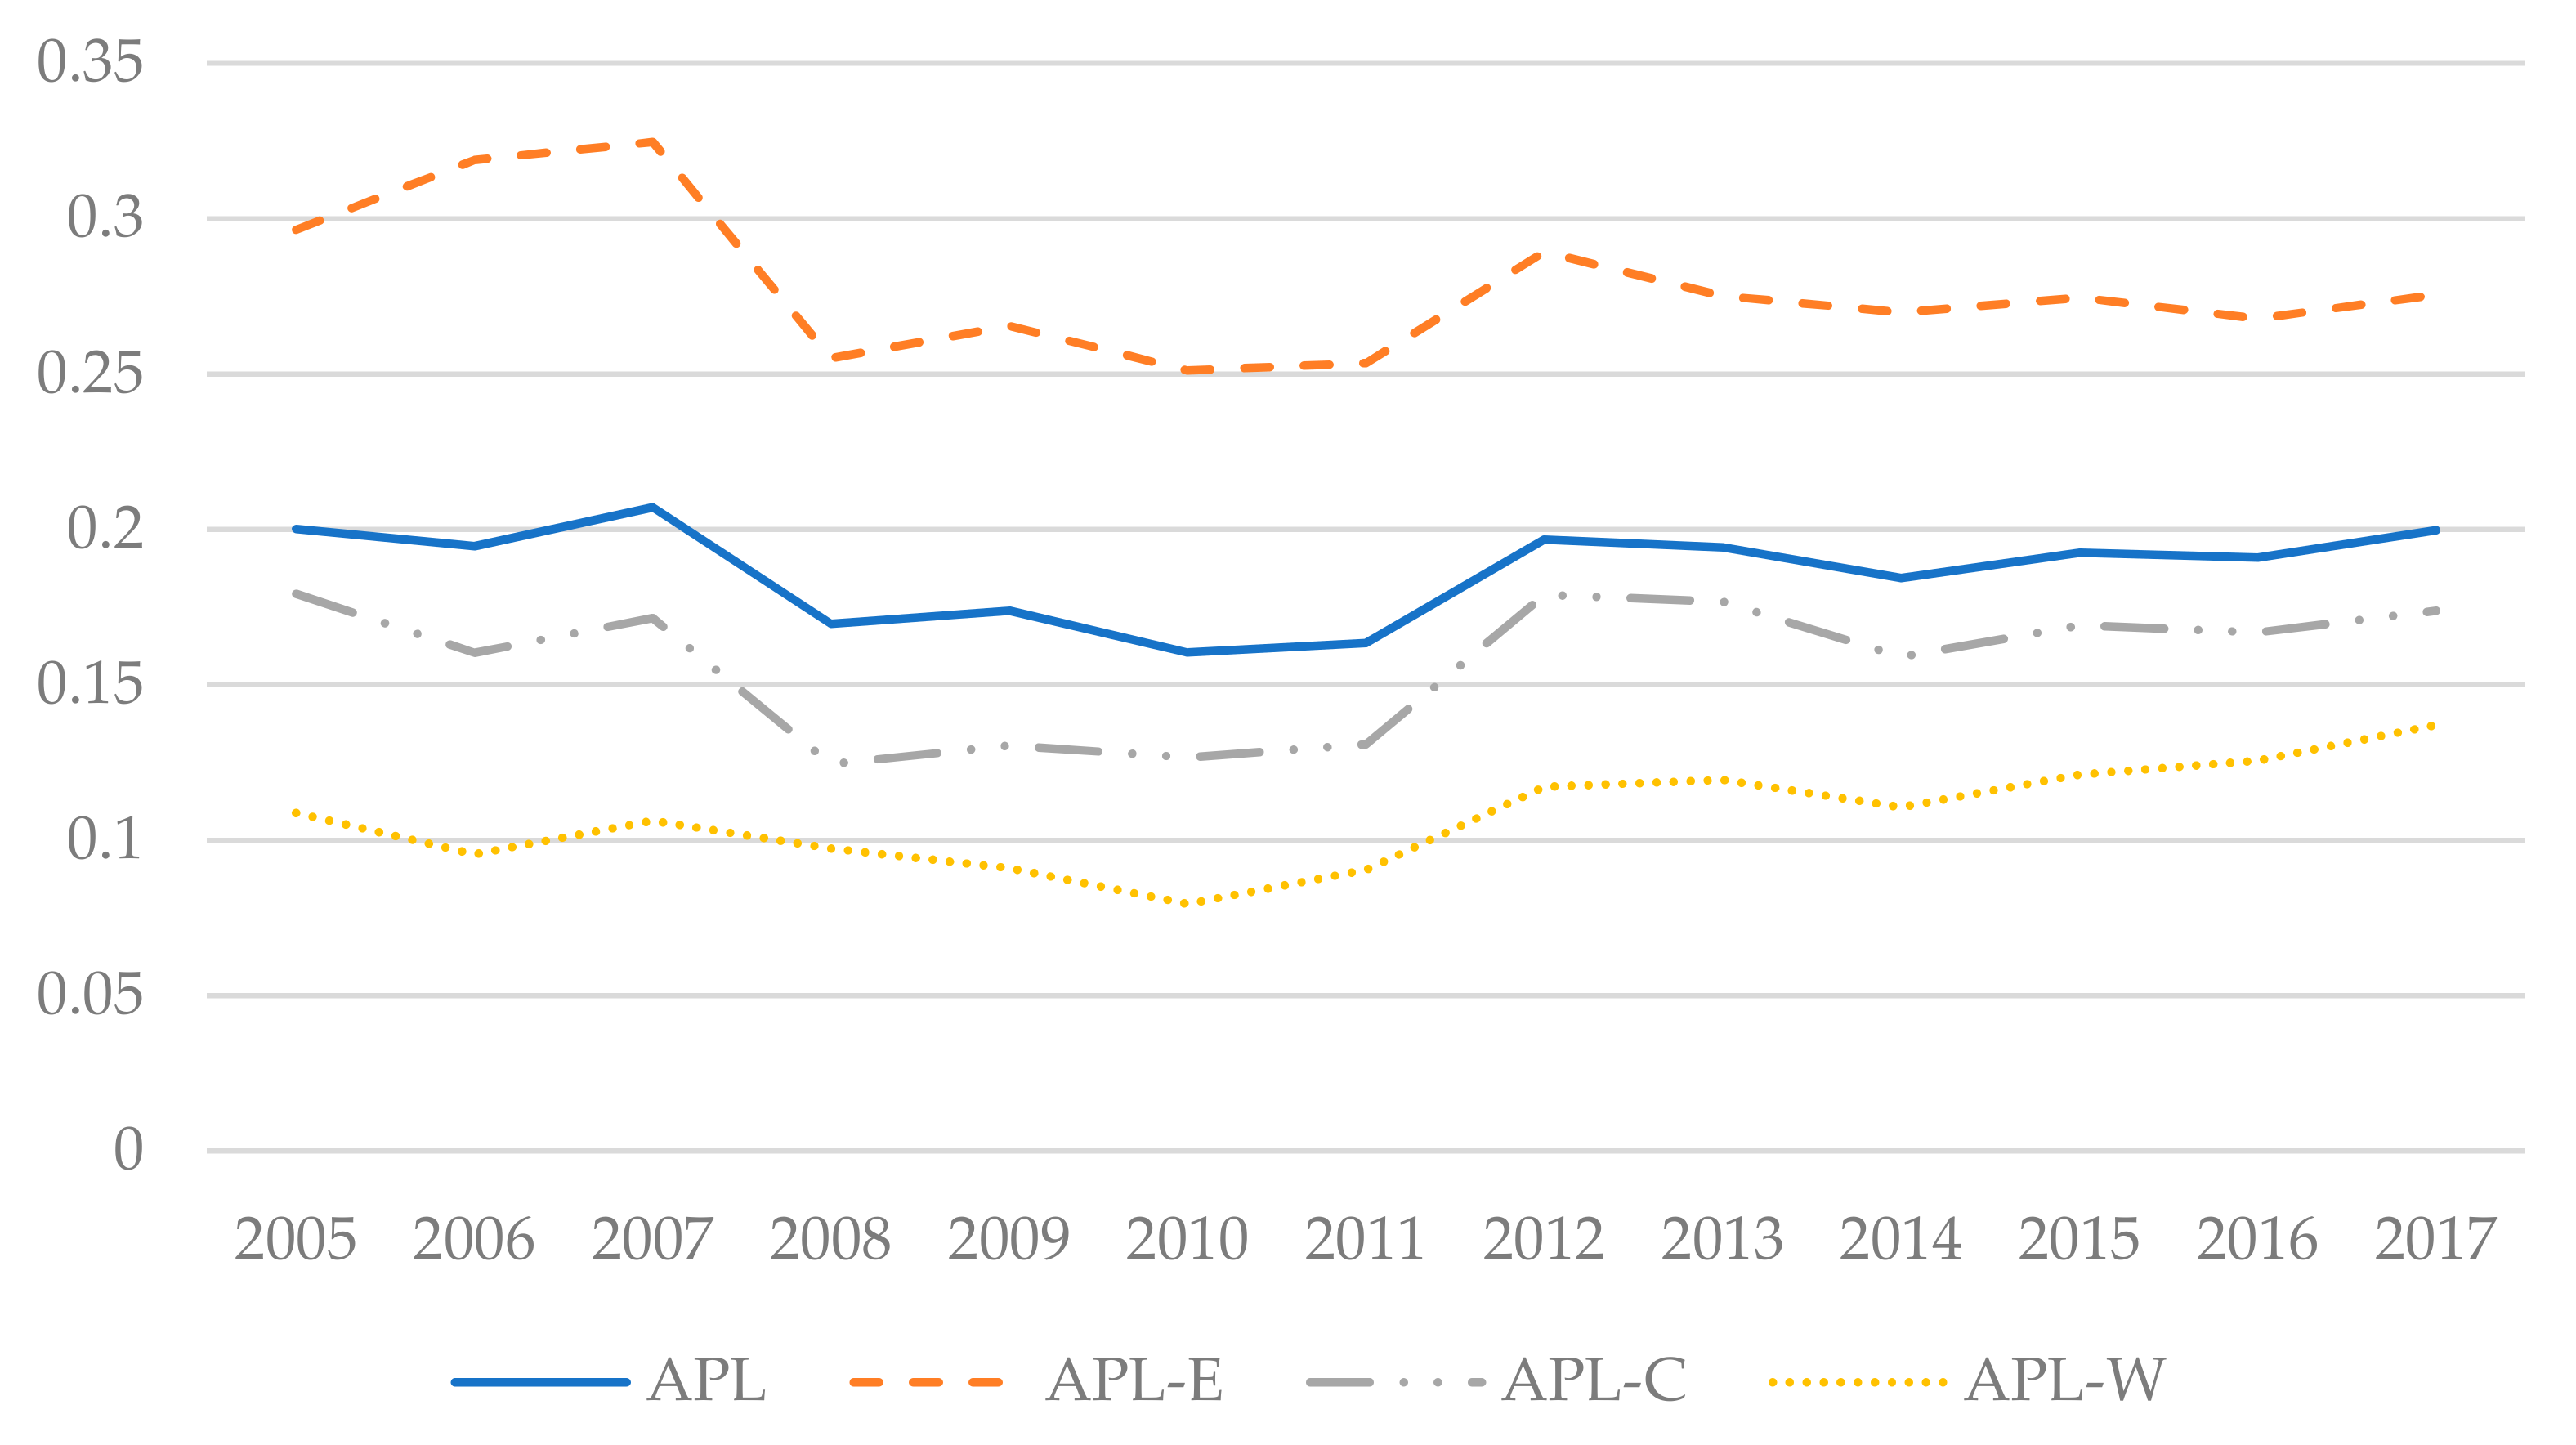
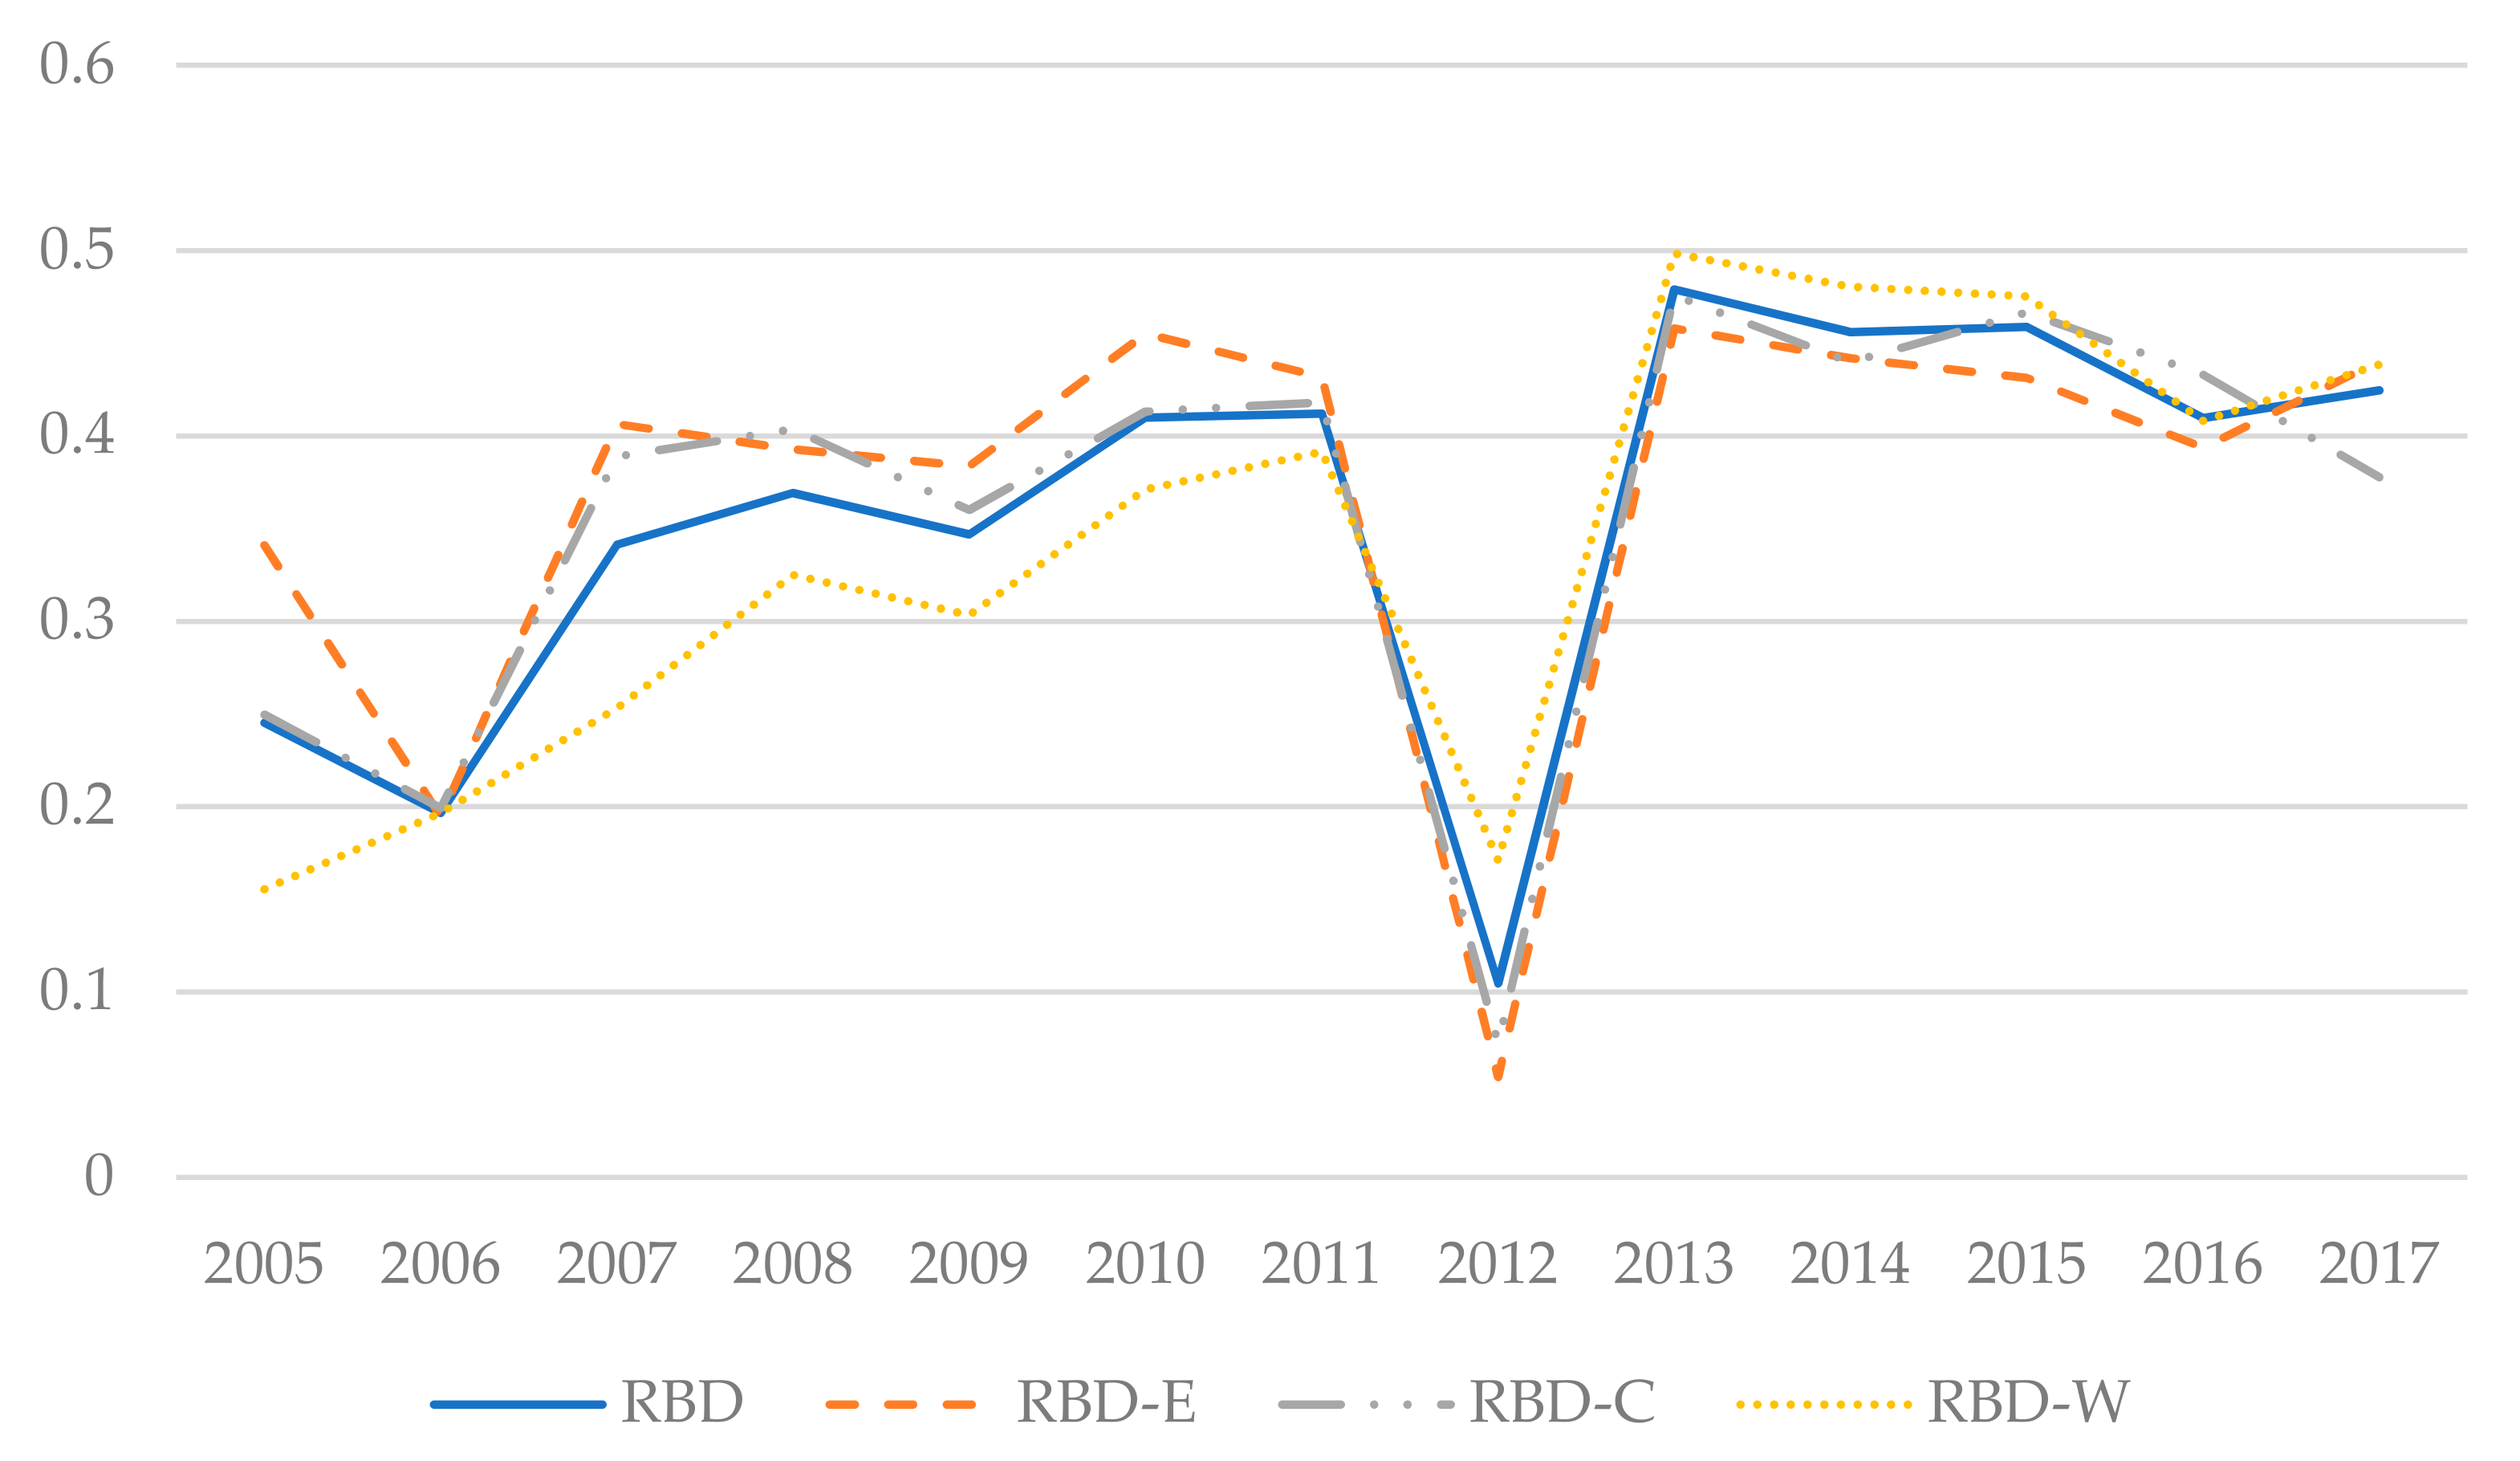
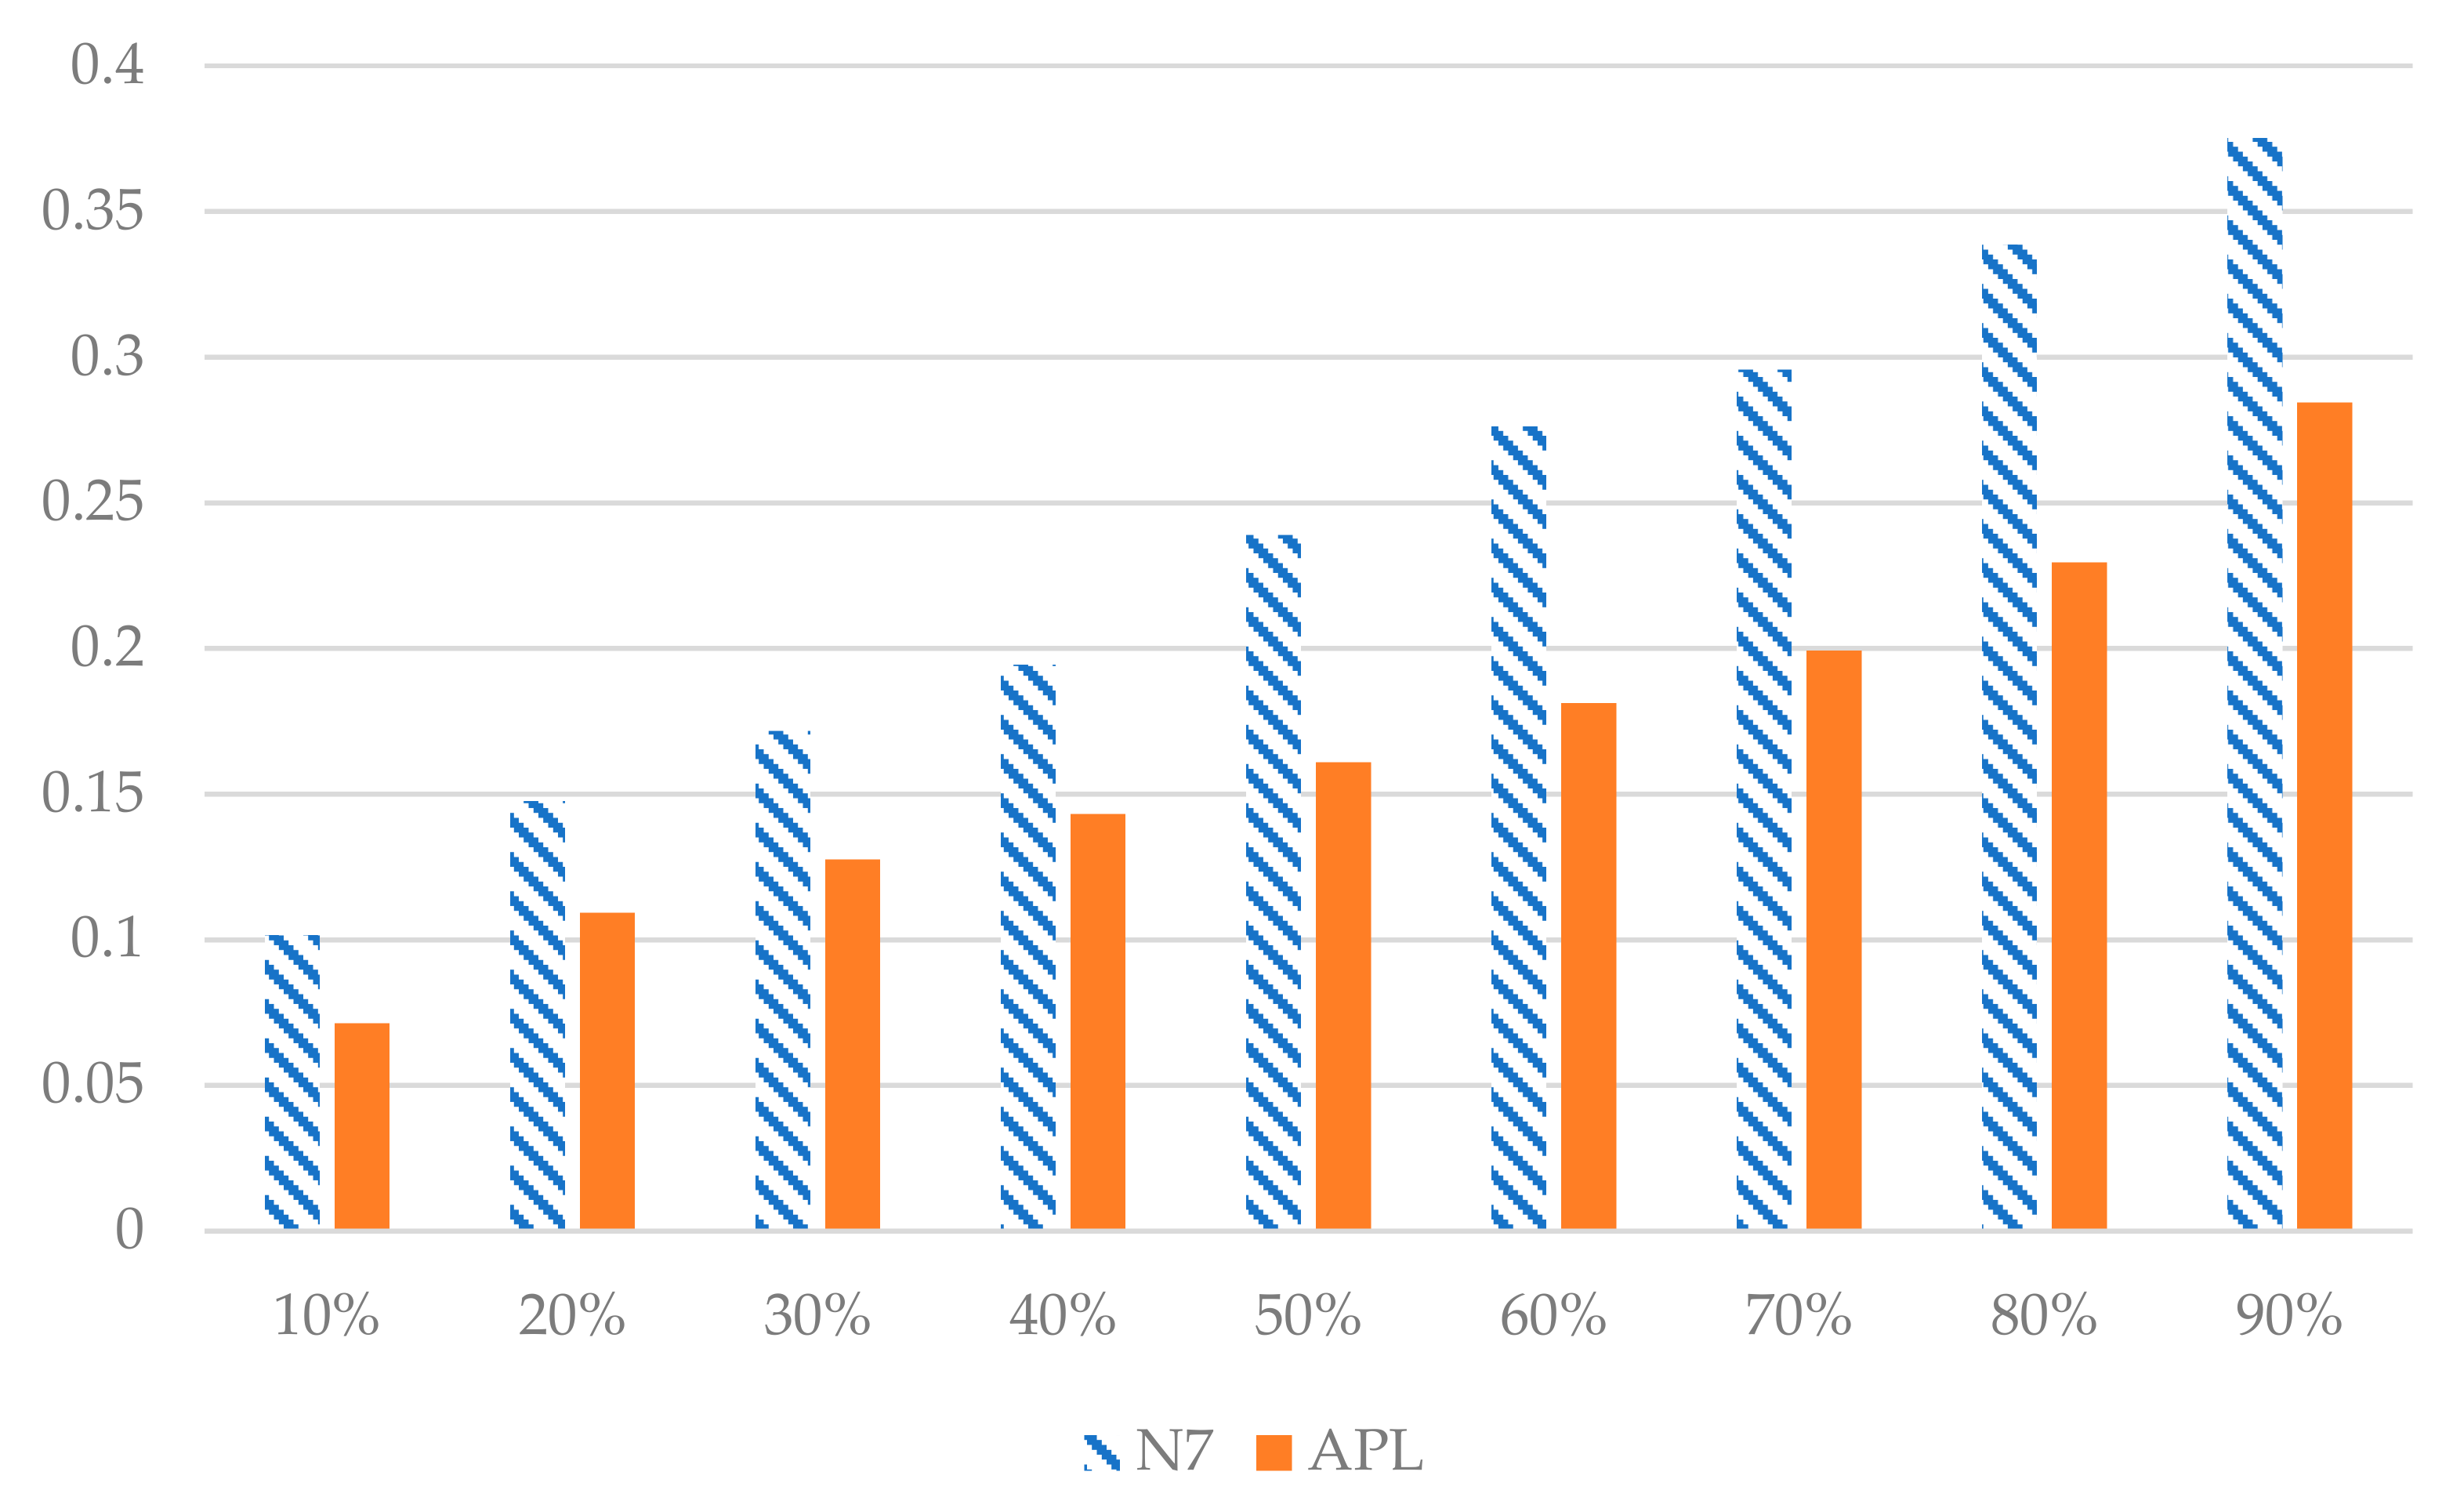
Then, we used a sample of 30 Chinese provinces, autonomous regions, and municipalities for the period 2005 to 2017 in empirical analysis. We estimate that the means of agricultural production index and rural banking development index are 0.183 and 0.371, respectively. We also calculated the coupling coordination degree between the agricultural production subsystem (agricultural production index) and rural banking subsystem (rural banking development index). The calculation result shows an obvious increase, especially after the formal implementation of shareholding reform. Comparing to provinces with lesser reform progress, the provinces with greater progress are influenced more prominently by this reform. Finally, the empirical results indicate that the synergism between two subsystems promotes agricultural growth and urban–rural income gap reduction significantly. The subsample regression shows that these effects get stronger after the formal implementation of shareholding reform in 2012. After reform, 1% increase in the coupling coordination degree could improve the agricultural growth by 0.7758% and reduce the urban-rural income gap by 0.3850% significantly.
Comparing to other studies involved with the rural reform, our study explains the mechanism from the perspective of system science and verifies that RCC shareholding reform plays a positive role in rural economic development through promoting the synergism between the agricultural production subsystem and rural banking subsystem. It makes three-fold contributions to the literature. First, a large body of literature concentrates on the performance of rural reforms on land, taxation, and household immigration from the perspective of agricultural development or agricultural productivity. We examine the effect of reform in rural banking institutions. Second, although existing literature documents the reform-growth nexus in agriculture, farmer income and so on [100,101,102,103,104,105,106,107], they have not identified whether the coordinated interaction and consequent synergism between subsystems inside is the plausible influencing channel. This study estimates the synergism between two subsystems proxied by coupling coordination degree and investigates the effect of the synergism on agricultural growth, farmer income growth, and urban–rural income gap reduction. Finally, we discuss the theoretical mechanism with the rationale of isomorphic incentive compatibility in system science. Specifically, the sustainable development of the rural economic system lies in synergism between its subsystems, which results from their highly similar and ordered structure, balanced interaction, and incentive compatibility. It sheds a light on the study associated with sustainability in rural economy from the perspective of the system science.
This study can provide practical references to both policy makers related with the rural economic development or the shareholding reform and help rural commercial bank function better. First, since RCC shareholding reform is necessary in the process of agricultural industrialization, local government could promote rural economic development through pushing forward the RCC shareholding reform. Second, attention should be paid to not only the development of a single subsystem, but also the synergism between subsystems of the rural economy system. For example, it is not enough to take the improvement of rural banking institutions into consideration. Rather, how to stimulate the synergism between rural banking subsystem and agricultural production subsystem should also become an emphasis in the work of policymakers and rural banking staff. Meanwhile, the leading enterprises in agricultural industrialization and enterprises with government background can become the shareholders of rural commercial banks and participate in the corporate governance in line with requirements. The appropriate participation of government-related enterprises can avoid rural commercial banks serving as leading enterprises solely. Besides, peasants should realize that entering the modernized mode of production makes them more accessible to credit and that they need to cooperate with rural banking institutions rather than regard themselves as the financially excluded. In addition, they also can choose to become the representative of small holders and participate in corporate governance of rural commercial banks. Furthermore, considering the geographic differences in the agricultural production and rural banking development, the focus of their development should vary among regions accordingly.
However, there are some limitations that might be addressed by analysis in the future. A majority of rural commercial banks’ headquarters are located in the county areas, which indicates that it is more appropriate to examine the effect of reform at the county level. However, data on rural banking development is only available at the provincial level, which is unable to measure the level of rural banking subsystem at county level. Due to the data unavailability, we cannot employ a specialized policy evaluation approach to verify whether synergism between two subsystems is the influencing mechanism of reform, such as difference-in-difference (DID), either.

Author Contributions

The authors collaborated on all parts of the research including framing of the study collection and analysis of the documents, and writing of the results. Conceptualization, J.P. and Y.H.; Methodology, J.P., Y.H. and G.L.; Formal analysis, Y.H., S.L. and J.P.; Data curation, S.L. and H.Z.; Writing—original draft preparation, Y.H., S.L. and H.Z.; Writing—review and editing, J.P., Y.H., S.L. and H.Z.; Supervision, J.P; Validation, S.L., H.Z., G.L. and J.P. All authors have read and agreed to the published version of the manuscript.

Funding

This research was funded by the Social Science Foundation of Hunan Province (17YBA087).

Data Availability Statement

Publicly available datasets were analyzed in this study. This data can be found here: http://www.epschinadata.com/ (accessed on 15 October 2020); http://xkz.cbirc.gov.cn/jr/ (accessed on 15 November 2020); https://data.cnki.net/trade/yearbook/single/n2014020005?z=z003 (accessed on 15 November 2020).

Acknowledgments

The authors would like to thank People’s Bank of China, China Banking and Insurance Regulatory Commission and Hunan University for the data disclosure or database providing.

Conflicts of Interest

The authors declare no conflict of interest.

References

  1. Guo, P.; Jia, X. The Structure and Reform of Rural Finance in China. China Agric. Econ. Rev. 2009, 1, 212–226. [Google Scholar] [CrossRef]
  2. Watson, A. Conflicts of Interest: Reform of the Rural Credit Cooperatives in China. MOCT-MOST Econ. Policy Transit. Econ. 1998, 8, 23–40. [Google Scholar] [CrossRef]
  3. Yan, H.R.; Chen, Y.Y. Debating the Rural Cooperative Movement in China, the Past and the Present. J. Peasant Stud. 2013, 40, 955–981. [Google Scholar] [CrossRef]
  4. Piotr, N.; Anna, J.W.; Krzysztof, G. Cooperative Movements in Rural Areas in Contemporary Poland: A Brief Comparison of Farmers’ Attitudes of Members and Non-memebrs of Coooperatives. East. Eur. Ctry. 2016, 22, 151–164. [Google Scholar] [CrossRef] [Green Version]
  5. The People’s Bank of China Official Website. Available online: http://www.pbc.gov.cn/chubanwu/114566/114579/114661/2871965/index.html (accessed on 15 September 2020).
  6. Turvey, C.G.; Xu, X.; Kong, R.; Cao, Y. Attitudinal Asymmetries and the Lender-Borrower Relationship: Survey Results on Farm Lending in Shandong, China. J. Financ. Serv. Res. 2013, 46, 115–135. [Google Scholar] [CrossRef]
  7. The Central People’s Government of the People’s Republic of China Official Website. Available online: http://www.gov.cn/zwgk/2005-08/13/content_22249.htm (accessed on 30 July 2020).
  8. Sina Finance. Available online: http://finance.sina.com.cn/stock/t/20110802/210310248753.shtml (accessed on 15 September 2020).
  9. China Banking and Insurance Regulatory Commission Official Website. Available online: http://www.cbirc.gov.cn/cn/view/pages/govermentDetail.html?docId=894966&itemId=863&generaltype=1 (accessed on 17 February 2021).
  10. Usai, S.; Vannini, M. Banking Structure and Regional Economic Growth: Lessons from Italy. Ann. Reg. Sci. 2005, 39, 691–714. [Google Scholar] [CrossRef] [Green Version]
  11. Barboni, G.; Rossi, C. Does Your Neighbour Know You Better? The Supportive Role of Local Banks in the Financial Crisis. J. Bank. Financ. 2019, 106, 514–526. [Google Scholar] [CrossRef]
  12. Cheng, X.; Degryse, H. The Impact of Bank and Non-Bank Financial Institutions on Local Economic Growth in China. J. Financ. Serv. Res. 2010, 37, 179–199. [Google Scholar] [CrossRef]
  13. Caporale, G.M.; Di Colli, S.; Di Salvo, R.; Lopez, J.S. Local Banking and Local Economic Growth in Italy: Some Panel Evidence. Appl. Econ. 2016, 48, 2665–2674. [Google Scholar] [CrossRef] [Green Version]
  14. Feng, X. Property Rights and Governance of Rural Credit Cooperatives. China Financ. 2016, 18, 58–60. (In Chinese) [Google Scholar]
  15. Kang, S. Research on the Reform of Rural Credit Cooperatives: Case from the Reform of Rural Credit Cooperatives in Linfen City of Shanxi Province. Huabei Financ. 2019, 10, 67–73, 80. (In Chinese) [Google Scholar] [CrossRef]
  16. Yuan, F. Strategic Thinking on the Reform of Rural Credit Cooperatives in the Transition Period. China Rural Financ. 2011, 18, 8–10. (In Chinese) [Google Scholar] [CrossRef]
  17. Dong, Y.; Chen, Q.; Wang, C. How Regional Financial Development Influence Agricultural Credit and Farmers’ Entrepreneurship: Empirical Evidence Based on CHFS. Econ. Theory Bus. Manag. 2020, 6, 72–86. (In Chinese) [Google Scholar] [CrossRef]
  18. Guo, Y.; Han, Q. Profit Level, Support for Agriculture, and Risk Control: Theoretical Analysis and Empirical Tests of the Size Adjustment of Rural Commercial Banks. J. Financ. Res. 2019, 4, 130–148. (In Chinese) [Google Scholar]
  19. Ma, J.; Qi, H.; Wu, B. The Impact of Market-oriented Reform of Financial Institutions on Agricultural Loans: Evidence from Rural Credit Cooperatives’ Conversion into Rural Commercial Banks. Chin. Rural Econ. 2020, 11, 79–96. (In Chinese) [Google Scholar]
  20. Li, G.; Zeng, G. Joint-stock System or Share Cooperative System? A Comparative Study on the Performance of Different Rural Financial Institutions. Financ. Trade Econ. 2013, 9, 43–56. (In Chinese) [Google Scholar] [CrossRef]
  21. Peng, J.; He, J.; Li, Z.; Yi, Y.; Groenewold, N. Regional Finance and Regional Disparities in China. Aust. Econ. Pap. 2011, 49, 301–322. [Google Scholar] [CrossRef]
  22. Schultz, T.W. Transforming Traditional Agriculture; Yale University Press: New Haven, CT, USA, 1964; pp. 22–29, 95–148. [Google Scholar]
  23. Soucie, W.G. Efficient Consumer Response meets the Industrialization of Agriculture. Agribusiness 1997, 13, 349–355. [Google Scholar] [CrossRef]
  24. Hendrickson, M.K.; James, H.S. The Ethics of Constrained Choice: How the Industrialization of Agriculture Impacts Farming and Farmer Behavior. J. Agric. Environ. Ethics 2005, 18, 269–291. [Google Scholar] [CrossRef]
  25. Peng, J.; Xu, X. The Coupling Relationship and Coordinated Development between Agricultural Industrialization and Inclusive Finance: A Case Study of Hunan Province. Theory Pract. Financ. Econ. 2019, 5, 19–26. (In Chinese) [Google Scholar] [CrossRef]
  26. Ministry of Agriculture ang Rural Affairs of the People’s Republic of China Official Website. Available online: http://www.moa.gov.cn/govpublic/zcggs/202102/t20210203_6361060.htm (accessed on 9 February 2021).
  27. China Family Panel Studies Home Page. Available online: http://isss.pku.edu.cn/cfps/download/login (accessed on 17 February 2021).
  28. Li, Q. Resilience Thinking as a System Approach to Promote China’s Sustainability Transitions. Sustainability. 2020, 12. [CrossRef]
  29. Schumpeter, J. The Theory of Economic Development; Harvard University Press: Cambridge, MA, USA, 1912; pp. 66–108. [Google Scholar]
  30. North, D.C. Sources of Productivity Change in Ocean Shipping, 1600–1850. J. Polit. Econ. 1968, 76, 953–970. [Google Scholar] [CrossRef]
  31. Ang, J.B. Research, Technological Change and Financial Liberalization in South Korea. J. Macroecon. 2010, 32, 457–468. [Google Scholar] [CrossRef]
  32. Ang, J.B. Innovation and Financial Liberalization. J. Bank. Financ. 2014, 47, 214–229. [Google Scholar] [CrossRef] [Green Version]
  33. Wang, X.; Wang, M.; Zheng, L. Does Financial Reform Promote High-Quality Development of Local Economies? Evidence from the Establishment of National Comprehensive Financial Reform Pilot Zones. Comp. Econ. Soc. Syst. 2020, 4, 11–20. (In Chinese) [Google Scholar] [CrossRef]
  34. Tyers, R.; Golley, J. China’s Growth to 2030: The Roles of Demographic Change and Financial Reform. Rev. Dev. Econ. 2010, 14, 592–610. [Google Scholar] [CrossRef]
  35. China Banking and Insurance Regulatory Commission Official Website. Available online: http://www.cbirc.gov.cn/cn/view/pages/ItemDetail.html?docId=890467&itemId=954&generaltype=0 (accessed on 15 September 2020).
  36. Bravo-Ortega, C.; Lederman, D. Agricultural Productivity and its Determinants: Revisiting International Experiences. Estud. Econ. 2004, 31, 133–163. [Google Scholar]
  37. Ciaian, P.; Falkowski, J.; Kancs, D. Productivity and Credit Constraints: A Firm-level Propensity Score Evidence for Agricultural Farms in Central and East European Countries. Acta. Oecon. 2012, 62, 459–487. [Google Scholar] [CrossRef]
  38. Rada, N.; Helfand, S.; Magalhães, M. Agricultural Productivity Growth in Brazil: Large and Small Farms Excel. Food Policy 2019, 84, 176–185. [Google Scholar] [CrossRef]
  39. Špička, J.; Machek, O. Change in the Production Efficiency of European Specialized Milk Farming. Agric. Econ. 2015, 61, 1–13. [Google Scholar] [CrossRef] [Green Version]
  40. Nakano, Y.; Magezi, E.F. The Impact of Microcredit on Agricultural Technology Adoption and Productivity: Evidence from Randomized Control Trial in Tanzania. World Dev. 2020, 133, 104997. [Google Scholar] [CrossRef]
  41. Hu, Y.; Liu, C.; Peng, J.G. Financial Inclusion and Agricultural Total Factor Productivity Growth in China. Econ. Model. 2021, 96, 68–82. [Google Scholar] [CrossRef]
  42. Badunenko, O.; Romero-Ávila, D. Financial Development and the Sources of Growth and Convergence. Int. Econ. Rev. 2013, 54, 629–663. [Google Scholar] [CrossRef] [Green Version]
  43. Kou, M.; Yang, Y.; Chen, K. The Impact of External R&D Financing on Innovation Process from a Supply-Demand Perspective. Econ. Model. 2020, 92, 375–387. [Google Scholar] [CrossRef]
  44. Läpple, D.; Renwick, A.; Thorne, F. Measuring and Understanding the Drivers of Agricultural Innovation: Evidence from Ireland. Food Policy 2015, 51, 1–8. [Google Scholar] [CrossRef]
  45. The Central People’s Government of the People’s Republic of China Official Website. Available online: http://www.gov.cn/xxgk/pub/govpublic/mrlm/200803/t20080328_32385.html (accessed on 6 February 2021).
  46. Charumilind, C.; Kali, R.; Wiwattanakantang, Y. Connected Lending: Thailand before the Financial Crisis. J. Bus. 2006, 79, 181–218. [Google Scholar] [CrossRef]
  47. Agusman, A.; Cullen, G.S.; Gasbarro, D.; Monroe, G.S.; Zumwalt, J.K. Government Intervention, Bank Ownership and Risk-taking during the Indonesian Financial Crisis. Pac-Basin. Financ. J. 2014, 30, 114–131. [Google Scholar] [CrossRef] [Green Version]
  48. Claessens, S.; Feijen, E.; Laeven, L. Political Connections and Preferential Access to Finance: The Role of Campaign Contributions. J. Financ. Econ. 2008, 88, 554–580. [Google Scholar] [CrossRef] [Green Version]
  49. Micco, A.; Panizza, U.; Yanez, M. Bank Ownership and Performance Does Politics Matter? J. Bank. Financ. 2007, 31, 219–241. [Google Scholar] [CrossRef] [Green Version]
  50. Tan, J.; Jian, Y.; Chen, Y. The government Intervention and Non-performing Loans: An Analysis Based on the Data During 1988–2005 from a State-owned Bank. Manag. World 2012, 7, 29–43, 187. (In Chinese) [Google Scholar] [CrossRef]
  51. China Banking and Insurance Regulatory Commission Official Website. Available online: http://www.cbirc.gov.cn/cn/view/pages/govermentDetail.html?docId=272981&itemId=868&generaltype=1 (accessed on 19 February 2021).
  52. China Banking and Insurance Regulatory Commission Official Website. Available online: http://www.cbirc.gov.cn/cn/view/pages/govermentDetail.html?docId=274310&itemId=868&generaltype=1 (accessed on 19 February 2021).
  53. Available online: http://www.cbirc.gov.cn/cn/view/pages/ItemDetail.html?docId=33482&itemId=928&generaltype=0 (accessed on 19 February 2021).
  54. Bertalanffy, L.V. General System Theory: Foundations, Development, Applications; George Braziller Inc.: New York, NY, USA, 1986; pp. 28–68. [Google Scholar]
  55. Wiener, N. Cybernetics: Or Control and Communication in the Animal and the Machine; MIT Press: Cambridge, MA, USA; Wiley: New York, NY, USA, 1961; pp. 157–192. [Google Scholar]
  56. Nicolis, G.; Prigogine, I. Self-Organization in Non-Equilibrium Systems; Wiley: New York, NY, USA, 1977; Chapters 4 and 8. [Google Scholar]
  57. Bank, W. System Approach for Better Education Results (SABER): What Matters Most in Teacher Policies? A Framework for Building a More Effective Teaching Profession. Secur. Commun. Netw. 2014, 7, 503–510. [Google Scholar] [CrossRef]
  58. Falk, J.H.; Dierking, L.D.; Osborne, J.; Wenger, M.; Dawson, E.; Wong, B. Analyzing Science Education in the United Kingdom: Taking a System-Wide Approach. Sci. Ed. 2015, 99, 145–173. [Google Scholar] [CrossRef]
  59. Chen, W.; Marchant, M.; Muhammad, A. China’s soybean product imports: An analysis of price effects using a production system approach. China Agric. Econ. Rev. 2012, 4, 499–513. [Google Scholar] [CrossRef]
  60. Liu, Y.; Xu, J.; Luo, H. An Integrated Approach to Modelling the Economy-Society-Ecology System in Urbanization Process. Sustainability 2014, 6, 1946–1972. [Google Scholar] [CrossRef] [Green Version]
  61. Peng, J. The System Approach in Assets-Liabilities Management of Commercial Banks. In The Collected Works of PENG JIAN GANG; China Financial Publishing House: Beijing, China, 2018; Volume 3, pp. 21–27. [Google Scholar]
  62. Deng, X.; Jiao, J.; Li, A. The Transformation of Rural Commercial Banks: Current Situation Obstacles and the Optimal Path—The Case of S City. Financ. Regul. Res. 2016, 12, 92–104. (In Chinese) [Google Scholar] [CrossRef]
  63. Wu, J. System Philosophy; People’s Publishing House: Beijing, China, 2008; pp. 215–222. [Google Scholar]
  64. Klír, J.; Valach, M. Cybernetic Modeling; Iliffe Books Ltd.: London, UK, 1967; pp. 109, 308–311. [Google Scholar]
  65. Allen, P.M. Complexity and Management. In Handbook of the Philosophy of Science: Philosophy of Complex Systems; Hooker, C., Ed.; North-Holland Mathematical Library; Elsevier: Amsterdam, The Netherlands, 2011; pp. 783–808. [Google Scholar]
  66. Peng, J. Discussion on Modelling Method in Cynernetics. In The Collected Works of PENG JIAN GANG; China Financial Publishing House: Beijing, China, 2018; Volume 5, pp. 361–379. [Google Scholar]
  67. North, D.C. Institutions, Institutional Change, and Economic Performance; Cambridge University Press: Cambridge, UK, 1990; pp. 3–17. [Google Scholar]
  68. Xu, L.C.; Zhu, T.; Lin, Y. Politician control, agency problems and ownership reform. Econ. Transit. 2005, 13, 1–24. [Google Scholar] [CrossRef]
  69. Xie, P. Reforms of China’s Rural Credit Cooperatives and Policy Options. China Econ. Rev. 2003, 14, 434–442. [Google Scholar] [CrossRef]
  70. Liu, X.; Liu, L.; Liu, H. Shareholding Reform Performance of RCC: Case Study. Financ. Econ. 2013, 8, 28–38. (In Chinese) [Google Scholar] [CrossRef]
  71. de Graaf, W.A. Lie Algebras: Theory and Algorithms; North-Holland Mathematical Library; Elsevier: Amsterdam, The Netherlands, 2000; Volume 56, pp. 143–218. Available online: https://www.sciencedirect.com/bookseries/north-holland-mathematical-library/vol/56/suppl/C (accessed on 9 February 2021).
  72. Shi, W.F. Entropy Analysis of the Coupled Human–Earth System: Implications for Sustainable Development. Sustainability 2017, 9, 1264. [Google Scholar] [CrossRef] [Green Version]
  73. Gong, Q.; Chen, M.; Zhao, X.; Ji, Z. Sustainable Urban Development System Measurement Based on Dissipative Structure Theory, the Grey Entropy Method and Coupling Theory: A Case Study in Chengdu, China. Sustainability 2019, 11, 293. [Google Scholar] [CrossRef] [Green Version]
  74. Yuan, Y.; Jin, M.; Ren, J.; Hu, M.; Ren, P. The Dynamic Coordinated Development of a Regional Environment-Tourism-Economy System: A Case Study from Western Hunan Province, China. Sustainability 2014, 6, 5231–5251. [Google Scholar] [CrossRef] [Green Version]
  75. China National Knowledge Infrastructure Home Page. Available online: https://data.cnki.net/trade/yearbook/single/n2014020005?z=z003 (accessed on 15 November 2020).
  76. Clapham, J.H. An Economic History of Modern Britain; Cambridge University Press: Cambridge, UK, 1926. [Google Scholar]
  77. Pressnell, L.S. Country Banking in the Industrial Revolution; Clarendon Press: Oxford, UK, 1956; Chapter 2. [Google Scholar]
  78. Brunn, M.; Diefenbacher, A.; Strain, J.J. Are There Effects of Consultation–Liaison-Psychiatry on Length of Stay in the General Hospital? A Path Analysis. Eur. J. Psychiat. 2020, 34, 195–201. [Google Scholar] [CrossRef]
  79. Chai, J.; Guo, J.E.; Meng, L.; Wang, S.Y. Exploring the Core Factors and its Dynamic Effects on Oil Price: An Application on Path Analysis and BVAR-TVP Model. Energy Policy. 2011, 39, 8022–8036. [Google Scholar] [CrossRef]
  80. Park, E.S.; Fitzpatrick, K.; Das, S.; Avelar, R. Exploration of the Relationship among Roadway Characteristics, Operating Speed, and Crashes for City Streets using Path Analysis. Accid. Anal. Prev. 2021, 150, 105896. [Google Scholar] [CrossRef]
  81. Shanin, T. Peasants and Peasant Societies; Harmondsworth: Penguin, UK, 1976; pp. 102–197. [Google Scholar]
  82. Bryceson, D.F. Gender and Generational Patterns of African Deagrarianization: Evolving Labour and Land Allocation in Smallholder Peasant Household Farming, 1980–2015. World Dev. 2019, 113, 60–72. [Google Scholar] [CrossRef]
  83. Cao, J.; Zhao, L.; Liu, S.; Yu, X. Transformation of Agricultural Production Patterns in Agriculture and Animal Husbandry and its Determinants: An Empirical Analysis on Transformation in Beef Breeding in China by using a Finite Mixture Model. Chin. Rural Econ. 2019, 11, 69–82. (In Chinese) [Google Scholar]
  84. Coase, R.H. The Nature of the Firm. Economica 1937, 4, 386–405. [Google Scholar] [CrossRef]
  85. Yang, X.K. Specialization and Economic Organization: A New Classical Economics Framework; Economic Science Press: Beijing, China, 1999; pp. 396–413. [Google Scholar]
  86. Li, Y.; Gao, Y. Trading Efficiency, Financial Development and Economic Growth. Res. Inst. Econ. 2010, 2, 52–75. (In Chinese) [Google Scholar]
  87. Huang, H. Research on the Establishment of Evaluation Index System and Evaluation Method of Agricultural Industrialization Management—Based on Evidence from Guangdong Province. J. Agrotech. Econ. 2013, 7, 110–117. (In Chinese) [Google Scholar] [CrossRef]
  88. Sun, Z. Operational Benefit Analysis of Modern Agricultural Industrialization Consortium—An Empirical Framework and Demonstration. East China Econ. Manag. 2015, 29, 108–112. (In Chinese) [Google Scholar] [CrossRef]
  89. Lou, F. Analysis of the Level of Regional Characteristic Agricultural Industrialization and Spatial Correlation. Stat. Decis. 2019, 35, 91–96. (In Chinese) [Google Scholar] [CrossRef]
  90. Liu, Q.; Wang, S.; Zhang, W.; Li, J.; Zhao, Y.; Li, W. China’s Municipal Public Infrastructure: Estimating Construction Levels and Investment Efficiency using the Entropy Method and a DEA Model. Habitat Int. 2017, 64, 59–70. [Google Scholar] [CrossRef]
  91. Lin, P.C.; Huang, H.C. Financial Sector Volatility, Banking Market Structure and Exports. World Econ. 2014, 37, 1388–1409. [Google Scholar] [CrossRef]
  92. Wang, R.; Cheng, J.; Zhu, Y.; Lu, P. Evaluation on the Coupling Coordination of Resources and Environment Carrying Capacity in Chinese Mining Economic Zones. Resour. Policy 2017, 53, 20–25. [Google Scholar] [CrossRef]
  93. Cheng, L.; Zhang, J. Assessment of Coupling Coordination between Tourism Development and Economic Growth after the 2008 Wenchuan earthquake: Beichuan, China. Asia Pac. J. Tour. Res. 2020, 25, 592–609. [Google Scholar] [CrossRef]
  94. Illingworth, V. The Penguin Dictionary of Physics; Foreign Language Press: Beijing, China, 1996; pp. 92–93. [Google Scholar]
  95. Li, L.Y.; Weng, G.M. An Integrated Approach for Spatial Analysis of the Coupling Relationship between Tourism Footprint and Environment in the Beijing–Tianjin–Hebei Region of China. Asia Pac. J. Tour. Res. 2016, 11, 1198–1213. [Google Scholar] [CrossRef]
  96. Wang, Q.; Wang, Y.; Zhu, Y. Research on the coupling and coordinated development of agricultural insurance, agricultural loan and farmers’ income in China. World Agric. 2021, 1, 109–119, 131. (In Chinese) [Google Scholar] [CrossRef]
  97. Kim, B.N.; Lee, N.S.; Wi, J.H.; Lee, J.K. The Effects of Slack Resources on Firm Performance and Innovation in the Korean Pharmaceutical Industry. Asian J. Technol. Inno. 2017, 25, 387–406. [Google Scholar] [CrossRef]
  98. Arshed, N.; Kalim, R. Modelling Demand and Supply of Islamic Banking Deposits. Int. J. Fin. Econ. 2020, 1, 1–19. [Google Scholar] [CrossRef]
  99. Berglof, E.; Lehmann, A. Sustaining russia’s growth: The role of financial reform. J. Comp. Econ. 2009, 37, 198–206. [Google Scholar] [CrossRef]
  100. Lin, J.Y. Rural Reforms and Agricultural Growth in China. Am. Econ. Rev. 1992, 82, 34–51. [Google Scholar] [CrossRef]
  101. Wang, Q.X.; Zhang, X.L. Three Rights Separation: China’s Proposed Rural Land Rights Reform and Four Types of Local Trials. Land Use Policy 2017, 63, 111–121. [Google Scholar] [CrossRef]
  102. Liu, Z.; Yang, D.; Wen, T. Agricultural Production Mode Transformation and Production Efficiency: A Labor Division and Cooperation Lens. China. Agric. Econ. Rev. 2019, 11, 160–179. [Google Scholar] [CrossRef]
  103. Xu, W.; Tan, K.C. Impact of Reform and Economic Restructuring on Rural Systems in China: A Case Study of Yuhang, Zhejiang. J. Rural Stud. 2002, 18, 65–81. [Google Scholar] [CrossRef]
  104. Wu, X.G. The Household Registration System and Rural-Urban Educational Inequality in Contemporary China. Chin. Sociol. Rev. 2011, 44, 31–51. [Google Scholar] [CrossRef]
  105. Xu, H.Z.; Liu, Y.X. Policy Implications and Impact of Household Registration System on Peasants’ Willingness to Return Rural Residential Lands: Evidence from Household Survey in Rural China. Panoeconomicus 2016, 63, 135–146. [Google Scholar]
  106. Xu, C.; Wang, H.; Shi, Q. Farmers’ Income and Production Responses to Rural Taxation Reform in Three Regions in China. J. Agric. Econ. 2012, 63, 291–309. [Google Scholar] [CrossRef]
  107. Alm, J.; Liu, Y.Z. China’s Tax-for-Fee Reform and Village Inequality. Oxf. Dev. Stud. 2014, 42, 38–64. [Google Scholar] [CrossRef]
Figure 2. The Sustainable development of the rural economic system. S1, S2 denote the first, the second subsystem inside the rural economic system. The shapes denote elements inside the subsystems. Source: Based on authors’ own work.
Sustainability 13 02844 g002
Figure 3. Isomorphic Relationship between Subsystem S1 and Subsystem S2. Source: Based on authors’ own work.
Sustainability 13 02844 g003
Figure 4. Path Analysis. Source: Based on authors’ own work.
Sustainability 13 02844 g004
Figure 5. Trends of Agricultural Production Level. APL—level of agricultural production; APL-E—level of agricultural production in eastern region; APL-C—level of agricultural production in central region; APL-W—level of agricultural production in western region. Source: Based on authors’ own work.
Sustainability 13 02844 g005
Figure 6. Trends of rural banking development level. RBD—level of rural banking development; RBD-E—level of rural banking development in eastern region; RBD-C—level of rural banking development in central region; RBD-W—level of rural banking development in western region. Source: Based on authors’ own work.
Sustainability 13 02844 g006
Figure 7. Trends of agricultural production index and shareholding ratio under different quantiles. Source: Based on authors’ own work.
Sustainability 13 02844 g007
Table 2. Comparison between Elements of Two Subsystems.
ElementsSmall-Peasant ProductionRural Credit CooperativeAgricultural IndustrializationRural Commercial Bank
Operating ObjectiveSelf-sufficientMutual aidProfit maximizationProfit maximization
Corporate GovernanceNoneOne member one voteOne share one voteOne share one vote
Transaction EfficiencyLowLowHighHigh
Capital RaisingMainly from self-owned fundsMainly from members’ self-owned fundsFrom self-owned funds, loans, and other social capitalFrom shareholders’ self-owned funds and social capital
Scale Effect of FundsNoneNoneLargeLarge
Degree of SpecializationLowLowHighHigh
Risk ResistanceLowLowHighHigh
Staff Skills NeededLowLowHighHigh
Business ScopeSmallSmallLargeLarge
Degree of MarketizationLowLowHighHigh
Source: Based on authors’ own work.
Table 3. Index of Agricultural Production.
DimensionsIndicatorsCalculation
ConditionX1 Proportion of mechanical cultivationPlanted area cultivated using farm machinery/Planted area
X2 Proportion of effective irrigated areaPlanted area equipped with water conservancy facilities/Planted area
X3 Average agricultural machinery powerPower of agicultural machines/Agricultural working population
EfficiencyX4 Average output of agriculture, forestry, animal husbandry and fisheryOutput of agriculture, forestry, animal husbandry and fishery/Rural population
X5 Average agricultural outputOutput of agriculture/Planted area
ScaleX6 Average sown area Sown area/Primary Industry working population
X7 Average agriculture fixed asset investmentAgriculture fixed asset investment/Rural population
StructureX8 Proportion of animal husbandry and fisheryOutput of animal husbandry and fishery/Output of agriculture, forestry, animal husbandry and fishery
ProfitX9 Commercial rate of agricultural productsMarket value of agricultural products/Output of agriculture
Source: Based on authors’ own work.
Table 4. Index of Rural Banking Development.
DimensionsIndicatorsCalculation
ScaleN1 Average deposit Deposit of rural banking institutions/Number of rural banking institutions
N2 Average loan Loan of rural banking institutions/Number of rural banking institutions
MarketN3 Deposit market share Deposit of rural banking institutions/Gross deposit of banking
N4 Loan market shareLoan of rural banking institutions/Gross loan of banking
UtilityN5 Deposit ratioDeposit of rural banking institutions/Output of agriculture, forestry, animal husbandry and fishery
N6 Loan ratioLoan of rural banking institutions/Output of agriculture, forestry, animal husbandry and fishery
StructureN7 Shareholding ratioNumber of rural commercial banks/Number of rural banking institutions
Source: Based on authors’ own work.
Table 5. Variables.
Table 5. Variables.
SymbolVariableDefinition or Calculation
AGGrowth of the output of agriculture, forestry, animal husbandry, and fisheryIncrement of output in year t/Output of agriculture, forestry, animal husbandry and fishery in year t − 1
HIGGrowth of rural households’ incomeIncrement of average household income in year t/Average household income in year t − 1
GapUrban–rural income gapAverage urban household income/Average rural household income
DSynergism between agricultural production subsystem and rural banking subsystemCalculation results of coupling coordination degree model
LDRLoan-to-deposit ratioLoan of rural banking institutions/Deposit of rural banking institutions
NPLNon-performing loan ratioNon-performing loan/Gross loan of banking institutions
FIGGrowth of fixed asset investment Increment of fixed asset investment in year t/Fixed asset investment in year t − 1
SIStructure of industryOutput of the secondary industry/Output of the tertiary industry
IGIntervention of governmentFiscal expenditure/Fiscal revenue
URUrbanization ratioPopulation in Urban areas/Gross population
EOEconomic opennessIncrement of foreign direct investment in year t/Foreign direct investment in year t − 1
CPIPrice levelConsumer price index
Source: Based on authors’ own work.
Table 6. Descriptive Statistics.
VariablesObsMeanStandard DeviationMinMax
Agricultural Production Variables
X13900.7860.4330.0493.389
X23900.5420.3400.1453.133
X33903.4261.7230.6768.265
X43901.2720.7000.1753.828
X53903.8362.5360.53016.190
X63900.6100.2890.2481.975
X73900.1280.0700.0070.382
X83900.4010.0890.1650.635
X93730.4551.3630.00112.210
Rural Banking Development Variables
N13390.9333.8880.00071.902
N23380.6272.7390.04550.590
N33410.1020.0460.0000.223
N43400.0950.0470.0020.223
N53410.8050.5480.0004.052
N63400.5360.3420.0222.207
N73880.6782.6030.00051.500
Empirical Analysis
AG3900.091 0.088 −0.248 0.423
HIG3900.124 0.043 0.023 0.279
Gap3902.878 0.554 1.845 4.594
D3210.469 0.108 0.000 0.984
LDR3400.670 0.085 0.376 0.983
NPL3600.030 0.039 0.004 0.246
FIG3900.196 0.129 −0.627 0.595
SI3901.165 0.344 0.236 2.003
IG3902.249 0.956 1.052 6.745
UR3900.530 0.140 0.269 0.896
EO3890.152 0.346 −0.847 2.812
CPI390102.712 1.927 97.654 110.087
Progress3900.2550.3680.0001.000
Source: Based on authors’ own work.
Table 7. Estimation Results of Agricultural Production and Rural Banking Development.
Agricultural ProductionRural Banking Development 1
Eastern Region:
Beijing0.773 0.915
Fujian0.204 0.264
Guangdong0.181 0.443
Hainan0.156 0.308
Hebei0.186 0.488
Jiangsu0.244 0.285
Liaoning0.174 0.329
Shandong0.196 0.477
Shanghai0.346
Tianjin0.327 0.356
Zhejiang0.273 0.316
Eastern Mean0.278 0.418
Central Region:
Anhui0.161 0.237
Henan0.161 0.385
Heilongjiang0.205 0.288
Hubei0.145 0.313
Hunan0.181 0.354
Jilin0.145 0.331
Jiangxi0.167 0.385
Shanxi0.089 0.541
Central Mean0.157 0.354
Western Region:
Gansu0.044 0.191
Guangxi0.117 0.310
Guizhou0.040 0.449
Inner Mongolia0.168 0.169
Ningxia0.136 0.466
Qinghai0.101 0.303
Shaanxi0.095 0.327
Sichuan0.102 0.315
Xinjiang0.198 0.364
Yunnan0.054 0.528
Chongqing0.122 0.332
Western Mean0.107 0.341
Total Sample
Mean0.183 0.371
1 The data some indicators for measuring rural banking development in Shanghai is not available during sample period. Source: Based on authors’ own work.
Table 8. Estimation Results of Coupling Coordination Degree.
YearCTD
20050.9190.2410.452
20060.9100.1920.403
20070.8770.2790.477
20080.8430.2760.472
20090.8580.2650.467
20100.7920.2880.466
20110.8110.2860.470
20120.7970.1430.316
20130.8400.3430.532
20140.8370.3240.516
20150.8530.3310.529
20160.8720.3050.513
20170.8760.3120.519
Source: Based on authors’ own work.
Table 9. Comparison between Groups with Different Reform Progress.
VariablesLesser ProgressGreater ProgressDifferencep-Value
Panel A: 2011
AG0.1210.092−0.0290.0692 *
HIG0.1210.1270.0060.3800
Gap3.3572.863−0.4940.0000 ***
Panel B: 2014
AG0.1320.098−0.0340.0055 ***
HIG0.1330.132−0.0000.9905
Gap3.1022.856−0.2460.0073 ***
Panel C: 2017
AG0.1030.075−0.0270.0111 **
HIG0.1250.1250.0000.9727
Gap3.0802.625−0.4550.0000 ***
***, **, * represent 1%, 5% and 10% significance level. Source: Based on authors’ own work.
Table 10. Wald Test, the Wooldridge Test and Pesaran’s CD Test.
Dependent Variable in Regression for TestWald TestWooldridge TestPesaran’s CD Test
AG3066.86 ***0.0020−1.4160
(0.0000)(0.9693)(0.1570)
HIG0.0046 **1.3930−2.010 **
(0.0299)(0.2486)(0.0440)
Gap−0.4313 **229.215 ***−1.5290
(0.1858)(0.0000)(0.1260)
*** and ** represent 1% and 5% significance level. Source: Based on authors’ own work.
Table 11. FGLS Regression Results: Overall Sample 1.
AGHIGGap
D0.2239 **0.0046−0.2083
(0.0889)(0.0565)(0.1313)
LDR−0.0361−0.00020.1468
(0.0714)(0.0136)(0.1234)
NPL0.2077−0.01300.4733
(0.1548)(0.0461)(0.2944)
FIG0.0780 *0.0343 ***−0.0660
(0.0403)(0.0105)(0.0560)
SI−0.00090.0112−0.1717 ***
(0.0258)(0.0098)(0.0494)
IG−0.0441 **0.0021−0.0066
(0.0204)(0.0066)(0.0379)
UR0.07870.1985 **−2.4942 ***
(0.2956)(0.0771)(0.6031)
EO−0.0238 *−0.00550.0125
(0.0124)(0.0043)(0.0145)
CPI0.0137 **−0.00090.0225 **
(0.0066)(0.0019)(0.0093)
Constant−1.3387 **0.11932.7397 ***
(0.6817)(0.1865)(0.9839)
Individual FEYESYESYES
Year FEYESYESYES
Observations295295295
R-squared0.65120.75670.9900
Wald Chi2598.20 (47)3090.91 (12)3870.46 (47)
Number of id282828
1 Standard errors considering heteroscedasticity, autocorrelation and cross-dependence are displayed in parentheses. The degrees of freedom of Wald Chi2 are presented in the parentheses by the side of statistics. ***, **, * represent 1%, 5% and 10% significance level. Source: Based on authors’ own work.
Table 12. FGLS Regression Results in Different Periods.
AGHIGGap
Panel A: Pre-reform subsample regression
D0.2373 ***−0.0115−0.0381
(0.0775)(0.1588)(0.0250)
ControlsYESYESYES
Constant−0.1559−1.33522.6598 ***
(1.0867)(0.9354)(0.2376)
Individual FEYESYESYES
Year FEYESYESYES
Observations179179179
R-squared0.66140.80920.9700
Wald Chi2384.23 (42)161.69 (37)50.67 (7)
Number of id282828
Panel B: Post-reform subsample regression
D0.7758 *−0.1357−0.3850 ***
(0.4138)(0.3042)(0.0827)
ControlsYESYESYES
Constant0.1274−1.24490.5920 ***
(1.1569)(3.0894)(0.1991)
Individual FEYESYESYES
Year FEYESYESYES
Observations116116116
R-squared0.56120.76220.9787
Wald Chi2583.19 (10)6604.81 (42)68793.60 (37)
Number of id252525
*** and * represent 1% and 10% significance level. Source: Based on authors’ own work.
Publisher’s Note: MDPI stays neutral with regard to jurisdictional claims in published maps and institutional affiliations.

