Abstract
The United Nations has adopted 17 sustainable development goals for 2030 with environmental sustainability being one of the main pillars. A key point to address this pillar is the proper management of waste generation. Within the broad spectrum of waste types, food loss and waste is produced worldwide in large quantities. In this framework, the development of composite indexes is recommended to measure the level of compliance of any context with Sustainable Development Goals. This work presents a novel composite index for food loss and waste generation and management systems, the so-called sustainable development goals-food (SDG-Food) index, aiming to determine the level of compliance of any concrete national, regional, or local context regarding five different sustainable development goals with a water-climate-food nexus thinking. The pilot case study of Spain is presented by analyzing the environmental performance between 2015 and 2040 in a context of (i) compliance and (ii) non-compliance with the Paris Agreement targets. Additionally, four different diets are assessed. Results suggested a numerical index score of 13.79, highlighting the categories of eggs, cereals, meat, and vegetables, and the stages of agricultural production and consumption, as the furthers ones for compliance with the five SDG assessed. Moreover, the scenario of compliance with the Paris agreement targets presented better values for all stages, and a vegan diet was highlighted as the one with the best index score.
1. Introduction
Nowadays, freshwater and food access are far from being ensured for a big part of the global population. Moreover, among these problems, food security is being affected by climate change. It is observed especially in African dryland areas and the high mountain regions of Asia and South America, due to declines in yields and crop suitability, as well as impacts in pastoral activities [1]. In this sense, on the one hand, the energy consumption of food systems represents, globally, about 30% of the final energy use [2], and 70% of the world´s freshwater withdrawals are used for agriculture (as well as 78% of the eutrophication in oceans and freshwater reserves). Additionally, food systems produce around 26% of the anthropogenic greenhouse gas emissions [3]. On the other hand, in a global context of increasing population, food production needs and global water use are expected to increase in 2050 by 60% and 50%, respectively [4].
Dietary choices are strong determinants of human health, but recent awareness has grown around the fact that foods and beverages we produce, choose, and consume may significantly affect the environment [5]. According to Clark et al. [6], Mediterranean, pescetarian, vegetarian, and vegan diets could reduce the incidence of diet-related diseases and improve environmental outcomes.
In this framework, in 2015, the United Nations member states adopted 17 sustainable development goals (SDG) that prompte a global political agenda in which environmental sustainability is one of the main pillars. To achieve it, a key point is undoubtedly the proper management of waste generation. Within the broad spectrum of waste types, food loss and waste (FLW) is highly produced worldwide, representing at least one-third of all edible food production [7]. To measure the level of compliance of any national, regional, or local context with the SDG, the development of composite indexes is recommended for providing useful information to decision-makers [8]. Different composite indexes are being established to monitor the progress of sustainable development. The SDG index was originally composed of 77 indicators but now compiles 99 indicators, measuring the degree of sustainability in more than 150 countries [9]. Based on the SDG index, Jabbari et al. [10] presented a composite index called the development index (DEVI), which has a high correlation with the human development index. Moreover, different sectorial indicators already exist. As an example, the SDG-9 index measures a country’s progress towards achieving industry-related targets of the SDG-9 (industry innovation and infrastructure) [11]. Other examples are the multilevel sustainable development index implemented to analyze62 industries in the German economy [12], or the three dimensional resource-efficiency capacity index suggested by Moreno and García-Márquez [13]. Furthermore, there are also indicators with a territorial approach, using data collected and reported sub-nationally, as is the case of the indicator promoted by Alaimo and Maggino [14], which analyses the first three SDGs (no poverty, zero hunger, and good health and well-being) regarding the different Italian regions. In this context, an emerging body of research promotes decision criteria for sustainable FLW management related to the characteristics of food [15], linking different food security and food system dimensions spanning from local to global levels [16]. In this field, Agovino et al. [17] introduced a revised version of the so-called food sustainability index by computing two indices for 25 countries worldwide using data envelopment analysis. Azzurra et al. [18] developed three indices for measuring sustainable food consumption, summarizing a set of variables for (i) assessing organic consumption intensity, (ii) the degree of both food sustainability concerns, and (iii) sustainability in consumers´ lifestyle. Finally, regarding environmental impacts of different diets, Rosi et al. [5] presented the Italian Mediterranean index in order to evaluate the nutritional quality of each diet, concluding that regardless of the environmental benefits of plant-based diets, there is a need for thinking in terms of individual dietary habits.
On the other hand, as the environmental impacts of water use, climate change, and food consumption are closely related to each other, the use of indicators highlighting this kind of linkages is still needed [19]. A good example is the wastewater reuse effectiveness index, which couples biophysical and institutional models of water-energy-food interactions [20]. Moreover, Laso et al. [21] developed an integrated water-energy-food-climate nexus index (WEFCNI). It was used to assess the management of residues from the anchovy canning industry in the region of Cantabria (Spain). Additionally, Leivas et al. [22] presented an integrated index combining the life cycle assessment and linear programming under a water-energy-climate nexus approach implemented in the spirit drinks field as a case study.
This work presents a novel composite index—the SDG-food (SDG-Food) index—which interrelates five SDG (SDG2, SDG6, SDG7, SDG12, SDG13) through three different environmental impacts indicators related to the water-climate-food nexus for the specific analysis of FLW generation at any food supply chain (FSC). All told, it aims to develop a sectorial indicator regarding food systems and to determine which SDG are most important when developing policy strategies to reduce the impact of FLW generation. This indicator aspires to be implemented at different territorial levels, analyzing different stages of the FSC and several categories of food. In order to test the index, the case study of the Spanish FSC was analyzed. The assessment was first developed in the current context (2015) and then in different situations over time between 2015 and 2040 in a framework of (i) compliance (2DS) and (ii) non-compliance with the Paris Agreement targets (BAU). Among the targets, the goal of limiting global warming to well below 2 °C above pre-industrial levels and pursuing efforts to limit it to 1.5 °C stands out [23]. Finally, the evolution of the index in four different diets was also assessed:
- (i)
- An omnivorous/Mediterranean (currently) diet could be considered a plant-oriented dietary approach [5]. The Mediterranean diet represents the crystallization of the centuries-old cooking legacies of different civilizations [24], and is considered one of the healthiest dietary models [25]. It is characterized as containing large amounts of fruits, vegetables, whole grains, legumes, moderate amounts of seafood, and small amounts of other meats. Moreover, olive oil is used as the primary oil [6].
- (ii)
- A pescatarian diet includes fish, dairy products, and eggs. In other words, it is a vegetarian diet including fish and seafood [26].
- (iii)
- A vegetarian diet includes cereals, roots, sugar, vegetable oils, vegetables, fruits, pulses, dairy products, and eggs [26].
- (iv)
- A vegan diet is a vegetarian diet excluding dairy products and eggs [26].
2. Methods
Figure 1 depicts the proposed methodology to determine a composite index to evaluate FLW generation based on water, climate, and nutritional impacts related to the five SDGs: (i) SDG2 to end hunger, to achieve food security and improved nutrition, and to promote sustainable agriculture; (ii) SDG6 to ensure availability and sustainable management of water and sanitation for all; (iii) SDG7 to ensure access to affordable, reliable, sustainable, and modern energy for all; (iv) SDG12 to ensure sustainable consumption and production patterns; and (v) SDG13 to take urgent action to combat climate change and its impacts. From the five goals considered, SDG7 and SDG13 were assumed to represent the climate pillar of the index. In order to quantify those goals, the FLW generated along the whole FSC was transcribed into the global warming potential (GWP), excluding biogenic carbon, selected from the CML v3.06 methodology [27]. The method was selected as a widely used method in the life cycle assessment (LCA) literature [28]. For the nutritional FLW (NFLWF) analysis, SDG2 and SDG12 were considered and determined using the methodology for calculating the so-called nutritional FLW footprint from cradle to gate (NFLWFctog) and nutritional FLW footprint from gate to grave (NFLWFgtog), based on García-Herrero et al. [26]. Finally, SDG6 was assumed to embody the water impacts and was quantified considering the water footprint (WF) results of Batlle-Bayer et al. [29]. The WF is an indicator of freshwater use that looks not only at the direct water use of a consumer or producer but also at the indirect water use [30]. According to Hoekstra et al. [31], the water footprint of a product comprises three color-coded components: (i) green water (water evaporated from soil moisture supplemented by rainfall), blue water (water withdrawn from ground or surface water sources), and gray water (the polluted volume of blue water returned after production). The data used in this work represents only blue water, i.e., the water use for producing the food that was lost or wasted. The selection was due to the fact that blue water assessment is the most used in the literature, being green and gray WF less frequent measurements to date. According to the Organization for Economic Cooperation and Development (OCDE) [32], the first step to obtaining a composite index is to normalize the individual indicators, and thereupon dimensionless values are aggregated using weighting factors. Therefore, after calculating the three proposed indicators related to SDG2, SDG6, SDG7, SDG12, and SDG13; an internal normalization was done, using as reference the highest value in the different food categories.
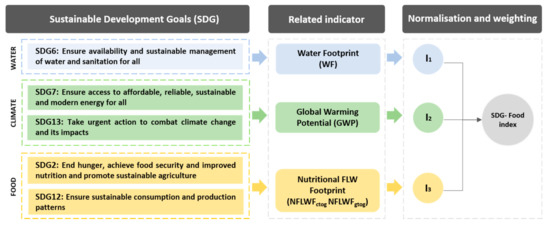
Figure 1.
Conceptual diagram of the sustainable development goals (SDG)-Food index development methodology.
The three dimensionless values are aggregated in the global SDG-Food index, and therefore a weighting process is necessary. The weighting factor for the water and climate pillars was assumed to have a value of one, as they are represented by only one environmental impact category—the WF and the GWP, respectively. On the other hand, as the nutritional loss, representing the food pillar, was assessed by the NFLWFctog and the NFLWFgtog, which together are representing the whole FSC, a weighting factor of 0.5 was implemented.
The index has a minimum limit around 6 and a maximum around 33 (dimensionless). The interest of the presented methodology is (i) the comparability between different stages of a FSC and food categories, and (ii) the comparability of the calculated values of the index with future studies (e.g., countries, regions, cities, etc.).
3. Case Study
3.1. System Description
The methodology was applied to analyze the impacts of FLW generation in Spain along the FSC in 2015 (Figure 2). This case study was selected because Infante-Amate and González de Molina [33] suggested that the present way the country feeds the Spanish population is an inefficient process. However, when comparing between different countries or regions, the subject of a case study and could be addressed in future works. The definition of FLW used in this work refers to FLW occurring at every stage of the FSC [34]. The Spanish basket is divided into 11 food categories: eggs, meat, fish and seafood, dairy products, cereals, sweets, pulses, vegetable oils, vegetables, fruits, and roots. Moreover, the four stages of the FSC included agricultural production, processing/packaging, distribution, and consumption.
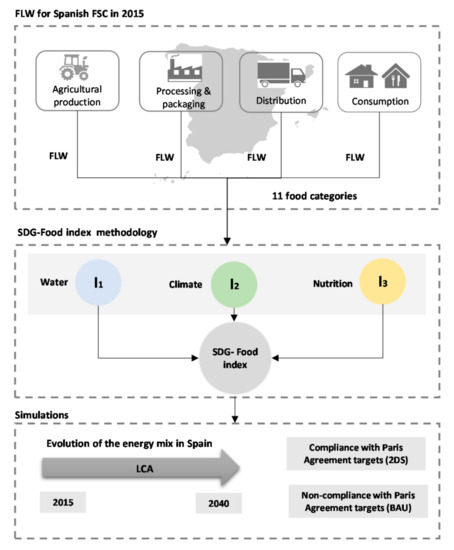
Figure 2.
Description of the case study. FLW: food loss and waste, FSC: food supply chain, SDG: Sustainable Development Goals, LCA: life cycle assessment.
In addition, several hypotheses were proposed to determine the evolution of the impacts over time and under certain policy conditions. The environmental performance was assessed from 2015–2040 considering a framework of compliance (2DS) and non-compliance (BAU) with the Paris Agreement targets, based on the approach developed by Aldaco et al. [35]. The simulations over time were constructed using the energy mix projections developed by the TIMES integrated assessment model from the University College London (TIAM-UCL). These simulations consider 16 regions covering all the world [36]. For this work, data for the Western European Region, which includes Spain, were used. As represented in Figure 3a, the projection in a BAU framework highlights a continuous increase in the energy produced from coal. Thereby coal would be the source of around 60% of the total energy generation in 2040, followed by hydropower (20%), and natural gas, with less than 10%. On the other hand, in a 2DS framework, as represented in Figure 3b, nuclear power seems to have an enormous increase, reaching a surprisingly percentage of 55% of the total electricity mix in 2040, followed by hydropower (20%) and onshore wind (10%). This indicates that certain decarbonization policies in the electricity sector may foster the rise of other problems (i.e., increase in nuclear energy generation), opening the discussion about whether the outcome justifies any strategy to meet the Paris Agreement targets. Finally, regarding biomass and biomass with carbon capture sequestration, both options suggested a start to decreasing by 2025 until almost disappearing by 2040.
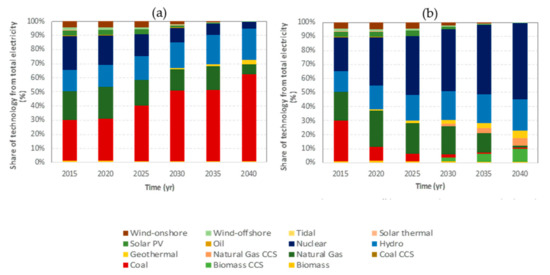
Figure 3.
TIMES integrated assessment model from the University College London (TIAM-UCL) energy mix simulations for the Western European region. (a) Projected BAU and (b) 2DS energy mix contexts from 2015 until 2040. PV: photovoltaic, CCS: carbon capture sequestration. Waste-to-energy technologies, such as thermal treatment, are included in the biomass.
3.2. Data Collection and Calculation
Firstly, the amount of FLW in the Spanish FSC and its embodied energy loss were determined using the material flow analysis developed by García-Herrero et al. [26] and the energy flow assessment presented in Hoehn et al. [37]. Based on those inventories the climate, nutritional, and water indicators were calculated.
To determine the climate indicator, the amount of primary energy required to produce each food category was converted into GWP using the database of the GaBi software [38] and the CML v3.06 methodology [27].
The allocation, conversion, and FLW factors used were extracted from Gustavsson et al. [39]. The exception were concrete products, such as apples and bananas, for which specific FLW factors from Vinyes et al. [40] and Roibás et al. [41] were used. For the quantitative calculations, data reported by the Spanish Department of Agriculture and Fishery, Food, and Environment [42] were used.
The water consumption assessment was based on Batlle-Bayer et al. [29]. The kilograms of water needed per ton of generated FLW for the 1 food categories (blue WF) are presented in Table 1.

Table 1.
Water footprint values assumed for each food loss and waste category (in kilograms per ton), based on Batlle-Bayer et al. [29]. WF: water footprint.
Finally, the data from the nutritional analysis carried out in García-Herrero et al. [26] were implemented to construct the nutritional indicator of the index. The combination of these three data sets aims to provide a novel holistic water-climate-food nexus approach regarding the Spanish context of FLW generation for future policy-making.
3.3. Main Limitations and Assumptions of the Study
The data used of FLW generated have considerable limitations, as they are important gaps in the clarity of the currently developed databases [43]. Additionally, the reported information normally refers to the generation of biodegradable municipal waste instead of specifying bio-waste or FLW generation [44]. In this line, biodegradable municipal waste can also include paper, cardboard, and biodegradable textiles. On the other hand, FLW is often mixed with general waste, especially in the more advanced stages of the FSC. Due to this fact, the determination of which percentage corresponds to FLW exclusively is a difficult task. The generation of FLW also varies depending on factors such as the time of year, and region. Thereby, the main limitations are the uncertainty in the data used.
Regarding the TIAM-UCL data used for the practical example, it is needed to highlight that any scenario simulation represents always a simplification of reality.
Moreover, this work described a methodology for developing a composite index, considering that indexes are an interesting and useful tool for guiding policy-makers. Nevertheless, there are several criticisms regarding the fact of analyzing and quantifying complex problems through composite indexes, as it transforms complex realities into single quantitative or qualitative rankings. In that sense, Ringler et al. [45] stated that aggregating different indicators into a unique number could be a source of losing a lot of information. Additionally, the OCDE [32] suggested that composite indicators might send misleading policy messages if they are not well constructed or interpreted, leading to mistaken analytical or policy conclusions. In this framework, a recent publication of the FAO highlighted the SDG14 (marine resources) and SDG15 (terrestrial ecosystems, forestry, biodiversity) to be considered when searching for a higher environmental sustainability in food systems [46], which are out of the scope of this work.
Finally, it is important to highlight that the weighting process carried out in this methodology is based on assumptions that inevitably respond in order to hide value judgments. In that sense, although many different weighting techniques exist, weights always represent value judgements with a certain level of uncertainty. Moreover, in order to test the replicability of the methodology presented in this work, it would have been interesting to implement it in multiple-case studies. It would be an important future path for assuring internal coherence of the findings and concepts presented in this work [47].
4. Results and Discussion
The aim of implementing a water-climate-food nexus thinking is to obtain results that interconnect with the three pillars, which are considered representative in order to measure the environmental impacts of any FSC and FLW management system. This approach is based on the hypothesis that results of any separate analysis can vary much from a holistic study approach including the three pillars. The results of this work aimed to be a first example to stand up future studies in other contexts. Section 4.1 analyzes the results of the SDG-Food index in the current Spanish FSC, evaluating the different stages of the FSC and food categories. Section 4.2 analyzes the evolution of the indicator in a BAU and 2DS frameworks in relation to the compliance and non-compliance with targets of the Paris Agreement. Finally, Section 4.3 highlights the index results regarding the four selected diets.
4.1. SDG-Food Index in the Spanish Food Supply Chain
The water, climate, and nutrition indicators denote that eggs, cereals, meat, and vegetables are the categories with the highest negative influence when aiming to achieve compliance with the five SDG analyzed (in red in Table 2). On the other hand, pulses, sweets, and dairy products showed the best environmental performance regarding the three indicators (in green in Table 2). The nutritional (NFLWF) had the highest contribution to the SDG-Food index in 8 of the 11 categories because many of the NFLWF values were close to the maximum values, which were transcribed in higher normalized values compared to the other two indicators. The exceptions were the categories of eggs, where the WF was the one with the highest value; fish and seafood, where the GWP presented the highest impact value; and meat, where GWP and the NFLWF presented the highest values. According to the results, the NFLWF was, broadly, the one presenting higher impacts. Thereby, we suggest that Spanish policy-makers put special focus on SDG2 (zero hunger) and SDG12 (ensuring sustainable consumption and production patterns), followed by SDG7, SDG13, and SDG6, all of which aim to achieve compliance with the SDG on the food sector. This is in line with the conclusions of Aldaco et al. [48], who highlight the reduction of FLW as a critical factor for achieving the SDG2 and the SDG12. On the other hand, the less vegetarian or more non-animal product-based diets then the greater influence the impacts have on WF (SDG6) and GWP (SDG7, SDG13) due to the values presented by the categories of eggs, fish, and seafood and meat.
Table 2.
Total and individual values of the three pillars (normalized, i.e. dimensionless). GWP: Global Warming Potential, NFLWF: Nutritional Food Loss and Waste Footprint.
Although the database used in previous works was used, the results differed considerably. Regarding the food categories with more impact, García-Herrero et al. [26] suggested that fruit, vegetables, and meat have the highest rates of nutritional FLW in Spain, and Chen et al. [49] highlighted cereals, fruits, and vegetables as the three major food groups contributing to nutrient loss, followed by meat, dairy, and eggs. Moreover, Hoehn et al. [37] suggested meat FLW as the category with the highest embodied energy loss, which was much higher than fruit or vegetables. Recently, a new work developed by Laso et al [50] highlighted vegetables, fruits, and cereals as the categories less efficient in terms of generated FLW mass. In this work, if the total of the three indicators (WF, GWP, and NFLW) of each FLW category assessed eggs, cereals, meat, and vegetables then the categories highlighted as the most important when developing strategies for FLW management in Spain, by policy-makers, achieved compliance with the five SDGs assessed. This reinforces the importance of seeking holistic approaches when determining the best political decisions for the future. If the index values were analyzed in stages, the agricultural production and consumption showed the highest values (13.02 and 12.99, respectively). On the other hand, the stages of distribution (12.23) and processing and packaging (11.73) showed the lowest values, as seen in Table 3. Those results are in line with previously mentioned works (when they include an assessment by stages) as they agree with the fact that strategies should focus on the beginning and end of the FSC, suggesting the possibility of decentralizing the FLW management strategies.
Table 3.
SDG-Food index results, regarding each considered stage and the totality of the food supply chain (in 2015). Total means the index results of the totality of the food supply chain, instead of the sum of the individual results of each stage (i.e., results of singular stages cannot be added). Values are normalized, i.e., dimensionless.
Figure 4 represents the importance of each category by each of the indicators in the four stages of the FSC. As can be seen, the fact that agricultural production and consumption are the stages with the greatest impacts is not determined by the NFLWF, which practically does not vary between stages but is determined by the differences in the WF and GWP. In the agricultural production stage, the categories with the highest contribution to the index value are meat (2.17), eggs (1.79), and cereals (1.52). In processing and packaging, the highest values are those of cereals (2.18), meat (2.00), and fish/seafood (1.29). In the distribution stage, the categories of cereals (2.24), meat (2.00), and fish/seafood (1.56) stand out. Finally, in the consumption stage, the categories with the highest values are cereals (3.00), meat (1.98), and vegetables (1.83). Thereby, the four categories that were highlighted when analyzing the total results (eggs, cereals, meat, and vegetables) presented the highest influence at each stage. Additionally, the category of fish and seafood in the processing/packaging and distribution stages presented an important influence as well. It is interesting that the one with the highest values for three of the four stages was the category of cereals. This fact connects with the conclusions of Hoehn et al. [37] in relation to the so-called energy return on investment and circular economy (EROIce), suggesting that FLW cereals in Spain have a high level of embodied energy loss, as well as a specific potential as a source for energy recovery, especially through anaerobic digestion.
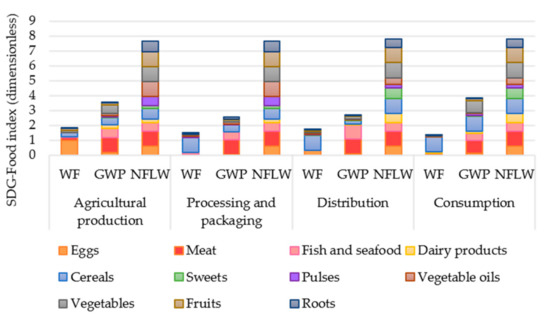
Figure 4.
Each food category on each stage and pillar of the SDG-Food index (normalized, i.e., dimensionless).
Finally, regarding the SDG-Food index, a value of 13.79 was determined, which, in accordance with the minimum and maximum possible on the index scale, is in a medium-high range. If this value is compared with the current ones of the SDG index, Spain is in the 17th position with an index value of 78.11 out of 100 [51], which proportionally would be an equivalent value to the medium-high value obtained in this work. Thus, although this study focuses on only five goals, the results seemed to be by the range of values of the SDG index.
This value could be compared with newly calculated indexes in other countries, regions, or localities by implementing the same methodology in other works.
4.2. SDG-Food Index in a Framework of Non-Compliance and Compliance with the Paris Agreement Targets
If the scenarios of non-compliance and compliance with the Paris Agreement targets are applied to the data, with the foreseeable evolution of the energy mix, the SDG-Food index shows a decrease, i.e., higher sustainability and compliance with the SDG, in all stages and in the total value for the 2DS framework. Figure 5 represents the total values, whose trends are similar for the separate stages. Thus, in 2040, the index would decrease by 24.8% compared to 2015, reaching the value of 10.3. On the other hand, if the Paris Agreement targets are not achieved (BAU framework), there would be an increase in the index in all stages and in its total value, increasing 19.0% in 2040 compared to 2015, reaching a value of 16.3. If the specific values of each stage are observed, the highest values would be found in the consumption stage in 2040 with a value of 15.6 (in the BAU framework). On the contrary, the processing/packaging (9.3) and consumption stages (9.4) stages would reach the lowest values in 2040 (in the 2DS framework). However, the differences are not very significant in the evolution between each of the stages, and the interesting information is the reduction of the index that would be achieved by complying with the Paris Agreement targets until 2040, as well as the increase in the index that this would be happening in a situation of non-compliance with the targets. This results reinforce the statement presented in other works, showing how the Paris Agreement targets can be made consistent with food security objectives and how multiple SDG can be achieved [52].
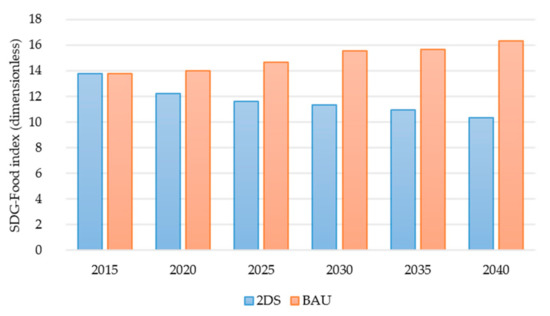
Figure 5.
SDG-Food index results regarding the total of the food supply chain between 2015 and 2040, in a scenario of non-compliance (BAU) and compliance (2DS) with the Paris Agreement targets (normalized, i.e., dimensionless).
4.3. SDG-Food Index Regarding Different Diets
Food commodities have been assessed according to four different diets: omnivorous-Mediterranean (currently), pescatarian, vegetarian, and vegan diet. The current diet in Spain is assumed as a mix between omnivorous and Mediterranean diets. As seen in Figure 6, the results indicate that the lowest values of the index, i.e., better environmental performance, for the vegan diet, followed by vegetarian and pescatarian diets (in all stages of FSC). Specifically, a vegan diet would reach a 29.88% reduction in the values of the SDG-Food index with respect to the current diet, a vegetarian diet 18.33%, and a pescatarian diet 13.06%. The greatest differences between a vegan diet and the current diet occur in the stages of agricultural production and processing/packaging, where the differences are 37.50% and 37.14%, respectively. An exception is highlighted in the distribution stage, where the pescatarian diet appears with a slightly lower value of the index than the vegetarian one. The results are in line with a previous degrowth assessment of the Spanish FSC [53], where a re-vegetarianization of the diets seemed to be the best pillar for achieving a spiral bioeconomy towards sustainable food production and FLW management systems. Moreover, in the literature, there are also a wide range of works concluding that “going back” to plant-based diets worldwide seems to be a reasonable alternative for a sustainable future [54].
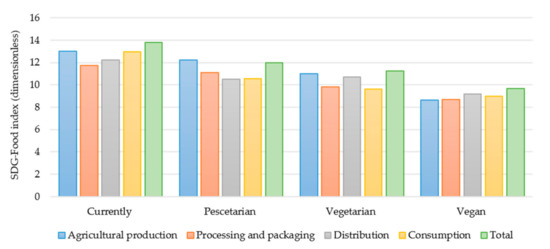
Figure 6.
SDG-Food index results regarding the four different diets considered (normalized, i.e., dimensionless).
5. Conclusions
This work presented a methodology with a water-climate-food nexus for the development of the so-called SDG-Food index, which is based on five SDG-related food systems and their FLW generation. We aimed provide policy-makers with an understandable novel tool to highlight the level of compliance or non-compliance of any national, regional, or local FSC and FLW management system, for the development of decentralized policies based on each concrete context. We further considered 4 stages of the FSC and 11 FLW categories. Results of the Spanish case study highlighted a SDG-Food index value of 13.79, suggesting the food pillar as the most decisive one when developing future political strategies. Regarding the food categories, results suggested the categories of eggs, cereals, meat, and vegetables as better for compliance with the five SDG assessed. The stages of agricultural production and consumption seemed the highest index values if they were separately assessed. Moreover, a scenario of compliance with the Paris Agreement targets until 2040 presented better values for all stages, and a vegan diet was highlighted as the one with the best index score, followed by a vegetarian and a pescatarian diet. Future works on different FSC and FLW management systems could lead to comparative possibilities.
Additionally, a challenge that should be addressed in the future is the possibility of adding social aspects to this composite index. Nevertheless, there is an important problem with many composite indicators when they add together scores of environmental and social indicators, as they often make the implicit wrong assumption that environmental and social objectives can be substituted between them. Therefore, future work will be important to consider that more societies do not compensate for less environmental work, or vice versa. The same principle applies to each of the SDGs, as each of the goals should be measured and they cannot be replaced by better values in other goals. Finally, the possibility of expanding this index to analyze regional and local contexts should also be considered.
Author Contributions
Conceptualization, D.H., M.M., and R.A.; methodology, D.H.; formal analysis, D.H., M.M., and R.A.; investigation, D.H.; writing—original draft preparation, D.H.; writing—review and editing, D.H., M.M., J.L., I.R.-S., L.B.-B., and R.A.; supervision, M.M., A.B., P.F.-i.-P., and R.A.; project administration, R.A.; funding acquisition, R.A. and P.F.-i.-P. All authors have read and agreed to the published version of the manuscript.
Funding
This research was funded by Spanish Ministry of Science and Competitiveness, grant number CERES-PROCON Project CTM2016-76176-C2-1-R (AEI/FEDER, UE) and KAIROS-BIOCIR Project PID2019-104925RB (AEO/FEDER, UE).
Institutional Review Board Statement
Not applicable.
Informed Consent Statement
Not applicable.
Data Availability Statement
Not applicable.
Acknowledgments
Daniel Hoehn thanks the Ministry of Economy and Competitiveness of the Spanish Government for their financial support via the research fellowship BES-2017-080296.
Conflicts of Interest
The authors declare no conflict of interest. The authors are responsible for the choice and presentation of information contained in this paper as well as for the opinions expressed therein, which are not necessarily those of UNESCO and do not commit this Organization.
References
- Shukla, P.R.; Skea, J.; Buendia, E.C.; Masson-Delmotte, V.; Pörtner, H.O.; Roberts, D.C.; Zhai, P.; Slade, R.; Connors, S.; van Diemen, R. (Eds.) Technical Summary. In Climate Change and Land: An IPCC Special Report on Climate Change, Desertification, Land Degradation, Sustainable Land Management, Food Security, and Greenhouse Gas Fluxes in Terrestrial Ecosystems; Intergovernmental Panel on Climate Change: Geneva, Switzerland, 2019. [Google Scholar]
- FAO. Global Food Losses and Food Waste—Extent, Causes and Prevention. 2011. Available online: http://www.fao.org/3/mb060e/mb060e00.htm (accessed on 16 March 2020).
- Ritchie, H.; Roser, M. Environmental Impacts of Food Production. 2020. Available online: https://ourworldindata.org/environmental-impacts-of-food (accessed on 23 March 2020).
- Vora, N.; Shah, A.; Bilec, M.; Khanna, V. Food-energy-water nexus: Quantifying embodied energy and GHG emissions from mitigation through virtual water transfers in food trade. ACS Sustain. Chem. Eng. 2017, 5, 2119–2128. [Google Scholar] [CrossRef]
- Rosi, A.; Mena, P.; Pellegrini, N.; Turroni, S.; Neviani, E.; Ferrocino, I.; Di Cagno, R.; Ruini, L.; Ciati, R.; Angelino, D.; et al. Environmental impact of omnivorous, ovo-lacto-vegetarian and vegan diet. Nat. Sci. Rep. 2017, 7, 6105. [Google Scholar] [CrossRef] [PubMed]
- Clark, M.; Hill, J.; Tilman, D. The Diet, Health, and Environmental Trilemma. Annu. Rev. Environ. Resour. 2018, 43, 109–134. [Google Scholar] [CrossRef]
- Gustavsson, J.; Cederberg, C.; Sonesson, U.; van Otterdijk, R.; Meybeck, A. Global Food Losses and Food Waste: Extent, Causes and Prevention; FAO: Rome, Italy, 2011. [Google Scholar]
- Guijarro, F.; Poyatos, J.A. Designing a Sustainable Development Goal Index through a Goal Programming Model: The Case of EU-28 Countries. Sustainability 2018, 10, 3167. [Google Scholar] [CrossRef]
- Diaz-Sarachaga, J.M.; Jato-Espino, D.; Castro-Fresno, D. Is the Sustainable Development Goals (SDG) index an adequate framework to measure the progress of the 2030 Agenda? J. Sustain. Dev. 2018, 26, 663–671. [Google Scholar] [CrossRef]
- Jabbari, M.; Shafiepour-Motlagh, M.; Ashrafi, K.; Abdoli, G. Differentiating countries based on the sustainable development proximities using the SDG indicators. Environ. Dev. Sustain. 2019, 22, 6405–6423. [Google Scholar] [CrossRef]
- Kynčlová, P.; Upadhyaya, S.; Nice, T. Composite index as a measure on achieving Sustainable Development Goal 9 (SDG-9) industry-related targets: The SDG-9 index. Appl. Energy 2020, 265, 114755. [Google Scholar] [CrossRef]
- Lemke, C.; Bastinit, K. Embracing multiple perspectives of sustainable development in a composite measure: The Multilevel Sustainable Development Index. J. Clean. Prod. 2020, 246, 118884. [Google Scholar] [CrossRef]
- Moreno, B.; García-Álvarez, M.T. Measuring the progress towards a resource-efficient European Union under the Europe 2020 strategy. J. Clean. Prod. 2018, 170, 991–1005. [Google Scholar] [CrossRef]
- Alaimo, L.S.; Maggino, F. Sustainable Development Goals Indicators at Territorial Level: Conceptual and Methodological Issues—The Italian Perspective. Soc. Indic. Res. 2020, 147, 383–419. [Google Scholar] [CrossRef]
- Redlingshöfer, B.; Barles, S.; Weisz, H. Are waste hierarchies effective in reducing environmental impacts from food waste? A systematic review for OECD countries. Resour. Conserv. Recycl. 2020, 156, 104723. [Google Scholar] [CrossRef]
- Pérez-Escamilla, R. Food Security and the 2015–2030 Sustainable Development Goals: From Human to Planetary Health, Perspectives and Opinions; Department of Social and Behavioral Sciences and Global Health Concentration, Yale School of Public Health: New Haven, CT, USA, 2020. [Google Scholar]
- Agovino, M.; Cerciello, M.; Gatto, A. Policy efficiency in the field of food Sustainability. The adjusted food agricultura and nutrition index. J. Environ. Manag. 2018, 218, 220–233. [Google Scholar] [CrossRef] [PubMed]
- Azzura, A.; Massimiliano, A.; Angela, M. Measuring sustainable food consumption: A case study on organic food. Sustain. Prod. Consum. 2019, 17, 95–107. [Google Scholar] [CrossRef]
- Saladini, F.; Betti, G.; Ferragina, E.; Bouraoui, F.; Cupertino, S.; Canitano, G.; Gigliotti, M.; Autino, A.; Pulselli, F.M.; Riccaboni, A.; et al. Linking the water-energy-food nexus and sustainable development indicators for the Mediterranean region. Ecol. Indic. 2018, 91, 689–697. [Google Scholar] [CrossRef]
- Kurian, M.; Scott, C.; Ratna-Reddy, V.; Alabaster, G.; Nardocci, A.; Portney, K.; Boer, R.; Hannibal, B. One Swallow Does Not Make a Summer: Siloes, Trade-Offs and Synergies in the Water-Energy-Food Nexus. Front. Environ. Sci. 2019, 7, 32. [Google Scholar] [CrossRef]
- Laso, J.; Margallo, M.; García-Herrero, I.; Fullana, P.; Bala, A.; Gazulla, C.; Polettini, A.; Kahhat, R.; Vázquez-Rowe, I.; Irabien, A.; et al. Combined application of Life Cycle Assessment and linear programming to evaluate food waste-to-food strategies: Seeking for answers in the nexus approach. Waste Manag. 2018, 80, 186–197. [Google Scholar] [CrossRef]
- Leivas, R.; Laso, J.; Abejón, R.; Margallo, M.; Aldaco, R. Environmental assessment of food and beverage under a NEXUS Water-Energy-Climate approach: Application to the spirit drinks. Sci. Total Environ. 2020, 720, 137576. [Google Scholar] [CrossRef]
- United Nations. Adoption of the Paris Agreement. 2015. Available online: https://unfccc.int/resource/docs/2015/cop21/eng/l09r01.pdf (accessed on 20 November 2020).
- Hidalgo-Mora, J.J.; García-Vigara, A.; Sánchez-Sánchez, M.L.; García-Pérez, M.A.; Tarín, J.; Cano, A. The Mediterranean diet: A historical perspective on food for health. Maturitas 2020, 132, 65–69. [Google Scholar] [CrossRef]
- Zani, C.; Ceretti, E.; Grioni, S.; Viola, G.C.V.; Donato, F.; Feretti, D.; Festa, A.; Bonizzoni, S.; Bonetti, A.; Monarca, S.; et al. MAPEC-LIFE Study Group, Are 6–8 year old Italian children moving away from the Mediterranean diet? Ann. Ig. 2016, 28, 339–348. [Google Scholar] [PubMed]
- Guinée, J.B.; Gorrée, M.; Heijungs, R.; Huppes, G.; Kleijn, R.; Koning, A.; Van Oers, L.; Sleeswijk, A.W.; Suh, S.; De Haes, H.A.U.; et al. Handbook on Life Cycle Assessment. Operational Guide to the ISO Standards. I: LCA in Perspective. IIa: Guide. IIb: Operational Annex. III: Scientific Background; Kluwer Academic Publishers: Dordrecht, The Netherlands, 2002; ISBN 1-4020-0228-9. [Google Scholar]
- Guinée, J.B. Selection of Impact Categories and Classification of LCI. Results to Impact Categories. In Life Cycle Impact Assessment, 1st ed.; Guinée, J.B., Ed.; Springer: Dordrecht, The Netherlands, 2017; pp. 17–37. [Google Scholar]
- Garcia-Herrero, I.; Hoehn, D.; Margallo, M.; Laso, J.; Bala, A.; Balle-Bayer, L.; Fullana, P.; Vazquez-Rowe, I.; Gonzalez, M.J.; Durá, M.J.; et al. On the estimation of potential food waste reduction to support sustainable production and consumption policies. Food Policy 2018, 80, 24–38. [Google Scholar] [CrossRef]
- Batlle-Bayer, L.; Aldaco, R.; Bala, A.; Fullana-i-Palmer, P. Towards sustainable dietary patterns under a water-energy-food nexus life cycle thinking approach. Curr. Opin. Environ. Sci. Health 2020, 13, 61–67. [Google Scholar] [CrossRef]
- Chapagain, A.; James, K. Accounting for the Impact of Food Waste on Water Resources and Climate Change. Food Ind. Wastes 2013, 217–236. [Google Scholar] [CrossRef]
- Hoekstra, A.Y.; Chapagain, A.K.; Aldaya, M.M.; Mekonnen, M.M. The Water Footprint Assessment Manual: Setting the Global Standard; Earthscan: London, UK, 2011. [Google Scholar]
- OECD. Handbook on Constructing Composite Indicators. Methodology and User Guide; OECD: Paris, France, 2008; ISBN 978-92-64-04345-9.
- Infante-Amate, J.; Gonzalez de Molina, M. “Sustainable de-growth” in agriculture and food: An agro-eological perspective on Spain´s agri-food system (year 2000). J. Clean. Prod. 2013, 38, 27–35. [Google Scholar] [CrossRef]
- FAO. Definitional Framework of Food Loss, Working Paper. 2014. Available online: http://www.fao.org/fileadmin/user_upload/save-food/PDF/FLW_Definition_and_Scope_2014.pdf (accessed on 19 February 2020).
- Aldaco, R.; Butnar, I.; Margallo, M.; Laso, J.; Rumayor, M.; Dominguez-Ramos, A.; Irabien, A.; Dodds, P.E. Bringing value to the chemical industry from capture, storage and use of CO2: A dynamic LCA of formic acid production. Sci. Total Environ. 2019, 663, 738–753. [Google Scholar] [CrossRef]
- Anandarajah, G.; Pye, S.; Ushner, W.; Kesicki, F.; Mcglade, C. TIAM-UCL Global Model Documentation; Working Paper, REF UKERC/WP7ESY/2011/001. 2011. Available online: https://www.ucl.ac.uk/drupal/site_energy-models/sites/energy-models/files/tiam-ucl-manual.pdf (accessed on 21 November 2020).
- Hoehn, D.; Margallo, M.; Laso, J.; García-Herrero, I.; Bala, A.; Fullana-i-Palmer, P.; Irabien, A.; Aldaco, R. Energy Embedded in Food Loss Management and in the Production of Uneaten Food: Seeking a Sustainable Pathway. Energies 2019, 12, 767. [Google Scholar] [CrossRef]
- Sphera. Gabi 6 Software and Database on Life Cycle Assessment; Sphera: Chicago, IL, USA, 2020.
- Gustavsson, J.; Cederberg, C.; Sonesson, U.; Emanuelsson, A. The Methodology of the FAO Study: “Global Food Losses and Food Waste-Extent, Causes and Prevention”—FAO, 2011; The Swedish Institute for Food and Biotechnology (SIK): Göteborg, Sweden, 2013. [Google Scholar]
- Vinyes, E.; Asin, L.; Alegre, S.; Muñoz, P.; Boschmonart, J.; Gasol, C.M. Life Cycle Assessment of Apple and peach production, distribution and consumption in Mediterranean fruit sector. J. Clean. Prod. 2017, 149, 313–320. [Google Scholar] [CrossRef]
- Riobás, L.; Elbehri, A.; Hospido, A. Carbon footprint along the Ecuadorian banana supply chain: Methodological improvements and calculation tool. J. Clean. Prod. 2016, 112, 2441–2451. [Google Scholar] [CrossRef]
- Ministry of Agriculture, Fishery, Food and Environment; MAPAMA. Informes de Consumo de Alimentación en España; MAGRAMA: Madrid, Spain, 2015.
- Arcadis Project Number—11/004759, Version C, Assessment of the Options to Improve the Management of Biowaste in the European Union—Final Report, European Commission DG Environment. 2010. Available online: https://ec.europa.eu/environment/waste/compost/pdf/ia_biowaste%20-%20final%20report.pdf (accessed on 24 March 2020).
- Hoehn, D.; Laso, J.; Cristóbal, J.; Butnar, I.; Borrion, A.; Bala, A.; Fullana-i-Palmer, P.; Vázquez-Rowe, I.; Aldaco, R.; Margallo, M. Regionalized Strategies for Food Loss Management in Spain under a Life Cycle Thinking Approach. Foods 2020, 9, 1765. [Google Scholar] [CrossRef]
- Riege, A.M. Validity and reliability tests in case study research: A literature review with “hands-on” applications for each research phase. Qual. Mark. Res. Int. J. 2003, 6, 75–86. [Google Scholar] [CrossRef]
- Ringler, C.; Bhaduri, A.; Lawford, R. The nexus across water, energy, land and food (WELF): Potential for improved resource use efficiency? J. Environ. Sustain. 2013, 5, 617–624. [Google Scholar] [CrossRef]
- FAO. The State of Food and Agriculture 2019, Moving Forward on Food Loss and Waste Reduction; FAO: Rome, Italy, 2019.
- Aldaco, R.; Hoehn, D.; Laso, J.; Margallo, M.; Ruiz-Salmón, I.; Cristobal, J.; Kahhat, R.; Villanueva-Rey, P.; Bala, A.; Batlle-Bayer, L.; et al. Food waste management during the COVID-19 outbreak: A holistic climate, economic and nutritional approach. Sci. Total Environ. 2020, 742, 140524. [Google Scholar] [CrossRef] [PubMed]
- Chen, C.; Chaudhary, A.; Mathys, A. Nutritional and environmental losses embedded in global food waste. Resour. Conserv. Recy. 2020, 160, 104912. [Google Scholar] [CrossRef]
- Laso, J.; Campos, C.; Fernández-Ríos, A.; Hoehn, D.; del Río, A.; Ruiz-Salmón, I.; Cristóbal, J.; Quiñones, A.; Amo-Setién, F.J.; Ortego, M.C.; et al. Looking for Answers to Food Loss and Waste Management in Spain from a Holistic Nutritional and Economic approach. Sustainability 2021, 13, 125. [Google Scholar] [CrossRef]
- Sachs, J.; Schmidt-Traub, G.; Kroll, C.; Lafortune, G.; Fuller, G.; Woelm, F. The Sustainable Development Goals and COVID-19, Sustainable Development Report 2020; Cambridge University Press: Cambridge, UK, 2020. [Google Scholar]
- Doelman, J.; Stehfest, E.; Tabeau, A.; Van Meijl, H. Making the Paris agreement climate targets consistent with food security objectives. Glob. Food Sec. 2019, 23, 103. [Google Scholar] [CrossRef]
- Hoehn, D.; Laso, J.; Margallo, M.; Ruíz-Salmón, I.; Quiñones, A.; Amo-Setién, F.A.; Vázquez-Rowe, I.; Bala, A.; Batlle-Bayer, L.; Fullana-i-Palmer, P.; et al. Introducing a Degrowth Approach to the Circular Economy Policies of Food Production and Food Loss and Waste Management: Towards a Circular Bioeconomy. Sustainability 2021, in press. [Google Scholar]
- Sabaté, J.; Soret, S. Sustainability of plant-based diets: Back to the future. Am. J. Clin. Nutr. 2014, 100 (Suppl. 1), 476S–482S. [Google Scholar] [CrossRef]


Publisher’s Note: MDPI stays neutral with regard to jurisdictional claims in published maps and institutional affiliations. |
© 2021 by the authors. Licensee MDPI, Basel, Switzerland. This article is an open access article distributed under the terms and conditions of the Creative Commons Attribution (CC BY) license (http://creativecommons.org/licenses/by/4.0/).