Abstract
Recovery and reuse of high-acidity vegetable oil waste (higher content of free fatty acids) is a major concern for reducing their effect on the environment. Moreover, the conventional deacidification processes are known to show drawbacks, such as oil losses or higher costs of wastewater treatment, for which it requires great attention, especially at the industrial scale. This work presents the design of a highly efficient and sustainable process for Camelina sativa oil deacidification by using an ecofriendly method, namely molecular distillation. Experimental studies were performed to identify operating conditions for removing of free fatty acids (FFA) by molecular distillation which involves the oil evaporation in high vacuum conditions. The experimental studies were supported by statistical analysis and technical-economic analysis. Response surface methodology (RSM) was employed to formulate and validate second-order models to predict deacidification efficiency, FFA concentration, and triacylglyceride (TAG) concentration in deodorized oil based on three parameters effects, validated by statistical p-value < 0.05. For a desirability function value of 0.9826, the optimal parameters of evaporator temperature at 173.5 °C, wiper speed at 350 rpm, and feed flowrate at 2 mL/min were selected. The results for process design at optimal conditions (using conventional and molecular distillation methods) showed an efficiency over 92%, a significant reduction in FFA (up to 1%), and an increase in TAG (up to 93%) in refined oil for both methods. From an economical point of view, the deacidification by molecular distillation of Camelina sativa oil is a sustainable process: no wastewater generation, no solvents and water consumption, and lower production costs, obtaining a valuable by-product (FFA).
1. Introduction
Mono-, di- and triglycerides are the main components of crude oils, in addition to tocopherols, squalene, and sterols in traces (200–800 ppm), whose presence improve oil oxidative stability. Besides these desired components, crude oils contain undesirable impurities as phospholipids (100–500 ppm), free fatty acids (FFA) (5–20%), metal ions and metal complexes (2–15 mg·kg−1), oxidized products (2–6 meq·kg−1), and moisture (1–3%) [1]. FFA content is one of the most important aspects that influences edible oil quality or their usage as raw material in biodiesel production because they are more susceptible to autoxidation than the esterified fatty acids (FFA act like pro-oxidants, initiating the oxidation mechanism in lipids, leading to rancidity) or produce soaps (by mixing with methanol for transesterification reaction) [1]. Long storage time and temperature over 24 °C, contribute to the degradation and quick rancidity of oils [2]. Moreover, some fresh crude oil extracted by cold pressing can have high acidity and high FFA content. Therefore, FFA removal is an important step in the crude oil refining process, called oil deacidification. To decrease FFA level of the crude oils, chemical methods (alkali neutralization, re-esterification) and physical methods (absorption, liquid–liquid extraction, stripping at high temperatures and pressures, molecular distillation, supercritical fluid extraction) are used. At industrial scale, chemical deacidification by adding alkali is commonly used.
Although the main advantage of the chemical method is the high efficiency in FFA removal below 1%, this method has two major disadvantages in terms of oil losses (15–37%), due to the formation of soaps by retention of oil droplets, and environment pollution, due to the wastewater generated from the removal of soaps by washing and the higher cost of their disposal [3,4]. Another chemical method that is often coupled with the conventional method is FFA esterification with an alcohol in the presence of catalysts at higher temperatures (200–280 °C). Recent studies have been reporting higher deacidification efficiencies by using ethanol or glycerol excess in the presence of different catalyst types: heterogenous catalyst as zinc oxide [5], acid ion exchange resin or enzymes [6], and superacid catalyst [7]. However, this method does not have an industrial application due to the high cost of catalysts and the high temperature conditions at which the esterification reaction takes place. On the other hand, oil refining at an industrial level can be achieved by physical methods (mostly steam stripping), which have the advantage of using one piece of equipment and cheaper utilities but are limited for oils that contain thermolabile compounds. Solvent extraction is other feasible deacidification method to decrease FFA from oils and has the advantage of small oil losses, low energy consumption, gentle oil treatment, and reduced waste products. Methanol, ethanol, amyl alcohol, acetone, or acetic ester can be used as solvents [8,9]. The main disadvantage of this process is the oil-solvent systems L–L equilibrium data required. Additionally, this process requires at least three pieces of equipment: a liquid–liquid extraction column, a stripper for solvent removal from the refined oil, and a column to recover the solvent, so the capital costs and energy consumptions must be taken into consideration.
Due to these major drawbacks, alternatives methods need to be used on an industrial scale; to improve oil quality, the solvent traces in purified oils can be replaced using environmentally friendly solvents, such as CO2, under supercritical conditions [10]. Degradation of thermolabile compounds from oils can be avoided by using methods such as molecular distillation or advanced vacuum distillation [11,12,13,14,15,16]. Some researchers showed their interest in improving deacidification process using molecular distillation. They reported the results obtained for oils with different compositions and acidities: grape seed oil—3 mg KOH/g [11], cacao butter—3.16 mg KOH/g [12], palm oil—21.3 mg NaOH/h [13], soybean isolated by aqueous enzyme-assisted extraction—0.57 mg KOH/g [14], hazelnut oil—17.26 mg KOH/g [14], or microalgae—1.2 mg KOH/g [15]. Molecular distillation has been indicated as a reliable method that can be used at the industrial level thanks to advantages such as: rapid evaporation of liquid that is uniformly distributed as a thin film on a hot surface, lower evaporation temperatures by providing a high vacuum, the high deacidification efficiency, and the high purity of products. In comparison with the other deacidification methods, the cost of equipment, vacuum, and heating utilities can be the main disadvantage. Most studies for oil deacidification by molecular distillation have been done at laboratory scale, being oriented on finding the optimal operating conditions that depend on the oil composition. Therefore, a detailed economic analysis for a scale-up at the industrial level of this process is required to show a trade-off between advantages and disadvantages.
The aim of this paper was to design a sustainable deacidification process at micro-pilot scale by using molecular distillation as the separation method of FFA. Camelina sativa oil, characterized by a high content of polyunsaturated fatty acids, essential for human diet, was used as a raw material due to the valuable products that can be obtained from refined oil: a mixture of FFA, edible oil, and omega fatty acid esters. Operating parameters were highly influenced by oil composition, and their values and influence on process efficiency and oil quality, were evaluated by lab-scale experimental investigation and optimized by RSM (based on a higher value of desirability function). Thus, the design of an ecofriendly and energy-efficient process at micro-pilot plant scale is presented.
2. Materials and Methods
2.1. Materials
Crude Camelina sativa oil was provided by a Romanian local farm and stored in laboratory conditions for six months. For acidity value determination, diethyl ether (99.7% purity), ethanol purity p.a. (99.8%), and potassium hydroxide solution in methanol 0.5 M from Sigma Aldrich (Munich, Germany) were used. For alkali deacidification, sodium hydroxide (98% purity from Sigma Aldrich, Munich, Germany) and hexane (99% purity from Sigma Aldrich, Munich, Germany) were used. As a drying agent, anhydrous magnesium sulfate (98% purity) from Sigma Aldrich (Germany) was used, and n-heptane (99% purity) and acetone (99.5% purity) from Sigma Aldrich (Munich, Germany) were used for the Gas Chromatography with Flame Ionization Detection (GC-FID) analysis.
2.2. Experimental Procedures
Two experimental procedures were used for deacidification of Camelina sativa oil: chemical (reaction of FFA with alkali) and physical (molecular distillation) methods.
2.2.1. Camelina sativa Oil Deacidification Using Alkali
This method consisted in treating the oil with an aqueous solution of sodium hydroxide which reacted with FFA, forming soap.
Experiments were performed using the method proposed elsewhere [17]. One gram of alkali was dissolved in 1 mL distilled water and further added to a sample of 150 g Camelina sativa oil. The sample was stirred 30 min, and then 15 mL hexane was added and was stirred again for another 30 min. Finally, the soap was separated at 3500 rpm for 30 min to evaporate the solvent. To remove the soap traces, three successive washes with distilled water at 95 °C were performed, and washing water was removed by centrifugation. Samples were prepared to determine the acidity value and to identify the content of FFA and triacylglyceride (TAG).
2.2.2. Camelina sativa Oil Deacidification by Molecular Distillation
Samples of 500 g Camelina sativa oil were subjected to a wiped film molecular distillation plant (KDL5, UIC GmbH, Alzenau, Germany) to separate FFA based on migration of molecules with different molecular volumes at vacuum conditions. The plant was heated by thermal oil. Working procedure is presented in [18]. The operating conditions were varied in the specific ranges imposed by equipment limits: the evaporator temperature (maximum 250 °C), the rotational wiping speed (250–350 rpm), feed flow rate (2–6 mL/min), while pressure (0.001–100 mbar) and condenser temperature (less than 30 °C). Light and heavy samples were collected in different devices and prepared to determine the acidity value and to identify the content of free fatty acids and triglycerides by chromatographic analysis. Separation process efficiency was calculated with Equation (3):
Seventeen experiments were performed by varying operating conditions, such as evaporator temperature, the rotational wiping speed, and feed flow rate in equipment range, to evaluate the influence on deacidification efficiency and TAG and FFA compositions.
2.3. Samples Characterization
2.3.1. Acidity Value
Camelina sativa oil sample acidity was determined by a method according to the European Standard SR EN No. 660 [19]. The sample was diluted in a mixture of ethanol:diethyl ether 1:1 (v/v) in the presence of phenolphthalein as an indicator and neutralized with 0.5M KOH solution in methanol. The acidity (IA) was calculated using Equation (4), where V is volume of potassium hydroxide solution used in the titration in cm3, n is the normality of solution, m is analyzed sample mass in g, and MKOH is molar weight of potassium hydroxide in g/mol.
2.3.2. FFA and Glycerides Content
Monoacylglycerides (MAG), diacylglycerides (DAG), triacylglycerides (TAG), and FFA compositions were determined by GC-FID using a gas-chromatograph Bruker Scion 436 according to SR EN Standard No. 14105 [20]. For sample analyses, a fused capillary column ZB-5HT type with a nitrogen flow of 5 mL/min was used. Because high temperature is necessary to vaporize the glycerides the injector temperature started at 50 °C and increased with the rate of 50 °C∙min−1 until 380 °C with a 2 min hold. Electronic flow controller (EFC) was settled at 2.5 mL/min and the following oven temperature program was used: 50 °C for 1 min, rate 15 °C∙min−1 until 180 °C, rate 7 °C∙min−1 until 230 °C, rate 10 °C∙min−1 until 370 °C. Detector temperature (FID) was set at 380 °C and the gas flows at 15 mL/min for the make-up gas (nitrogen), 15 mL/min for hydrogen, and 300 mL/min for air. The injection volume used was 1 μL. All samples were analyzed in five replicates and the results are presented as the average value ± standard deviation (SD).
2.4. Statistical Analysis
To find optimal operating conditions for the deacidification process of Camelina sativa oil, a design of experiments (DOE) was used. DOE main steps followed for this analysis were: setting up experiments objectives, factors and levels selection (number of independent variables manipulated to determine their effect on the measured responses), selection of dependent variables (measured during experiments, their value depends on independent variable effect), design experimental matrix, select ranges of independent variables and number of replicates of experimental data, collect experimental data, regression model formulation and factor effect evaluation, and validation applying statistical ANOVA and regression methods. Different kinds of dependent or independent variables can be selected for the oil deacidification process, and different optimal parameters can be identified for particular cases [21,22,23,24,25,26]. Based on this statistical technique, a second-degree model was formulated to describe the system, including effects or interactions of factors, solved by minimizing/maximizing the response variables. As a DOE technique, the Box–Behnken surface experimental design was used in this study to investigate the effects of three factors (evaporator temperature, wiper rolling speed, and feed flow rate), for some responses of the oil deacidification process (minimum FFA content, maximum TGA content). The independent variable limits depended on equipment limits and raw material composition.
The Box–Behnken design consists of three levels (minimum, center, and maximum values, K = 3) selected for each independent variable, with coded labels (X1, X2, and X3) and values as presented in Table 1. For the molecular distillation process, three dependent variables were explored: the FFA composition in heavy product (Y1), deacidification efficiency (Y2), and the TAG composition in heavy product (Y3), as presented in Table 2.

Table 1.
Independent variables for design (coded and encoded).

Table 2.
Dependent variables for design (coded and encoded).
The Box–Behnken design matrix contains combination of two variables as for 22 factorial design, the third variable being maintained at level zero and some central point values. A second-order model (in coded variables) was formulated to provide optimal surfaces for each response using Equation (5).
Considering three factors, the model has M coefficients for each i responses (i = 1…K, j = 0…M) which represent the change of responses per unit of effect of independent variables , and K number of factors.
The regression models for responses considered main effects (X1, X2, X3) determined by the influence of each variable independent from the others, interaction effects (X1X2, X1X3, X2X3) described as a cumulative effect of two dependent variables and the quadratic effect of each variable (, , ). The model coefficient values were generated by the least squares regression followed by analysis of variance (ANOVA) for model validation. The total number of experiments (N) for second-order model was calculated using Equation (6):
where K is the factors number and Cp is the replicates at the central point. Thus, for Box–Behnken model design, 17 experimental runs were performed with five replications at the central point. For the Camelina sativa oil deacidification process, the Box–Behnken matrix with three factors in coded form and three responses is shown in Table 3. The optimal values of dependent variables were predicted using desirability function. The model lack of fit was calculated in terms of coefficient of determination (R2) and p-values for 95% confidence interval considered for analysis of variance (ANOVA). The optimal values of factors (minimum/maximum) were identified on their response surfaces for acceptable values of fitted responses evaluating desirability functions.

Table 3.
Box–Behnken design matrix deacidification process by molecular distillation.
2.5. Process Design, Economic and Environmental Analysis
Molecular distillation processes were designed using Aspen Plus v.10 (AspenTech Technology Inc., Bedford, MA, USA, 2017) simulator to perform mass and energy balances, equipment design, and total costs. Oil sample was considered as a mixture of mono-, di- and triglycerides; tocopherols; and fatty acids identified as majority in composition of Camelina sativa oil. All compounds are in the simulator database and their properties were calculated using RK-ASPEN (Redlich–Kwong Soave with Wong–Sandler mixture rules) properties package [27]. The molecular distillation unit was modeled by combination of three simulator models: HeatX–Flash2–HeatX, for light molecule evaporation, vaporized molecule migration, and condensation, with mixture temperature and pressure as specifications. Economic analysis was performed using Aspen Plus v.10 simulator.
3. Results and Discussions
According to the GC-FID analysis, the fresh press extraction of Camelina sativa oil, purchased from a regional farm, contained 3.23 ± 0.33% FFA, 0.75 ± 0.10% MAG, 5.95 ± 0.24% DAG, and 90.07 ± 0.32% TAG and has an acidity value of 3.35 ± 0.10 mg KOH/g oil. After six months of storage, chromatographic analysis of the same oil showed a modified composition: 7.67 ± 0.33% FFA, 0.84 ± 0.09% MAG, 6.01 ± 0.30% DAG, and 85.49 ± 0.42% TAG and acidity value of 7.17 ± 0.07 mg KOH/g oil. These results show the great tendency of this oil for oxidation, due to the presence of components with many double bonds.
3.1. Camelina Sativa Oil Deacidification Using Alkali
Six experiments were performed to remove FFA from three samples of Camelina sativa oil with initial acidity 3.35 mg KOH/g oil and three samples with 7.17 mg KOH/g oil. After deacidification with sodium hydroxide, the samples’ acid value decreased to ≈1 mg KOH/g, respectively, to ≈2.1 mg KOH/g., while the losses were about 18% for all the samples. Deacidification efficiency was around 82% for all samples, and 0.6 g/g oil was collected as wastewater.
3.2. Camelina Sativa Oil Deacidification by Molecular Distillation
Camelina sativa oil with 7.17 ± 0.07% mg KOH/g oil acidity was used. Thirty-nine experimental runs were performed to investigate the effects of evaporator temperature (seven experiments), wiper rolling speed (eight experiments), and feed flow rate (20 experiments) on deacidification efficiency. The vacuum conditions of 0.1 Pa were maintained in the system, and condenser temperature at 19 °C for all experiments. FFA, tocopherol, and MAG molecules, having smaller volume than glycerides, are first vaporized at specified pressure conditions and migrate to condenser surface. The evaporation temperature for Camelina sativa oil (as a mixture of FFA, TAG, DAG, MAG, and other components) was selected at 150° by many experimental trials when the first distillate was collected (evaporation degree between 1% and 10%) at pressure 0.1 Pa. This temperature, much lower than reported in literature [11,12,13,14,15], allowed us to reduce the heat consumption required by the evaporator, even if a high vacuum must be ensured. The wiper rolling speed and feed flowrates were chosen according to the limits of the equipment. Deacidification efficiency was greater than 90% for some operating conditions, no wastewater generated, and the oil losses are around 1–2%. Separated FFA can be valorized as valuable products.
3.2.1. Effect of Evaporator Temperature
Seven molecular distillation experiments were performed at different evaporator temperatures between 150 °C to 180 °C, fixed feed flow rate (2 mL/min), wiper rolling speed (300 rpm), pressure (0.1 Pa), and condenser temperature (19 °C). At this lower pressure, the mixture boiling temperature was not too high and TAG could not degrade (for a separation at 200 °C, it was observed that compounds with lower number of carbons appeared due to the glycerides degradation). During the separation process, light product rich in FFA and heavy product rich in TAG were separated. Increasing the evaporator temperature, the FFA concentration in oil decreased from 3.29% at 150 °C to 1.61% at 180 °C (Figure 1a), 90% for all samples. At temperature greater than 170 °C, the composition of FFA had a smaller change. The composition of TAG in oil was also affected by the evaporation temperature, increasing by 2% from 91.37% at 150 °C to 93.34% at 180 °C (Figure 1a). The deacidification efficiency increased with the temperature, having a maximum value of 80.39% at 180 °C (Figure 1b).
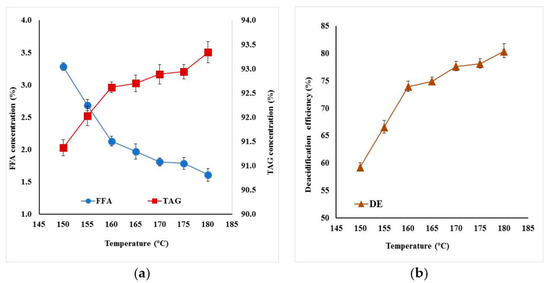
Figure 1.
Effect of evaporator temperature at constant flowrate (2 mL/min) and wiper rolling speed (300 rpm) on (a) FFA and TAG composition in deacidified oil, (b) deacidification efficiency.
3.2.2. Effect of Wiper Rolling Speed
Experimental studies were performed at five values between 250 and 350 rpm at two evaporator temperatures (160 °C and 170 °C), keeping the fix flow rate of 2 mL/min at pressure 0.1 Pa and condenser temperature 19 °C. As can be seen in Figure 2, the wiper rolling element (model UIC GmbH, Alzenau, Germany) had a great influence in the deacidification process by molecular distillation due to its role of dispersing liquid on the evaporator surface in a thin film and liquid mixing.
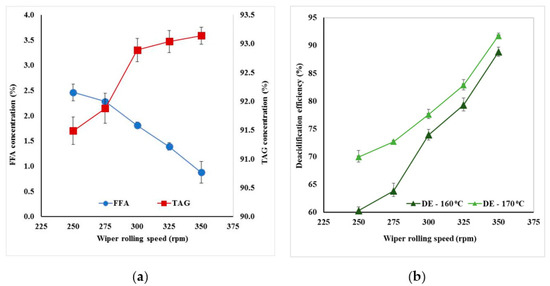
Figure 2.
Effect of wiper rolling speed at constant flow rate (2 mL/min) and evaporation temperature (170 °C) on (a) FFA and TAG composition in deacidified oil, (b) deacidification efficiency.
The increasing speed of wiper rolling decreased oil acidity from 2.46% to 0.88% at 170 °C (results presented in Figure 2a) and from 3.12% to 0.89% at 160 °C. Additionally, deacidification efficiency showed a significant increase at high speeds (88.83% at 160 °C and 91.75% at 170 °C). TAG concentration showed a moderate increase from almost 91.5% at 250 rpm to 93% at 350 rpm with small differences at the two evaporation temperatures studied. Under the same conditions, calculated deacidification efficiency showed an increase with 28% (for 160 °C) and 20% (for 170 °C), for an increase in the wiper rolling rotations with 100 rpm, due to a uniform oil distribution on the evaporator walls facilitating the evaporation (Figure 2b).
3.2.3. Effect of Feed Flow Rate
These studies were performed at an evaporator temperature of 170 °C and different values of feed flowrates (2 mL/min, 4 mL/min and 6 mL/min) with wiper speed at 250 rpm, 300 rpm, and 350 rpm at constant pressure (0.1 Pa) and condenser temperature (19 °C). The TAG composition decreased and FFA composition in bottom product increased when the flow rates increased. At 6 mL/min, the lowest FFA could be greater than 2.5% (Figure 3a).
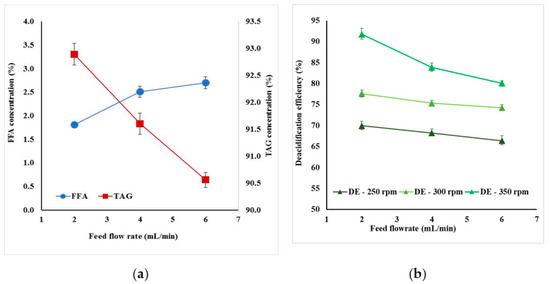
Figure 3.
Effect of feed flow rate at constant temperature (170 °C) and wiper speed (300 rpm) on (a) FFA and TAG composition in deacidified oil, (b) deacidification efficiency.
At low wiper speed, FFA content did not vary too much, but at high values, this difference became significant. This was determined by the fact that the feed flow rate influenced the system heat transfer: more energy for evaporation was needed if flow rate was increasing. In Figure 3b, the influence of feed flow rate versus deacidification efficiency is presented at different wiper rolling speeds. It was noticed that, at low speeds, the decrease was less than 5%, but at high speed, the deacidification efficiency decreased by 10% (Figure 3b).
3.3. Design of Experiment for Camelina Sativa Oil Deacidification Process
3.3.1. Fitting Models
Responses as FFA content in the bottom product (Y1), deacidification efficiency (Y2), and TAG concentration in the bottom product (Y3) were fitted by a second-order model with regression coefficients presented in Table 4, using a Box–Behnken design of experimental data. The fitted response surfaces were calculated with Equations (7)–(9):

Table 4.
Regression coefficients for proposed models.
For each response, all coefficients, and their p-value with 95% confidence interval were computed to validate the significance of regression models. The regression model is significant at 5% level if the p-value is smaller than 0.05. From Table 4, it can be observed that some terms did not have a significant effect: quadratic X2 and interaction X1X3 for Y1, only quadratic X3 for Y2 and quadratic X1, and interaction X1X2 for Y3. In Table 5, the experimental and data predicted with proposed second-order models are presented. It was observed that close correlations existed between the data. Also, the good correlation can be noticed in Figure 4 when predicted data are plotted versus experimental data for all three responses, all points being placed near a 45° line, especially for Y2.

Table 5.
Experimental vs predicted data with second-order model.
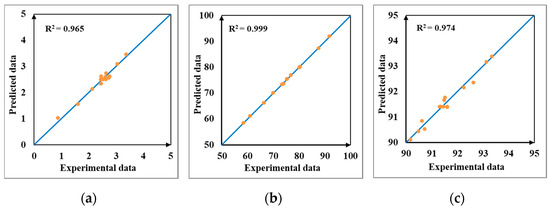
Figure 4.
Predicted versus experimental data for regression quadratic models. (a) Y1 (FFA), (b) Y2 (DE), (c) Y3 (TAG).
3.3.2. Statistical Validation of Model
Table 6 shows the analysis of variance (ANOVA) for all the responses investigated in this study. The models, linear, quadratic, and interaction terms of the three independent variables (temperature, speed, and flow rate), lack of fit (model error), and pure error (replicates error) were evaluated according to their degree of freedom, sum of squares, mean square, F-value, p-value, and model coefficient of determination R2. A model is good if it has a high F-value, low p-value, insignificant lack of fit, and high R2. The results of this analysis are presented in Table 6. For the FFA content (Y1), the ANOVA analysis of the quadratic model showed that the F-value of 21.156 implies that the model is significant at p < 0.001. The coefficient of determination R2 is 0.965, measuring how properly experimental data are approximated the regression model. The lack of fit was not significant (p > 0.05) and indicated that the model prediction is adequate. Examination of the coefficients for the first response indicated that the linear terms as evaporator temperature, wiper speed, and flow rate and the interaction terms between wiper speed and flow rate were highly significant with higher F-value and lower p-value. Quadratic terms of evaporator temperature and flow rate and interaction term between temperature and speed were significant, while quadratic term of speed and interaction term between temperature and flow rate were not significant with low F-value and p > 0.05. For the deacidification efficiency (Y2), the ANOVA analysis showed that a greater F-value of 2123.15 implies that the model is significant at p < 0.001. The coefficient of determination R2 was 0.999 and all the linear, quadratic, and interaction terms were significant (p < 0.05), except the quadratic effect of flow which was insignificant at p > 0.05. To determine if the models were compatible with experimental data, lack of fit test was calculated from residuals of fitting. The model was adequate, as indicated by the error analysis that showed insignificant lack of fit with p > 0.05. In case of the third response, TAG concentration (Y3), the obtained results showed that the model was significant with a F-value of 29.522 and p < 0.001. The coefficient of determination R2 was 0.974. All the linear terms were highly significant with high F-value and low p-value, while the quadratic term of evaporator temperature and the interaction term between temperature and speed were insignificant with low F-value and p > 0.05.

Table 6.
Analysis of variance (ANOVA) of all responses.
3.3.3. Optimization by Using Response Surface Methodology
This optimization method was used for Camelina sativa oil deacidification by molecular distillation process to locate one point or region/regions on factor surfaces, where fitted responses were acceptable (optimal) values. Response surfaces were computed for factor ranges between minimum and maximum values of fitted responses obtained with second-order model. The shape of these surfaces gave information about regions where responses had optimal values and the ranges of optimal factors that affected these responses. As can be seen from Y1 surfaces (Figure 5a), FFA composition should be at a minimum value in regions of higher X1 and X2 and lower X3.
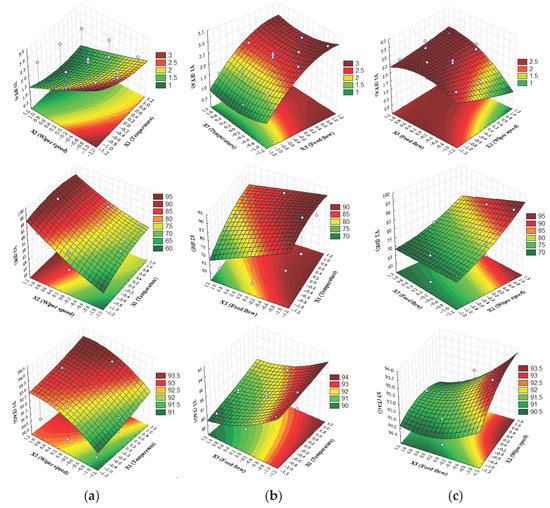
Figure 5.
Response surfaces for Y1, Y2, and Y3 based on: (a) X1X2 effects, X3 = ct, (b) X1X3 effects, X2 = ct, (c) X2X3 effects, X1 = ct.
These factors will have a positive impact on FFA composition (Y1 ≈ 1% FFA). Y2 surfaces had maximum regions (90–95%), identified in Figure 5b also in the same regions, for higher X1and X2 and lower X3. In Figure 5c, Y3 response surfaces in the same regions for maximum value of 93.5% are presented. First response (Y1-FFA) must be minimized while second (Y2-DE) and third (Y3-TAG concentration) responses must be maximized.
2D plots were computed to identify optimal values of responses when each factor had a variation between −1 and 1, and the other factors had constant values (from ranges identified on response surfaces). In Figure 6a, three profiles of response Y1 affected by X1, X2 and X3 are presented, these profiles showing minimum values.
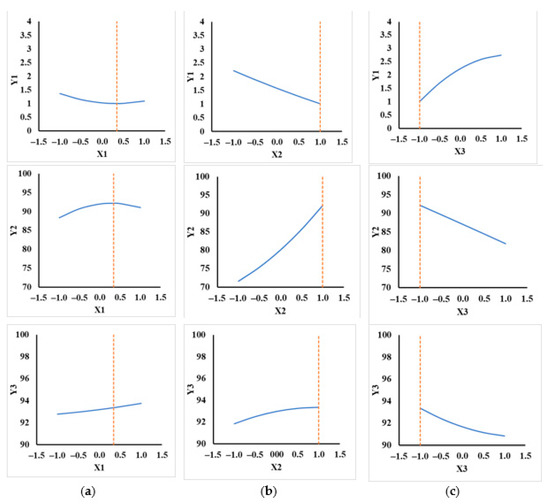
Figure 6.
Optimal responses: (a) X1 effects, (b) X2 effects, (c) X3 effects.
Profiles presented in Figure 6b,c represented the responses of Y2 and Y3 affected by the same factors. These profiles presented maximum values. All three response profiles presented the optimal values at X1 = 0.34629, X2 = 1, and X3 = −1. These values were in the regions identified in the regions from response surfaces.
For all responses, individual desirability functions were computed with values between 0 and 1, where 0 was for an undesirable response (response is greater than a target value for minimum point or less than the smallest value for maximum) and 1 indicated a completely desirable response (response is less than the smallest value for minimum point or greater than a target value for maximum point). Intermediate values of responses between smallest value and target value represented desirable responses. Smallest, medium, and target values for desirability functions are presented in Table 7, considering a linear variation for intermediate values.

Table 7.
Desirability function parameters.
Computing the individual desirability functions with STATISTICA© for factor values between −1 and 1; their profiles are presented in Figure 7.
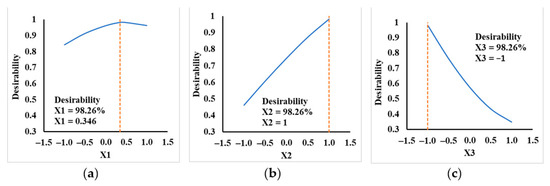
Figure 7.
Optimal desirability for: (a) X1 factor, (b) X2 factor, (c) X3 factor.
In Table 8, the optimal values of responses and factors are centralized. Final desirability function, defined as geometric mean of individual desirability functions, was 0.9826 for all factors combined. These optimal values of coded factors corresponded to optimal operating conditions such as: evaporator temperature of 173.5 °C, wiper rolling speed of 350 rpm, and a feed flow rate of 2 mL/min for the deacidification process of Camelina sativa oil by molecular distillation. At these conditions, separation parameters for this process were minimum composition of FFA in bottom product of 1.007% FFA, maximum deacidification efficiency of 92.167%, and maximum concentration of TAG in bottom product of 93.360% TAG, with a desirability of 0.9826.

Table 8.
Optimal factors, optimal responses, and desirability.
To validate the model prediction, two parallel trials were performed in the optimal operating conditions. FFA concentration of 1.15 ± 0.2%, a TAG concentration of 92.85 ± 0.05%, with a deacidification efficiency of 91.30 ± 0.1% were obtained, which is in good agreement with theoretical prediction.
3.4. Process Design, Economic and Environmental Analysis
In Figure 8, the process flowsheets for two deacidification processes of Camelina sativa oil are presented: ODAW—conventional method with alkali (Figure 8a) and ODMD—molecular distillation (Figure 8b). A 100 kg/batch of crude oil was fed in each process and 92.5 kg/batch of refined oil was obtained from ODMD process with 12.8% more than in ODAW process.
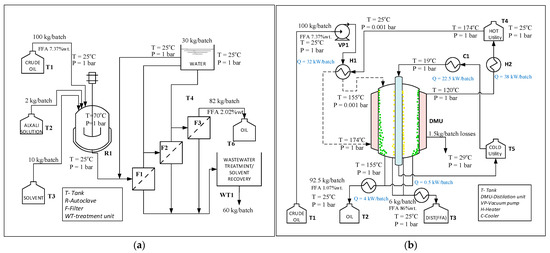
Figure 8.
Deacidification process flowsheet (a) ODAW-alkali process, (b) ODMD-molecular distillation process.
The annual number of batches was different for these two processes, due to the different operational time, 15 h for ODMD, and 50 h for the other process. ODAW process involved a reaction step, free fatty acids reacted with alkali to form soap, which retained 5% of crude vegetable oil. Three filtering and washing steps were needed to removed soaps and the 60 kg/batch of resulting wastewater needed to be treated. ODMD process involved a vacuum step and heating and cooling agents to assure evaporator temperature at 173.5 °C (to vaporize FFA) and 19 °C for cooling zone (to condense FFA molecules). Different tanks were used for raw materials and products.
The main advantages of the ODMD process are the reduction of crude oil losses from 18% to 1.5%, and no wastewater generation. For this process, heating/cooling/vacuum systems costs are increased. In Table 9, raw materials, utility consumptions, and the production cost estimation for both processes are presented.

Table 9.
Economic assessment for Camelina sativa oil deacidification.
Production cost was evaluated as a contribution of variable costs (equipment, raw materials, utilities, and treatment costs), fixed costs (operating, non-operating and administration labor costs, land, and others) and depreciation costs (Figure 9). Raw material specific costs ($/kg deacidified oil) were 40% higher for the alkali process due to the consumption of alkali solutions, wastewaters, and solvents. Also, the variable costs for the alkali process were influenced by treatment. For the molecular distillation process, the higher contribution of production costs was given by raw materials and utility costs.
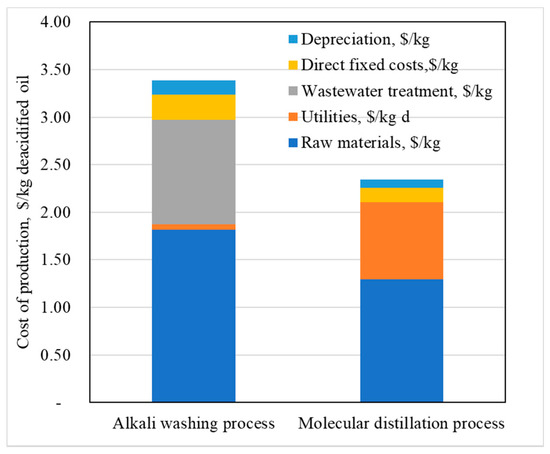
Figure 9.
Production costs components for Camelina sativa oil deacidification.
4. Conclusions
The efficiency of the Camelina sativa oil deacidification process by molecular distillation was determined by combining experimental studies (to identify operating conditions) with statistical analysis (for optimal conditions) and technical-economic analysis (to evaluate production costs). The results were compared with a classical process, using alkali solutions to remove FFA. Experimental studies for deacidification of Camelina sativa oil with 7.67% FFA using both methods led to a process efficiency over 80% and final FFA content lower than 1%, but the conventional process generated wastewater with soap and 18% oil loss.
Molecular distillation involves the mixture evaporation in vacuum conditions, and trial experiments were needed to obtain operation parameters. Changing values of some operating conditions, such as evaporator temperature, wiper rolling speed, and feed flow rate in a specified range, led to a modification of deacidification efficiency with 35.44%. Moreover, 88% of FFA were removed from oil, while TAG composition in refined oil varies by 8%. Optimal operation conditions were performed using DOE, formulating a Box–Behnken design with three factors and three responses: evaporator temperature was 173.5 °C, wiper speed was 350 rpm, and feed flow rate was 2 mL/min, evaluated for a process desirability of 0.9826. In these conditions, the deacidification efficiency was 92.167%, FFA composition in deacidified oil was 1.007%, and TAG concentration was 93.36%. The technical and economic analysis accomplished for both deacidification processes (ODAW and ODMD), for 100 kg/batch Camelina sativa oil in optimal conditions, allows the evaluation of processes sustainability: raw materials and utility consumption per kg of deacidified Camelina sativa oil (1.22 kg vs. 1.08 kg and 1 kWh vs. 0.25 kWh), wastewater generation (0.73 kg vs. 0 kg), and production costs ratio (45% higher for ODAW process). The results showed that using ODMD method some drawbacks of oil deacidification processes can be removed: the method can be applied for oils with different acidities and different compositions, oil losses are minimized, and wastewater treatment are reduced.
Author Contributions
Conceptualization, N.G.Ş., P.I. and I.C.; Formal analysis, N.G.Ş. and P.I.; Investigation, N.G.Ş., P.I. and V.P.; Methodology, N.G.Ş., P.I., V.P., I.C. and N.D.I.; Supervision, V.P. and I.C.; Validation, V.P. and N.D.I.; Visualization, I.C.; Writing—original draft, N.G.Ş., P.I., I.C. and N.D.I.; Writing—review and editing, P.I. All authors will be informed about each step of manuscript processing including submission, revision, revision reminder, etc. via emails from our system or assigned Assistant Editor. All authors have read and agreed to the published version of the manuscript.
Funding
This research received no external funding.
Institutional Review Board Statement
Not applicable.
Informed Consent Statement
Informed consent was obtained from all subjects involved in the study.
Data Availability Statement
The data presented in this study are available on request from the corresponding author. The data are not publicly available due to ethical considerations.
Acknowledgments
The authors gratefully acknowledge the financial support of the European Commission through the European Regional Development Fund and of the Romanian state budget, under the grant agreement POC P-37-449 (acronym ASPiRE).
Conflicts of Interest
The authors declare no conflict of interest.
References
- Vaisali, C.; Charanyaa, S.; Belur, P.D.; Regupathi, I. Refining of edible oils: A critical appraisal of current and potential technologies. Int. J. Food Sci. Technol. 2014, 50, 13–23. [Google Scholar] [CrossRef]
- Barreca, F.; Praticò, P. Assessment of Passive Retrofitting Strategies to Improve the Thermal Performance of Extra-Virgin Olive Oil Storage Area in Traditional Rural Olive Mills. Sustainability 2019, 12, 194. [Google Scholar] [CrossRef]
- Wang, T.; Johnson, L.A. Refining high-free fatty acid wheat germ oil. J. Am. Oil Chem. Soc. 2001, 78, 71–76. [Google Scholar] [CrossRef]
- Bhattacharyya, A.C.; Bhattacharyya, D.K. Deacidification of high FFA rice bran oil by reesterification and alkali neutralization. J. Am. Oil Chem. Soc. 1987, 64, 128–131. [Google Scholar] [CrossRef]
- Bombos, D.; Bombos, M.; Bolocan, I.; Vasilievici, G.; Zaharia, E. Esterification of glycerol with technical olein in heterogeneous catalysis. Rev. Chim. 2010, 61, 784–787. [Google Scholar]
- Boffito, D.; Pirola, C.; Galli, F.; Di Michele, A.; Bianchi, C. Free fatty acids esterification of waste cooking oil and its mixtures with rapeseed oil and diesel. Fuel 2013, 108, 612–619. [Google Scholar] [CrossRef]
- Oprescu, E.E.; Bombos, D.; Dragomir, R.E.; Stepan, E.; Bolocan, I. Esterification of free fatty acids with methanol over superacid catalyst. Rev. Chim. 2015, 66, 864–867. [Google Scholar]
- Rodrigues, C.E.C.; Goncalves, C.B.; Batista, E.; Meirelles, A.J. Deacidification of Vegetable Oils by Solvent Extraction. Recent Patents Eng. 2007, 1, 95–102. [Google Scholar] [CrossRef]
- Bollman, H. Process for the Removal of Fatty Acids, Resins, Bitter and Mucilaginous Substances from Fats and Oils. U.S. Patent US19211371342, 15 March 1921. [Google Scholar]
- Asl, P.J.; Niazmand, R.; Yahyavi, F. Extraction of phytosterols and tocopherols from rapeseed oil waste by supercritical CO2 plus co-solvent: A comparison with conventional solvent extraction. Heliyon 2020, 6, e03592. [Google Scholar] [CrossRef]
- Biasutti, M.A. Comparative Analysis of Forms and Wikis as Tools for Online Collaborative Learning. Comput. Educ. 2017, 107, 158–171. [Google Scholar] [CrossRef]
- Wu, W.; Wang, C.; Zheng, J. Optimization of deacidification of low-calorie cocoa butter by molecular distillation. LWT 2012, 46, 563–570. [Google Scholar] [CrossRef]
- Salimon, J. Free Fatty Acids Separation from Malaysian High Free Fatty Acid Crude Palm Oil Using Molecular Distillation. Malays. J. Anal. Sci. 2016, 20, 1042–1051. [Google Scholar] [CrossRef]
- Han, L.; Zhang, S.; Qi, B.-K.; Li, H.; Xie, F.-Y.; Li, Y. Molecular Distillation-Induced Deacidification of Soybean Oil Isolated by Enzyme-Assisted Aqueous Extraction: Effect of Distillation Parameters. Appl. Sci. 2019, 9, 2123. [Google Scholar] [CrossRef]
- Altuntas, A.H.; Ketenoğlu, O.; Çetinbaş, S.; Erdoğdu, F.; Tekin, A. Deacidification of Crude Hazelnut Oil Using Molecular Distillation—Multiobjective Optimization for Free Fatty Acids and Tocopherol. Eur. J. Lipid Sci. Technol. 2018, 120. [Google Scholar] [CrossRef]
- Choi, J.H.; Kim, S.-S.; Woo, H.C. Characteristics of vacuum fractional distillation from pyrolytic macroalgae (Saccharina japonica) bio-oil. J. Ind. Eng. Chem. 2017, 51, 206–215. [Google Scholar] [CrossRef]
- El-Salam, A.S.M.A.; Doheim, M.A.; Sitohy, M.Z.; Ramadan, M.F. Deacidification of High-acid Olive Oil. J. Food Process. Technol. 2015, s5, 1–7. [Google Scholar] [CrossRef]
- Iancu, P.; Stefan, N.G.; Plesu, V.; Toma, A.; Stepan, E. Advanced high vacuum techniques for ω-3 polyunsaturated fatty acids esters concentration. Rev. Chim. (Bucharest) 2015, 66, 911–917. [Google Scholar]
- International Organization for Standardization. Animal and Vegetable Fats and Oils—Determination of Acid Value and Acidity (SR EN Standard No. 660). 2009. Available online: https://www.iso.org/standard/44879.html, (accessed on 30 January 2020).
- European Standards. Fat and Oil Derivatives-Fatty Acid Methyl Esters (FAME)-Determination of Free and Total Glycerol and Mono, Di-, Triglyceride Contents (SR EN Standard No. 14105). 2011. Available online: https://www.en-standard.eu/search/?q=en+14105 (accessed on 30 January 2020).
- Shao, P.; Jiang, S.; Ying, Y. Optimization of Molecular Distillation for Recovery of Tocopherol from Rapeseed Oil Deodorizer Distillate Using Response Surface and Artificial Neural Network Models. Food Bioprod. Process. 2007, 85, 85–92. [Google Scholar] [CrossRef]
- Zhang, G.; Liu, J.; Liu, Y. Concentration of Omega-3 Polyunsaturated Fatty Acids from Oil of Schizochytrium limacinum by Molecular Distillation: Optimization of Technological Conditions. Ind. Eng. Chem. Res. 2013, 52, 3918–3925. [Google Scholar] [CrossRef]
- Avram, M.; Stroescu, M.; Stoica-Guzun, A.; Floarea, O. Optimization of the oil extraction from camelina (Camelina sativa) seeds using response surface methodology. Rev. Chim. (Bucharest) 2015, 66, 417–421. [Google Scholar]
- Masoumi, H.R.F.; Basri, M.; Samiun, W.S.; Izadiyan, Z.; Lim, C.J. Enhancement of encapsulation efficiency of nanoemulsion-containing aripiprazole for the treatment of schizophrenia using mixture experimental design. Int. J. Nanomed. 2015, 10, 6469–6476. [Google Scholar] [CrossRef] [PubMed]
- Carbon, V.L.; Sayago, A.; Domínguez, R.G.; Recamales, A.F. Simple and Efficient Green Extraction of Steviol Glycosides from Stevia rebaudiana Leaves. Foods 2019, 8, 402. [Google Scholar] [CrossRef]
- Dantas, T.; Cabral, T.; Neto, A.D.; Moura, M. Enrichmnent of patchoulol extracted from patchouli (Pogostemon cablin) oil by molecular distillation using response surface and artificial neural network models. J. Ind. Eng. Chem. 2020, 81, 219–227. [Google Scholar] [CrossRef]
- Tehlah, N.; Kaewpradit, P.; Mujtaba, I.M. Development of Molecular Distillation Based Simulation and Optimization of Refined Palm Oil Process Based on Response Surface Methodology. Processes 2017, 5, 40. [Google Scholar] [CrossRef]
Publisher’s Note: MDPI stays neutral with regard to jurisdictional claims in published maps and institutional affiliations. |
© 2021 by the authors. Licensee MDPI, Basel, Switzerland. This article is an open access article distributed under the terms and conditions of the Creative Commons Attribution (CC BY) license (http://creativecommons.org/licenses/by/4.0/).