Article

A Trial-and-Error Toll Design Method for Traffic Congestion Mitigation on Large River-Crossing Channels in a Megacity

1
Department of Logistics and Maritime Studies, The Hong Kong Polytechnic University, Hung Hom, Hong Kong, China
2
Jiangsu Key Laboratory of Urban ITS, Jiangsu Province Collaborative Innovation Center of Modern Urban Traffic Technologies, School of Transportation, Southeast University, Nanjing 211189, China
3
School of Cyber Science and Engineering, Southeast University, Nanjing 211189, China
*
Author to whom correspondence should be addressed.
Sustainability 2021, 13(5), 2749; https://doi.org/10.3390/su13052749
Submission received: 23 January 2021 / Revised: 16 February 2021 / Accepted: 22 February 2021 / Published: 3 March 2021
(This article belongs to the Collection Sustainability in Urban Transportation Planning)

Abstract

:
In this study, we addresse traffic congestion on river-crossing channels in a megacity which is divided into several subareas by trunk rivers. With the development of urbanization, cross-river travel demand is continuously increasing. To deal with the increasing challenge, the urban transport authority may build more river-crossing channels and provide more high-volume public transport services to alleviate traffic congestion. However, it is widely accepted that even though these strategies can mitigate traffic congestion to a certain level, they are not essential approaches to address traffic congestion. In this study, we consider a channel toll scheme for addressing this issue. Additional fares are applied to private vehicles, that an appropriate number of private vehicle drivers are motivated to take public transport or switch to neighboring uncongested river-crossing channels. To minimize the toll surcharge on both neighboring channels, while alleviating the traffic flow to a certain level, in this study, we provide a bi-objective mathematical model. Some properties of this model are discussed, including the existence and uniqueness of the Pareto optimal solution. To address this problem, a trial-and-error method is applied. Numerical experiments are provided to validate the proposed solution method.

1. Introduction

Many megacities have developed along trunk rivers, such as Minneapolis, St. Louis, Vienna, Shanghai, and Nanjing. Although trunk rivers provide convenient shipping conditions and boost economic development, they divide a city into several subareas. Travelers between subareas have to take a river-crossing channel to visit each other. With the rapid development of the economy and urbanization, the limited river-crossing channels become a bottleneck in the urban transport network. For instance, approximately 400,000 private vehicles and 600,000 commuters in Nanjing travel across the Nanjing Yangtze river bridge each day [1]. In the commuting peak period, cumulative commuters from both sides of the river travel across the bridge, such that the travel demand on the bridge is excessively high. High demands cause serious congestion on the bridge, which is shown by the over-congested scenario in which vehicles with limited headway repeatedly stop and go on the bridge during peak hours. To mitigate serious congestion on a channel, a large number of transport policies are assigned at a bridge to organize traffic flow during peak hours [2]. Road traffic signals, upstream of the bridge, are also adjusted to control on-bridge traffic volume to a certain level. However, this strategy can only relieve the congestion on the bridge. During peak hours, cumulative river-crossing traffic demands stop under the bridge and wait for the pass signal. As the queuing length grows, traffic congestion gradually spreads througout the entire road network. Investigations have shown that a traveler should take an average of 1 h to pass a bridge during peak hours, about 4.6 times longer than the ordinary situation.
More sustainable strategies for addressing this problem are to build more river-crossing channels and promote public transport. These strategies both have their limitations. On the one hand, constructing more channels is a long-term solution rather than an effective method that can have an effect in a short period of time. On the other hand, alternative river-crossing channels are located at least several kilometers away from the original one and travelers have to take a detour and drive further which largely undermines their interest in choosing new channels. Public transport is efficient concerning accommodating passengers, however, the in-carriage congestion, inflexible scheduling, and travel path also limit the promotion of public transport. New approaches are needed to address this issue.
Recently, ref. [3] proposed a novel and efficient trial-and-error train fare design scheme for addressing boarding/alighting congestion at Central Business District (CBD) stations. In their study, an additional train fare scheme was implemented at the congested train station to motivate an appropriate number of passengers to board/alight at the neighboring uncongested stations on the railway line. Their study provides a new method to deal with congestion on large river-crossing channels.
It has been widely observed that even for neighboring river-crossing channels, the congestion level can be quite different. For instance, in Nanjing, with the rapid development of urbanization, more river-crossing travel demands have been generated. In the early 1990s, the daily travel volume crossing the Nanjing Yangtze river bridge was around 20,000, while nowadays, the daily river-crossing volume on the Nanjing Yangtze river bridge exceed 100,000, which cannot meet the surging demand of travelers [4]. Therefore, by charging an appropriate amount of tolls to congested channels or equivalently providing credits to uncongested channels, we can move part of the river-crossing traffic flow from the congested channels to the adjacent uncongested channels or alternative public transport modes. Compared with the abovementioned methods that spread peak demand over time, shift demand to an adjacent channel or alternative travel mode is more reasonable for inflexible daily commuting.
In this paper, we study the problem in the context of two neighboring river-crossing channels. Additional tolls are determined on the congested channel to shift an appropriate part of traffic demands to the neighboring channel or public transport modes. In this study, we apply the methodology proposed by [3]. We assume the traffic congestion on the channels is an equilibrium state and travelers make their travel decisions such as travel modes and routes at home, based on their perceived generalized travel cost. The role of additional river-crossing toll is to shift travelers’ modal split/route choice from one equilibrium state to another. Travelers have multiple travel chooses, such as park-and-ride. Travelers can drive from home, park their car at a parking site, and ride through the channel. Given public acceptability, the objective of this problem is to minimize the toll surcharge at the congested channels, while alleviating the traffic congestion to an appropriate level. The main challenge of solving this model is that the relation between toll and travelers’ responses (demand function) is hard to calibrate in practice. In other words, the exact formulation of demand function is hard to establish. Therefore, a trial-and-error scheme is adopted which guarantees the optimal toll pattern without requiring specific forms of the demand function. The toll patterns are iteratively adjusted in which each adjustment is based on the information obtained from previous observations. The optimal toll pattern can be efficiently obtained within a limited number of trials.
This paper is organized into six sections. In Section 2, we summarize the related literature. In Section 3, the bi-objective optimization problem is proposed, together with the necessary assumptions and properties used in this study. A trial-and-error method is proposed and explained in Section 4. In Section 5, we present an illustrative example to validate the proposed model and method and in Section 6, we provide our conclusions.

2. Literature Review

The traffic congestion management problem belongs to the class of demand management problems. Numerous studies have been devoted to this area, such as providing new and novel public transport service modes [5,6,7,8,9] and congestion pricing schemes [10,11,12,13,14,15,16,17,18,19]. Congestion pricing is widely accepted as a potential approach to mitigating congestion in a transportation system. These studies have mainly focused on the general transport networks. The cost difference between the marginal social cost and the marginal private cost is externalized as a pricing scheme [19]. Travelers’ behaviors are expected to adjust to achieve the optimum system. The studies in other fields, for example, a neighboring bottleneck system, are relatively sparse. [3] proposed a novel pricing approach to retain the boarding/alighting flow within the predetermined/designed threshold by spreading the boarding/alighting demand over space. An efficient trial-and-error method was developed to search the Paretooptimal solution that did not rely on the specific expression of the demand function.
The studies of the trial-and-error method with unknown demand functions can be classified into three categories. The first line of research aims to find the system optimum flow by link tolls based on the trial-and-error method. Refs. [20,21] were the initial studies that apply the trial-and-error method to address the problem without specific formulation of demand functions. Ref. [22] proposed a bi-section trial-and-error method to realize the idea of trial-and-error on a single road segment, which was later extended by [23] to the transport networks. They iteratively adjusted the marginal-cost toll scheme based on the method of successive averages and proved its convergence. Based on [23,24] proposed a trial-and-error method for the second-best congestion pricing scheme under the user equilibrium conditions. Refs. [25,26,27] further extended the method to more general cases.
The second line of research is to control link flow within a certain threshold with unknown demand functions, link travel time functions, as well as users’ value of time. Ref. [28] searched the optimal link toll pattern to retain the link flow within the environmental capacity constraints based on a trial-and-error scheme. Ref. [29] extended their work by developing a prediction-correction method to allow non-separable, asymmetric link cost functions, and achieved a better convergence rate. Ref. [30] extended the method of [29] to allow traffic flow to be inaccurately observed. Ref. [18] applied the concept of the trial-and-error method to the field of cordon-based congestion pricing. Ref. [31] proposed a new framework for the trial-and-error method to satisfies both system optimum and capacity constraint conditions.
The third line of research is applying the trial-and-error method to study the day-to-day dynamics of network flows. Ref. [32] proposed a trial-and-error method to address the first-best congestion pricing problem. Ref. [33] proposed a day-to-day toll method under the concept of the discrete rational adjustment process to achieve the restraint target of traffic flows. Ref. [34] proposed a realistic trial-and-error method in which the tolls could be updated at any arbitrary time interval. Ref. [35] proposed a new trial-and-error congestion pricing method by incorporating the day-to-day dynamic flow adjustment process with heterogeneous inertia patterns. Compared to existing trial-and-error applications, in this paper, we consider a bi-objective optimization model to address the traffic congestion on river-crossing channels.

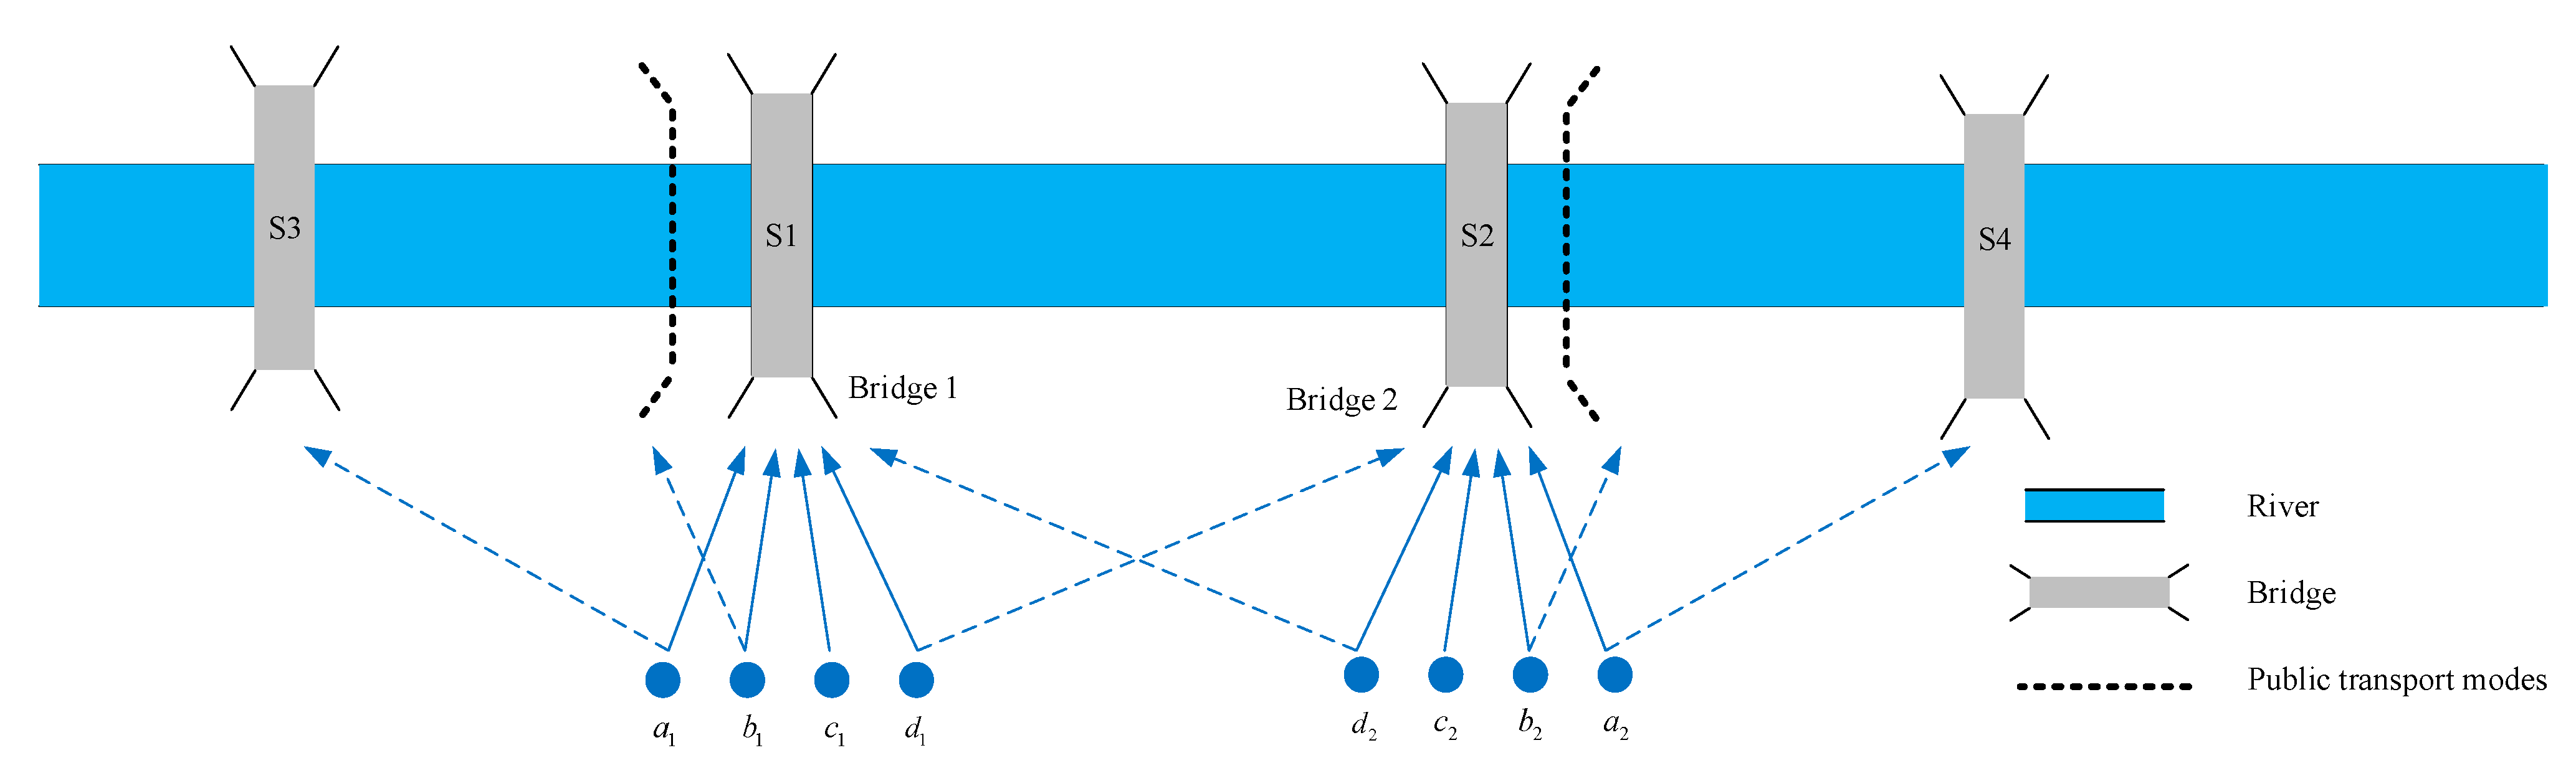
3. Problem Statement

In this section, we briefly introduce the mathematical formulation and discuss some necessary properties of the model. We note that the exact expression of demand functions is unknown. In this paper, we study the problem in the context of four neighboring river-crossing channels which are shown in Figure 1. We assume the travelers on the congested channel can switch to the neighboring channels or the public transport modes after imposing certain tolls. We note that travelers’ mode choice is made at home. Travelers make their travel decisions based on their perceived generalized travel cost. In addition, traffic congestion is an equilibrium state. Namely, travelers have full information about the travel impendence of alternative travel modes and routes. Due to the heterogeneity of travelers, some of them will switch to alternative travel modes or routes, such as public transport. The dotted lines shown in Figure 1 indicate the travelers who changed their travel decisions based on the given toll pattern.

3.1. Demand Function

In this study, the neighboring river-crossing channels are considered which are denoted as S 1 , S 2 , S 3 , and S 4 . S 1 and S 2 are the channels that may be congested. Let q 1 and q 2 denote the travel demands, C 1 and C 2 denote the service capacity, x and y denote the toll fares of S 1 and S 2 , respectively. Service capacity means the planned traffic volume that a channel can service per hour. When the observed traffic flow exceeds the service capacity, the congestion happens. The values of x and y are to be determined. Considering the public acceptability, the upper bounds x ¯ and y ¯ are imposed on the channel toll increase as follows: ( x , y ) [ 0 , x ¯ ] × [ 0 , y ¯ ] . The traffic demand on channel S 1 can be categorized into the following four types: (i) travelers who may shift to S 3 , (ii) travelers who may shift to public transport modes, (iii) travelers who always use S 1 , and (iv) travelers who may shift to S 2 . Let a 1 , b 1 , c 1 , d 1 denote the potential demand of the four categories travelers at S 1 . According to the flow conservation condition, we have:
a 1 + b 1 + c 1 + d 1 = q 1 .
Similarly, travelers on channel S 2 can also be categorized into the following four types: (i) travelers who may switch to S 4 , (ii) travelers who may switch to public transport modes, (iii) travelers who always use S 2 , and (iv) travelers who may switch to S 1 . Assume the potential demand of the three categories travelers are a 2 , b 2 , c 2 , d 2 , respectively. Then, we have the following:
a 2 + b 2 + c 2 + d 2 = q 2 .
Let f 1 ( x ) denote the probability of travelers on S 1 in the first category who will still choose S 1 , and f 2 ( y ) denote the probability of travelers on S 2 in the first category who still choose S 2 . Let g 1 ( x ) denote the probability of travelers on S 1 in the second category who will still choose S 1 , and g 2 ( y ) denote the probability of travelers on S 2 in the second category who will still choose S 2 . Similarly, we let h 1 ( x y ) denote the probability of travelers on S 1 in the fourth category who will still use S 1 , i.e., d 1 ( 1 h 1 ( x y ) ) travelers will switch to S 2 . Let function h 2 ( y x ) denote the probability of travelers on S 2 in the fourth category who still choose S 2 . We note that f 1 ( x ) , f 2 ( y ) , g 1 ( x ) , g 2 ( y ) , h 1 ( x y ) , h 2 ( y x ) are the demand functions that depict the relationship between travel demand and channel tolls. The explicit expression of the demand function is hard to be precisely calibrated in the real world, due to the scattering features of the traffic flow. In other words, the detailed expression of demand function is absent in practice. The only information we know is that some travelers may switch to neighboring channels or public transport modes after exerting a certain amount of toll on the congested channel.
Therefore, we assume the demand functions, f 1 ( x ) , f 2 ( y ) , g 1 ( x ) , g 2 ( y ) , h 1 ( x y ) , h 2 ( y x ) have the following properties: (a) f 1 ( x ) is continuous and monotonically decreasing over [ 0 , x ¯ ] , f 1 ( 0 ) = 1 , 0 f 1 ( x ) 1 , x [ 0 , x ¯ ] ; (b) g 1 ( x ) is continuous and monotonically decreasing over [ 0 , x ¯ ] , g 1 ( 0 ) = 1 , 0 g 1 ( x ) 1 , x [ 0 , x ¯ ] ; (c) h 1 ( x y ) is continuous and monotonically decreasing over x y [ 0 , x ¯ ] , h 1 ( x y ) = 1 , x y [ y ¯ , 0 ] , 0 h 1 ( x y ) 1 , x y [ 0 , x ¯ ] ; (d) f 2 ( y ) is continuous and monotonically decreasing over [ 0 , y ¯ ] , f 2 ( 0 ) = 1 , 0 f 2 ( y ) 1 , y [ 0 , y ¯ ] ; (e) g 2 ( y ) is continuous and monotonically decreasing over [ 0 , y ¯ ] , g 2 ( 0 ) = 1 , 0 g 2 ( y ) 1 , x [ 0 , y ¯ ] ; (f) h 2 ( y x ) is continuous and monotonically decreasing over y x [ 0 , y ¯ ] , h 2 ( y x ) = 1 , y x [ x ¯ , 0 ] , 0 h 2 ( y x ) 1 , y x [ 0 , y ¯ ] .
The number of travelers using S 1 after the pricing implementation is a function of ( x , y ) , denoted by X ( x , y ) . Then, we have the following:
X ( x , y ) = a 1 f 1 ( x ) + b 1 g 1 ( x ) + c 1 + d 1 h 1 ( x y ) + d 2 ( 1 h 2 ( y x ) ) .
Similarly, the number of travelers using S 2 after the pricing implementation is also a function of ( x , y ) , denoted by Y ( x , y ) which can be expressed as:
Y ( x , y ) = a 2 f 2 ( y ) + b 2 g 2 ( y ) + c 2 + d 1 ( 1 h 1 ( x y ) ) + d 2 h 2 ( y x ) .
According to the abovementioned properties of the demand function, we can infer that X ( x , y ) and Y ( x , y ) are continuous with respect to x and y . Fixing x , X ( x , y ) increases in y and Y ( x , y ) decreases in y . Besides, simultaneously increasing x and y by the same amount of toll will not shift travelers between S 1 and S 2 , but will motivate travelers to shift to S 3 , S 4 , and the public transport modes.

3.2. Mathematical Model

In this section, a bi-objective optimization model is proposed to minimize the value of tolls on both channels, i.e., M1, as follows:
min x [ 0 , x ¯ ] y [ 0 , y ¯ ] ( x y )
s.t.
X ( x , y ) C 1
Y ( x , y ) C 2
The objective function (5) aims to simultaneously minimize ( x , y ) . Constraints (6) and (7) ensure the traffic flow does not exceed the designed service capacity. We note that M1 is a bi-objective optimization model. The solution ( x , y ) of M1 is Pareto optimal if and only if for any feasible solution ( x , y ) such that x x , y y , and at least one of the two inequalities is strict binding. The proposed model is essentially an application of the methodology proposed by [3]. According to Theorem 1 in [3], model M1 is equivalent to M2 as follows:
min x ( 0 , x ¯ ] y ( 0 , y ¯ ] ( x y )
s.t.
X ( x , y ) = C 1
Y ( x , y ) = C 2 .
According to Theorem 3 in [3], model M2 has only one unique feasible solution. That means, its equivalent model (M1) also has only one feasible solution and this unique solution is also the Pareto optimal solution of model M1. Therefore, the problem of finding the Pareto optimal solution of M1 becomes the problem of finding the unique feasible solution.

4. The Trial-and-Error Toll Design Method

This section discusses a trial-and-error method to search the Pareto optimal solution of model M1. Due to the specific expression of demand function is unknown, we can only obtain some necessary information from the trial. Therefore, a trial-and-error scheme is an essential way to solve the model M1. The nature of the trial-and-error scheme is to identify a toll adjustment mechanism so that the information obtained from each trial can be efficiently utilized.
Ref. [3] proposed a trial-and-error method to address this kind of bi-objective problem. The basic idea of their method is to find a feasible solution ( x , y ) that satisfying X ( x , y ) = Q and Y ( x , y ) = Q , where Q denotes the service capacity of the train station in their model. They discover that after implementing a trial ( x , y ) , the response of travelers, i.e., the traffic volume, can be observed and provide some information to identify the infeasible region. The infeasible regions can be iteratively identified and eliminated until the unique feasible solution is identified.
In this study, we apply the trial-and-error methodology proposed by [3] to address the model M2. For completeness, we briefly introduce the procedure of this algorithm as Algorithm 1:
Algorithm 1: A trial-and-error algorithm
1  Set the iteration counter n = 0 . Set the initial upper
bound of x and y , i.e., x ¯ and y ¯ . Let x u , n and x l , n denote the adjusted lower and upper bound of x in n th iteration. Let y u , n and y l , n denote the adjusted lower and upper bound of y in n th iteration. Set x u , n = x ¯ , x l , n = 0 , y u , n = y ¯ , y l , n = 0 . Set the error gap ε > 0 .
2  Adjust the tolls with the following formula:
x n = ( x u , n + x l , n ) / 2
y n = ( y u , n + y l , n ) / 2
3  Observe the X n and Y n .
If X n [ C 1 ε , C 1 + ε ] , Y n [ C 2 ε , C 2 + ε ] , the Pareto-optimal solution has obtained.
4  Remove the infeasible region according to the observed X n and Y n and update the lower and upper bound x u , n , x l , n , y u , n , y l , n of x and y , respectively.
5  Let n = n + 1 . Go back to Step 2.
We note that the trial-and-error algorithm introduced above clarifies the procedures of adjusting the tolls x and y . However, the mechanism of removing the infeasible region is unclear. Therefore, we proceed to introduce the mechanism of identifying the infeasible region according to the observed X n and Y n , which is summarized in Table 1.
As shown in Table 1, the shadow part represents the infeasible region and the normal part represents the feasible region. Given an arbitrary trial of ( x n , y n ) at iteration n , there exist six scenarios and different scenarios have different infeasible regions. The remaining domain obtained from Table 1 is still a rectangle, thus, the infeasible regions could be repeatedly identified according to Table 1 until the Pareto optimal price ( x , y ) is found.

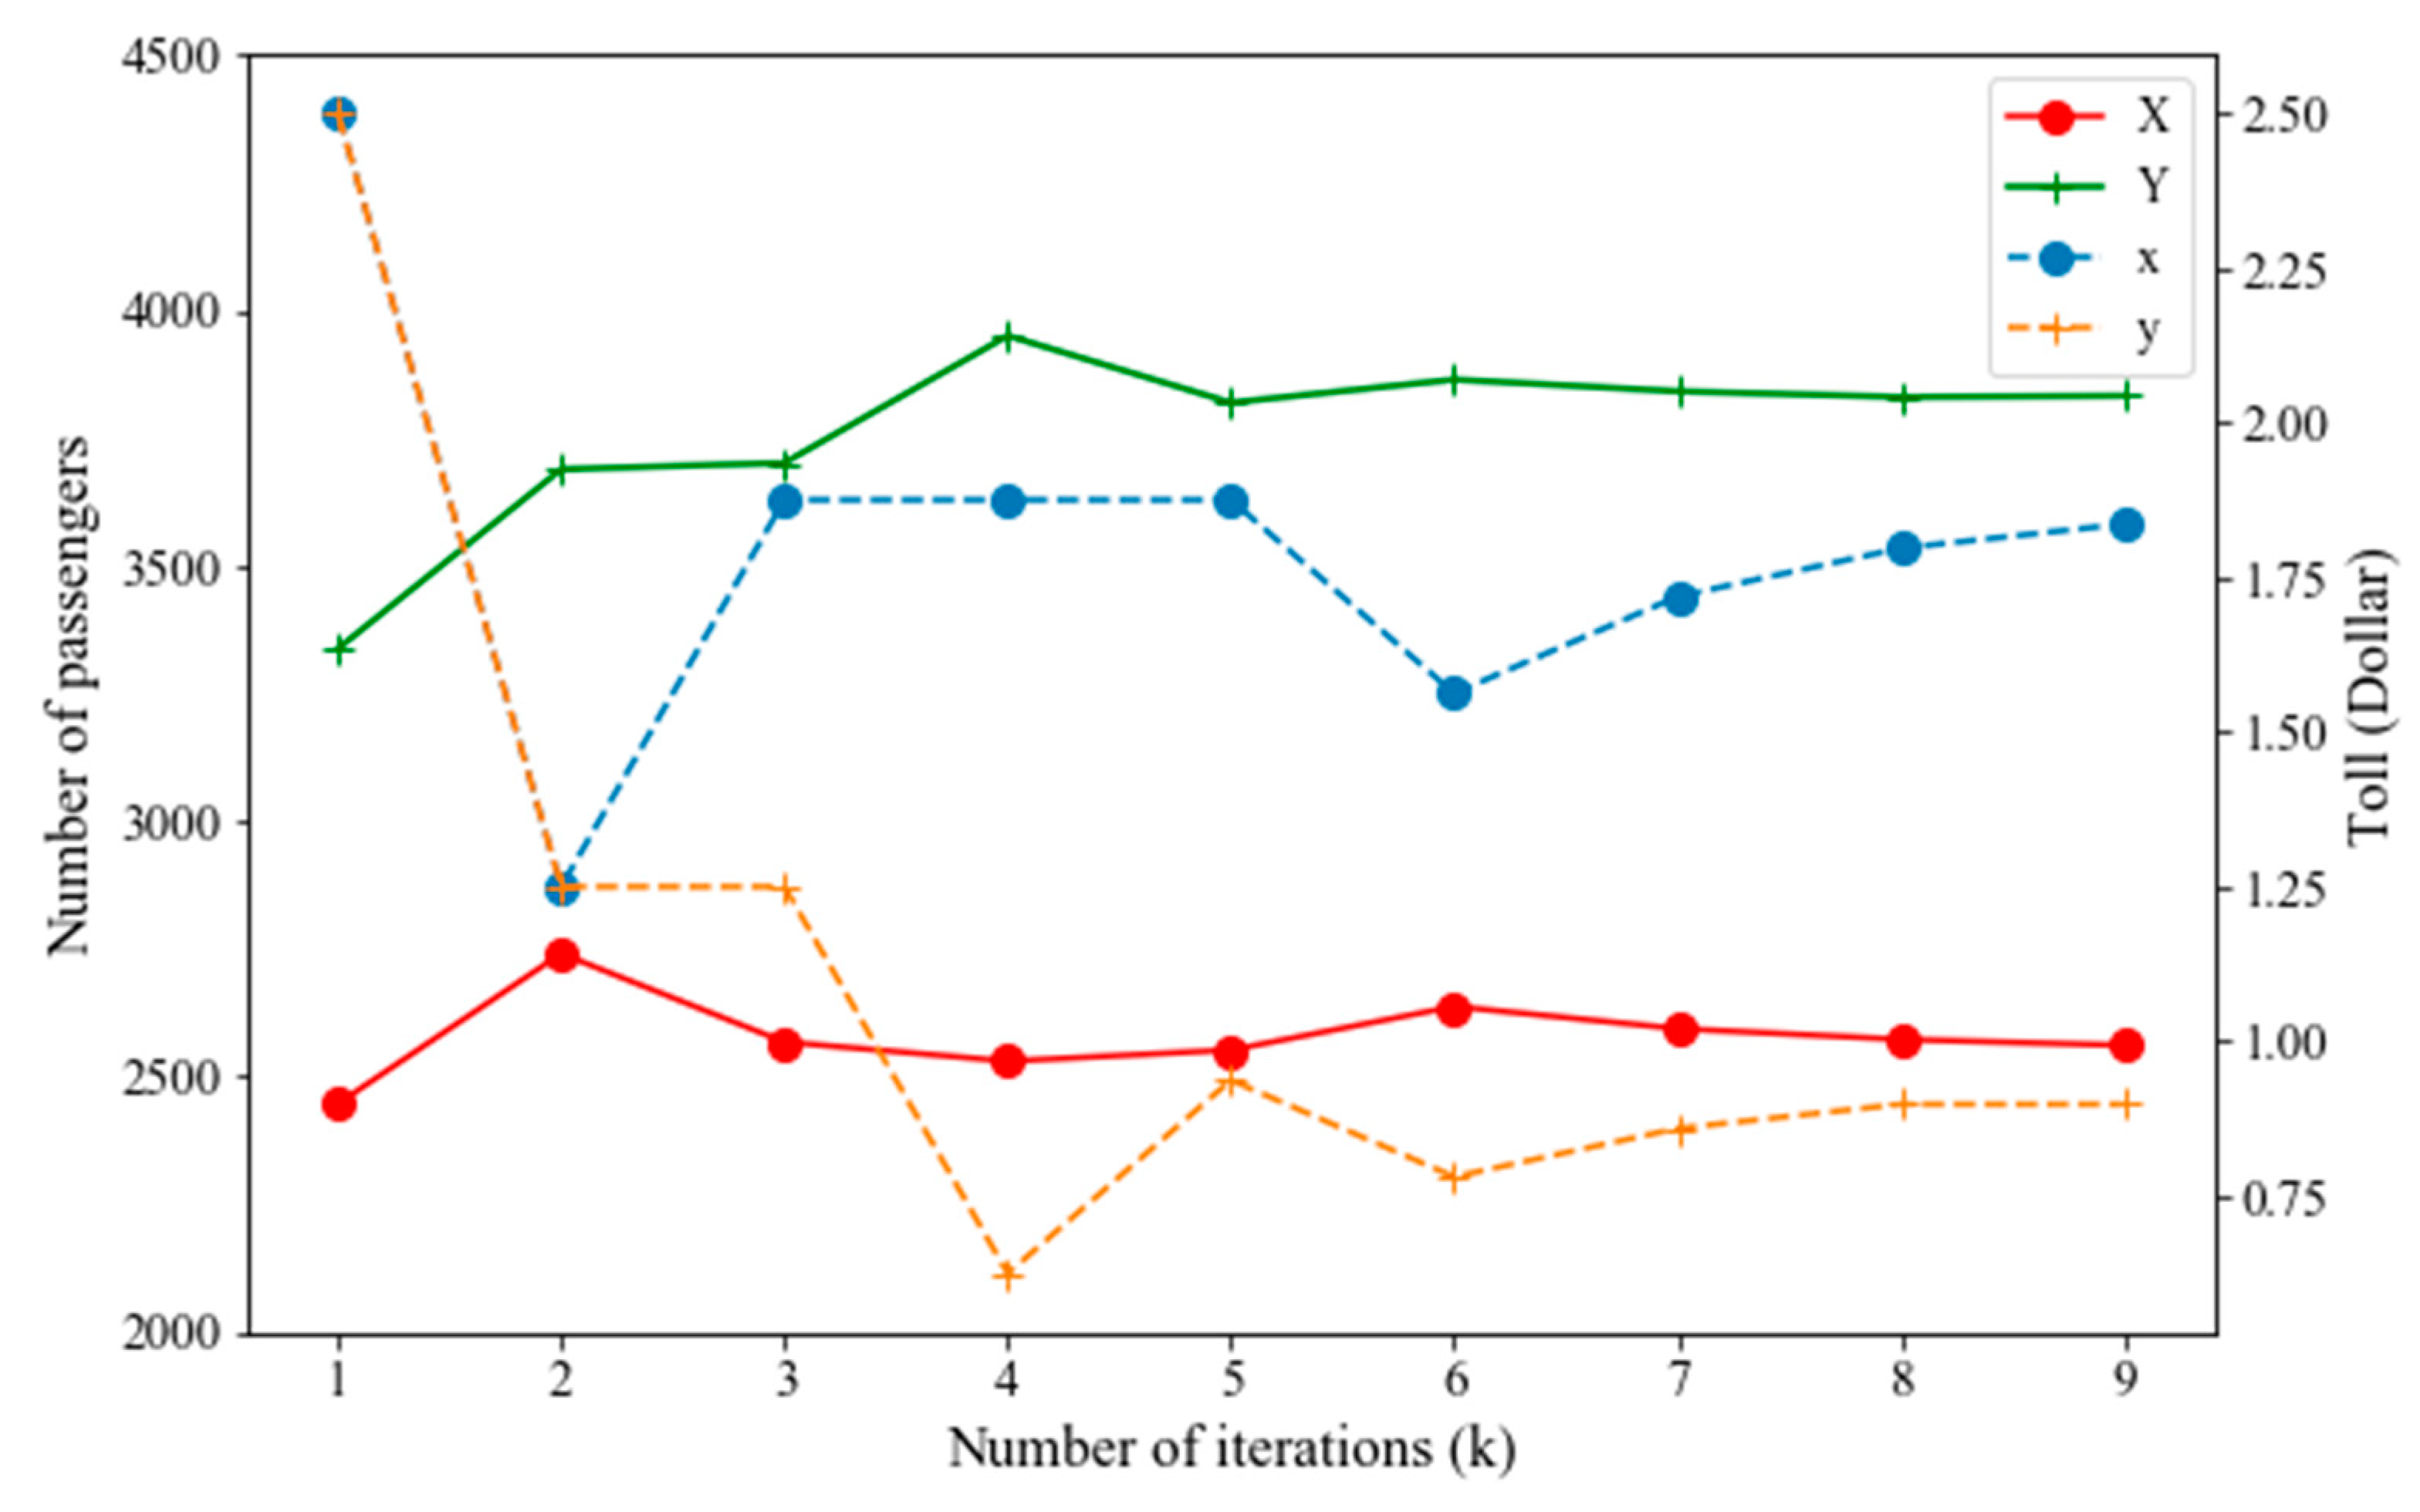
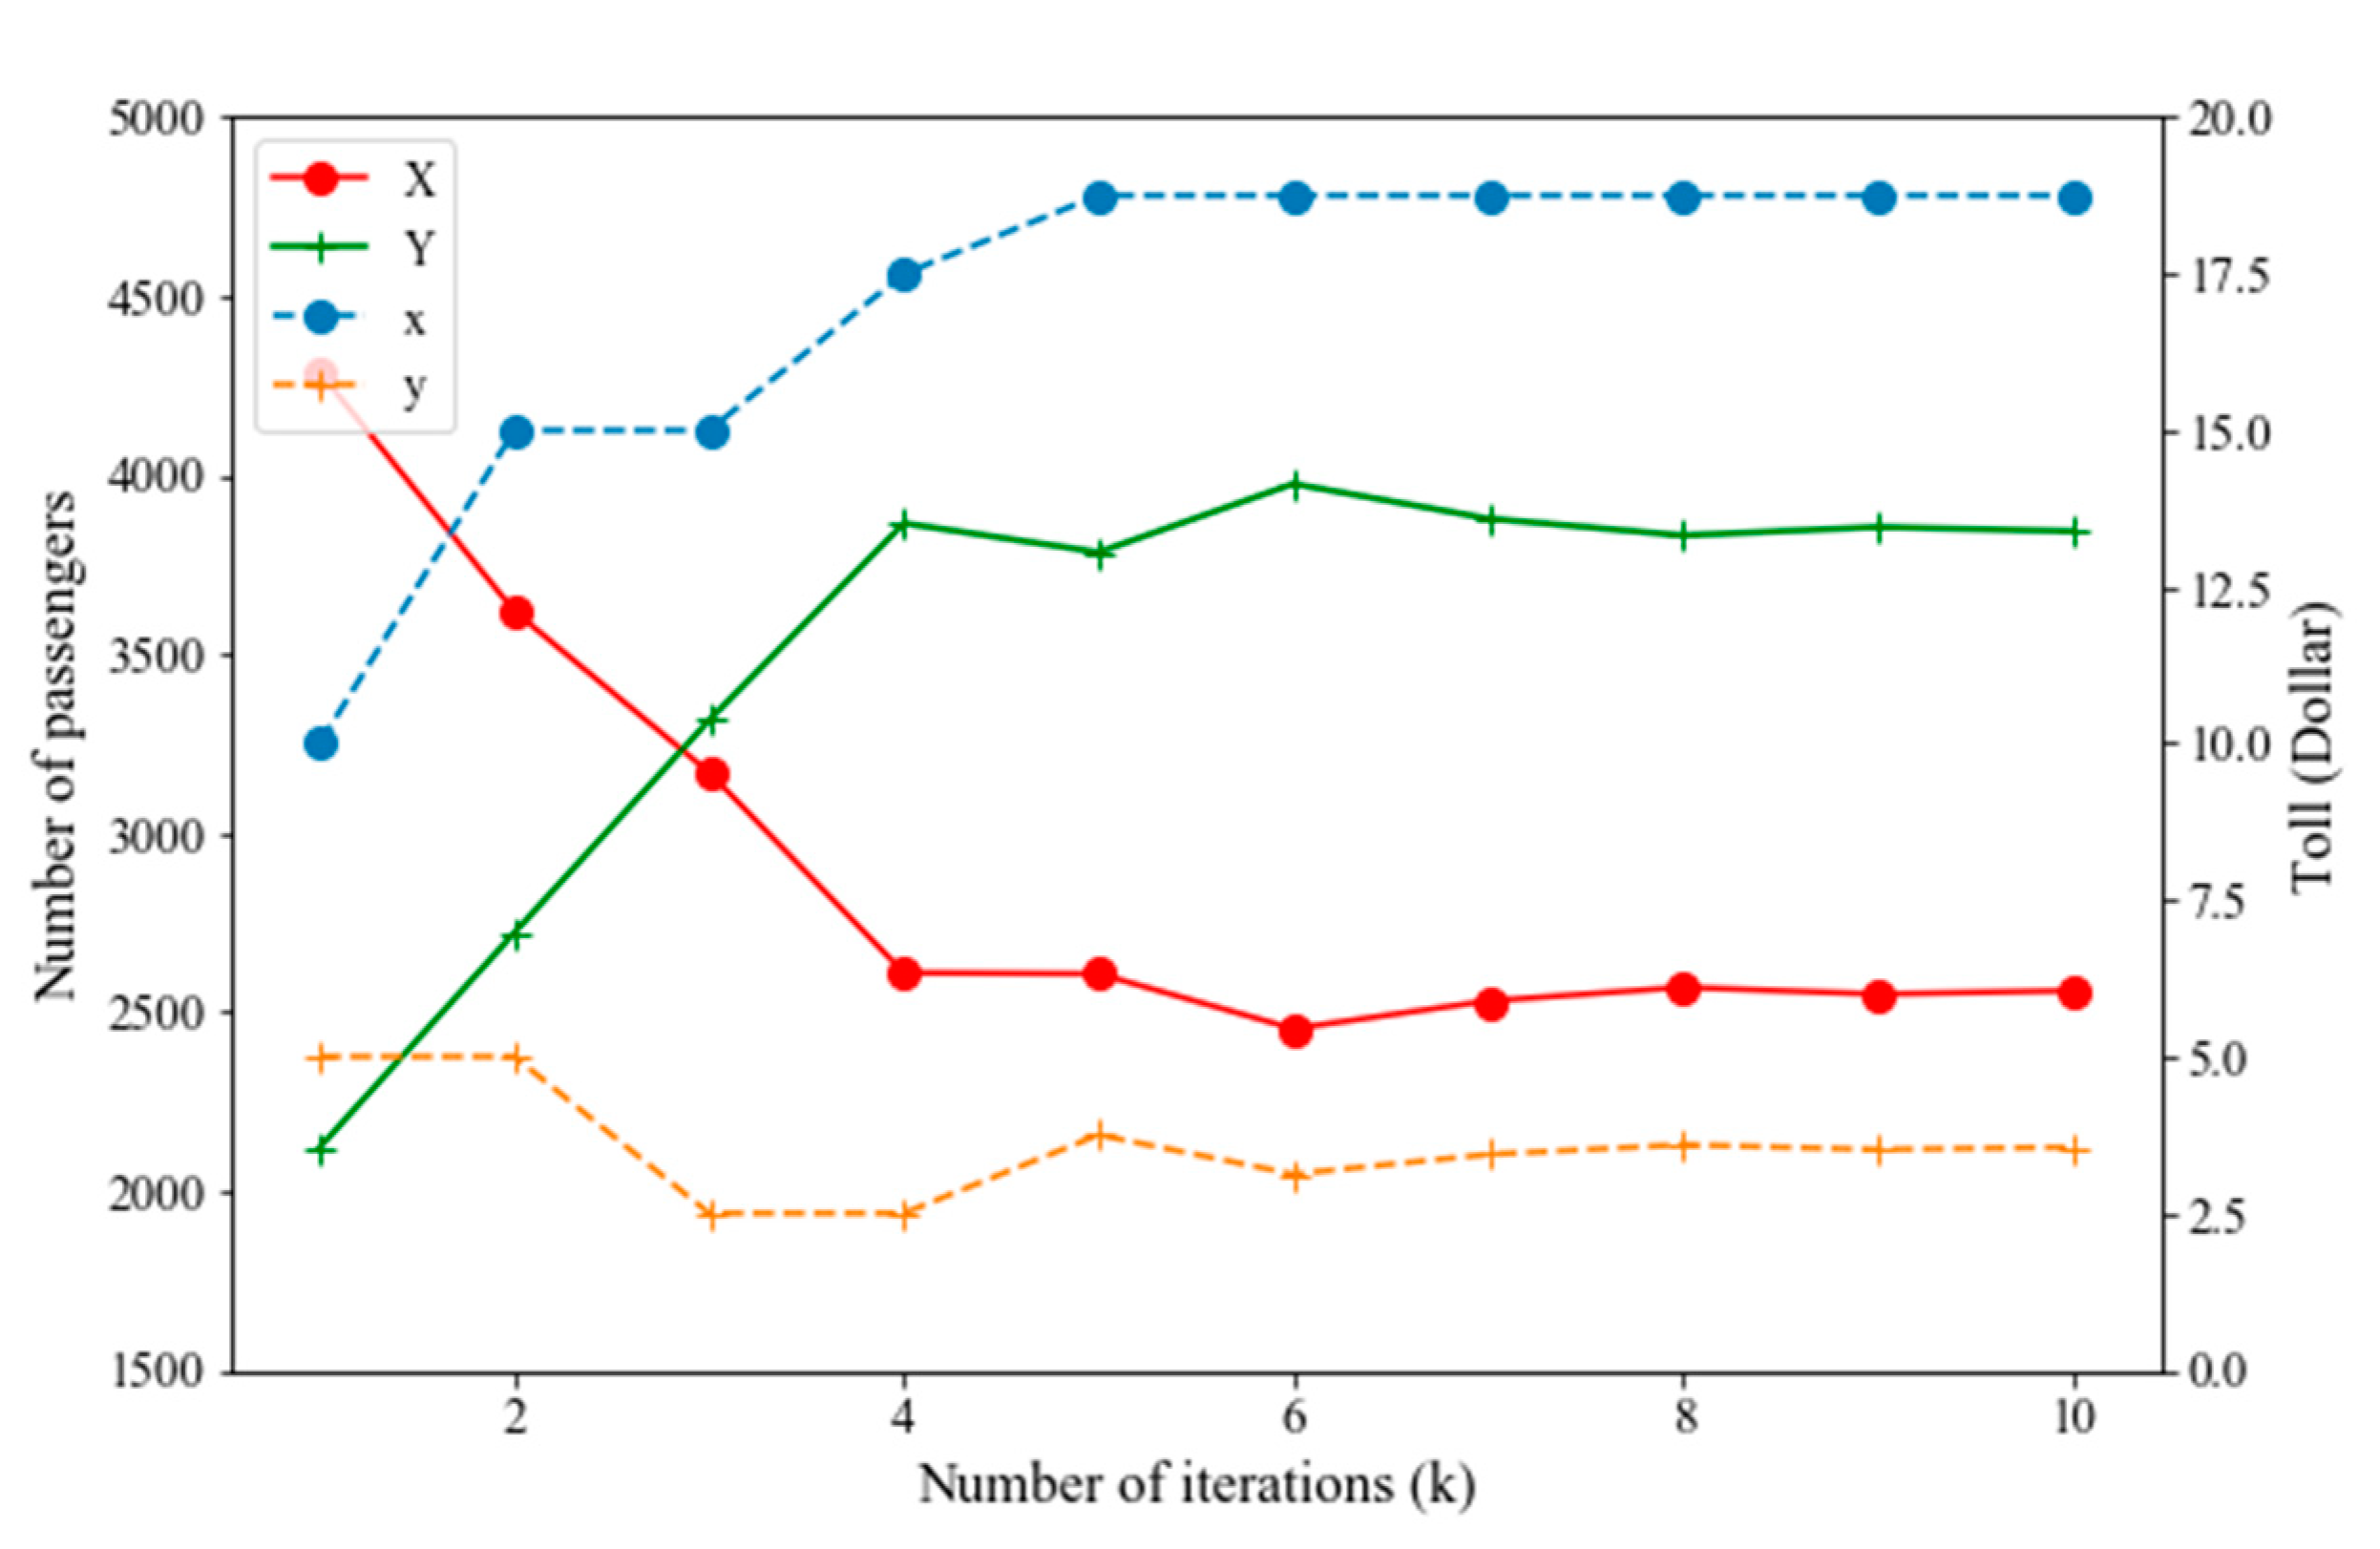
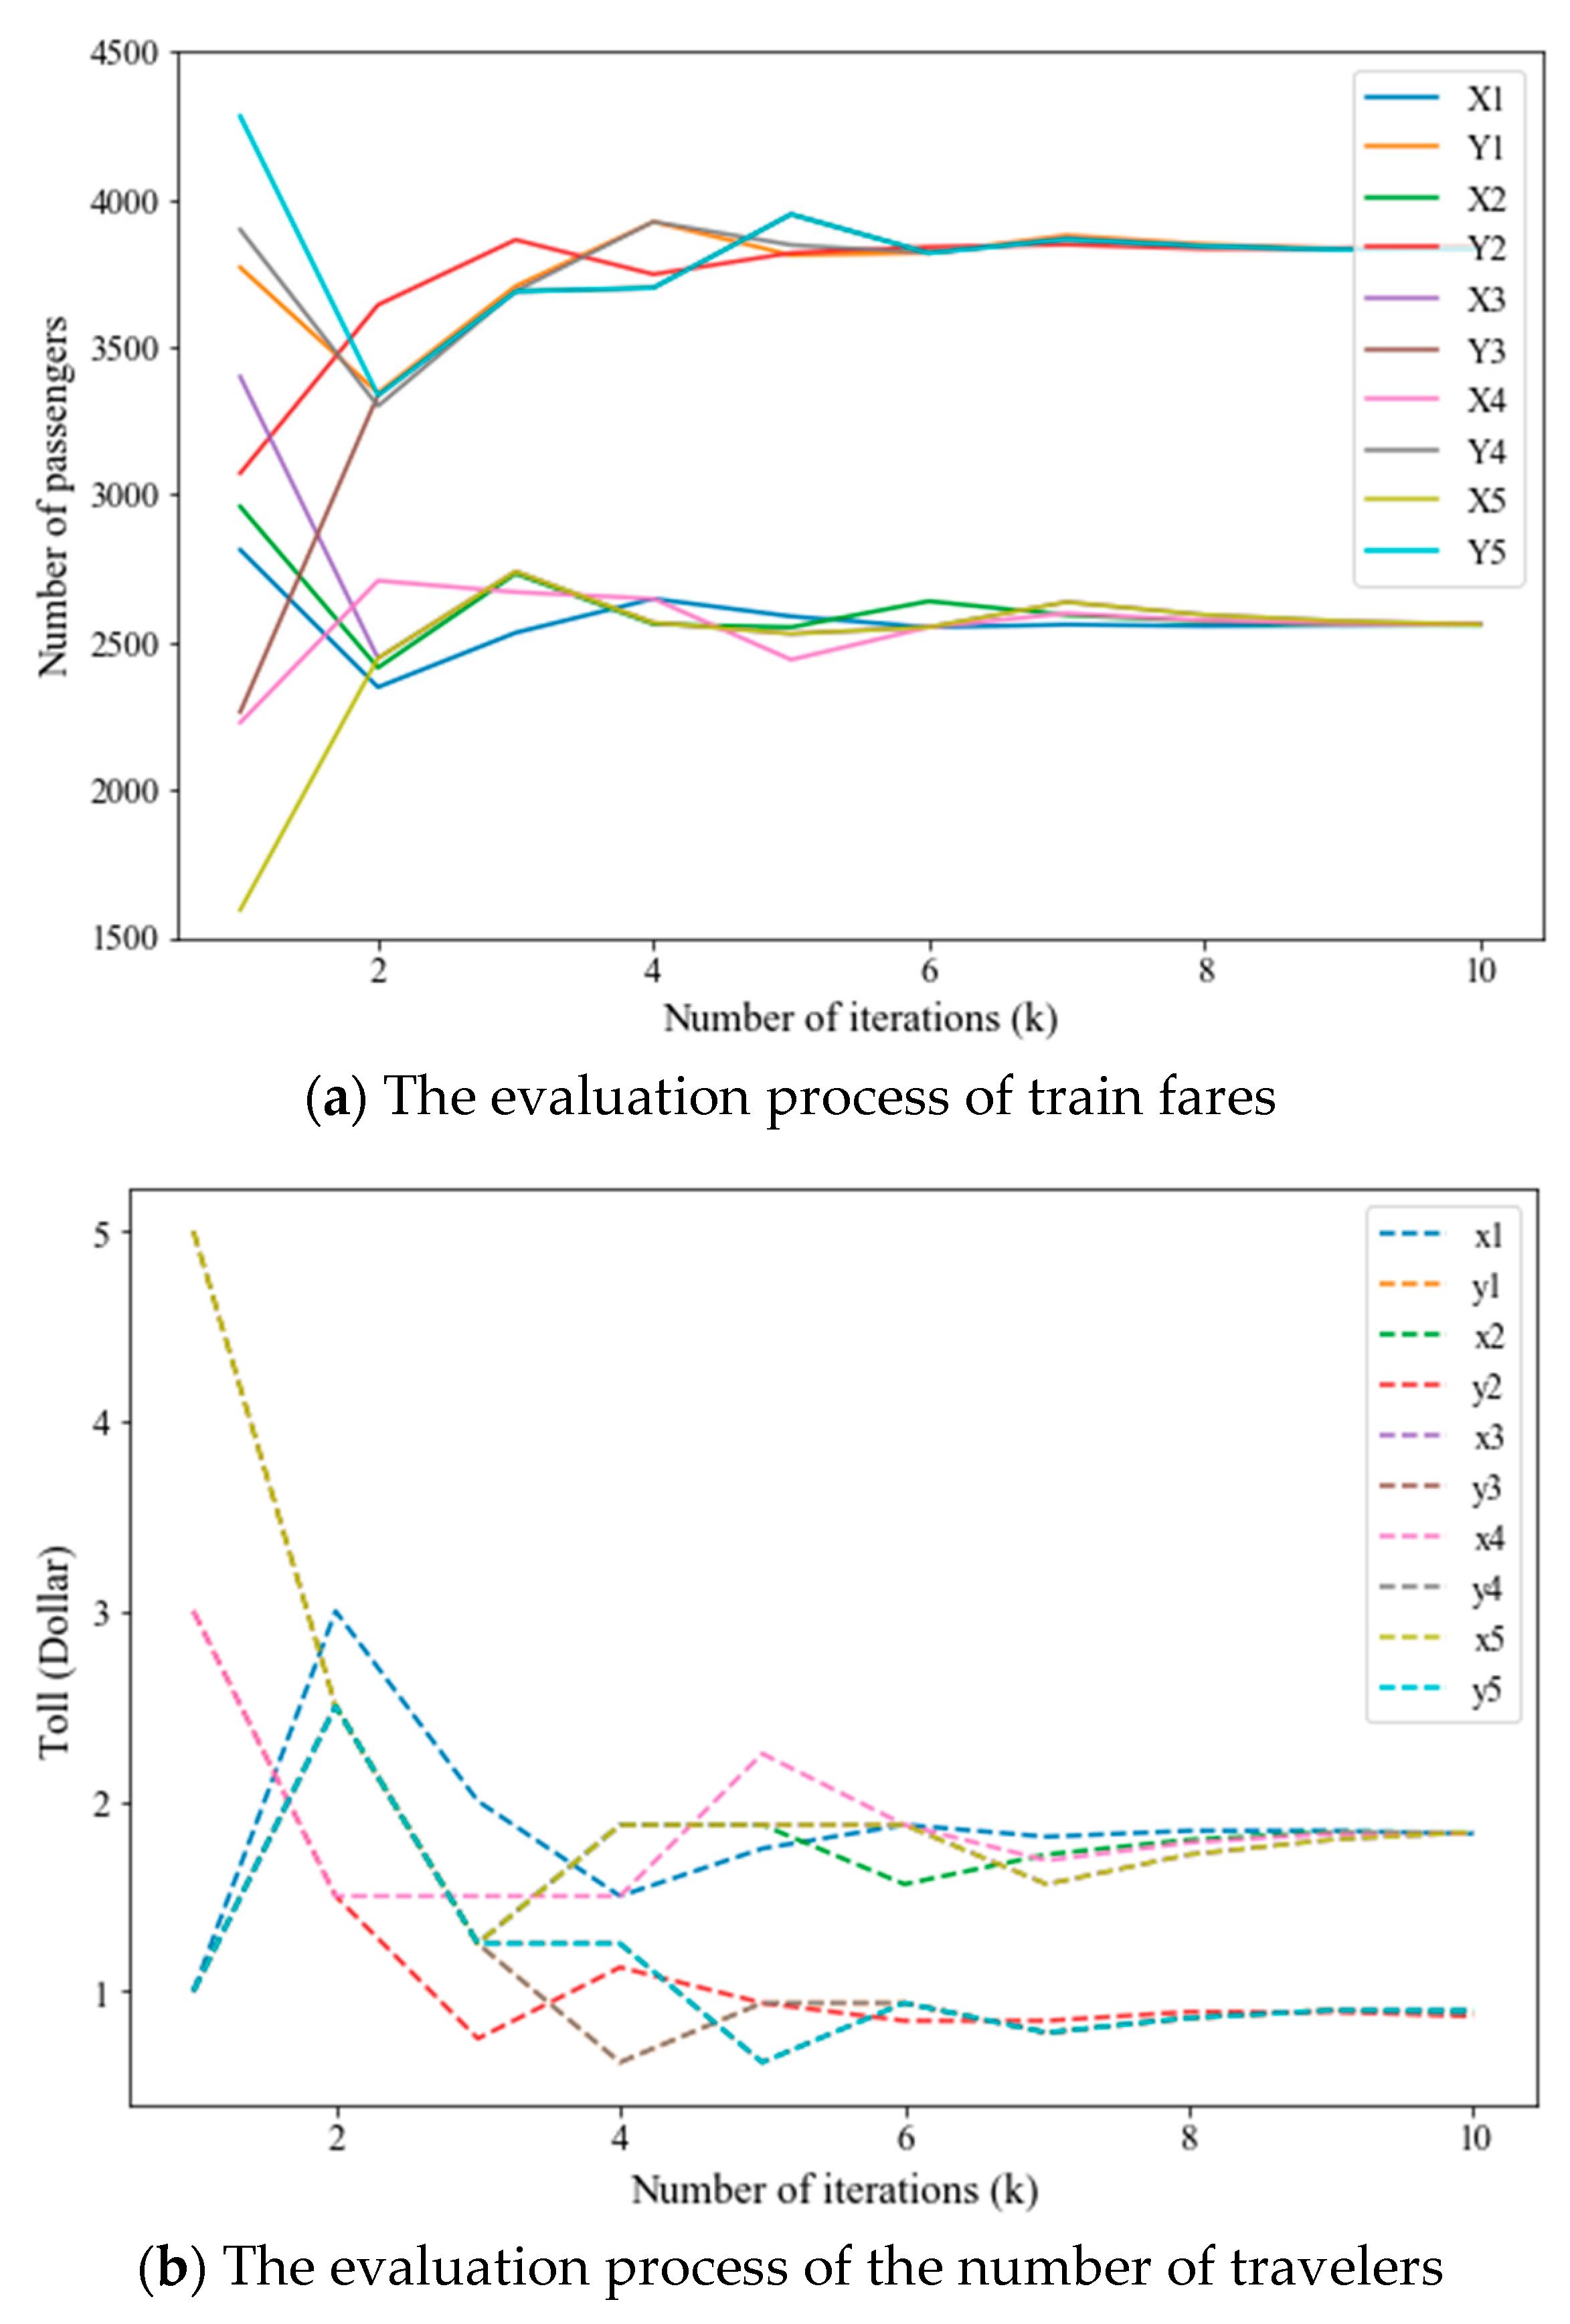
5. Numerical Experiments

In this section, we perform several numerical experiments to verify the applicability and effectiveness of the proposed model and solution method.
Suppose S 1 is a four-lane dual carriageway channel, S 2 is a six-lane dual carriageway, S 3 and S 4 are eight-lane dual carriageway channels, respectively. The design service capacity of a lane is 1280 vehicles/hour. Then, the one-way service capacity of S 1 , S 2 , S 3 , and S 4 should be C 1 = 1280 × 2 = 2506 , C 2 = 1280 × 3 = 3840 , C 3 = C 4 = 1280 × 4 = 5120 vehicles/hour. If the actual demand is larger than the designed ability, the service capacity will drop. If the excessive demand can not be well controlled, the capacity drop may spread to the whole network. The unknown demand functions in Table 2 are used to simulate the response of travelers after imposing tolls. As abovementioned, x ¯ and y ¯ are the toll upper bound of S 1 and S 2 imposed by the transport authority.
We first consider the situation that both S 1 and S 2 are congested (Case 1). In detail, a total number of 4360 vehicles per hour desire to pass through S 1 with four categories, i.e., a 1 = 1060 , b 1 = 1500 , c 1 = 1000 , d 1 = 800 , and a total number of 4980 vehicles per hour desire to pass through S 2 with four categories, i.e., a 2 = 1380 , b 2 = 1500 , c 2 = 1000 , d 2 = 1100 . S 3 and S 4 are assumed to have sufficient capacity to accommodate additional traffic demands. We apply the trial-and-error scheme to address this example. We note that the objective of this problem is to minimize the toll surcharge on S 1 and S 2 , while controlling the traffic demand on congested channels to an acceptable level. The upper bound of tolls is set as x ¯ = y ¯ = 5 . The error gap is set as ε = 10 . Namely, once the adjusted travel demands X ( x , y ) and Y ( x , y ) are within the range [ C 1 ε , C 1 + ε ] , [ C 2 ε , C 2 + ε ] , respectively, we consider the Pareto optimal solution has gotten and the algorithm terminates. The trail-and-error toll adjustment process is reported in Figure 2 and Table 3.
In Figure 2, the adjustment process of tolls on S 1 and S 2 during the trial-and-error procedure is presented by the dashed polylines x and y , respectively.
After each trial, the shift of travel demand on S 1 and S 2 are observed and plotted as solid polylines X and Y . Figure 2 demonstrates that both polylines X and Y are convergent to the designed capacity C 1 and C 2 after nine iterations. In the ninth iteration, the controlled X and Y are 2560.52 and 3832.6, which satisfy the required precision requirement. The corresponding toll increases are 1.8359875 and 0.8984375 which can be identified as the Pareto optimal solutions. In Table 3, more detailed results of the calculation process are presented. Column n records the number of iterations. Columns x , y , X , and Y in Table 3 are consistent with polylines x , y , X , and Y in Figure 2. The columns x _ , x ¯ , y _ , and y ¯ represent the boundaries, i.e., upper bound and lower bound, of the feasible region. The gap between x _ and x ¯ , y _ , and y ¯ are iteratively contracted along the iteration process which means the feasible region is iteratively contracted by observing the response of travelers, i.e., X and Y . Table 3 indicates the cases/mechanism of removing infeasible regions.
We proceed to study another case (Case 2) which is also frequently happening. When a channel is just starting use, many travelers are not willing to switch to the new channel due to the inaccurate estimation of travel impedance or conservative driving habits. In this case, only one channel is congested and we can still use this strategy to spread a part of travel demand to the nearby channels or public transport modes. Here, we suppose S 1 is congested and the travel demand before demand management is q 1 = 7800 vehicles per hour, which can be classified into the following four categories: a 1 = 1600 , b 1 = 1800 , c 1 = 1200 , d 1 = 3200 . The travel demand on S 2 is set as q 2 = 2680 which can be classified into the following four categories: a 2 = 700 , b 2 = 280 , c 1 = 1200 , d 1 = 500 . The upper bound of x and y are set as x ¯ = 20 and y ¯ = 10 , respectively. Other assumptions and parameters are consistent with Case 1. We apply the trial-and-error method to address this case. The trail-and-error toll adjustment process is reported in Figure 3 and Table 4.
Figure 3 shows that the proposed trial-and-error is capable of addressing the situation that only one channel is congested. With the increasing toll on S 1 , an increasing number of travelers are shifted to adjacent channels and alternative transport modes. The travel demand on S 2 gradually increases. When the travel demand on S 2 over its service capacity, the toll on S 2 also increases to spread part of travel demand. Table 4 shows the detailed calculation process of the trail-and-error scheme in Case 2, which demonstrates that the applied algorithm can rapidly converge to the desired accuracy level within a few iterations. At least half of the domain is identified as infeasible during each iteration. The infeasible regions iteratively identified and eliminated until the approximated Pareto optimal solution is found.
We further study the robustness of the proposed algorithm by varying the initial trial toll in Case 1. Specifically, the following five different initial fare settings are tested: ( 1 , 1 ) , ( 1 , 3 ) , ( 1 , 5 ) , ( 3 , 1 ) , and ( 5 , 1 ) . Figure 4 shows the evaluation process of travel demands and the toll charge pattern which indicates that no matter what the initial state is, the proposed algorithm could converge rapidly to the Pareto optimal solution after several iterations. This phenomenon inspires us that considering the public acceptability, the initial toll can be a small value. The toll pattern can be automatically raised according to the information provided by the previous observations.
The above numerical experiments indicate that the trial-and-error can efficiently find the Pareto optimal solution of the proposed bi-objective optimization problem. Given any initial toll pattern, the proposed trial-and-error method is able to identify the infeasible region based on the observation of the traveler’s response. According to the accumulated observed information, the feasible region iteratively shrinks until the Pareto optimal solution is found. The solution searched by the trial-and-error method provides the optimal toll pattern so that a transport authority can implement the minimal amount of fare to control the traffic congestion on congested channels.

6. Conclusions

This study considers the problem of congested river-crossing channels along a main/trunk river in a megacity having serious congestions due to excessive river-crossing demands. This study applies the methodology proposed by Wang, Zhang [3] to the field of the river-crossing problem. The main idea of this method is to spread the peak demand over space. By imposing additional tolls on congested channels, travelers who originally choose the congested channels will shift to adjacent channels and alternative public transport modes. The objective of this study is to optimally determine the toll pattern on congested channels to control the travel demand to an acceptable level. Mathematically, this is a bi-objective optimization problem, and the tolls on each congested channel are minimized in the Pareto optimal solution. This model considers the fact that the explicit expression of demand functions is hard to be preciously calibrated in practice. Therefore, this study applies the trial-and-error method to deal with unknown demand functions. Numerical experiments are conducted to validate the proposed model and test the effectiveness of the trial-and-error scheme. The results show that the applied trail-and-error method can effectively find the Pareto optimal solution. This study represents an initial study to address traffic congestion on large river crossing channels. More general cases will be taken as future research direction which has wider application fields.

Author Contributions

Conceptualization, X.C. and Y.W.; methodology, Y.W. and Y.Z.; validation, Y.Z. and X.C.; formal analysis, X.C. and Y.W.; investigation, Y.Z. and X.C.; writing—original draft preparation, Y.Z. and X.C. All authors have read and agreed to the published version of the manuscript.

Funding

This research was supported by the MOE (Ministry of Education in China) Project of Humanities and Social Sciences (project no. 20YJAZH083).

Institutional Review Board Statement

Not applicable.

Informed Consent Statement

Not applicable.

Data Availability Statement

Not applicable.

Conflicts of Interest

The authors declare no conflict of interest.

References

  1. Gu, W. A Sustainable Strategy to Address Traffic Congestion on Nanjing River-Crossing Channels. Available online: http://news.xhby.net/nj/zx/202004/t20200413_6598720.shtml (accessed on 17 January 2021).
  2. Chen, M. Some Thought of the Traffic Congestion on Nanjing Yangtze River Bridge. Available online: http://m.xinhuanet.com/js/2019-01/07/c_1123953980.htm (accessed on 17 January 2021).
  3. Wang, S.; Zhang, W.; Qu, X. Trial-and-error train fare design scheme for addressing boarding/alighting congestion at CBD stations. Transp. Res. Part B Methodol. 2018, 118, 318–335. [Google Scholar] [CrossRef]
  4. Liu, J.; Wang, R. Daily Traffic Volume is Keeping Increasing on the Nanjing Yangtze River Bridge. Available online: http://js.people.com.cn/n2/2020/0930/c360302-34327756.html (accessed on 17 January 2021).
  5. Chen, X.; Kim, I. Modelling rail-based park and ride with environmental constraints in a multimodal transport network. J. Adv. Transp. 2018, 2018, 15. [Google Scholar] [CrossRef] [Green Version]
  6. Chen, X.; Liu, Z.; Currie, G. Optimizing location and capacity of rail-based Park-and-Ride sites to increase public transport usage. Transp. Plan. Technol. 2016, 39, 507–526. [Google Scholar] [CrossRef]
  7. Liu, Z.; Chen, X.; Meng, Q.; Kim, I. Remote park-and-ride network equilibrium model and its applications. Transp. Res. Part B Methodol. 2018, 117, 37–62. [Google Scholar] [CrossRef]
  8. Huang, D.; Chen, X.; Liu, Z.; Lyu, C.; Wang, S.; Chen, X. A static bike repositioning model in a hub-and-spoke network framework. Transp. Res. Part E Logist. Transp. Rev. 2020, 141, 102031. [Google Scholar] [CrossRef]
  9. Huang, D.; Gu, Y.; Wang, S.; Liu, Z.; Zhang, W. A two-phase optimization model for the demand-responsive customized bus network design. Transp. Res. Part C Emerg. Technol. 2020, 111, 1–21. [Google Scholar] [CrossRef]
  10. Cheng, Q.; Liu, Z.; Szeto, W.Y. A cell-based dynamic congestion pricing scheme considering travel distance and time delay. Transp. B Transp. Dyn. 2019, 7, 1286–1304. [Google Scholar] [CrossRef]
  11. Liu, Z.; Meng, Q. Bus-based park-and-ride system: A stochastic model on multimodal network with congestion pricing schemes. Int. J. Syst. Sci. 2014, 45, 994–1006. [Google Scholar] [CrossRef]
  12. Liu, Z.; Meng, Q.; Wang, S. Speed-based toll design for cordon-based congestion pricing scheme. Transp. Res. Part C Emerg. Technol. 2013, 31, 83–98. [Google Scholar] [CrossRef] [Green Version]
  13. Liu, Z.; Meng, Q.; Wang, S. Variational inequality model for cordon-based congestion pricing under side constrained stochastic user equilibrium conditions. Transp. A Transp. Sci. 2014, 10, 693–704. [Google Scholar] [CrossRef]
  14. Liu, Z.; Wang, S.; Meng, Q. Optimal joint distance and time toll for cordon-based congestion pricing. Transp. Res. Part B Methodol. 2014, 69, 81–97. [Google Scholar] [CrossRef]
  15. Liu, Z.; Wang, S.; Zhou, B.; Cheng, Q. Robust optimization of distance-based tolls in a network considering stochastic day to day dynamics. Transp. Res. Part C Emerg. Technol. 2017, 79, 58–72. [Google Scholar] [CrossRef]
  16. Liu, Z.; Zhang, Y.; Wang, S.; Li, Z. A trial-and-error method with autonomous vehicle-to-infrastructure traffic counts for cordon-based congestion pricing. J. Adv. Transp. 2017, 2017, 9243039. [Google Scholar] [CrossRef] [Green Version]
  17. Meng, Q.; Liu, Z. Impact analysis of cordon-based congestion pricing on mode-split for a bimodal transportation network. Transp. Res. Part C Emerg. Technol. 2012, 21, 134–147. [Google Scholar] [CrossRef]
  18. Meng, Q.; Liu, Z. Trial-and-error method for congestion pricing scheme under side-constrained probit-based stochastic user equilibrium conditions. Transportation 2011, 38, 819–843. [Google Scholar] [CrossRef]
  19. Meng, Q.; Liu, Z.; Wang, S. Optimal distance tolls under congestion pricing and continuously distributed value of time. Transp. Res. Part E Logist. Transp. Rev. 2012, 48, 937–957. [Google Scholar] [CrossRef]
  20. Vickrey, W.S. Point of view: Principles and applications of congestion pricing. TR News 1993, 167, 4–5. [Google Scholar]
  21. Downs, A. Point of view: Implementing peak-hour road pricing at fullscale: Finding solutions to practical problems. TR News 1993, 167, 7–9. [Google Scholar]
  22. Li, M.Z.F. The role of speed-flow relationship in congestion pricing implementation with an application to Singapore. Transp. Res. Part B Methodol. 2002, 36, 731–754. [Google Scholar] [CrossRef]
  23. Yang, H.; Meng, Q.; Lee, D. Trial-and-error implementation of marginal-cost pricing on networks in the absence of demand functions. Transp. Res. Part B Methodol. 2004, 38, 477–493. [Google Scholar] [CrossRef]
  24. Yang, H.; Xu, W.; Meng, Q. A sequential experimental approach for analyzing second-best road pricing with unknown demand functions. In Proceedings of the 16th International Symposium on Transportation and Traffic Theory, College Park, MD, USA, 19–21 July 2005. [Google Scholar]
  25. Zhao, Y.; Kockelman, K.M. On-line marginal-cost pricing across networks: Incorporating heterogeneous users and stochastic equilibria. Transp. Res. Part B Methodol. 2006, 40, 424–435. [Google Scholar] [CrossRef] [Green Version]
  26. Han, D.; Yang, H. Congestion pricing in the absence of demand functions. Transp. Res. Part E Logist. Transp. Rev. 2009, 45, 159–171. [Google Scholar] [CrossRef]
  27. Xu, W.; Yang, H.; Han, D. Sequential experimental approach for congestion pricing with multiple vehicle types and multiple time periods. Transp. B Transp. Dyn. 2013, 1, 136–152. [Google Scholar] [CrossRef]
  28. Meng, Q.; Xu, W.; Yang, H. Trial-and-error procedure for implementing a road-pricing scheme. Transp. Res. Rec. 2005, 1923, 103–109. [Google Scholar] [CrossRef]
  29. Yang, H.; Xu, W.; He, B.S.; Meng, Q. Road pricing for congestion control with unknown demand and cost functions. Transp. Res. Part C Emerg. Technol. 2010, 18, 157–175. [Google Scholar] [CrossRef]
  30. Han, D.; Xu, W.; Yang, H. Solving a class of variational inequalities with inexact oracle operators. Math. Methods Oper. Res. 2010, 71, 427–452. [Google Scholar] [CrossRef]
  31. Zhou, B.; Bliemer, M.; Yang, H.; He, J. A trial-and-error congestion pricing scheme for networks with elastic demand and link capacity constraints. Transp. Res. Part B Methodol. 2015, 72, 77–92. [Google Scholar] [CrossRef]
  32. Ye, H.; Yang, H.; Tan, Z. Learning marginal-cost pricing via a trial-and-error procedure with day-to-day flow dynamics. Transp. Res. Part B Methodol. 2015, 81, 794–807. [Google Scholar] [CrossRef]
  33. Guo, R.Y.; Yang, H.; Huang, H.J.; Tan, Z. Link-based day-to-day network traffic dynamics and equilibria. Transp. Res. Part B Methodol. 2015, 71, 248–260. [Google Scholar] [CrossRef]
  34. Xu, M.; Meng, Q.; Huang, Z. Global convergence of the trial-and-error method for the traffic-restraint congestion-pricing scheme with day-to-day flow dynamics. Transp. Res. Part C Emerg. Technol. 2016, 69, 276–290. [Google Scholar] [CrossRef]
  35. Zhou, B.; Xu, M.; Zhang, Y. A trial-and-error congestion pricing method for day-to-day dynamic network flows considering travelers’ heterogeneous inertia patterns. Math. Probl. Eng. 2019, 2019, 8514765. [Google Scholar] [CrossRef] [Green Version]
Figure 1. The channel toll scheme to decentralize demands at congested channels.
Sustainability 13 02749 g001
Figure 2. Toll and travel demand adjust process using the trial-and-error algorithm.
Sustainability 13 02749 g002
Figure 3. Toll and travel demand adjust process in Case 2.
Sustainability 13 02749 g003
Figure 4. The progress of trial-and-error algorithm with various initial points.
Sustainability 13 02749 g004
Table 1. Infeasible regions of the domain.
Potential Cases (Infeasible Regions Are Indicated by the Shadow Segment)
(i) X n C 1 , Y n C 2 , X n + Y n > C 1 + C 2 .
Sustainability 13 02749 i001
(ii) X n C 1 , Y n C 2 , X n + Y n < C 1 + C 2 .
Sustainability 13 02749 i002
(iii) X n C 1 , Y n C 2 , X n + Y n C 1 + C 2 .
Sustainability 13 02749 i003
(iv) X n C 1 , Y n C 2 , X n + Y n C 1 + C 2 .
Sustainability 13 02749 i004
(v) X n C 1 , Y n C 2 , X n + Y n C 1 + C 2 .
Sustainability 13 02749 i005
(vi) X n C 1 , Y n C 2 , X n + Y n C 1 + C 2 .
Sustainability 13 02749 i006
Table 2. Unknown demand functions.
Unknown Demand Functions:
f 1 ( x ) = 0.3 exp ( 0.3 x ) , 0 f 1 ( x ) 1 , x [ 0 , x ¯ ] .
g 1 ( x ) = 0.7 exp ( 0.3 x ) , 0 g 1 ( x ) 1 , x [ 0 , x ¯ ] .
h 1 ( x y ) = { 1 ,     y ¯ x y 0 1 ( x y ) 2 / x ¯ 2 ,     0 < x y x ¯ .
f 2 ( y ) = 0.5 exp ( 0.2 y ) , 0 f 2 ( y ) 1 , y [ 0 , y ¯ ] .
g 2 ( y ) = 0.9 exp ( 0.2 y ) , 0 g 2 ( y ) 1 , y [ 0 , y ¯ ] .
h 2 ( y x ) = { 1 ,     x ¯ y x 0 1 ( y x ) 2 / ( 2 y ¯ 2 ) ,     0 < y x y ¯ .
Table 3. Detailed calculation process of the trial-and-error algorithm.
n x y X Y x _ x ¯ y _ y ¯ Case
12.52.52446.193337.320.02.50.02.0(ii)
21.251.252740.213688.751.252.50.02.5(iii)
31.251.252566.963701.251.252.50.01.25(vi)
41.8750.6252529.463950.291.252.50.6251.25(v)
51.8750.93752551.333819.341.251.8750.6250.9375(ii)
61.8750.781252636.543864.431.56251.8750.781250.9375(i)
71.56250.8593752593.233841.481.717851.8750.8592750.9375(i)
81.718750.89843752572.113830.311.7968751.8750.8593750.9375(iii)
91.7968750.89843752560.523832.601.7968751.8750.8593750.8984375(vi)
Table 4. Detailed calculation process of trial-and-error algorithm in Case 2.
n x y X Y x _ x ¯ y _ y ¯ Case
11054286.622121.4610.020.00.010.0(iii)
21553619.322721.4610.020.00.05.0(vi)
3152.53169.323315.1315.020.00.05.0(iii)
417.52.52609.133865.1317.520.02.55.0(i)
518.753.752606.273784.3617.520.02.53.125(vi)
618.753.1252453.153975.3517.520.03.1253.75(v)
718.753.43752530.493875.4817.520.03.43753.75(v)
818.753.593752568.583831.0817.520.03.43753.59375(vi)
918.753.5156252549.583854.7017.520.03.5156253.59375(v)
1018.753.55468752559.093842.8717.520.03.55468753.59375(v)
Publisher’s Note: MDPI stays neutral with regard to jurisdictional claims in published maps and institutional affiliations.

