Article

A Spatial Decision Support System for Multifunctional Landscape Assessment: A Transformative Resilience Perspective for Vulnerable Inland Areas

1
Department of Architecture (DiARC), University of Naples Federico II, 80138 Naples NA, Italy
2
Faculty of Business and Law, University of Portsmouth, Portsmouth PO1 3DE, UK
*
Author to whom correspondence should be addressed.
Sustainability 2021, 13(5), 2748; https://doi.org/10.3390/su13052748
Submission received: 31 December 2020 / Revised: 11 February 2021 / Accepted: 23 February 2021 / Published: 3 March 2021

Abstract

:
The concept of transformative resilience has emerged from the recent literature and represents a way to interpret the potential opportunities for change in vulnerable territories, where a socioeconomic change is required. This article extends the perspective of transformative resilience to an assessment of the landscape multifunctionality of inland areas, exploring the potential of identifying a network of synergies among the different municipalities that is able to trigger a process of territorial resilience. A spatial decision support system (SDSS) for multifunctionality landscape assessment aims to help local actors understand local resources and multifunctional values of the Partenio Regional Park (PRP) and surrounding municipalities, in the South of Italy, stimulating their cooperation in the management of environmental and cultural sites and the codesign of new strategies of enhancement. The elaboration of spatial indicators according to Landscape Services classification and the interaction between the “Analytic Network Process” (ANP) method, spatial weighted overly and geographic information system (GIS) support the identification of a preferable scenario able to activate a transformative resilience strategy in selected vulnerable inland areas, which can be scaled up in other similar contexts.

1. Introduction

Within urban studies, the concept of resilient thinking [1] has been employed to address different aspects of the urbanisation process, e.g., the adaptation of cities to climate change [2], the urban local-spatial resilience [3], the urban ecosystem and metabolism [4], and the resilience in spatial planning [5]. Indeed, many authors have presented meanings of resilience according to multiple research fields and scientific interests, likewise relating it to the landscape concept. To emphasize which landscapes’ features, geographical data, indicators, and assessment methods have to be referred to and how the stakeholders act to define a decision-making problem to address the formulation of sustainable development strategies [6,7], a definition of landscape resilience should be critically selected and shared within the scientific debate.
Definitions of resilience have generally reflected the concept of the ability to preserve a status or adapt to a new condition after a shock [8]. In particular, Beller et al. [9] have related the resilience to the landscape’s capacity to retain ecological functions and processes, biodiversity, and resources, despite many stressors and turbulences [9]. At the same time, the concept of resilience, conceived as responding well to disruptive change, is related to recovery, and is able to express the ability to overcome challenges; experiment with new approaches; regain productivity and renewal linked to applying learning, innovating, and emerging stronger [10,11].
According to a socioecological perspective—where the landscape is a result of human–natural interactions [12]—the communities’ self-organization after shocking events [13] and the multifunctionality [14,15,16] make a landscape resilient. In recent years, system thinking has been widely diffused to describe a way of understanding the relationship between people and nature, based on the idea that social and ecological systems are interrelated and indivisible, and that it is actually impossible to separate people from nature [17,18,19,20]. Exploring the interactions between human activity and the environment in urban systems and their capacity to be resilient to change means investigating complex urban social–ecological relationships, ecological impacts, and sustainable urban resource management [21,22,23].
Several recent studies [24] have underlined the transformative aspects of resilience and the normative implications of measuring it, where adaptive and transformative capacities [25] are related to spatial context characteristics; top-down or bottom-up methods; inherent properties of a socioeconomic system expressed by the ability of individuals, stakeholders, and communities to learn from and respond to changes, in a dynamic process [26,27]. Transformative resilience is assonant to the concept of antifragility [28] that goes beyond resilience and robustness, indicating the ability of systems to change and cope with pressures, stresses, volatility, and disorder. Contemporary approaches to resilience [29,30,31,32,33,34,35] have recognized it as a process rather than an outcome, where four resource pools interact: social capital; community competence; information and communication; economic development. Indeed, the landscape, considered a complex socioecological system, embeds human activities [36] and biophysical land units which continuously change [37,38,39], and provides those seeking to enhance the resilience of vulnerable components with opportunities for complex transformation, when conditions of prolonged stress affect it.
In a spatial assessment procedure, the landscape units—or mapping units—have been used to determine the investigation field according to widespread types and characters (i) [40], to collect data and make them more consistent by mathematical and statistical aggregation procedures (ii) [41], and to convert these data into evaluation criteria (iii) [42,43]. Therefore, landscape transformative resilience can be conceived as an expression of its multifunctionality, i.e., the feature of providing multiple uses and functions at the same location [44,45]. Based on this conceptualization, an assessment of the interconnection among ecological flows and social dynamics—both expressed in terms of service-providing landscape elements [46]—has allowed adaptation strategies for changes to be explored within an interdisciplinary approach [47].
According to Hobbs (2014), multifunctional landscapes encompass the full range of landscape elements and the services they provide to human well-being [48]. At the same time, Potschin and Haines-Young (2006) have related sustainability to the landscape’s capacity to provide goods and services for future generations, evaluating the quality of those services in monetary and nonmonetary terms [49]. Indeed, landscape transformative resilience can be analyzed by considering landscape and ecosystem services (ES) to identify benefits for human beings and quantify the full cost of their loss, and engage stakeholders and local communities in a constructive dialogue [50]. Valles-Planells et al. (2014) have recommended the landscape services (LS) concept as an approach for transdisciplinary research, which matches landscape ecology to sustainability [43,51], and it can be interpreted as a specification of ES where the multifunctionality allows the spatial configuration of benefits and services for humans to be analyzed at the landscape scale. Moreover, the LS framework, as a multidimensional approach of the ecological economics, which includes ES, has allowed structure–function–value chains of the landscape to be evaluated [52,53,54].
Notwithstanding some ambiguities in definitions, which have led Potschin and Haines-Young (2016) to define LS and ES as boundary objects for sustainability [55], many authors [56,57,58,59] have made several arguments for using LS approach. Among these arguments, the following are the most relevant for our investigation: (i) the explicit spatial dimension of the assessment has to emerge; (ii) the focus points out important interrelationships among human activities and habitats; (iii) the relevance of the analysis for collaborative planning is high; (iv) historical landscape elements and natural features coexist in the investigated context; (v) the landscape attributes and their importance have to be inferred within a tourism-oriented sustainable strategy.
Furthermore, the operational framework of multicriteria decision analysis (MCDA) [60] has helped decision makers (DM) to make strategic decisions efficiently and define concrete solutions [61] through the monitoring, management, and assessment of the landscape’s resources in multidimensional contexts.
For the last three decades, spatial decision support systems (SDSS) combining MCDA and geographic information systems (GIS) have been improving the evaluation, interaction among local stakeholders, and design of new sustainable scenarios [62,63,64]. Many dedicated tools are becoming increasingly available to support planners and decision-makers developing planning support systems (PSS), defined as geo-information technology-based instruments. They can be visual-wide attractive and interactive platforms. Furthermore, they can include and manage explicit and codified information into planning processes, structure the mutual exchange of knowledge among a diverse group of actors, support participatory processes and collaborative deliberations, simulate planning consequences, and gather public inputs to improve local plan-making practices and inclusiveness [65,66]. Simultaneously, many studies have developed methodological approaches for context-specific and tailor-made multicriteria spatial decision support systems. They can diagnose the current situation, recognizing the identity of spatial elements and including qualitative and quantitative indicators. In this way, they guarantee a continuous assessment from diagnosis to completion, adopt a dynamic method considering continuous context evolution, implement a comparative approach examining different scenarios, and provide understandable and straightforward results, ensuring transparency and offering a GIS-based representation [67]. Additionally, integrating GIS tools with MCDA has meant bringing together spatial information, categorized based on multiple criteria, into a single evaluation index [68], which has been one of the outcomes that the authors have resolved to achieve. Nevertheless, mapping LS as indicators of landscape resilience and sustainability [69] has remained a challenge for specialists, academics, and DM. The proposed approach has tried to overcome some limitations of assessment techniques [70], which are related to the subjectivity of evaluations based on scores awarded by experts [56], introducing indicators of tourism facilities [71] and metrics of attractive landscape features [72,73].
According to these topics, the contribution of landscape evaluations in defining and planning sustainable development strategies has focused on the elicitation of landscape features and multiple values in spatial decision-making processes, and the effectiveness of methods and tools that allow the transformative landscape resilience to be measured in terms of multifunctionality, and support the transparency and understanding of the decision model. The purpose of this research was to develop a spatial decision support system (SDSS) to evaluate integrated enhancement strategies for a vulnerable landscape. The SDSS was tested on a relevant inner area in the South of Italy called the Partenio Regional Park (PRP) and 27 Italian municipalities to define strategies for the enhancement of local resources and to generate a cooperative and collaborative network among all the municipalities around the park. The article’s primary outcome is the provision of information on how spatial representation and landscape modeling help to understand tangible and intangible features, make better informed decisions, improve the communication among stakeholders, and build common ground to react to critical situations and identify adaptive redevelopment opportunities.
The paper proceeds as follows: Section 2 introduces materials and methods applied in the case study; Section 3 outlines the results; Section 4 shows the limitations and potential of the proposed methodology; Section 5 highlights new research topics for fostering the scientific debate and conclusive considerations.

2. Materials and Methods
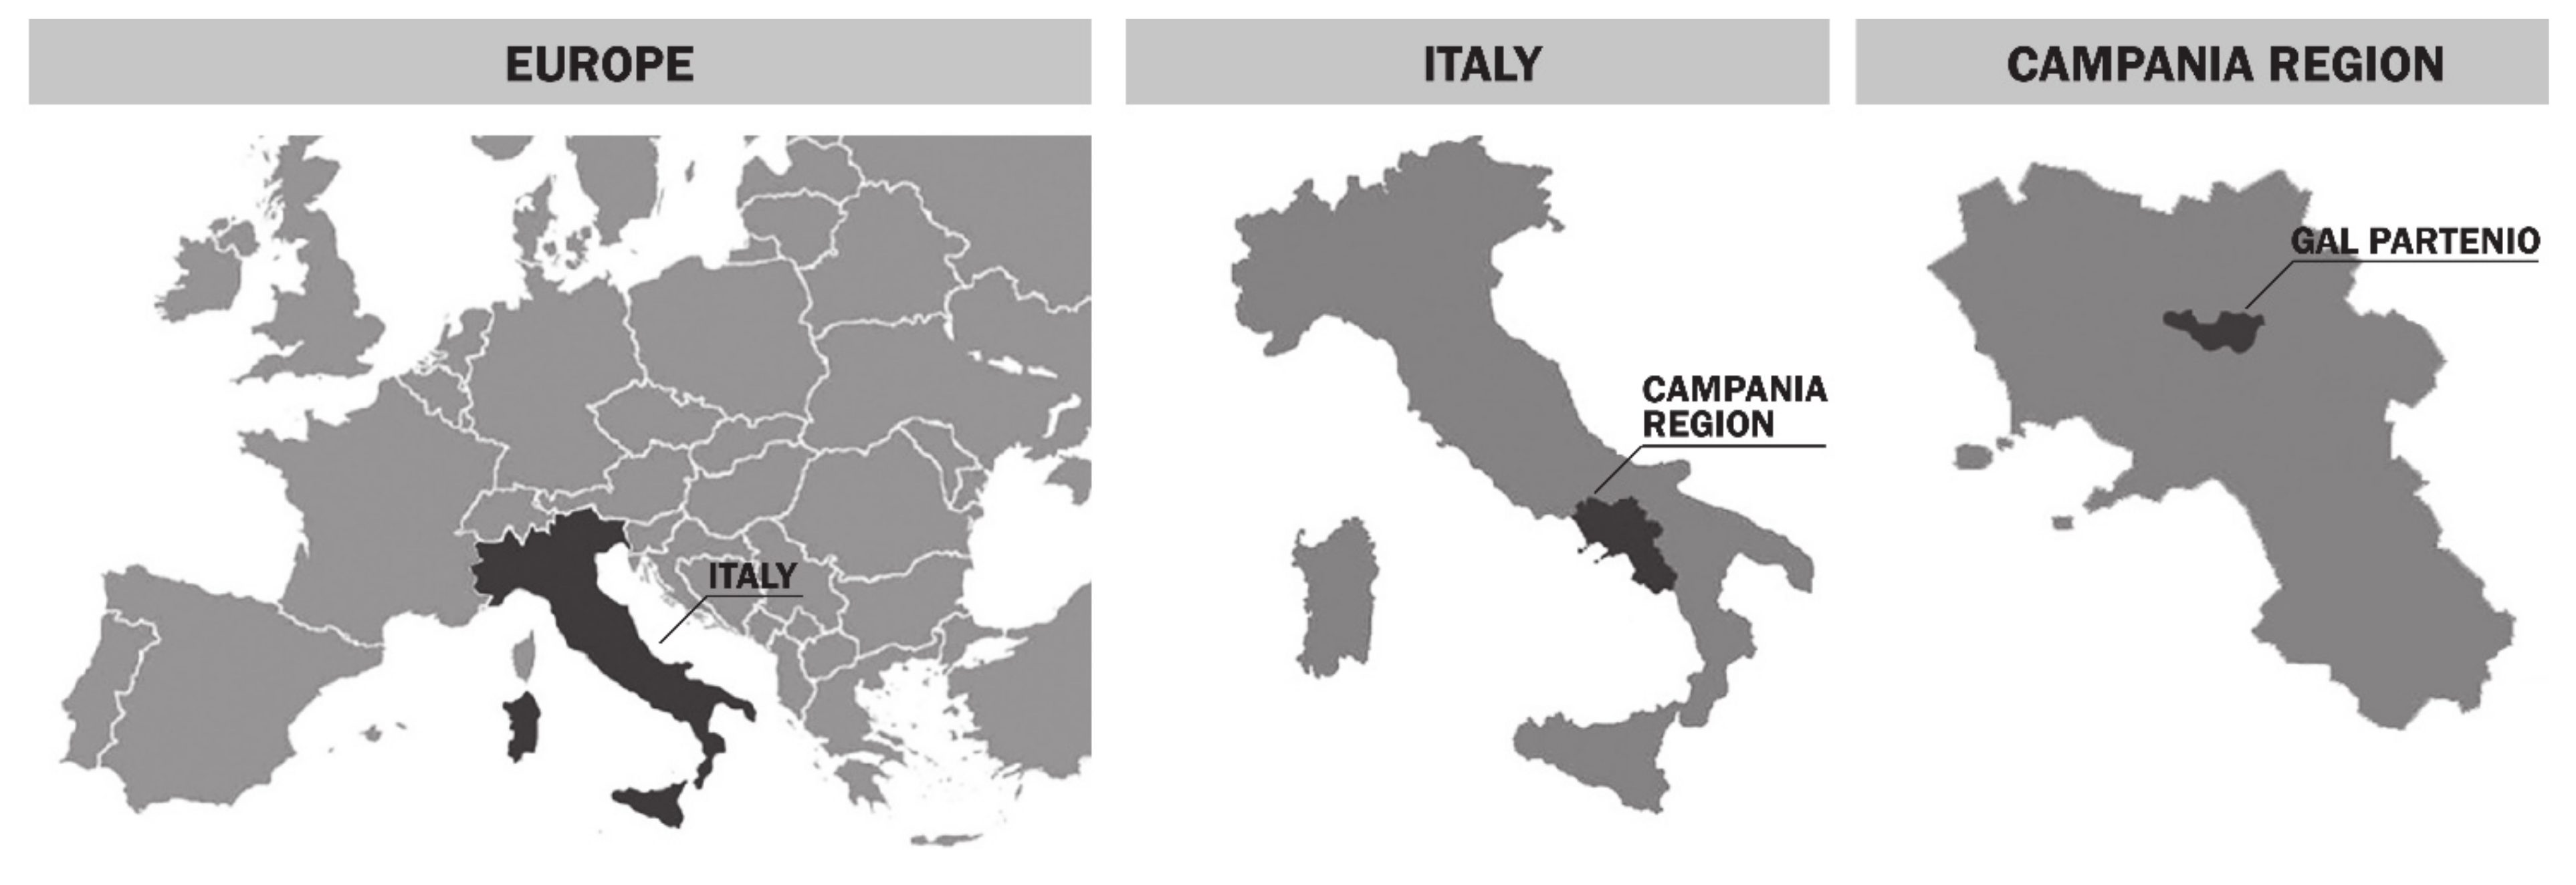
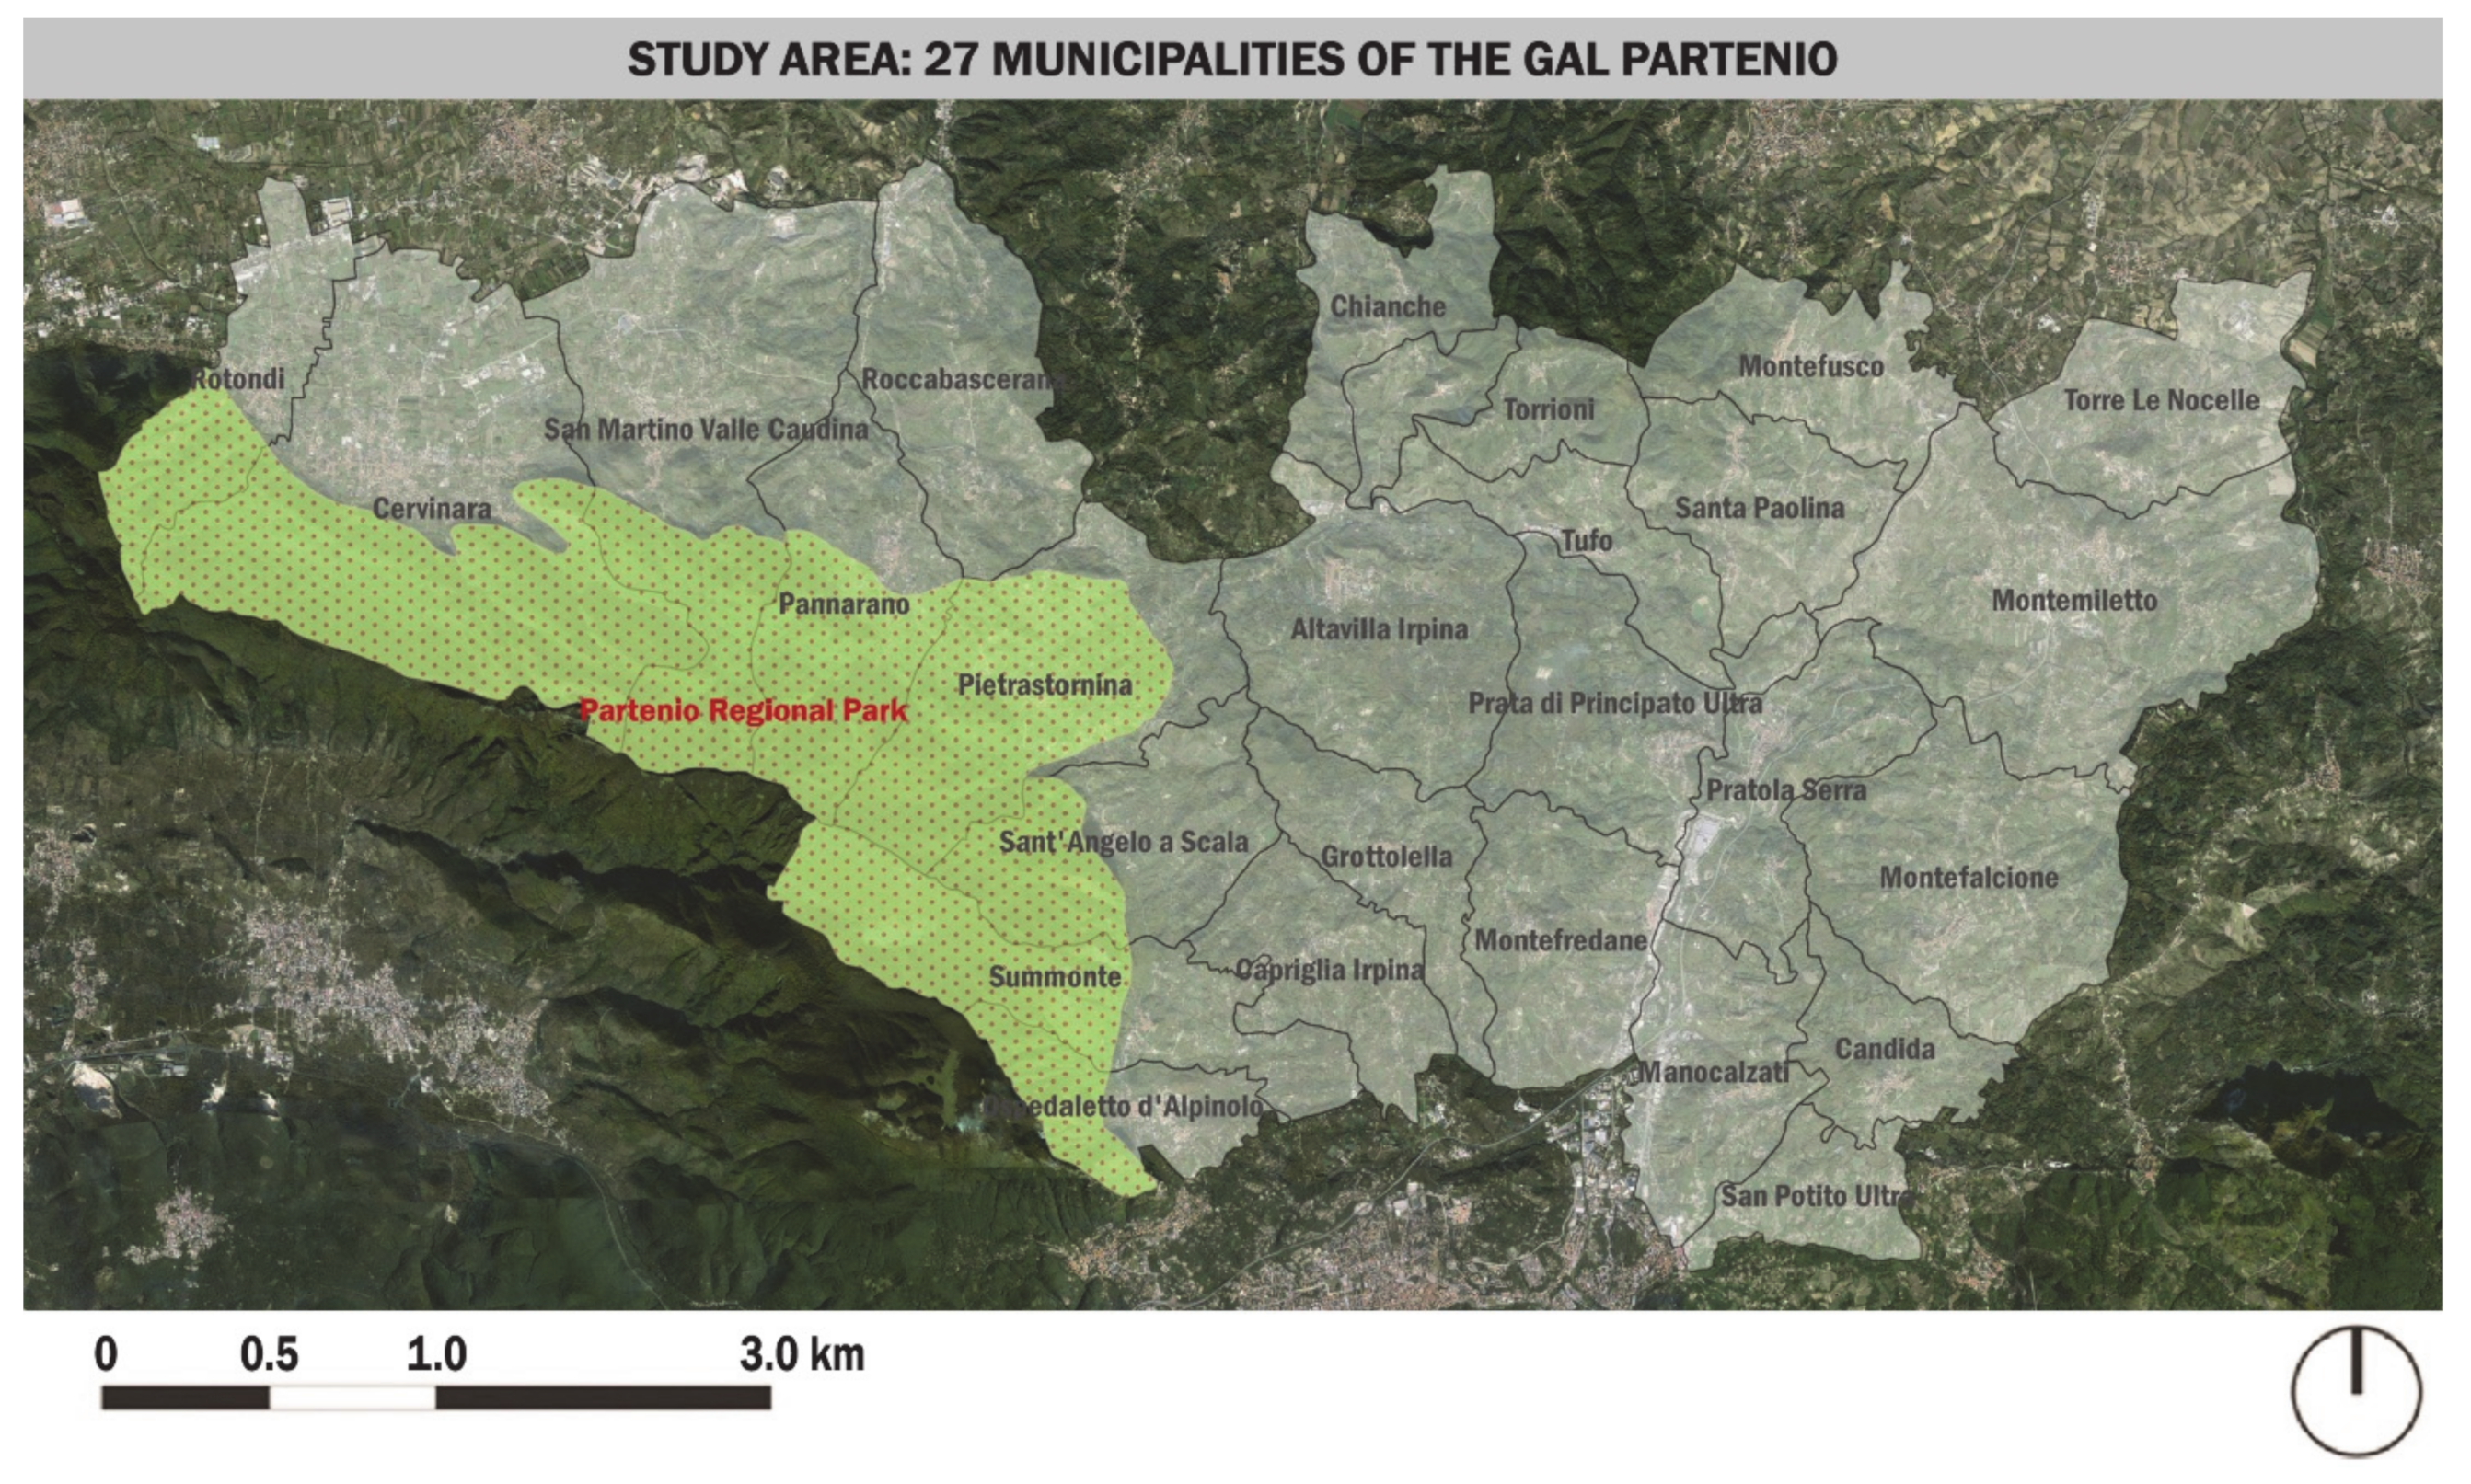
The paper presents a methodology to investigate the relationships among multidimensional phenomena that affect the landscape pattern and its spatial distribution. This approach can be framed within the SDSS methodology [74,75,76,77,78] due to its ability to manage implied data and generate a representation model of the landscape through suitable spatial indicators and indices. The SDSS was structured in four phases, referred to as Intelligence (i), Design (ii), Choice (iii), and Outcome (iv) (Figure 1).
As mentioned above, the SDSS was tested on the case study of PRP. After a short description of the focus area, the in-depth methodology is described in the following paragraphs.

2.1. Case Study

The study area is located in the Campania region (Southern Italy) and includes 27 municipalities, covering approximately 289.0 km2 with 67,594 inhabitants [79]. Additionally, 62.4 km2 of Natura 2000 sites can be observed within the territory (Figure 2 and Figure 3). Specifically, two protected zones, located in the study area, are referred to. The first is the “Partenio” ridge, along the south-west side, with the highest peaks of “Montevergine” (1480 m above sea level) and “Avella” mountains (1598 m above sea level), while the second zone is located on the northern side and includes the wood of “Montefusco Irpino”. PRP can be conceived, with its 148.7 km2 of forests, as a relevant green infrastructure for the nearest inner areas.
In 2008, a Local Action Group—referred to as Gruppo di Azione Locale (GAL) Partenio [80]—was established to support communities in promoting local resources for sustainable development. This organization has been working to stimulate cooperation among different municipalities and define a shared vision of local development for several years. Thanks to several projects, GAL Partenio has involved local communities in the identification of new development opportunities for the area. During this process, different issues have been investigated, and several relevant objectives have been identified for building a territorial process of valorization.
In order to support the design and development of a sustainable enhancement strategy for PRP and surrounding areas, the GAL Partenio has requested that the Department of Architecture at the University of Naples “Federico II” provide a tool to organize the information collected and enable interactions among the different stakeholders involved in the decision-making process. An SDSS has been developed, articulated as four main phases and described in the next sections, and this is able to examine relationships and trade-offs among economic, social, environmental, and cultural values, taking into account the multidimensional components of a transformative territorial resilience process.

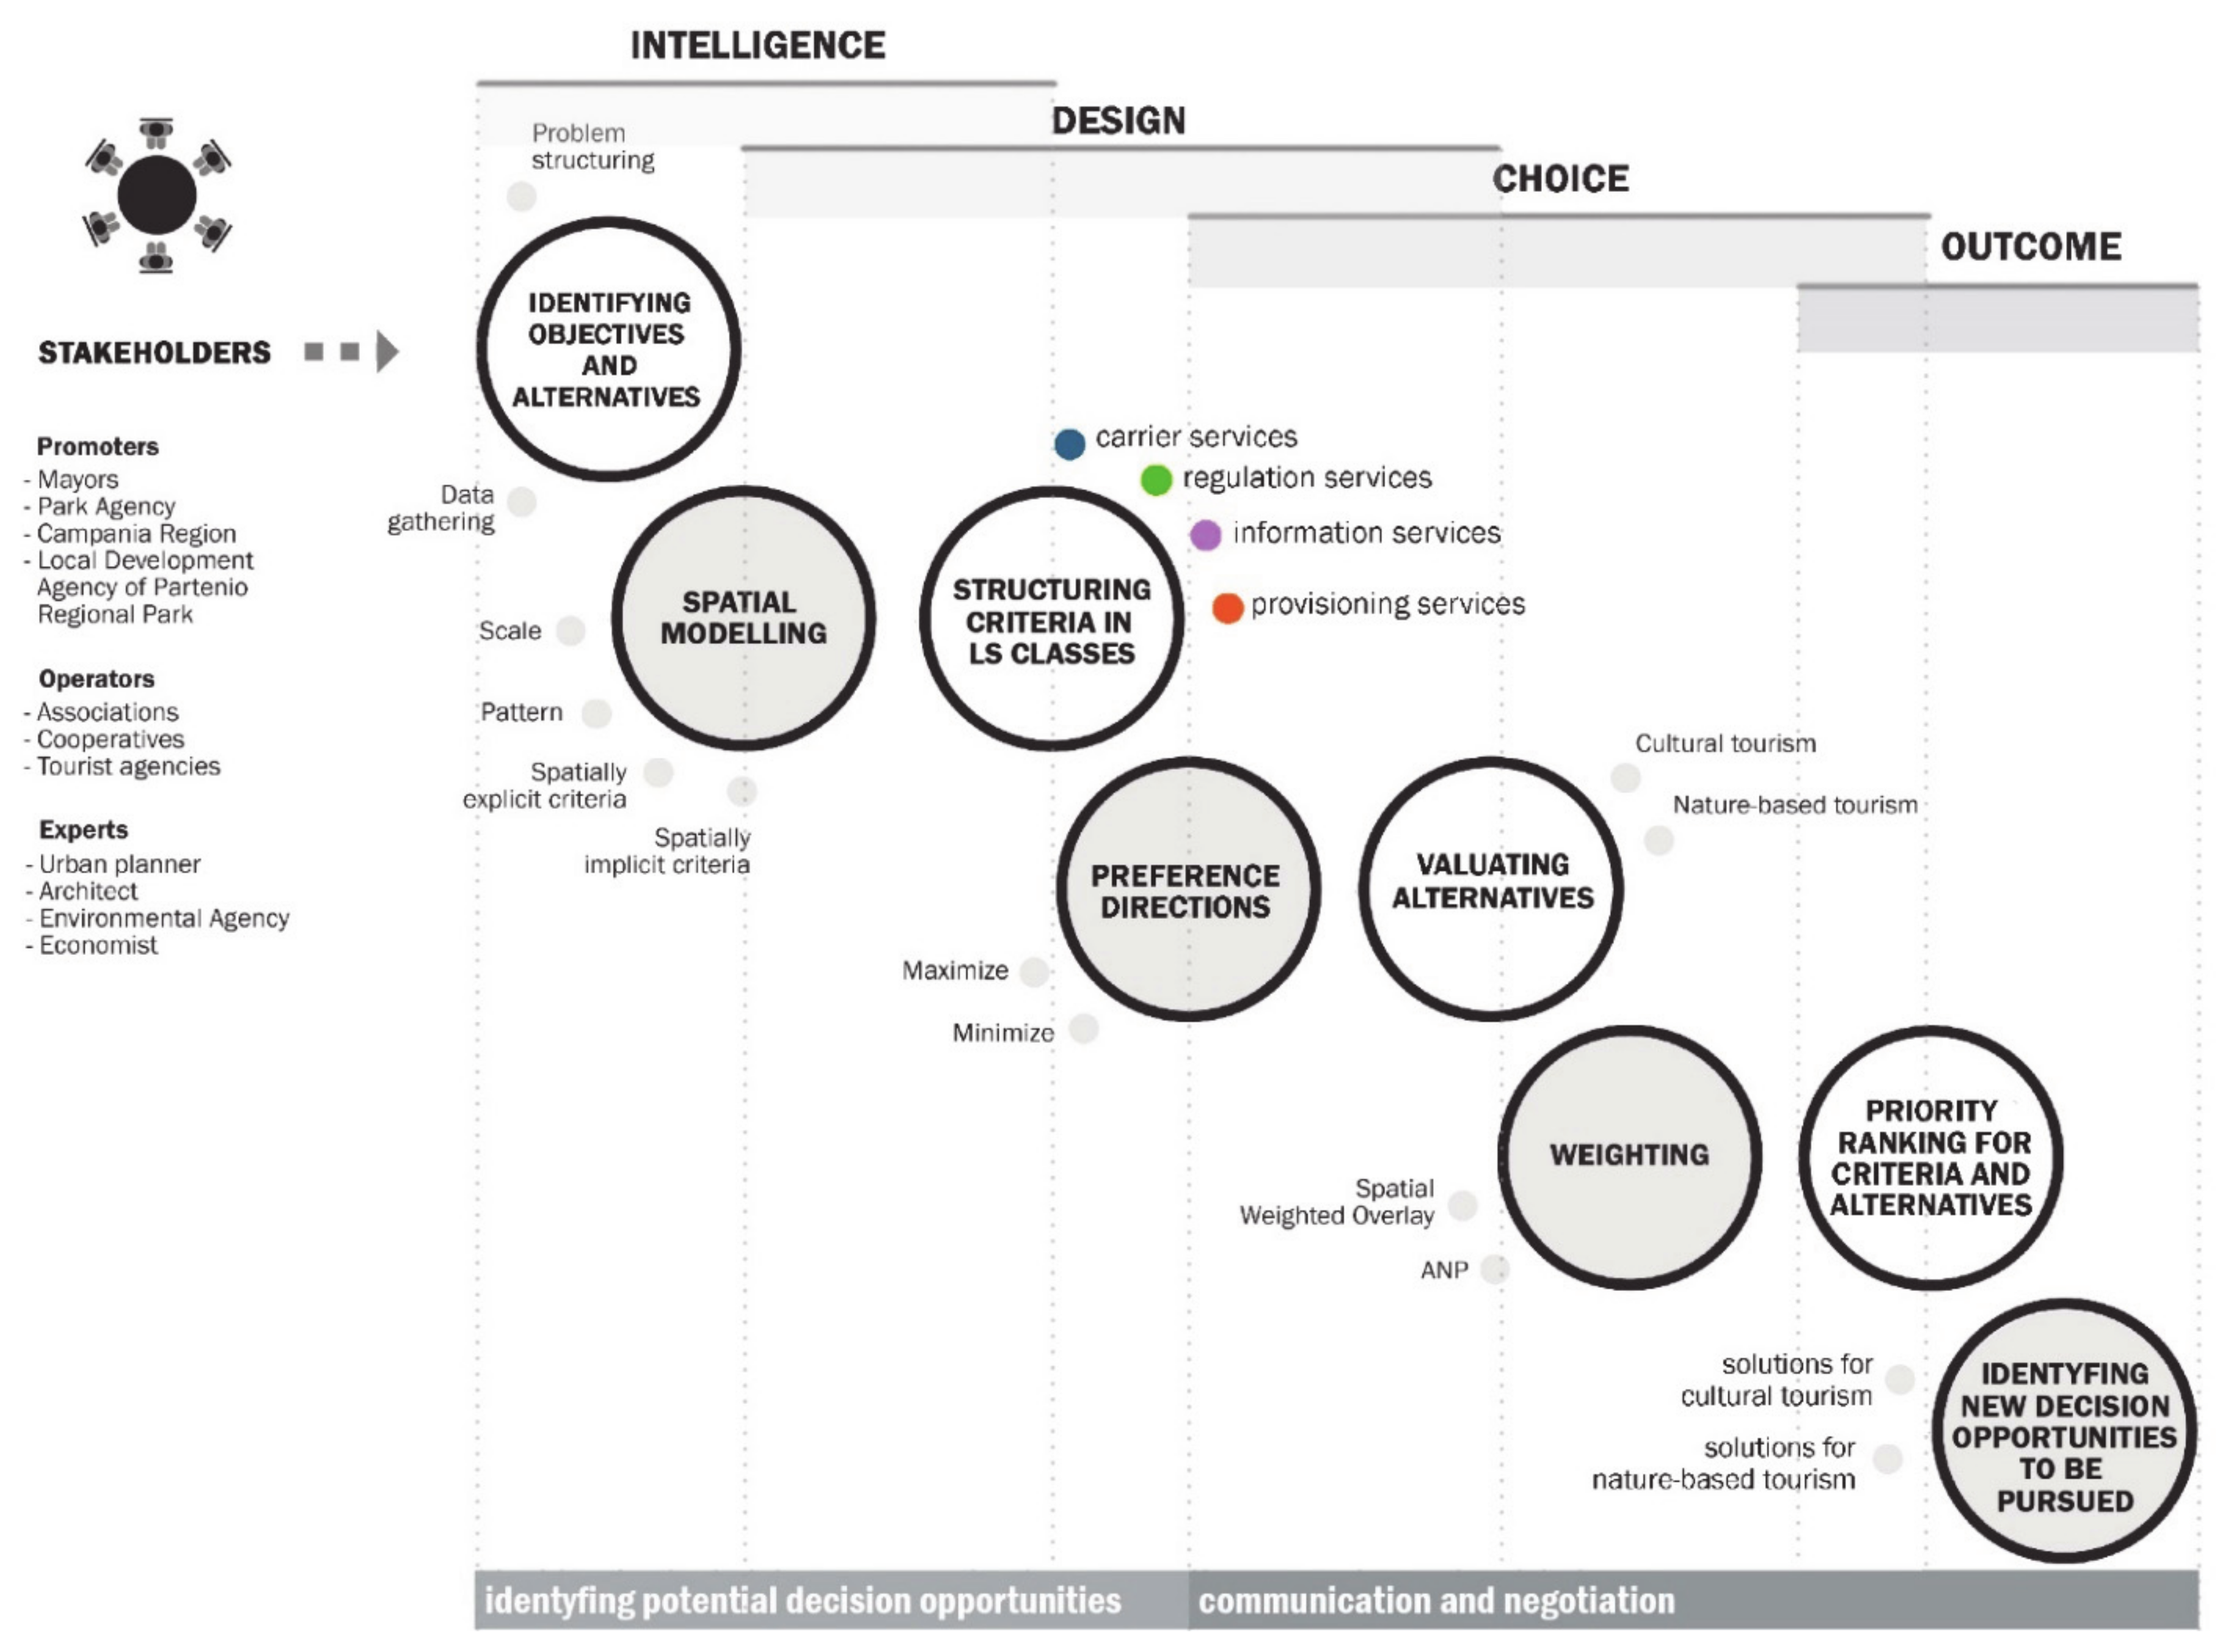
2.2. Intelligence Phase

The intelligence phase has allowed issues explored by GAL Partenio to be analyzed through focus-groups with local stakeholders. These activities have engaged three main stakeholder bundles, referred to as promoters (mayors, park agency, Campania region, Local Development Agency of PRP), operators (associations that promote local knowledge, resources, and attractions; cooperatives of local agricultural producers; professionals and inhabitants; tourist agencies), and experts (urban planners, architects, environmental agency, and economists). During the focus groups, development opportunities able to foster an integrated enhancement strategy involving all of the municipalities around the PRP were discussed and the primary objectives were identified. Such stakeholders have aimed to preserve the natural heritage, enhance the tangible and intangible cultural heritage, promote sustainable tourism as an engine of economic development, and improve the accessibility and park services. In addition, the following alternative scenarios for working towards sustainable landscape development have been distinguished:
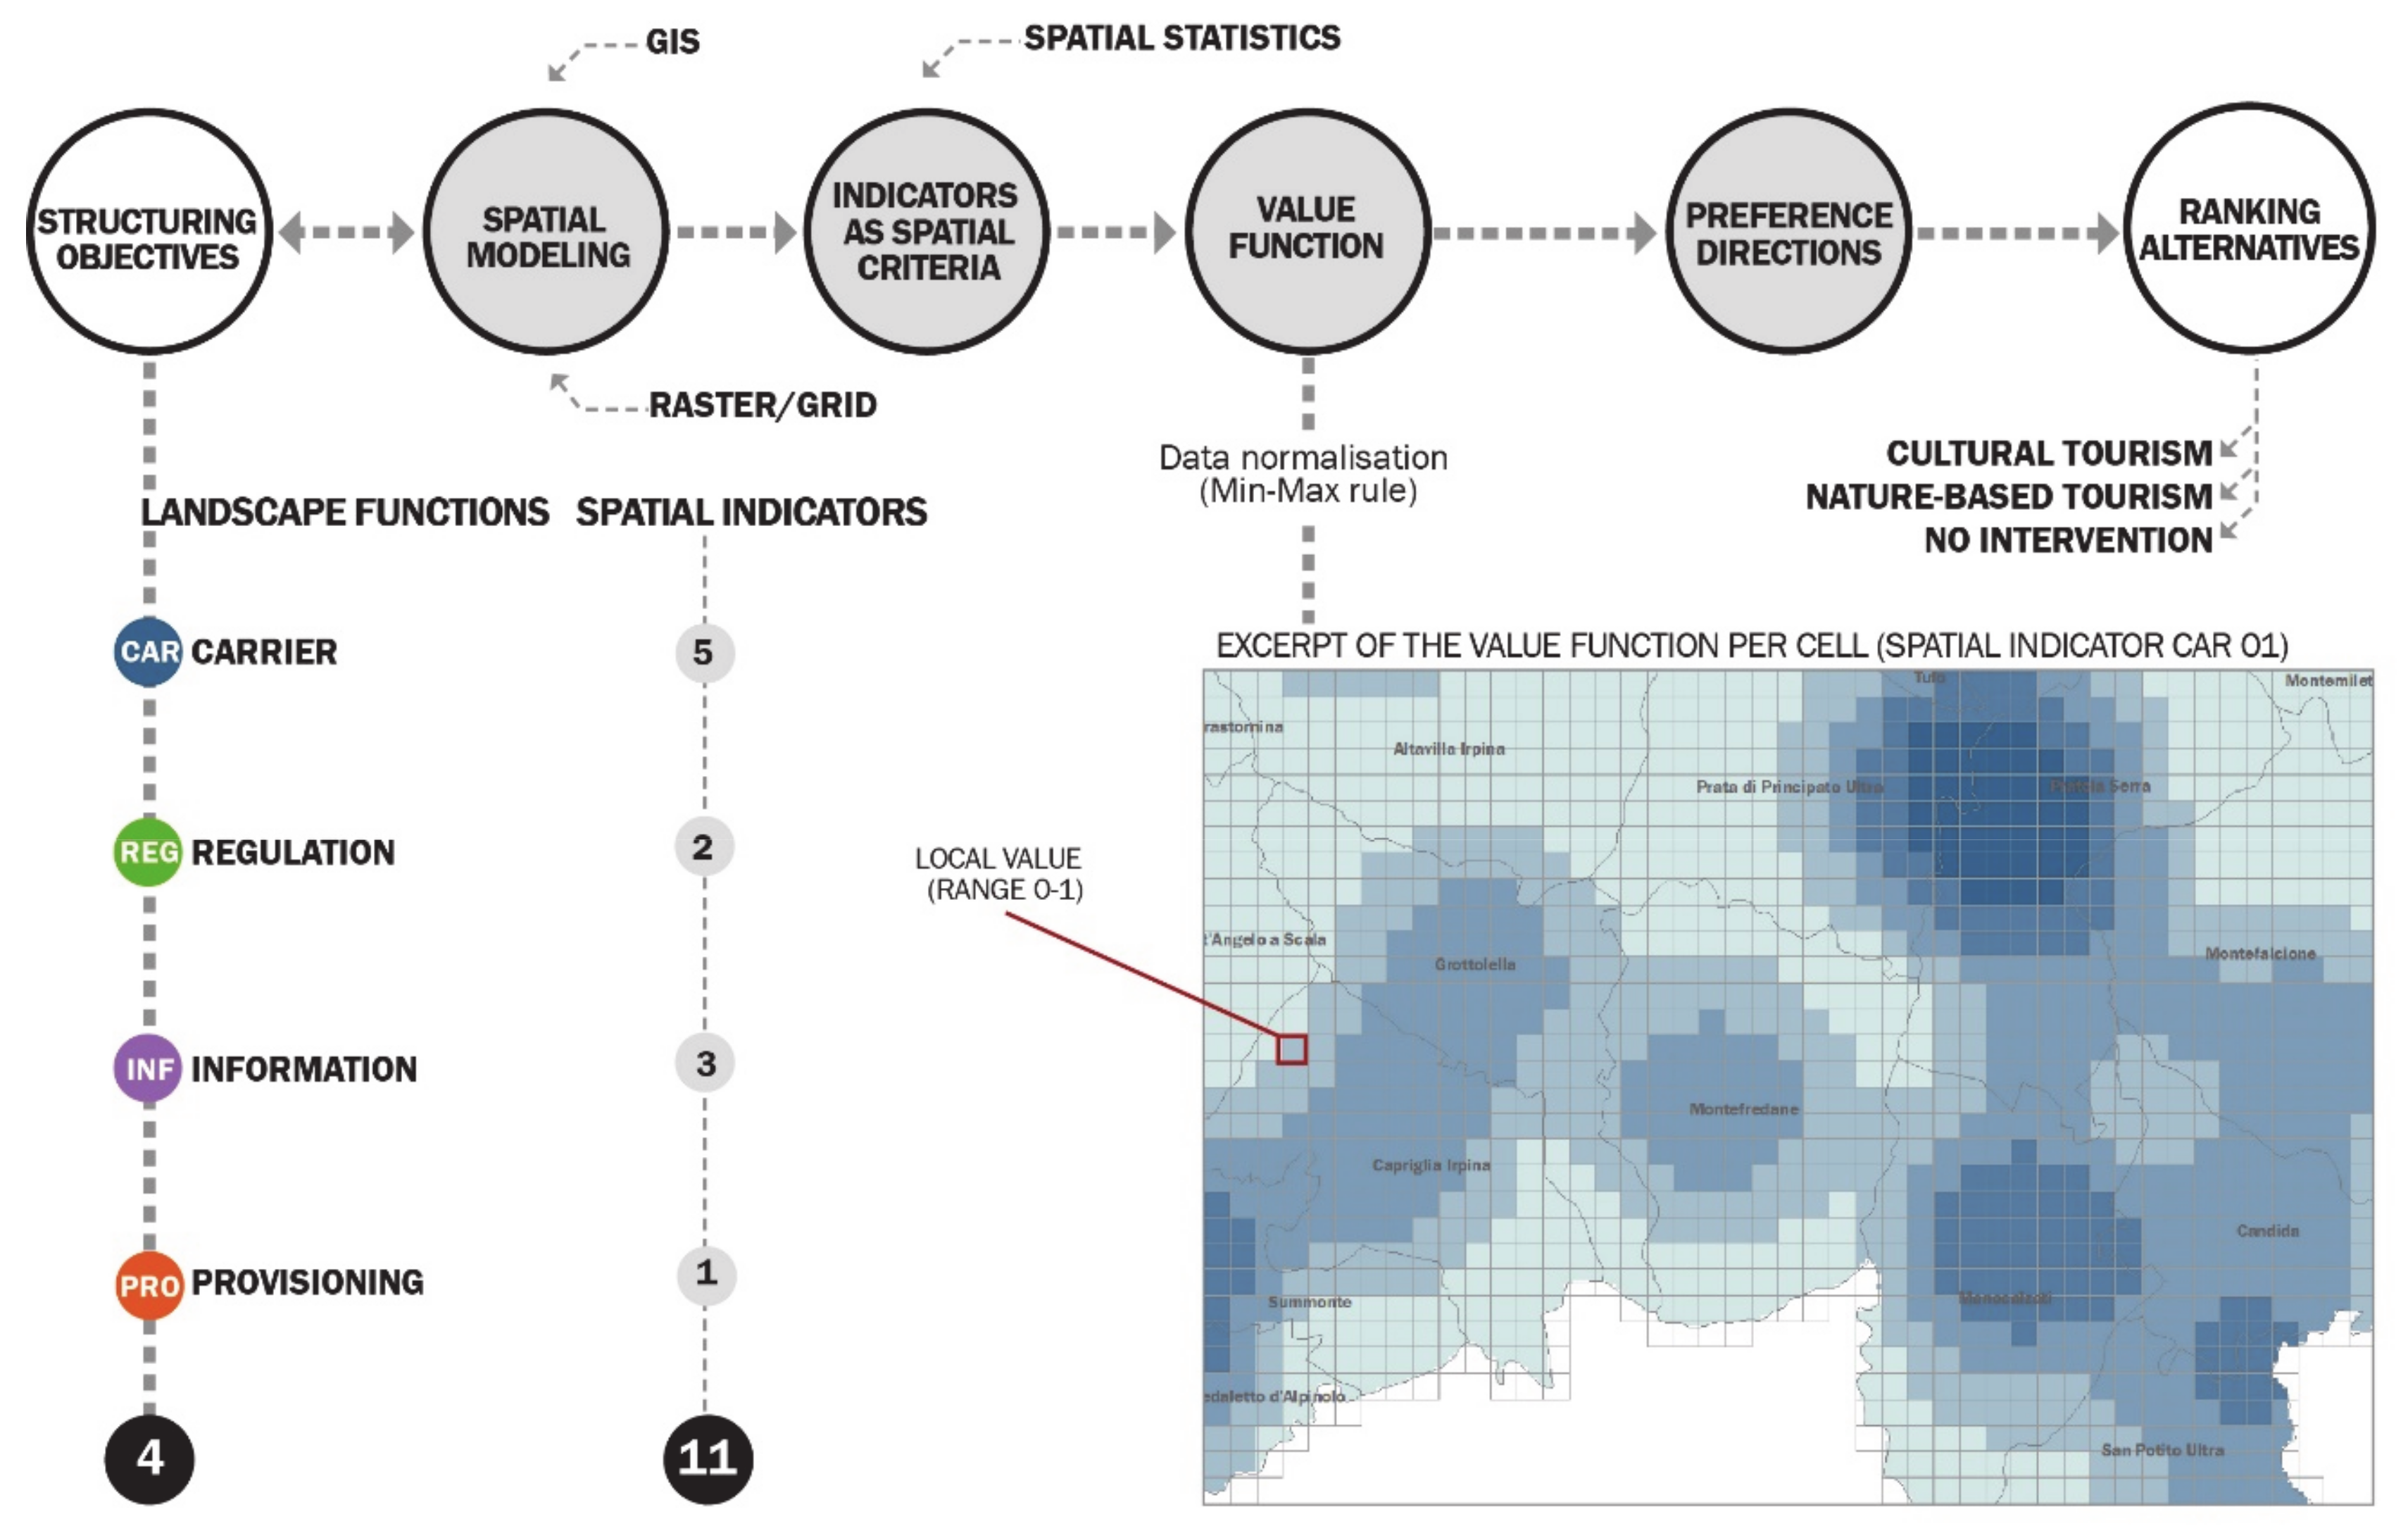
  • Cultural Tourism (A1) has aimed to improve local resources through the “wine/food path strategy”, which recovers old mining quarries in the landscape by encouraging the enjoyment of naturalistic places, tasting of local food, and strengthening of places of cultural interest.
  • Nature-Based Tourism (A2) has attempted to foster naturalistic tourism by implementing quality of life through slow mobility and enhancing amenities through the restoration of paths and guided tours in the PRP.
  • The analysis of focus group outputs showed that local communities aimed to implement the local economy without compromising the capacity to retain ecological functions and processes and the local identity. Therefore, in the structuring of the problem, a multifunctional landscape perspective was adopted, allowing different issues to be explored. Local resources were categorized as four primary classes of Landscape Functions—referred to as Regulation, Carrier, Information, and Provisioning by de Groot (2006) [50]—and described as listed below:
  • Carrier Function. This involves physical spaces, soils, and infrastructures through which the landscape-users can carry out daily activities (e.g., dwelling, hosting, and moving). The carrier functions are essential to guaranteeing suitable fruition of the landscape, from the perspective of tourism development, but conversely, the use of these typologies of function can generate an irreversible loss of the original ecosystem;
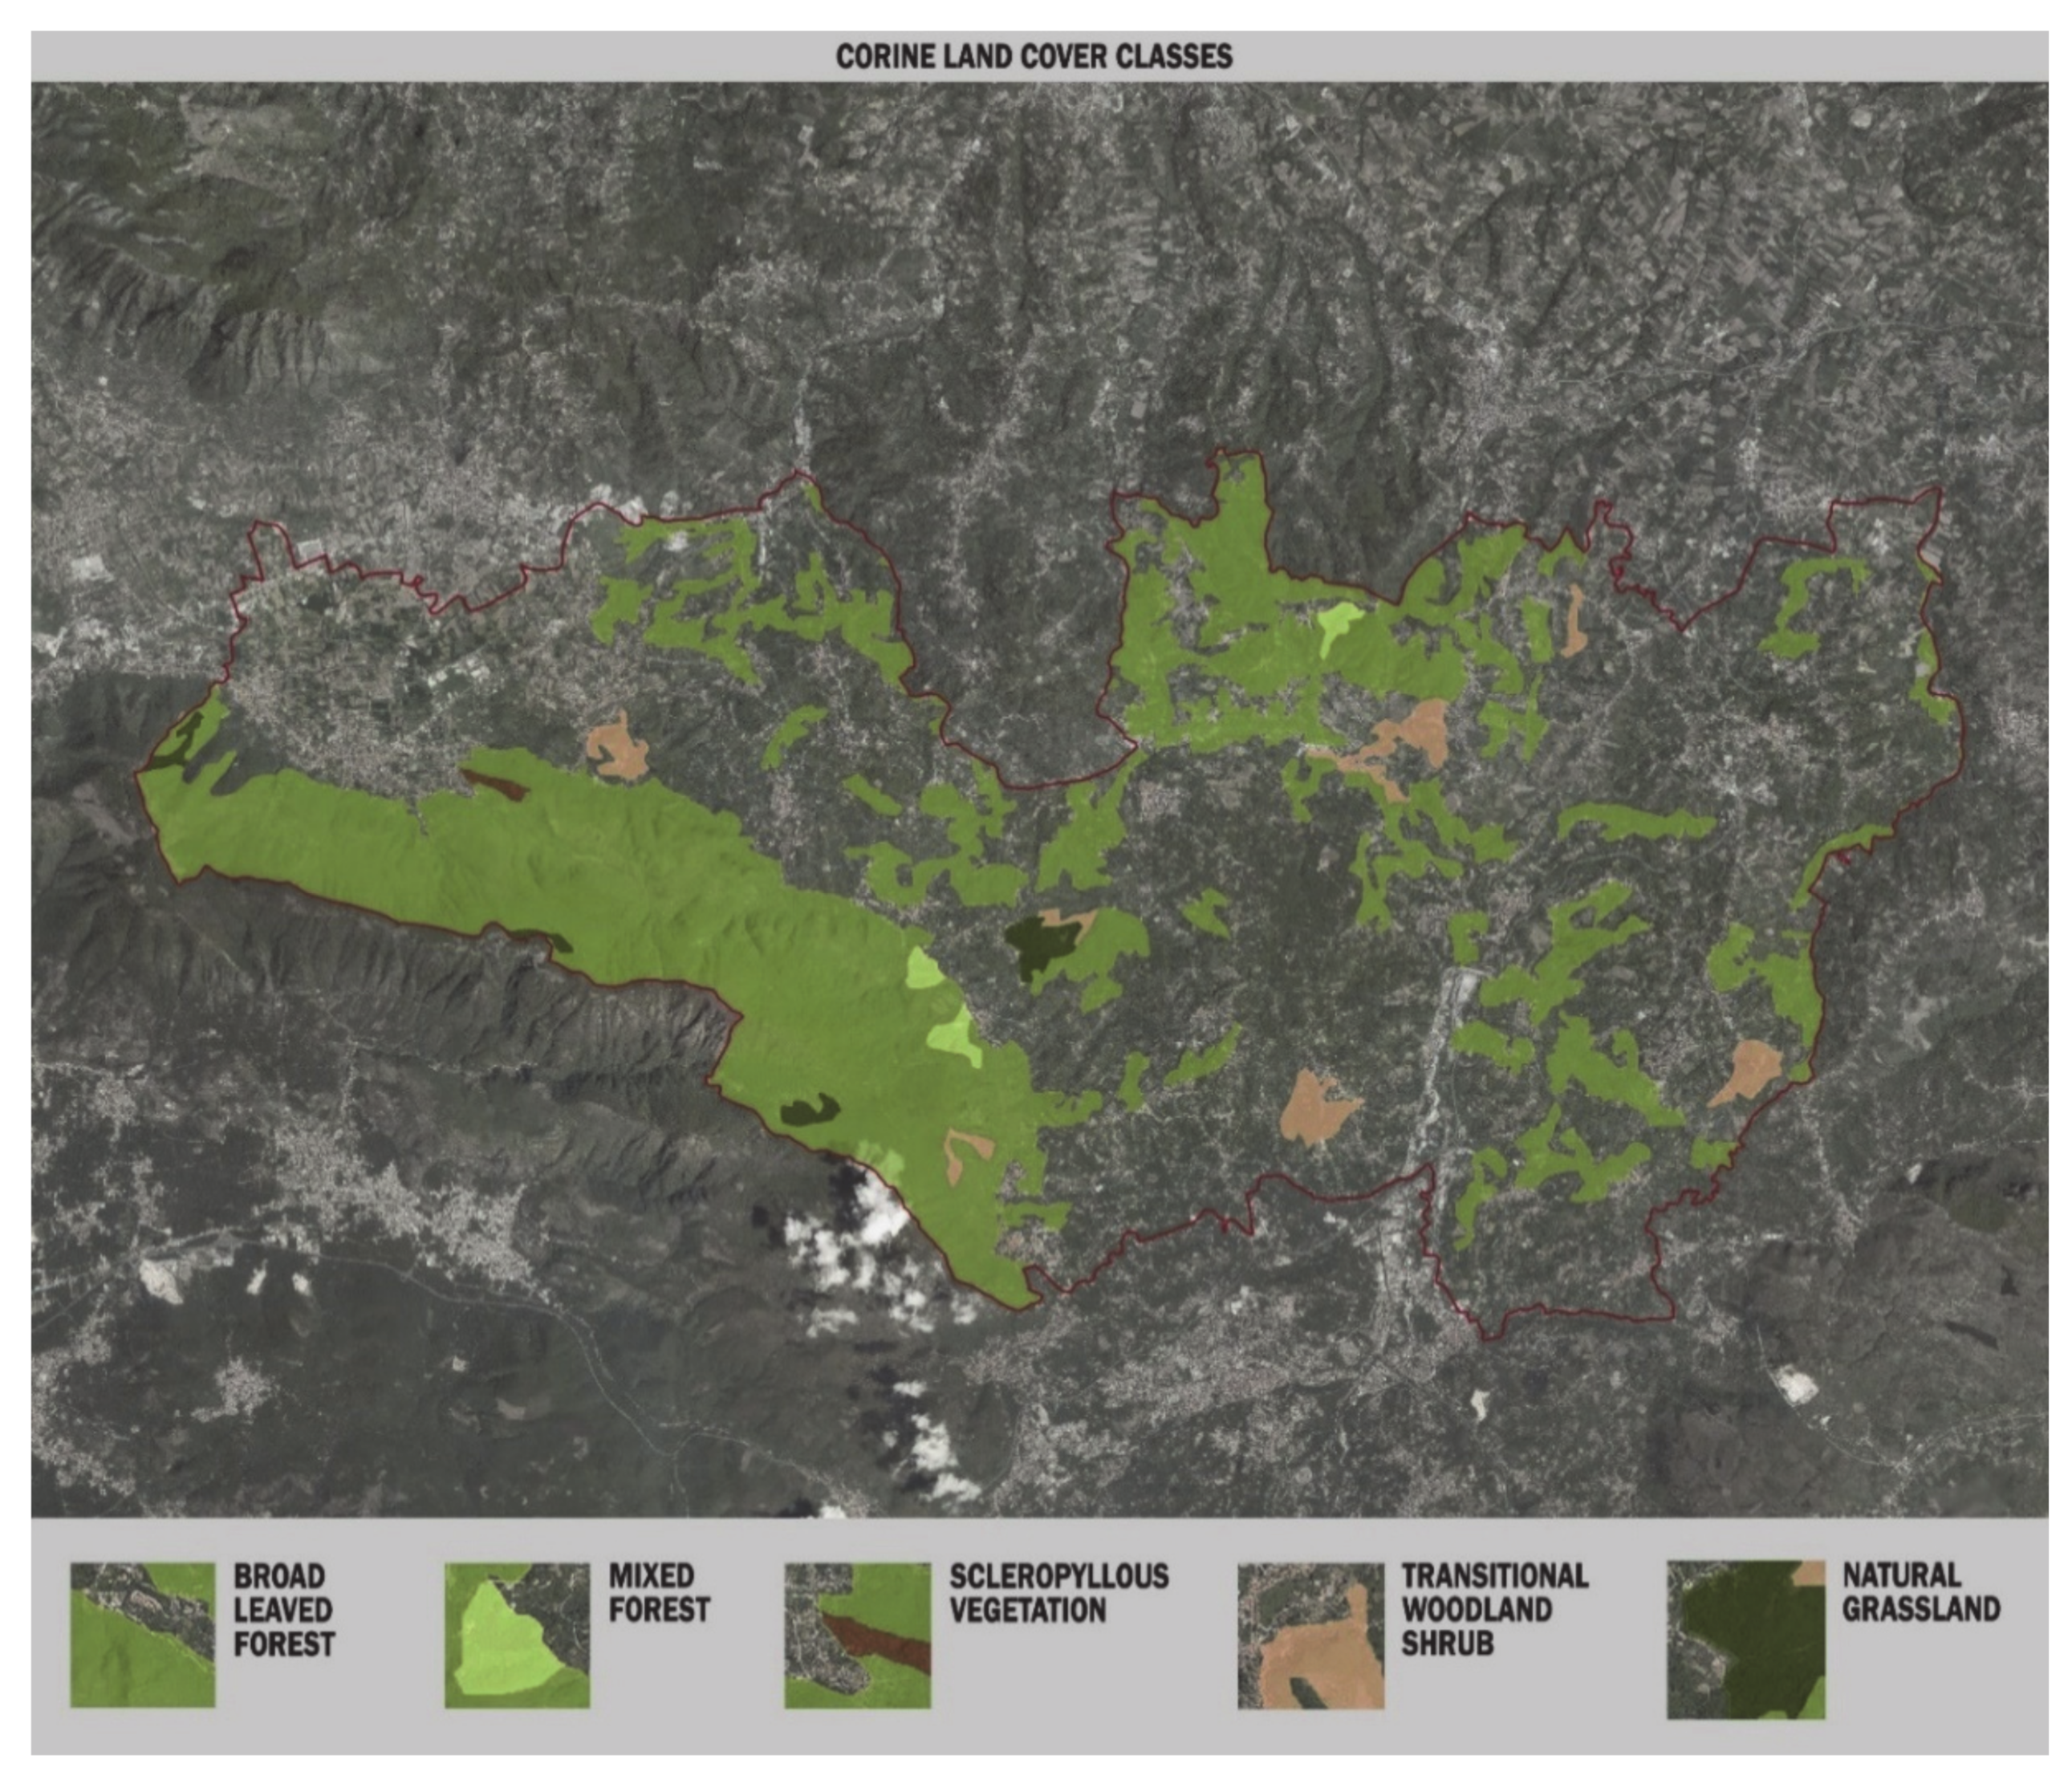
  • Regulation Function. This relates to the landscapes’ natural capital’s capacity to make the ecosystem processes work with their direct/indirect benefits to human beings. According to the Corine Land Cover (CLC) [81] classification, the local landscape is shaped by a sizeable part of the broad-leaved forest and transitional woodland shrub, while the presence of moors, natural grassland, mixed-forests, and sclerophyllous vegetation is more limited and widespread. The natural classes of land cover indicate high values of ecological integrity and biodiversity in the focus area, considering how the regional park provides relevant ES for the surroundings (Figure 4). This means that each new action should be designed carefully for ensuring the ecological integrity of the area;
  • Information Function. This involves human evolution and cultural fulfilment, which can be achieved through education, comprehension, observation, and fruition of the landscape with its tangible and intangible features. In the local context, the cultural heritage and history of the landscape are remarkable in terms of monasteries, destinations for religious pilgrimage, and ancient castles, but also regarding quarries and fossils that characterize the geomorphology of the mountain ridge and naturalistic paths and open landscape spaces that make the landscape particularly attractive for education and science. These cultural and natural sites are also places in which the local community mainly recognized their own identity;
  • Provisioning Function. This relates to the processes of conversion which the natural ecosystem carries out to shift the primary resources into living biomass. In the local landscape, the terrain’s pyroclastic structure makes the soils fertile and productive so that local products (i.e., nougat, truffle, and chestnuts) can be established as a significant brand for the territory. It follows that, the finer the farming product the soil allows to be produced, the higher the value of this landscape service.
As described above, the problem of sustainable enhancement of the PRP was modeled as a multicriteria problem, in which the four landscape functions (Regulation, Carrier, Information, and Provisioning) represent the four main criteria to be taken into account. Each function/criterion was specified thanks to specific indicators.
Furthermore, to better identify a shared strategy in which all the municipalities can take part according to their territorial potentialities, significant attention was paid to the spatial representation of these indicators, in order to analyze and localize the multifunctional values of the territory.
Assuming that a criterion is a standard of judgment or a rule based on which alternative decisions can be evaluated and ranked [64], the explicit or implicit spatial nature of criteria/indicators is essential. Both the explicit and implicit criteria/indicators are inherently compounded by spatial data, i.e., land use-land cover (LULC) classes, protected areas, etc. [82,83]. However, while the first are related to site characteristics, such as the size, shape, and contiguity, the latter use geographical features to transfer their spatial representation. In many cases, implicit spatial criteria [84] consider spatial data to compute the level of achievement of the criterion and can involve spatial attributes, such as the distance, proximity, accessibility, elevation, and slope [85,86]. Both typologies of criteria help decision makers achieve spatial representation to broaden and improve landscape knowledge.
In the PRP case, the issue of spatial representation of the indicators was addressed through spatial modeling of the multicriteria problem, which contributed to improving the local landscape knowledge. In particular, authoritative data sources (Territorial Planning Offices, National Statistical Institute, etc.) were matched with open-source data, and the volunteered geographic information (VGI) [87] provided by Panoramio and OpenStreetMap applications. The spatial representation process of the indicators is shown in the next paragraph.

2.3. Design Phase

The design phase (ii) relates to data processing and categorization, according to the four categories of landscape functions (FS) relevant for the focus area (Figure 5). A spatial representation model was developed, processing raster data with a cell size (pixel) of 250 × 250 m. Concurrently, the spatial indicators were normalized into a 0–1 range—according to a preference direction as shown in Table 1—and geo-located on a grid with the same minimum mapping unit (MMU). In particular, data points, polygons, and lines employed the same unit of analysis.
Within the design phase, GIS operations were performed to set up the indicators for the subsequent evaluation steps (e.g., spatial joints relating shape features to the MMUs, raster statistics to achieve mean values per cell, and a raster calculator to aggregate values derived by MCDA through the weighted linear combination (WLC)).
According to De Groot (2006), landscape services can be divided into four macrofunctions of the landscape. Moreover, each of these can be described by different indicators representing the local meaning of the function. Table 1 reports the classification of the function, spatial indicators, preference direction, and ID of each spatial indicator.
Each function can be explained through spatial indicators or indexes which were derived from landscape features, as follows:
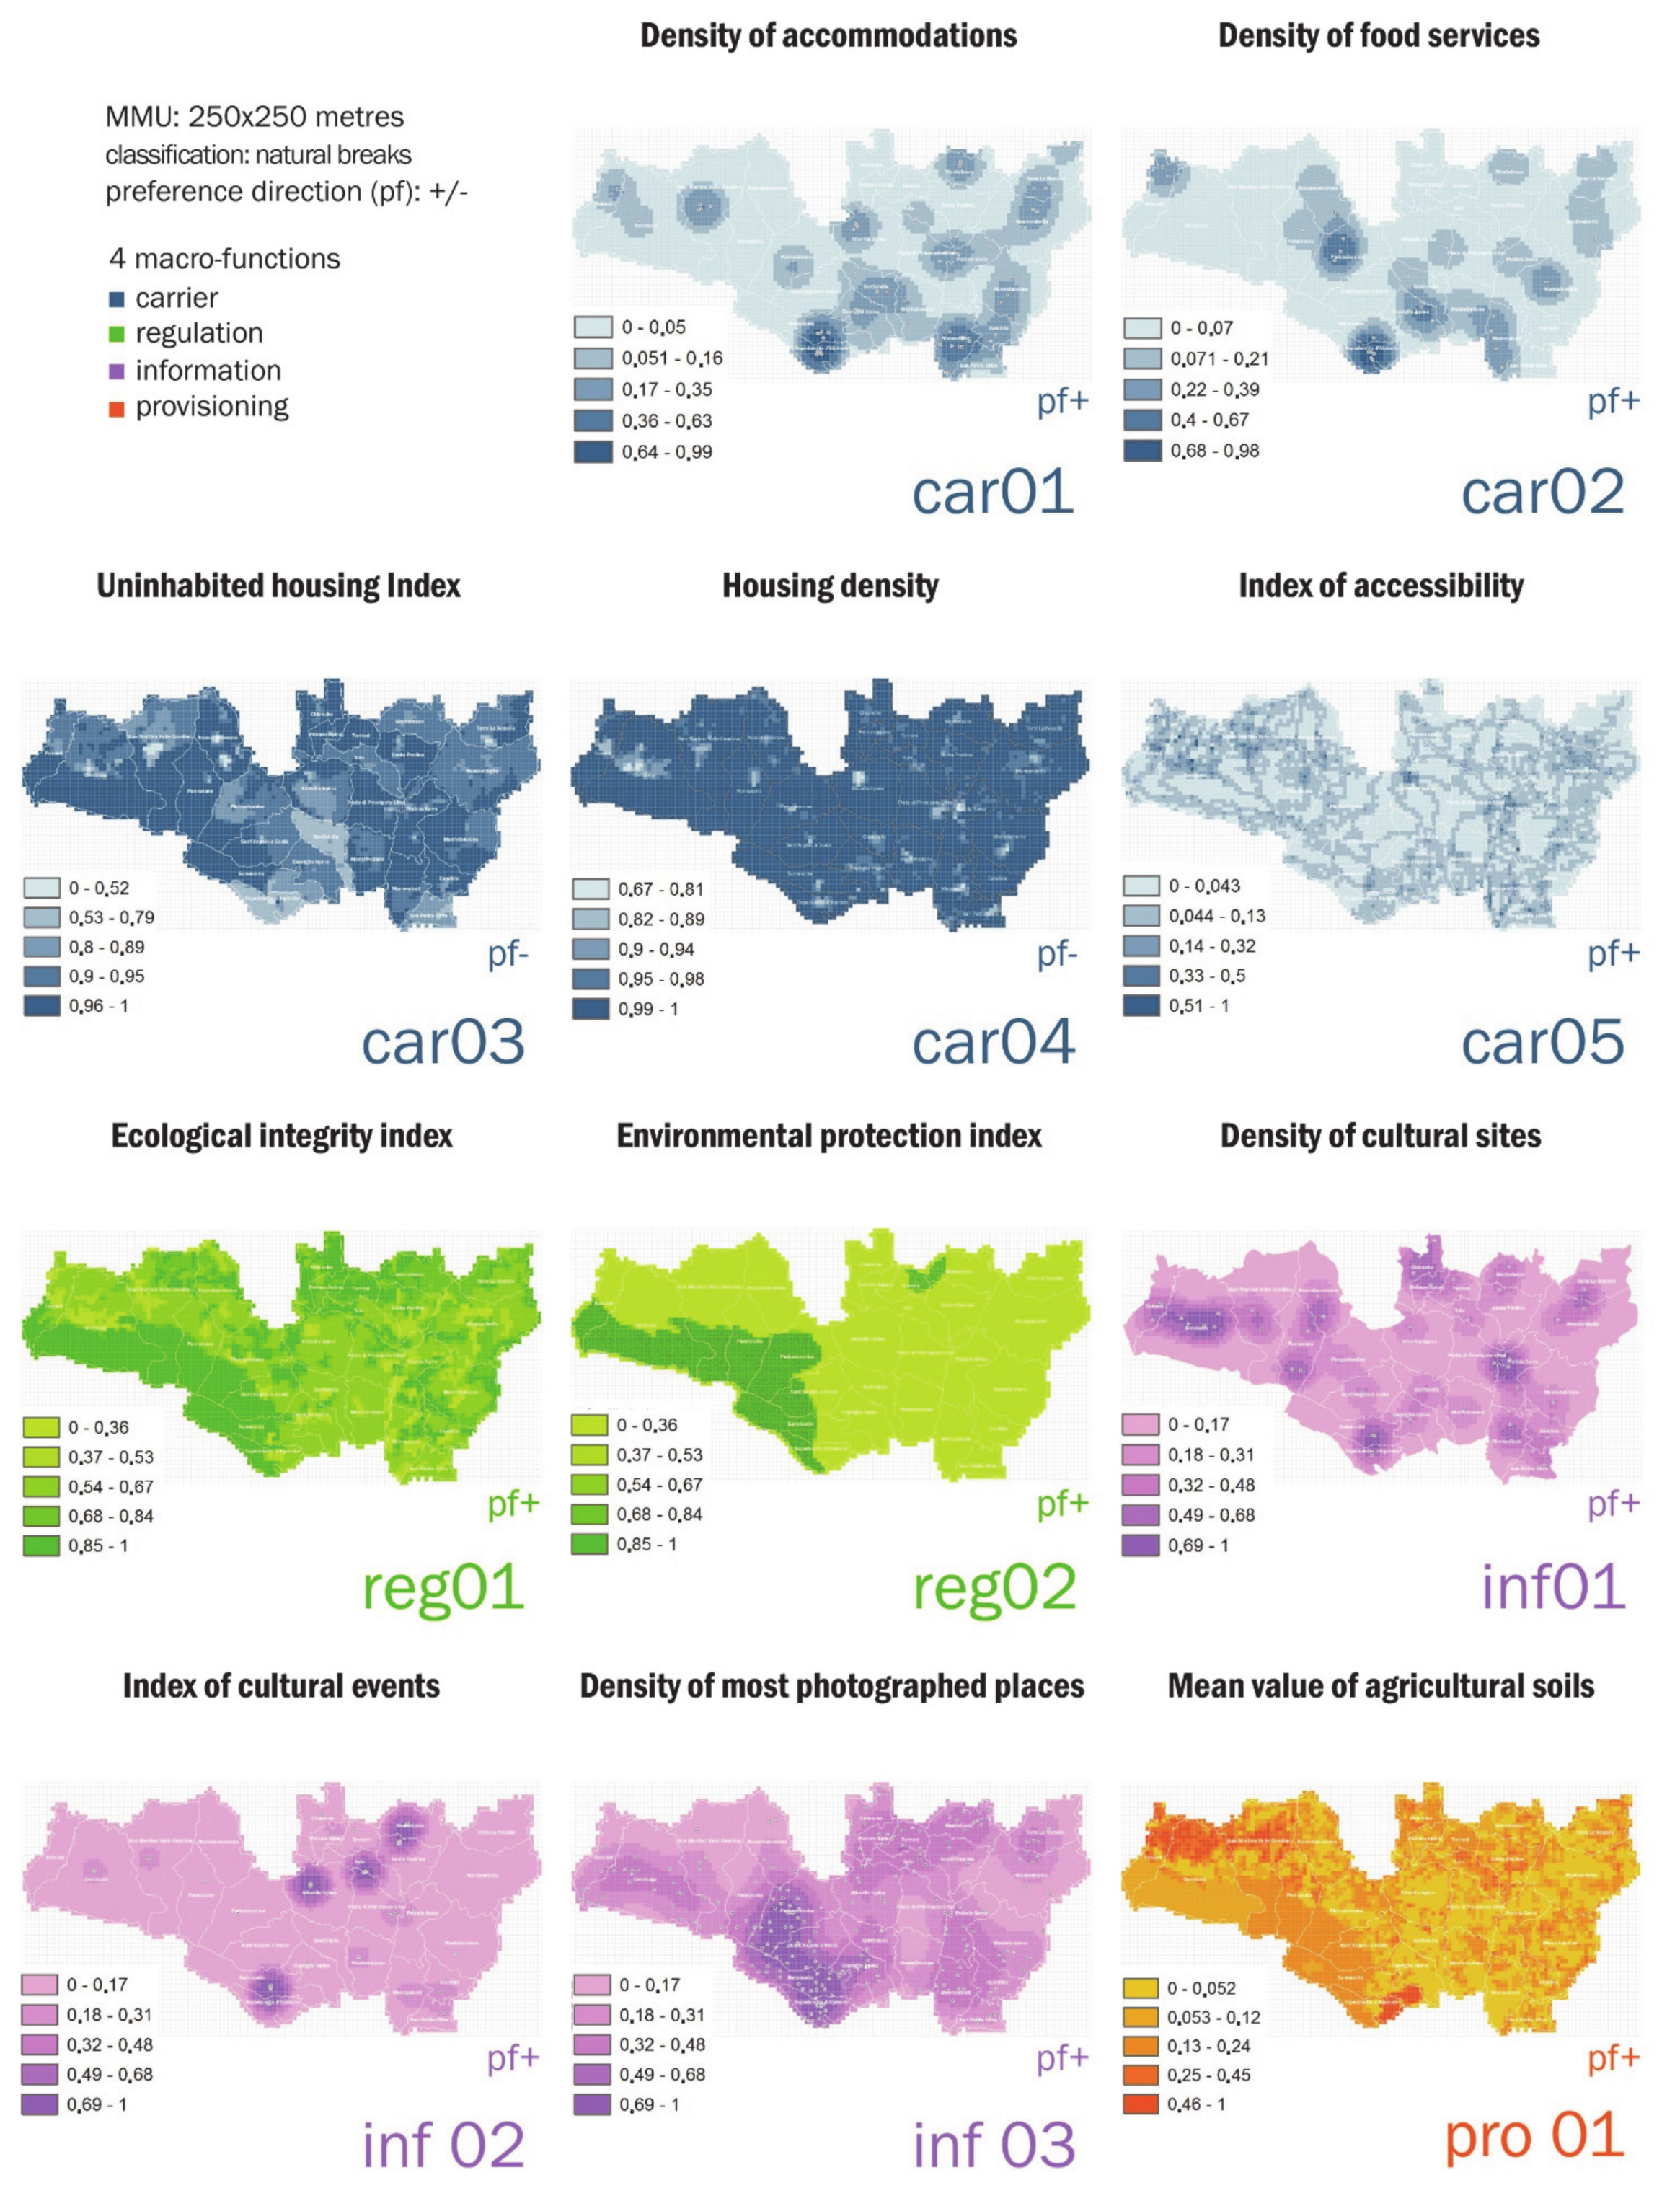
  • Carrier Function. The specific functions that were considered within this category include tourism facilities, habitation, and transportation, while the following five indices have been expressed: Density of accommodation facilities; density of food services; uninhabited housing index; housing density; index of accessibility;
  • Regulation Function. The specific functions related to this category include environmental regulation provided by the natural areas and they were represented by the following two indices: Ecological integrity index and environmental protection index;
  • Information Function. Specific functions involve cultural ecosystem services that provide cultural, artistic, and aesthetic information. In this case, they were represented by the following three indices: Density of cultural sites; index of cultural events; density of most photographed places;
  • Provisioning Function. This category includes the cultivation function since it is crucial for the extraction of raw materials for human life; for this category, the only indicator provided relates to the mean value of agricultural soils.
The different landscape functions describe the main criteria adopted for the selection of spatial indicators and are able to define the thematic framework of the spatial modeling.
According to Barreto et al. (2010), when data differ in size, accuracy, and spatial definition, subdividing the surface of analysis into a regular cell size turns out to be useful for mapping such heterogeneity [29]. For this reason, a grid-based approach considering an MMU of 6.25 ha (250 m per side) was adopted. In this way, further data for progressively enhancing the dataset can be vectors or rasters indifferently, since they have to be produced on a standard surface.
Since a relationship between infrastructure and the landscape’s points of interest was evident, a bandwidth of 5 km was determined through a proximity analysis. The proximity was calculated through the average of the nearest distance among point-based indicators car01, car02, and inf01, and a linear network of railways and roads, which were modeled through the indicator car05. The analysis results pointed out that the range of maximum distances for each indicator scores was between approximately 3.6 (the minimum) and 6.5 km2 (the maximum). The mean was subsequently used as a kernel density estimation (KDE) parameter in the ArcGIS environment (Figure 6).
Since the choice of bandwidth mostly affects the results of KDE, Spencer et al. (2017) suggest assigning the parameter by taking account of the limitations of instruments producing data [88]. We adopted a twofold approach to choose the bandwidth: On the one hand, assessing the limitations of the available tools, and on the other hand, assuming the aforementioned empirical approach related to the mean distance range.
In this way, all the indicators have been spatially represented and reported as a preparatory step for the landscape’s multifunctionality assessment.

2.4. Choice Phase

The choice phase (iii) was addressed to evaluate the directions of the local development (Cultural Tourism or Nature-Based Tourism) through the compensatory multicriteria method called “Analytic Network Process” (ANP), which was performed with the software Superdecisions [89,90]. This method implements the Analytic Hierarchy Process (AHP) by Thomas L. Saaty because it includes the interrelationship between elements of a network of criteria [91]. The ANP allowed the relationships among the multiple landscape functions and the priorities of knowledge domains involved in reaching the goal to be investigated.
Specifically, the ANP was divided into four main phases. The first phase allowed the main goal of the analysis to be defined, related to “Defining sustainable pathways for a tourism-oriented development in the PRP”. Subsequently, the method sorted the decisional problem into two fundamental elements: nodes, compounded by the indicators, and clusters that constitute criteria (landscape functions). The third and fourth phases were carried out thanks to two focus groups with a team of experts.
During the first focus group, the interactions among different landscape functions were investigated, and inner and outer dependencies among indicators were explored. This step allowed the network model in Figure 7 to be built, which reports the relationships and interactions among nodes (Indicators) and clusters (CriteriaLandscape Functions).
Indeed, in the second focus group, the experts carried out a pairwise comparison at the level of nodes and clusters, by discussing their preferences in a transparent, inclusive, and plural way. The authors also introduced a control scenario (Alternative 0–A0), representing the landscape’s current state without intervention, in order to facilitate a comparison of the scenarios Cultural Tourism (Alternative 1–A1) and Nature-based Tourism (Alternative 2–A2). Finally, the software provided a sensitivity analysis for checking the judgments’ consistency.
Table 2 and Table 3 respectively show two outcomes of the ANP consisting of weighted and limiting super-matrices, which combine outer and inner interdependences between clusters and nodes, and weights expressed by the priority vectors related to each main category [92,93,94].
The final ranking produced by ANP method is reported in Table 4, which shows that Cultural Tourism (A1) is the preferred scenario, underlining the results related to “Normalized by cluster” and “Limiting” values. In addition, the value in “Normalized by indicators” column highlights the contribution of each indicator. This information allowed us to identify the most suitable areas for Cultural Tourism scenario implementation.

2.5. Outcome Phase

The outcome phase (iv) allowed the landscape multifunctionality map to be defined considering the network of weighted spatial indicators normalized in a 0–1 range.
In addition to the evaluation process, which is the core of the choice phase, the spatial model was implemented in the GIS environment by making the priority vectors, obtained from the ANP method, explicitly spatial. The priority vector was performed through an additive aggregation rule expressed by the following formula [1]:
M i = i = 1 m m i w i
where
M i is the multifunctionality index,
m i is the normalized score of the ith spatial indicator, and
w 1 is the global weight of the ith spatial indicator.
The additive rule was chosen as an aggregation procedure since it allows the indicators to be offset with lower values with respect to those that reveal the highest scores and incorporates trade-off among the indices [95,96]. In this way, the normalized sum of each contribution per cell related to services provisioning and the well-functioning clusters were obtained. In the literature, the additive rule has been applied, due to its simplicity, to calculate several indices, e.g., the Environmental Performance Index (EPI) [97], the Information and Communication Technologies Index [98], and the European Innovation Scoreboard (EIS) [99].

3. Results

In this section, two typologies of results are presented referring to the spatial analysis of each indicator and their aggregation in the composite map of landscape multifunctionality.
The description of the 11 spatial indicators is presented below highlighting the reason for selection and the modalities of calculation for each of them, while Figure 8 shows their spatial representation.
Density of accommodation facilities (car01). This indicator identifies the highest concentration of tourism facility points (e.g., hotel, B&B, and guesthouse) through kernel density estimation in a bandwidth of 5 km. The indicator highlights the geographical clusters of significant provision for these services. These facilities are crucial for any strategy oriented toward boosting hospitality in the landscape and, therefore, the indicator value should be maximized. Indeed, the higher the values, the greater the likelihood of hosting people.
Density of food services (car02). This indicator identifies the highest concentration of foodservice points (e.g., restaurants and holiday farms) through kernel density estimation in a bandwidth of 5 km. The indicator was selected with a similar aim to that of car01. However, it was the combined result of in-field research and OpenStreetMap data. This indicator, like the previous one, was maximized since empowering territories to promote local foods and cookery skills can increase the landscapes’ attraction and recreation for tourists.
Uninhabited housing Index (car03). This indicator shows the institutional dataset of census zones with specific information about the state of housing abandonment. Data were aggregated on the MMU by computing the number of abandoned houses per square cell surface.
Housing density (car04). This indicator was drawn from the institutional dataset of census zones and provides information about the housing density. Data were aggregated on the MMU by computing the number of houses per square cell surface. In this case, the index was minimized since a low density represents this type of landscape’s peculiar feature.
Index of accessibility (car05). This indicator shows the network of railways and roads by computing the values through the track per cell’s length. The current transportation system does not guarantee accessibility to some locations, as public transport is scarce or unsuitable for reaching places shaped by a complex landscape morphology. The indicator was maximized.
Ecological integrity index (reg01). This indicator shows the value per cell of the CLC classes according to their ecological integrity, representing the sum of the different contributions of ecosystems providing regulation, provisioning, and cultural services. The scores were derived from the assessment matrix of a land cover type provided by Burkhard et al. (2009) [43] and were placed on each surface of land use per cell, by performing the standardized weighted average to compute the final value. The indicator was maximized, since a high value of ecological integrity means that the landscape provides a large number of services for human well-being and the cultural fruition of nature [39].
Environmental protection index (reg02). This indicator includes the percentage per cell of “Communitarian Interest Sites” (SIC) and “Special Protection Zones” (ZPS). These areas provide a relevant contribution to regulation service maintenance/conservation. Although setting boundaries for these zones does not imply the correct management of natural areas, it can be conceived as the first step for protecting the natural capital of the landscape. From this perspective, this indicator was also maximized.
Density of cultural sites (inf01). This indicator shows the kernel density estimation of cultural sites in a bandwidth of 5 km. The richness of cultural sites with their historical, archaeological, and spiritual values increases the landscape’s capacity to provide learning from social–ecological structures that can be understood as the right mode of interaction between anthropic and natural ecosystems. The indicator conveys the number of significant landscape elements per cell and has to be maximized, similar to the previous indicators.
Index of cultural events (inf02). This indicator highlights the cultural vitality of the examined landscape by identifying the number of cultural events and their type/frequency. This index is an example of an implicitly spatial indicator since it requires processing information derived from surveys and the event location to be represented. The map shows four main clusters in which the events are most consistent, and the kernel density conveys the polarization of the municipalities which offer these services in a bandwidth of 5 km. The indicator was maximized.
Density of most photographed places (inf03). This indicator represents an excerpt of a point pattern, based on a code which identifies the most photographed places by citizens and tourists in the study area. It simulates landscape attractiveness, as citizens or tourists perceive it. The indicator can be conceived as a proxy representing the immaterial value of the landscape (e.g., a beautiful open space, panoramic point, identity-related feature, etc.). The higher the value per cell, the more attractive the landscape.
Mean value of agricultural soils (pro01). This indicator merges specific classes of CLC and the mean value of the soils provided by the institutional dataset of the Italian “Agenzia delle Entrate” (Revenue Agency) [100]. The processing was made the approximated quality of agricultural production explicitly spatial. The higher the value per cell, the higher the quality of soil for provisioning services. The indicator was maximized.
The composite map of the landscape multifunctionality describes the PRP landscape and shows the most suitable zones for pursuing the scenario of Cultural Tourism. It represents the final result of the evaluation process for the territorial development directions of the PRP landscape.
In particular, the output of the ANP identified that a suitable scenario to be implemented is that of Cultural Tourism and provided the weight of each indicator (Table 4, values normalized by indicators). Thanks to the additive aggregation rule described in Section 2.5, the normalized values of indicators were summed, building a spatial index of the multifunctionality of the PRP landscape.
The spatial representation of this index is reported in Figure 9, which presents a multifunctionality map that localizes suitable areas for reaching better landscape function performances if the Cultural Tourism alternative were pursued. The map highlights how much the landscape multifunctionality would be enhanced, and which municipalities would mostly benefit if scenario 1 of Cultural Tourism was pursued.
Since the multifunctionality map was drawn by comparing three scenarios with experts, it could be interesting to open up the discussion to local stakeholders and understand the sensitivity of their perceptions by comparing them with those of the experts.
Indeed, the usefulness of the result concerns the opportunity to open public debate about further scenarios to codesign by visualizing the spatial weights of decisions, in order to improve the comprehension and transparency of the decision-making process at different levels and scales.

4. Discussion

This proposed methodological approach for structuring an SDSS, articulated by the four main phases of Intelligence (i), Design (ii), Choice (iii), and Outcome (iv), contributes to exploring how PSSs can enable improvement of the context knowledge, assessment of the local resources and the development of sustainable development strategies in inland areas, where the conditions of socioeconomic crisis make development processes more difficult.
The Intelligence (i) phase represents a crucial moment of the decision-making process, where the main purpose is oriented to identify objectives and alternatives.
The structuring of the decision problem is strictly related to the available data and the ways in which they can be collected and selected. The type and quality of data represent a relevant issue that can affect the clarification of the objectives and the identification of alternatives. In this phase, an essential role is played by the various stakeholders, who can be involved to identify the potential and criticalities of the territory, but also to recognize the possible resources to become aware of territorial resiliencies, from which transformative regenerative processes can be developed.
The Design (ii) phase is essential for the spatial modeling, the structuring criteria in LS classes (carrier services, regulation services, information services, and provisioning services) and selecting the preference directions (maximize and minimize) in line with the objectives made explicit in the previous phase.
The spatial modeling of the landscape, realized through a spatial grid with regular MMU, represents a way to simplify, make homogeneous, and rationalize the following multicriteria aggregation process, and allows the impacts of the transformation to be shown from a large scale to specific contexts.
Several relevant potentials of SDSS have been related to the representation, the processing, and the analysis of complex data, improving the quality of a decision-making process. Meanwhile, determining a MMU allowed us to make data, which were extracted from various sources and affected by different resolutions and spatial entities, more homogeneous, by combining heterogeneous information on a standard surface and transforming it into normalized indices. Indeed, numerous authors have concluded that there is no optimal landscape composition and configuration that enhances or sustains all LS, but spatial patterns favor specific bundles of LS, e.g., Turner et al. (2013) [101] and Wu (2013) [41]. Therefore, different types of landscapes (providing different sets of LS) may be considered sustainable.
According to this statement, apart from the multifunctional landscape which offers a moderate flow of different LS, landscapes providing a high flow of regulating services and a high flow of agricultural production were distinguished in the study area.
The Choice (iii) phase includes the steps of evaluating alternatives and weighting and combining the spatial weighted overlay and ANP method. The implementation of the ANP method in the GIS environment allowed the transformative landscape resilience to be measured in terms of multifunctionality, by elaborating selected spatial indicators, describing and representing the multidimensional characteristics of the PRP’s inland areas. The use of the ANP method allowed the interaction among different landscape functions to be explored with a group of experts. In this sense, the opportunities for new tourism development of the area were analyzed from a multidisciplinary and interdisciplinary perspective. Moreover, the identification of the weight of the indicators with the collaboration of experts allowed a discussion on the different points of view and a more accurate understanding of the impacts of tourism development on the landscape functions. This experiment proved the potentiality of the ANP method in decision processes relating to landscape transformation, especially if the method is implemented in a constructive way through an interactive approach with experts (as tested in the PRP case) or stakeholders.
The Outcome (iv) phase identifies the priority ranking for the selected criteria and the alternative scenarios. The spatial representation of the ANP outputs provided the GAL Partenio with a composite map able to identify new decision opportunities to be pursued. The map can be also be used to show local communities and stakeholders the different landscape functions for the PRP Cultural Tourism scenario, supporting the negotiation and shared decisions phase on the future development of the area.

5. Conclusions

The spatial decision support system (SDSS) for multifunctionality landscape assessment has aimed to help local actors understand the local resources and multifunctional values of the PRP and surrounding municipalities, stimulating their cooperation in the management of environmental and cultural sites and the codesign of new tourism services.
The increasing interest and diffusion of PSS, and of related geo-referenced data on landscape analysis and evaluation, have led to new opportunities to represent, join, process, and assess spatial information to measure territorial resilience.
From this perspective, the methodological approach was oriented to improve the acknowledgement and awareness of local resources, by defining a proposal of representing and processing the different data types. The elaboration of spatial indicators that are able to describe the landscape’s objective and subjective characteristics, selected and classified according to the LS approach, defines a complex framework where tangible and intangible components interact.
The SDSS supports local resources’ knowledge process, highlighting the potential and critical issues, and makes relationships among them explicit. The composite map of the landscape multifunctionality describes the areas of transformative resilience, where the degree of multifunctionality is the highest. Through the map results, it is possible to represent a geography of values, understand the role of each municipality and identify how a network of synergies can trigger a process of territorial resilience.
The composite map (Figure 9) represents the conclusion of the evaluation process, and the starting point of the decision-making process, as it can be considered the basis for activating a dialogue between decision-makers, stakeholders, and local communities to enhance local resources and promote a transformative territorial network strategy, starting from the site-specific identification of enhancement opportunities.

Author Contributions

The authors jointly conceived and developed the approach and decided on the overall objective and structure of the paper: Conceptualization, M.C., S.P. and G.P.; methodology, M.C., S.P. and G.P.; software, S.P. and G.P.; validation, M.C., S.P. and G.P.; formal analysis, S.P. and G.P.; investigation, S.P. and G.P.; resources, S.P. and G.P.; data curation, S.P. and G.P.; writing—original draft preparation, M.C., S.P. and G.P.; writing—review and editing, M.C., S.P. and G.P.; visualization, S.P. and G.P.; supervision, M.C.; funding acquisition, M.C. All authors have read and agreed to the published version of the manuscript.

Funding

This research received no external funding.

Informed Consent Statement

Informed consent was obtained from all subjects involved in the study.

Data Availability Statement

The data presented in this study are part of Giuliano Poli PhD Thesis, titled A Hybrid Evaluation framework for Multi-functional Landscapes (HEMuL). Theoretical approaches and operative tools for sustainability science, openly available at http://www.fedoa.unina.it/12154/.

Acknowledgments

The authors want to acknowledge the experts that took part in the study. The present work is part of the “Guidelines for the promotion of abandoned mines and the setting of an open-air eco-museum; reception aimed at religious and environmental tourism”, Scientific Research Agreement between the Department of Architecture (DiARC), University of Naples Federico II, and the GAL Partenio, coordinator Maria Rosaria Santangelo. This work only reflects the authors’ views, and the GAL Partenio is not responsible for any use that may be made of the information it contains. The authors would like to thank the interesting suggestions and important comments received from the four anonymous referees, which have allowed them to improve and integrate the paper and to achieve a more significant final result.

Conflicts of Interest

The authors declare no conflict of interest.

References

  1. Bahrami, F.; Hemmati, M. Landscape Resilience, an Examination and Evaluation of Existing Definitions in the Field of Landscape Resilience, a Brief Review of Literature. MANZAR Sci. J. Landsc. 2020, 12, 40–49. [Google Scholar]
  2. Yan, H.; Zhan, J.; Liu, B.; Huang, W.X.; Li, Z. Spatially Explicit Assessment of Ecosystem Resilience: An Approach to Adapt to Climate Changes. Adv. Meteorol. 2014, 2014, 1–9. [Google Scholar] [CrossRef]
  3. Zhang, Y.; Zhou, D.; Li, Z.; Qi, L. Spatial and temporal dynamics of social-ecological resilience in Nepal from 2000 to 2015. Phys. Chem. Earth 2020, A/B/C, 102894. [Google Scholar] [CrossRef]
  4. Elliot, T.B.; Almenar, J.B.; Niza, S.; Proença, V.; Rugani, B. Pathways to Modelling Ecosystem Services within an Urban Metabolism Framework. Sustainability 2019, 11, 2766. [Google Scholar] [CrossRef] [Green Version]
  5. Davoudi, S.; Shaw, K.; Haider, L.K.; Quinlan, A.E.; Peterson, G.D.; Wilkinson, C.; Fünfgeld, H.; McEvoy, D.; Porter, L.; Davoudi, S. Resilience: A Bridging Concept or a Dead End? “Reframing” Resilience: Challenges for Planning Theory and Practice Interacting Traps: Resilience Assessment of a Pasture Management System in Northern Afghanistan Urban Resilience: What Does it Mean in Planning Practice? Resilience as a Useful Concept for Climate Change Adaptation? The Politics of Resilience for Planning: A Cautionary Note. Plan. Theory Pract. 2012, 13, 299–333. [Google Scholar]
  6. Borriello, F.; Carone, P.; Nicolini, E.; Panaro, S. Design and use of a Facebook 4 Urban Facelifts. Int. J. Glob. Environ. Issues 2015, 14, 89–112. [Google Scholar] [CrossRef]
  7. Cerreta, M.; Panaro, S. Deliberative Spatial Multi-Criteria Evaluation (DSM-CE): Forming Shared Cultural Values. In International Conference on Computational Science and Its Applications; Gervasi, O., Murgante, B., Misra, S., Borruso, G., Torre, C.M., Rocha, A.M.A.C., Taniar, D., Apduhan, B.O., Stankova, E., Cuzzocrea, A., Eds.; Springer: Cham, Switzerland, 2017; pp. 747–763. [Google Scholar]
  8. Holling, C.S. Resilience and Stability of Ecological Systems. Annu. Rev. Ecol. Syst. 1973, 4, 1–23. [Google Scholar] [CrossRef] [Green Version]
  9. Beller, E.; Robinson, A.; Grossinger, R.; Grenier, L. Landscape Resilience Framework: Operationalising ecological resilience at the landscape scale. Prep. Google Ecol. Program 2015, 752, 80–92. [Google Scholar]
  10. Holling, C.S.; Gunderson, L.H.; Ludwig, D. Quest of a Theory of Adaptive Change. Panarchy: Understanding Transformations in Human and Natural Systems; Island Press: Washington, DC, USA, 2002; pp. 3–24. [Google Scholar]
  11. Sommerkorn, M.; Cornell, S.; Nilsson, A.E.; Wilkinson, C.; Robards, M.; Vlasova, T.; Quinlan, A. A resilience approach to social ecological systems: Central concepts and concerns. In Arctic Resilience Interim Report 2013; Arctic Council; Stockholm Environment Institute; Stockholm Resilience Centre: Stockholm, SE, USA, 2013; pp. 15–25. [Google Scholar]
  12. European Landscape Convention. Available online: http://www.coe.int/en/web/conventions/full-list/-/conventions/treaty/176 (accessed on 10 October 2020).
  13. Hahn, T.; Nykvist, B. Are adaptations self-organised, autonomous, and harmonious? Assessing the social ecological resilience literature. Ecol. Soc. 2017, 22. [Google Scholar] [CrossRef]
  14. Field, R.D.; Parrott, L. Multi-ecosystem services networks: A new perspective for assessing landscape connectivity and resilience. Ecol. Complex. 2017, 32, 31–41. [Google Scholar] [CrossRef]
  15. Ioja, C.L.; Gradinaru, S.R.; Onose, D.A.; Vanau, G.O.; Tudor, A.C. The potential of school green areas to improve urban green connectivity and multi-functionality. Urban For. Urban Green. 2014, 13, 704–713. [Google Scholar] [CrossRef]
  16. Kienast, F.; Bolliger, J.; Potschin, M.; de Groot, R.S.; Verburg, P.H.; Heller, I.; Wascher, D.; Haines-Young, R. Assessing Landscape Functions with Broad-Scale Environmental Data: Insights Gained from a Prototype Development for Europe. Environ. Manag. 2009, 44, 1099–1120. [Google Scholar] [CrossRef] [PubMed] [Green Version]
  17. Takeuchi, K.; Ichikawa, K.; Elmqvist, T. Satoyama landscape as social–ecological system: Historical changes and future perspective. Curr. Opin. Environ. Sustain. 2016, 19, 30–39. [Google Scholar] [CrossRef]
  18. Carlisle, L. Diversity, flexibility, and the resilience effect: Lessons from a social-ecological case study of diversified farming in the northern Great Plains, USA. Ecol. Soc. 2014, 19, 45. [Google Scholar] [CrossRef] [Green Version]
  19. Rodrigues, R.R.; Martins, S.V.; Gandolfi, S. High Diversity Forest Restoration in Degraded Area Methods & Projects in Brazil, 1st ed.; Nova Science Publishers, Inc: New York, NY, USA, 2007; pp. 27–60. [Google Scholar]
  20. Berkes, F.; Folke, C. Linking Social and Ecological Systems: Management Practices and Social Mechanisms for Building Resilience; Cambridge University Press: Cambridge, UK, 1998; pp. 1–25. [Google Scholar]
  21. Yang, L.; Wang, Y.; Wang, R.; Klemeš, J.J.; de Almeida, C.M.V.B.; Jin, M.; Zeng, X.; Qiao, Y. Environmental-social-economic footprints of consumption and trade in the Asia-Pacific region. Nat. Commun. 2020, 11, 1–9. [Google Scholar] [CrossRef]
  22. Pan, H.; Chen, S.; Gao, Y.; Deal, D.; Liu, J. An urban informatics approach to understanding residential mobility in Metro Chicago Environ. Plann. B Urban Anal. City Sci. 2020, 47, 1456–1473. [Google Scholar] [CrossRef]
  23. Zhang, L.; Cong, C.; Pan, H.; Cai, Z.; Cvetkovic, V.; Deal, B. Socioecological informed comparative modeling to promote sustainable urban policy transitions: Case study in Chicago and Stockholm. J. Clean. Prod. 2021, 281, 125050. [Google Scholar] [CrossRef]
  24. Copeland, S.; Comes, T.; Bach, S.; Nagenborg, M.; Schulte, Y.; Doorn, N. Measuring social resilience: Trade-offs, challenges and opportunities for indicator models in transforming societies. Int. J. Disaster Risk Reduct. 2020, 51, 101799. [Google Scholar] [CrossRef]
  25. Parsons, M.; Glavac, S.; Hastings, P.; Marshall, G.; McGregor, J.; McNeill, J.; Morley, P.; Reeve, I.; Stayner, R. Top-down assessment of disaster resilience: A conceptual framework using coping and adaptive capacities. Int. J. Disaster Risk Reduct. 2016, 19, 1–11. [Google Scholar] [CrossRef] [Green Version]
  26. Cutter, S.L. The landscape of disaster resilience indicators in the USA. Nat. Hazards 2016, 80, 741–758. [Google Scholar] [CrossRef]
  27. Saja, A.M.A.; Goonetilleke, A.; Teo, M.; Ziyath, A.M. A critical review of social resilience assessment frameworks in disaster management. Int. J. Disaster Risk Reduct. 2019, 35, 101096. [Google Scholar] [CrossRef]
  28. Taleb, N.N. Antifragile. In Prosperare nel Disordine; Il Saggiatore: Milan, Italy, 2012. [Google Scholar]
  29. Fanok, L.; Beltran, B.; Burnham, M.; Chloe, B. Wardropper, Visions for large landscape drought resilience in rangelands. Rangelands 2020, in press. [Google Scholar] [CrossRef]
  30. Satyal, P.; Shrestha, K.; Ojha, H.; Vira, B.; Adhikari, J. A new Himalayan crisis? Exploring transformative resilience pathways. Environ. Dev. 2017, 23, 47–56. [Google Scholar] [CrossRef] [Green Version]
  31. Arnall, A. Resilience as transformative capacity: Exploring the quadripartite cycle of structuration in a Mozambican resettlement programme. Geoforum 2015, 66, 26–36. [Google Scholar] [CrossRef]
  32. Stokols, D.; Lejano, R.P.; Hipp, J. Enhancing the Resilience of Human-Environment Systems: A Social Ecological Perspective. Ecol. Soc. 2013, 18. [Google Scholar]
  33. Leach, M.; Rockström, J.; Raskin, P.; Scoones, I.; Stirling, A.C.; Smith, A.; Thompson, J.; Millstone, E.; Ely, A.; Arond, E.; et al. Transforming Innovation for Sustainability. Ecol. Soc. 2012, 17. [Google Scholar] [CrossRef] [Green Version]
  34. Norris, F.H.; Stevens, S.P.; Pfefferbaum, B.; Wyche, K.F.; Pfefferbaum, R.L. Community Resilience as a Metaphor, Theory, Set of Capacities, and Strategy for Disaster Readiness. Am. J. Community Psychol. 2008, 41, 127–150. [Google Scholar] [CrossRef] [PubMed]
  35. Stones, R. Structuration Theory; Macmillan International Higher Education: New York, NY, USA, 2005. [Google Scholar]
  36. Matthews, R.; Selman, P. Landscape as a Focus for Integrating Human and Environmental Processes. J. Agric. Econ. 2006, 57, 199–212. [Google Scholar] [CrossRef]
  37. Cerreta, M.; Mazzarella, C.; Spiezia, M.; Tramontano, M.R. Regenerativescapes: Incremental evaluation for the regeneration of unresolved territories in East Naples. Sustainability 2020, 12, 6975. [Google Scholar] [CrossRef]
  38. Cerreta, M.; Mele, R.; Poli, G. Urban Vulnerability Assessment: Towards a Cross-Scale Spatial Multi-criteria Approach. In Proceedings of International Conference on Computational Science and Its Applications; Springer: Cham, Switzerland, 2018; pp. 502–517. [Google Scholar]
  39. Cerreta, M.; Panaro, S. From perceived values to shared values: A multi-stakeholder spatial decision analysis (M-SSDA) for resilient landscapes. Sustainability 2017, 9, 1113. [Google Scholar] [CrossRef] [Green Version]
  40. Bastian, O.; Krönert, R.; Lipský, Z. Landscape diagnosis on different space and time scales–a challenge for landscape planning. Landsc. Ecol. 2006, 21, 359–374. [Google Scholar] [CrossRef]
  41. Barreto, L.; Ribeiro, M.C.; Veldkamp, A.; van Eupen, M.; Kok, K.; Pontes, E. Exploring effective conservation networks based on multi-scale planning unit analysis. A case study of the Balsas sub-basin, Maranhão State, Brazil. Ecol. Indic. 2010, 10, 1055–1063. [Google Scholar] [CrossRef]
  42. Keenan, P.B.; Jankowski, P. Spatial Decision Support Systems: Three decades on. Decis. Support Syst. 2019, 116, 64–76. [Google Scholar] [CrossRef]
  43. Bastian, O.; Grunewald, K.; Syrbe, R.-U.; Walz, U.; Wende, W. Landscape services: The concept and its practical relevance. Landsc. Ecol. 2014, 29, 1463–1479. [Google Scholar] [CrossRef]
  44. Kato, S.; Ahern, J. Multifunctional landscapes as a basis for sustainable landscape development. J. Jpn. Inst. Landsc. Archit. 2009, 72, 799–804. [Google Scholar] [CrossRef] [Green Version]
  45. Ahern, J.; Cilliers, S.; Niemelä, J. The concept of ecosystem services in adaptive urban planning and design: A framework for supporting innovation. Landsc. Urban Plan. 2014, 125, 254–259. [Google Scholar] [CrossRef] [Green Version]
  46. Termorshuizen, J.W.; Opdam, P. Landscape services as a bridge between landscape ecology and sustainable development. Landsc. Ecol. 2009, 24, 1037–1052. [Google Scholar] [CrossRef]
  47. Ahern, J. Urban landscape sustainability and resilience: The promise and challenges of integrating ecology with urban planning and design. Landsc. Ecol. 2013, 28, 1203–1212. [Google Scholar] [CrossRef]
  48. Hobbs, R.J.; Higgs, E.; Hall, C.M.; Bridgewater, P.; Chapin III, F.S.; Ellis, E.C.; Ewel, J.J.; Hallett, L.M.; Harris, J.; Hulvey, K.B. Managing the whole landscape: Historical, hybrid, and novel ecosystems. Front. Ecol. Environ. 2014, 12, 557–564. [Google Scholar] [CrossRef] [Green Version]
  49. Potschin, M.; Haines-Young, R. “Rio+10”, sustainability science and Landscape Ecology. Landsc. Urban Plan. 2006, 75, 162–174. [Google Scholar] [CrossRef]
  50. de Groot, R. Function-analysis and valuation as a tool to assess land use conflicts in planning for sustainable, multi-functional landscapes. Landsc. Urban Plan. 2006, 75, 175–186. [Google Scholar] [CrossRef]
  51. Vallés-Planells, M.; Galiana, F.; Van Eetvelde, V. A Classification of Landscape Services to Support Local Landscape Planning. Ecol. Soc. 2014, 19. [Google Scholar] [CrossRef] [Green Version]
  52. Costanza, R. Valuing natural capital and ecosystem services toward the goals of efficiency, fairness, and sustainability. Ecosyst. Serv. 2020, 43, 101096. [Google Scholar] [CrossRef]
  53. Wu, J. Landscape sustainability science: Ecosystem services and human well-being in changing landscapes. Landsc. Ecol. 2013, 28, 999–1023. [Google Scholar] [CrossRef]
  54. Elmqvist, T.; Redman, C.L.; Barthel, S.; Costanza, R. History of Urbanization and the Missing Ecology. In Urbanization, Biodiversity and Ecosystem Services: Challenges and Opportunities; Springer: Dordrecht, The Netherlands, 2013; pp. 13–30. [Google Scholar]
  55. Potschin, M.; Haines-Young, R. Defining and measuring ecosystem services. In Routledge Handbook of Ecosystem Services; Potschin, M., Haines-Young, R., Fish, R., Turner, R.K., Eds.; Routledge: London, UK; New York, NY, USA, 2016; pp. 25–44. [Google Scholar]
  56. Burkhard, B.; Kroll, F.; Müller, F.; Windhorst, W. Landscapes’ capacities to provide ecosystem services-a concept for land-cover based assessments. Landsc. Online 2009, 15, 1–22. [Google Scholar] [CrossRef]
  57. Frank, S.; Fürst, C.; Koschke, L.; Makeschin, F. A contribution towards a transfer of the ecosystem service concept to landscape planning using landscape metrics. Ecol. Indic. 2012, 21, 30–38. [Google Scholar] [CrossRef]
  58. Syrbe, R.-U.; Walz, U. Spatial indicators for the assessment of ecosystem services: Providing, benefiting and connecting areas and landscape metrics. Ecol. Indic. 2012, 21, 80–88. [Google Scholar] [CrossRef]
  59. Willemen, L.; Veldkamp, A.; Verburg, P.; Hein, L.; Leemans, R. A multi-scale modelling approach for analysing landscape service dynamics. J. Environ. Manag. 2012, 100, 86–95. [Google Scholar] [CrossRef] [PubMed]
  60. Greco, S.; Figueira, J.; Ehrgott, M. Multiple Criteria Decision Analysis; Springer: New York, NY, USA, 2016. [Google Scholar]
  61. Rolando, D. Multicriteria decision problem structuring: The strategic choice approach in the context of public projects in Italy. Int. J. Multicriteria Decis. Mak. 2015, 5, 4–38. [Google Scholar] [CrossRef]
  62. Battisti, C. Unifying the trans-disciplinary arsenal of project management tools in a single logical framework: Further suggestion for IUCN project cycle development. J. Nat. Conserv. 2018, 41, 63–72. [Google Scholar] [CrossRef]
  63. Foth, M. Handbook of Research on Urban Informatics: The Practice and Promise of the Real-Time City; Information Science Reference: Pittsburgh, PA, USA, 2009. [Google Scholar]
  64. Malczewski, J. GIS-based multi-criteria decision analysis: A survey of the literature. Int. J. Geogr. Inf. Sci. 2006, 20, 703–726. [Google Scholar] [CrossRef]
  65. Bailey, K.; Grossardt, T. Toward structured public involvement: Justice, geography and collaborative geospatial/geovisual decision support systems. Ann. Assoc. Am. Geogr. 2010, 100, 57–86. [Google Scholar] [CrossRef]
  66. Champlin, C.; te Brömmelstroet, M.; Pelzer, P. Tables, Tablets and Flexibility: Evaluating Planning Support System Performance under Different Conditions of Use. Appl. Spatial Analysis 2019, 12, 467–491. [Google Scholar] [CrossRef] [Green Version]
  67. Pérez, M.G.R.; Laprise, M.; Rey, E. Fostering sustainable urban renewal at the neighborhood scale with a spatial decision support system. Sustain. Cities Soc. 2018, 38, 440–451. [Google Scholar] [CrossRef]
  68. Chen, Y.; Yu, J.; Khan, S. Spatial sensitivity analysis of multi-criteria weights in GIS-based land suitability evaluation. Environ. Model. Softw. 2010, 25, 1582–1591. [Google Scholar] [CrossRef]
  69. Cerreta, M.; Poli, G.; Regalbuto, S.; Mazzarella, C. A Multi-dimensional Decision-Making Process for Regenerative Landscapes: A New Harbour for Naples (Italy). In Computational Science and Its Applications—ICCSA 2019; Misra, S., Gervasi, O., Murgante, B., Stankova, E., Korkhov, V., Torre, C., Rocha, A.M.A.C., Taniar, D., Apduhan, B.O., Tarantino, E., Eds.; Springer: Cham, Switzerland, 2019; Volume 11622, pp. 156–170. [Google Scholar]
  70. Woźniak, E.; Kulczyk, S.; Derek, M. From intrinsic to service potential: An approach to assess tourism landscape potential. Landsc. Urban Plan. 2018, 170, 209–220. [Google Scholar] [CrossRef]
  71. Weyland, F.; Laterra, P. Recreation potential assessment at large spatial scales: A method based in the ecosystem services approach and landscape metrics. Ecol. Indic. 2014, 39, 34–43. [Google Scholar] [CrossRef]
  72. Mele, R.; Poli, G. The effectiveness of geographical data in multi-criteria evaluation of landscape services†. Data 2017, 2, 9. [Google Scholar] [CrossRef] [Green Version]
  73. Campagna, M. Social Media Geographic Information: Why social is special when it goes spatial. In European Handbook of Crowdsourced Geographic Information; Capineri, C., Haklay, M., Huang, H., Antoniou, V., Kettunen, J., Ostermann, F., Purves, R., Eds.; Ubiquity Press: London, UK, 2016; pp. 45–54. [Google Scholar]
  74. Cerreta, M.; Panaro, S.; Poli, G. A Knowledge-Based Approach for the Implementation of a SDSS in the Partenio Regional Park (Italy). In Computational Science and Its Applications—ICCSA 2016; Gervasi, O., Murgante, B., Misra, S., Rocha, A.M.A.C., Torre, C.M., Taniar, D., Apduhan, B.O., Stankova, E., Wang, S., Eds.; Springer: Cham, Switzerland, 2016; pp. 111–124. [Google Scholar]
  75. Malczewski, J.; Rinner, C. Multicriteria Decision Analysis in Geographic Information Science; Springer: Berlin, Germany, 2015. [Google Scholar]
  76. Malczewski, J. GIS and Multi-Criteria Decision Analysis; John Wiley & Sons: New York, NY, USA, 1999. [Google Scholar]
  77. Hockings, M.; Stolton, S.; Leverington, F.; Dudley, N.; Courrau, J. Evaluating Effectiveness a Framework for Assessing Management Effectiveness of Protected Areas, IUCN—International Union for Conservation of Nature and Natural Resources, 2nd ed.; IUCN: Gland, Switzerland; Cambridge, UK, 2006. [Google Scholar]
  78. Simon, H.A. The New Science of Management Decision; Prentice Hall PTR: Upper Saddle River, NJ, USA, 1977. [Google Scholar]
  79. Italian National Statistics Institute (ISTAT). Censimento Della Popolazione e Delle Abitazioni (2011). Available online: https://www.istat.it/it/archivio/censimento+popolazione (accessed on 1 January 2018).
  80. GAL Partenio. Available online: https://galpartenio.it/ (accessed on 1 January 2019).
  81. Corine Land Cover. Available online: https://land.copernicus.eu/pan-european/corine-land-cover (accessed on 1 January 2019).
  82. Brookes, C.J. A parameterised region-growing programme for site allocation on raster suitability maps. Int. J. Geogr. Inf. Sci. 1997, 11, 375–396. [Google Scholar] [CrossRef]
  83. Church, R.L.; Gerrard, R.A.; Gilpin, M.; Stine, P. Constructing Cell-Based Habitat Patches Useful in Conservation Planning. Ann. Assoc. Am. Geogr. 2003, 93, 814–827. [Google Scholar] [CrossRef]
  84. Herwijnen, M.v.; Rietveld, P. Spatial Dimensions in Multicriteria Analysis. In Spatial Multicriteria Decision Making and Analysis; Thill, J.C., Ed.; Routledge: London, UK, 1999; pp. 77–101. [Google Scholar]
  85. Antoine, J.; Fischer, G.; Makowski, M. Multiple criteria land use analysis. Appl. Math. Comput. 1997, 83, 195–215. [Google Scholar] [CrossRef] [Green Version]
  86. MacDonald, M.L. A multi-attribute spatial decision support system for solid waste planning. Comput. Environ. Urban Syst. 1996, 20, 1–17. [Google Scholar] [CrossRef]
  87. Goodchild, M.F.; Li, L. Assuring the quality of volunteered geographic information. Spat. Stat. 2012, 1, 110–120. [Google Scholar] [CrossRef]
  88. Spencer, C.J.; Yakymchuk, C.; Ghaznavi, M. Visualising data distributions with kernel density estimation and reduced chi-squared statistic. Geosci. Front. 2017, 8, 1247–1252. [Google Scholar] [CrossRef]
  89. Saaty, T.L. Theory and Applications of the Analytic Network Process: Decision Making with Benefits, Opportunities, Costs, and Risks; RWS Publications: Pittsbourgh, PA, USA, 2005. [Google Scholar]
  90. Saaty, T.L.; Vargas, L.G. Models, Methods, Concepts & Applications of the Analytic Hierarchy Process; Springer Science & Business Media: Berlin, Germany, 2012; p. 175. [Google Scholar]
  91. Ishizaka, A.; Nemery, P. Multi-Criteria Decision Analysis: Methods and Software; John Wiley & Sons: Hoboken, NJ, USA, 2013. [Google Scholar]
  92. Cerreta, M.; Cannatella, D.; Sposito, S.; Poli, G. Climate Change and Transformability Scenario Evaluation for Venice (Italy) Port-City Through ANP Method. In Computational Science and Its Applications—ICCSA 2015; Gervasi, O., Murgante, B., Misra, S., Gavrilova, M.L., Rocha, A.M.A.C., Torre, C., Taniar, D., Apduhan, B.O., Eds.; Springer: Cham, Switzerland, 2015; Volume 9158, pp. 50–63. [Google Scholar]
  93. Attardi, R.; Canta, A.; Torre, C.M. Urban design, institutional context and decision-making process. two cases of waterfront regeneration in Apulia (Italy). BDC Bollettino Del Centro Calza Bini 2014, 14, 129–143. [Google Scholar]
  94. Lombardi, P.; Lami, I.M.; Bottero, M.; Grasso, C. Application of the Analytic Network Process and the Multi-modal framework to an urban upgrading case study. In Proceedings of the International Conference on Whole Life Urban Sustainability and its Assessment, Glasgow, UK, 27–29 June 2007; pp. 27–29. [Google Scholar]
  95. Gan, X.; Fernandez, I.C.; Guo, J.; Wilson, M.; Zhao, Y.; Zhou, B.; Wu, J. When to use what: Methods for weighting and aggregating sustainability indicators. Ecol. Indic. 2017, 81, 491–502. [Google Scholar] [CrossRef]
  96. Handbook on Constructing Composite Indicators: Methodology and User Guide. Available online: https://www.oecd.org/els/soc/handbookonconstructingcompositeindicatorsmethodologyanduserguide.htm (accessed on 1 December 2020).
  97. Esty, D.C.; Emerson, J.W. Yale’s Environmental Performance Index and the rise of data-driven policymaking. In Routledge Handbook of Sustainability Indicators; Routledge: New York, NY, USA, 2018. [Google Scholar]
  98. Fagerberg, J. Europe at the crossroads: The challenge from innovation-based growth. Glob. Learn. Econ. 2002, 45–60. [Google Scholar]
  99. European Innovation Scoreboard 2018: Europe must Deepen its Innovation Edge. Available online: https://ec.europa.eu/growth/content/european-innovation-scoreboard-2018-europe-must-deepen-its-innovation-edge_en (accessed on 1 December 2020).
  100. Italian Revenue Agency. Banca dati Delle Quotazioni Immobiliari. Available online: https://wwwt.agenziaentrate.gov.it/servizi/Consultazione/risultato.php (accessed on 1 January 2018).
  101. Turner, M.G.; Donato, D.C.; Romme, W.H. Consequences of spatial heterogeneity for ecosystem services in changing forest landscapes: Priorities for future research. Landsc. Ecol. 2013, 28, 1081–1097. [Google Scholar] [CrossRef]
Figure 1. The methodological framework of a spatial decision support system (SDSS) for the Partenio Regional Park (PRP).
Sustainability 13 02748 g001
Figure 2. The territorial background of the study area.
Sustainability 13 02748 g002
Figure 3. The study area: Gruppo di Azione Locale (GAL) Partenio.
Sustainability 13 02748 g003
Figure 4. The Corine Land Cover classification.
Sustainability 13 02748 g004
Figure 5. The methodological workflow of the design phase.
Sustainability 13 02748 g005
Figure 6. The spatial modeling of different shape features compounded in the dataset of the PRP.
Sustainability 13 02748 g006
Figure 7. A graphical representation of the ANP network with interfactorial dependencies among nodes and clusters.
Sustainability 13 02748 g007
Figure 8. The 11 spatial indicators.
Sustainability 13 02748 g008
Figure 9. Composite map of the landscape multifunctionality.
Sustainability 13 02748 g009
Table 1. The spatial indicators of landscape functions for the PRP.
Criteria—Landscape FunctionsSpatial Indicators Preference Direction (pf)ID
CarrierDensity of accommodation facilities+Car01
Density of food services+Car02
Uninhabited housing indexCar03
Housing densityCar04
Index of accessibility+Car05
RegulationEcological integrity index+Reg01
Environmental protection index+Reg02
InformationDensity of cultural sites+Inf01
Index of cultural events+Inf02
Density of most photographed places+Inf03
ProvisioningMean value of agricultural soils+Pro01
Table 2. The weighted super-matrix.
A0A1A2Car
01
Car
02
Car
03
Car
04
Car
05
GOALInf
01
Inf
02
Inf
03
Pro
01
Reg
01
Reg
02
A00000.040.050.080.400.0100.080.070.060.150.070.08
A10000.330.310.240.110.2100.660.690.460.650.230.24
A20000.120.120.660.480.0900.240.230.460.180.690.66
Car01000000000.03000000
Car02000000000.04000000
Car03000000000.02000000
Car04000000000.02000000
Car05000000000.11000000
GOAL000000000000000
Inf0100000.50000.330.11000000
Inf02000000000.11000000
Inf03000000000.02000000
Pro010000.5000000.25000000
Reg0100000000.050.12000000
Table 3. The limiting super-matrix.
A0A1A2Car
01
Car
02
Car
03
Car
04
Car
05
GOALInf
01
Inf
02
Inf
03
Pro
01
Reg
01
Reg
02
A00000.080.060.080.400.040.050.080.070.060.150.070.08
A10000.440.430.240.110.310.240.660.690.460.650.230.24
A20000.140.160.660.480.240.170.240.230.460.180.690.66
Car01000000000.01000000
Car02000000000.02000000
Car03000000000.01000000
Car04000000000.01000000
Car05000000000.05000000
Inf0100000.33000.200.08000000
Inf02000000000.05000000
Inf03000000000.01000000
Pro010000.3300000.12000000
Reg0100000000.030.06000000
Table 4. The priority ranking of the “Analytic Network Process” (ANP).
Scenario/IndicatorsNormalized by ClusterLimitingNormalized by Indicators
Scenario 00.111140.05256-
Scenario 10.510430.24138-
Scenario 20.378430.17896-
car010.130180.015390.029
car020.186060.0220.042
car030.118990.014070.027
car040.114210.01350.026
car050.450560.053270.101
inf010.561260.082490.157
inf020.365620.053740.102
inf030.073130.010750.020
pro01100.0000.125920.239
reg010.456470.062070.118
reg020.543530.073910.140
Publisher’s Note: MDPI stays neutral with regard to jurisdictional claims in published maps and institutional affiliations.

