1. Introduction
Transportation is vital for economic activities and the residents’ daily lives, as it facilitates the movement of goods and people, thus it boosts the economy [
1]. One of the significant issues in the transportation field is travel demand analysis and forecasting [
2]. This matter, therefore, receives special attention in academic and applied transportation planning [
3]. Developing the public transportation system in a city reduces congestion and pollution (air and noise) due to the reduction of private cars when it reaches the point where the citizens start relying on public transportation instead of using personal vehicles [
4]. The car accident rate most likely also decreases [
5].
The development and the improvement of public transportation positively impacts the economy of the city and the country. For example, the impacts on travel time/cost, access, and spending affects the income positively. Both public transport passengers and private car users save time and cost by the developed transit service and by the enhanced business productivity. Moreover, a well-developed public transportation system creates job opportunities and improved access to business districts, and capital investment and operations spending boost the general economy [
6].
The bus service quality’s main factors are service mobility and accessibility, number of bus lines and service frequency, hours of operation, and service reliability. The design of efficient improvements requires us to model the service users’ attitude and satisfaction by considering the perceived quality resulting from users’ personal experience and the expected change, which determines what the users would desire from an efficient public transport service [
7].
Different methods are widely used in assessing urban transport infrastructure. For instance, [
8] contributed to a better understanding of public transport quality that is most likely to attract car users to use public transportation instead of cars to reach sustainability in the transportation sector, consequently decreasing the pollution and other negative consequences of using private cars. Ref. [
9] evaluated the main public transportation criteria, including comfort, punctuality, price, and directness, to attract more users to use public transportation (PT) to contribute to the city’s sustainability. Ref. [
10] analyzed citizens’ preferences to determine what is perceived as a convenient distance for the public to improve public transportation in Calgary, Canada.
Similarly, Ref. [
11] evaluated the importance of services’ physical elements on passenger satisfaction in the public transport sector. Ref. [
12] assessed the quality of public transportation services. Taking a different perspective, Ref. [
13] pointed out the particular elements influencing public transit passengers’ behavioral intentions using a structural equation model for describing customer satisfaction. The authors also analyzed the passenger perception of electronic transport service quality. Ref. [
14] stated that a lack of satisfaction at a particular stage would affect negatively the customer perception of the consequent service stage in a multistage passenger transportation sequence. Customer demand and satisfaction could also be approached as a decision problem [
15]. Multi-criteria decision-making (MCDM) techniques are widely used to support decision-makers in finding the best solution for their decision problems in many sectors, for example, in logistic, industrial, and public transport sectors. For instance, Ref. [
16] conducted a comparative study of Technique of Order Preference Similarity to the Ideal Solution (TOPSIS), VIKOR, COPRAS, and PROMETHEE II approaches to benchmark selected multi-criteria decision analysis (MCDA) methods.
This matter is more important for complex issues such as the development of an urban public transportation system. Accordingly, many scholars have been using MCDM techniques to facilitate the decision-making process and to enhance its accuracy and reliability. MCDM techniques, and the analytic network process (ANP) in particular, have been widely used to reveal the relationships among the evaluation criteria in several studies in different fields. For example, Ref. [
17] utilized the analytic hierarchy process (AHP) in a public transportation project in Japan to support policymakers in improving the public transportation system. Ref. [
18] deployed the AHP method to evaluate transport demand in Amman by conducting a hierarchal based questionnaire. Ref. [
19] selected the AHP approach to examine pedestrian crossings’ safety affected by multiple factors and infrastructure characteristics of vehicle and pedestrian traffic levels. Ref. [
20] applied a group decision-making process to early-stage evaluations of infrastructure projects and used the results to evaluate the transportation infrastructure projects’ effectiveness. In addition, Ref. [
21] combined AHP and Kendall rank correlation for a consensual model that examines the agreement between three different groups (passengers, non-passengers, and government representatives) according to the hierarchical supply quality model to point out potential amelioration axes for a public transport network in a Turkish city, Mersin.
However, complex problems usually encompass several criteria and sub-criteria at different levels and input information from various sources [
22]. Although the AHP offers an exquisite method for analyzing decisions, some scholars believe that its results are largely influenced by expert opinion [
23]. As the classical AHP cannot deal with inherent uncertainty, it cannot provide appropriate solutions for decision-makers. Therefore, several studies have aimed to optimize the AHP by integrating it with various mathematical theories and calculations [
24]. Ref. [
25] involved AHP in an integrated methodology to evaluate public transportation operations because implementing a simple list of innovations was futile. They found that it was crucial to rank various contributing factors in their importance for improving the public transportation system and showed which service criteria were most relevant and essential to improve the public transportation system. Ref. [
26] constructed a fuzzy decision-making technique to determine the most suitable public transportation mode to access the international Sari Airport. They integrated fuzzy-AHP with TOPSIS approach. Their results indicated that a train system was the most appropriate solution for the examined transport problem. Ref. [
27] combined fuzzy-AHP and interval-AHP to create consensus among different stakeholders in transport. For the objective of reducing the uncertainty of non-expert evaluators, the authors deployed fuzzy-AHP approach to support government decision makers to highlight the expected supply quality services that could increase public transport users [
28].
Many researchers have adopted the AHP in a fuzzy environment to avoid the ambiguity and the uncertainty caused by the evaluators. The fuzzy-AHP also has been applied in several studies to solve transport problems such as customer experience and efficiency [
29,
30,
31,
32]. Researchers have discussed how MCDM can handle uncertainty, for instance, Ref. [
33] introduced several aggregation operators in the framework of q-rung orthopair fuzzy numbers (q-ROFNs), its support representing vague information that occurs in real situations, while [
34] presented stochastic optimization techniques and the characteristic object’s method (COMET) to solve the challenge when new decision-making variants emerge. In addition, [
35] conducted a new approach to assist the decision-making in uncertain environments.
In their research, [
36] deployed a fuzzy-AHP approach to evaluate transit systems’ overall performance across different urbanized areas (UZAs) in the United States of America. The UZAs were categorized into six peer groups based on population to identify high performing UZAs; this approach is less suitable for identifying the weakest performers. [
37] utilized the AHP approach to define the relevant criteria for the systematic technique to evaluate and prioritize multiple candidates for public transport investment to serve the travel demand while considering the current public’s state transportation system and the road network conditions of Isfahan, Iran.
The grey number approach is a concept from grey theory proposed by Deng 1982 [
38] with the objective to deal with insufficient incomplete information. The grey set’s main advantage compared to the fuzzy sets is the reduced complexity of the calculation process and the benefit of generating more robust outcomes.
The grey system compares several uncertain system models [
39]. We took advantage of grey-AHP in this study to overcome the associated uncertainty of the AHP in weighing and ranking the criteria using citizens’ preferences. Many researchers currently combine the advantages of grey theory and AHP approaches to ensure accuracy and objectivity of weight coefficients such as Çelikbilek [
23] and Moslem and Çelikbilek [
40].
The crisp numbers also have lower computational complexity than fuzzy numbers. Scholars from different fields have used the grey-AHP to study, analyze, and solve various real-world decision problems. For example, in Tehran, [
41] examined the risks and the hazards associated with an urban railway system using grey-AHP to identify the existing dangers and prioritize the risks to identify appropriate actions to reduce probability and severity thereof. In China, Ref. [
42] highlighted the strength of grey-AHP in overcoming the conventional AHP evaluation for crime prevention by proposing a practical evaluation approach that combines the benefits of the AHP and a grey clustering method to ensure accuracy and objectivity of weight coefficients.
In this paper, the grey-AHP approach is adopted to cope with the associated uncertainty of AHP in weighing and ranking the criteria using the passengers’ preferences to identify solutions for public transport supply quality in Amman.
Public travel demand is considered as the aggregation of decision-makers’ preferences related to the journey’s quality and price. It must be emphasized that this approach has a priori advantages and shortcomings compared to the traditional models. Besides, the motivations of travel, just as activity-based applications, are not detected. However, MCDM modeling has significant benefits for demand modeling. Applying the proposed methodology makes it possible to gain more reliable information on users’ attitudes toward public bus transportation quality and fare factors. We evaluated service elements and user expressed preferences for improvements, including the fare, which indirectly reflect the travel demand and thus support strategic decisions related to increasing this demand. Grey-AHP provides a clear overview of the decision (demand) elements, thus it is well-applicable in questionnaire-based passenger surveys.
2. Materials and Methods
In this section, first we introduce the public transport situation of the case study, Amman city in Jordan. There is a current problem in the city, as the number of car accidents has been increasing over the past few years in Amman following the government’s decision in past years to lift its subsidies on fuel and periodically revise fuel prices in Jordan to reflect worldwide market prices. The city’s growing unplanned populated area has reduced public transportation quality, and accessibility increased traffic jams and weakened the inadequate public transport systems. In 2008, inflation and the government’s decision to lift its subsidies on fuel reduced public transportation quality and accessibility in the city [
43].
The fleet of public transport in the national capital consists of littler vehicles operated by either freelance operators or small firms. The fleet consists of buses, minibusses (or coasters), jitneys (fixed-route taxis), and regular cabs.
Table 1 presents an overview of the fleet composition, showing the number of vehicles, operators, and routes per vehicle type. As shown in
Table 1, there is a large proportion of usual (yellow) taxis in Amman. These taxis are considered cheap and are often used by commuters, which is far less common in many other cities worldwide.
Table 1 also shows that the jitneys area unit runs on an associate degree owner-operator basis.
To support transport development decisions, the well-known AHP approach was created to deal with complex service attributes by converting them into a hierarchical structure and rating the criteria and the alternatives [
45]. The classic version of AHP, which was created by Saaty 1990 [
46], has been applied by several authors in the transportation field to evaluate and select the best solution for various problems [
24,
47]. However, for our case, the classical AHP did not seem satisfactory due to the high risk of receiving vague responses from citizens during the evaluation process. Instead of selecting any of the fuzzy type AHP models, after a negotiation with the decision makers, we decided to apply grey-AHP. The advantages of the grey set compared to the fuzzy sets is the reduced complexity of the calculation process and that it generates more robust outcomes.
The hierarchy tree establishes pairwise comparison matrices (PCMs) among the four main criteria in the first level and 24 sub-criteria in the following groups. The hierarchy has been conducted according to Saaty approach [
48]. After collecting the required data, the geometric mean technique was used to aggregate the evaluators’ responses (as Saaty suggests for avoiding rank reversal), and then the final scores were computed and prioritized. We carried out a consistency check to ensure the quality and the trustworthiness of the collected data following the consistency ratio measure of AHP. Mathematical concept for the grey theory was borrowed from [
49], which was developed to deal with uncertain conditions and insufficient information.
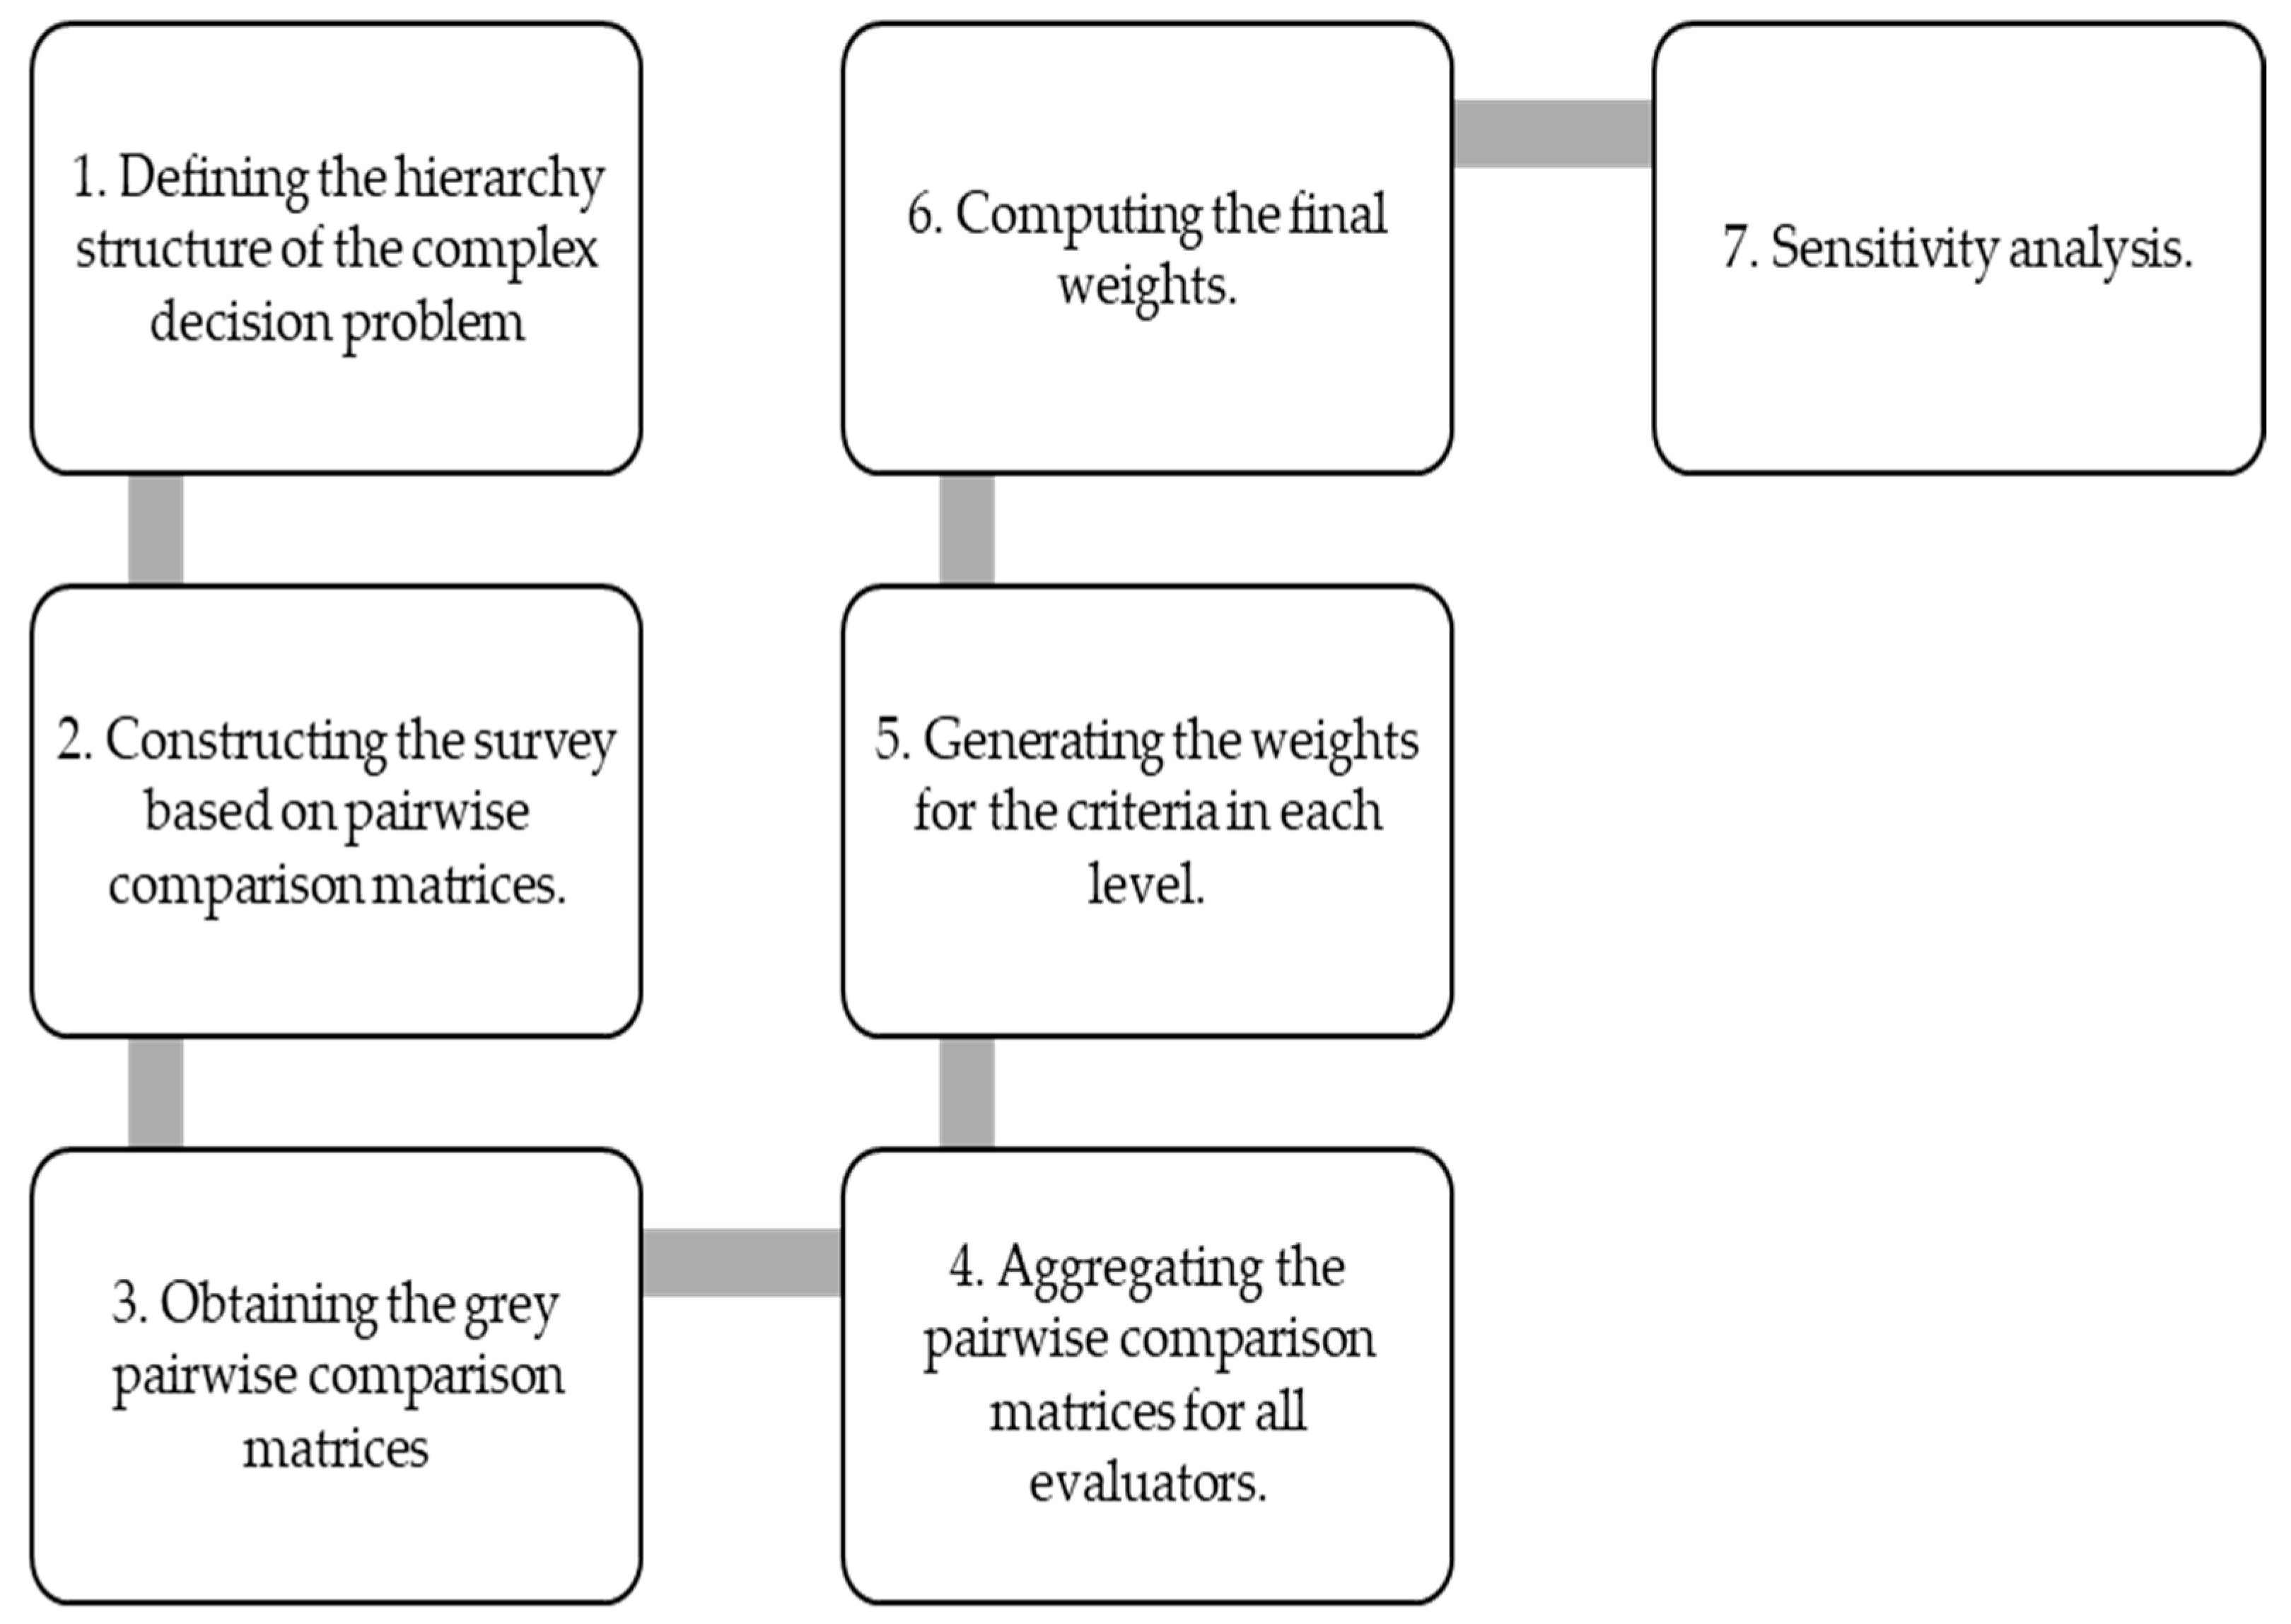
We conducted a grey logic approach in the form of a questionnaire survey with a greyscale. The following equations were applied to compute the newly created integrative decision model. The following steps illustrate the calculation process (
Figure 1).
Step 1: Defining the complex decision problem’s hierarchy structure In the first step, the main criteria and the sub-criteria have to be defined to structure the hierarchy.
Step 2: Constructing the survey based on PCMs. In this step, the PCMs must be prepared considering all main and sub-criteria.
Step 3: Obtaining the grey PCMs. The evaluator has to estimate all constructed PCMs using the greyscale instead of Saaty’s classic scale. The following matrix represents the largest PCM in our case study, including five criteria of public transport supply quality, which is the most intricate matrix in the study:
where
h is the number of evaluators, and
,
are the grey values,
when
. The following formula shows the relationship between elements in the PCM:
Step 4: Aggregating the pairwise comparison matrices for all evaluators, the scores for each PCM are obtained using the geometric mean:
Step 5: Generating the weights for all criteria. The criteria weight in each level can be computed using the eigenvector technique by implementing the following equation:
where
is maximum eigenvalue in the
matrix, and
is the weight eigenvector. In this step, the grey numbers are converted to crisp numbers (
Table 2) [
50].
Step 6: Computing the final weights. The calculations are conducted concerning the p6revious level.
The test of consistency was done by using the following formula:
where
n is the of rank of the judging matrix. When the degree of consistency (
CR) < 0.1, then the judging matrix has satisfying consistency. Otherwise, it should be adjusted to obtain the satisfying consistency.
Amman, the capital city of Jordan, has a rapidly growing population due to natural growth and the country’s political circumstances [
51]. For instance, the government recently received a massive influx of people from Syria because of the civil war. Consequently, proper public transportation is needed to guarantee a livable city for citizens.
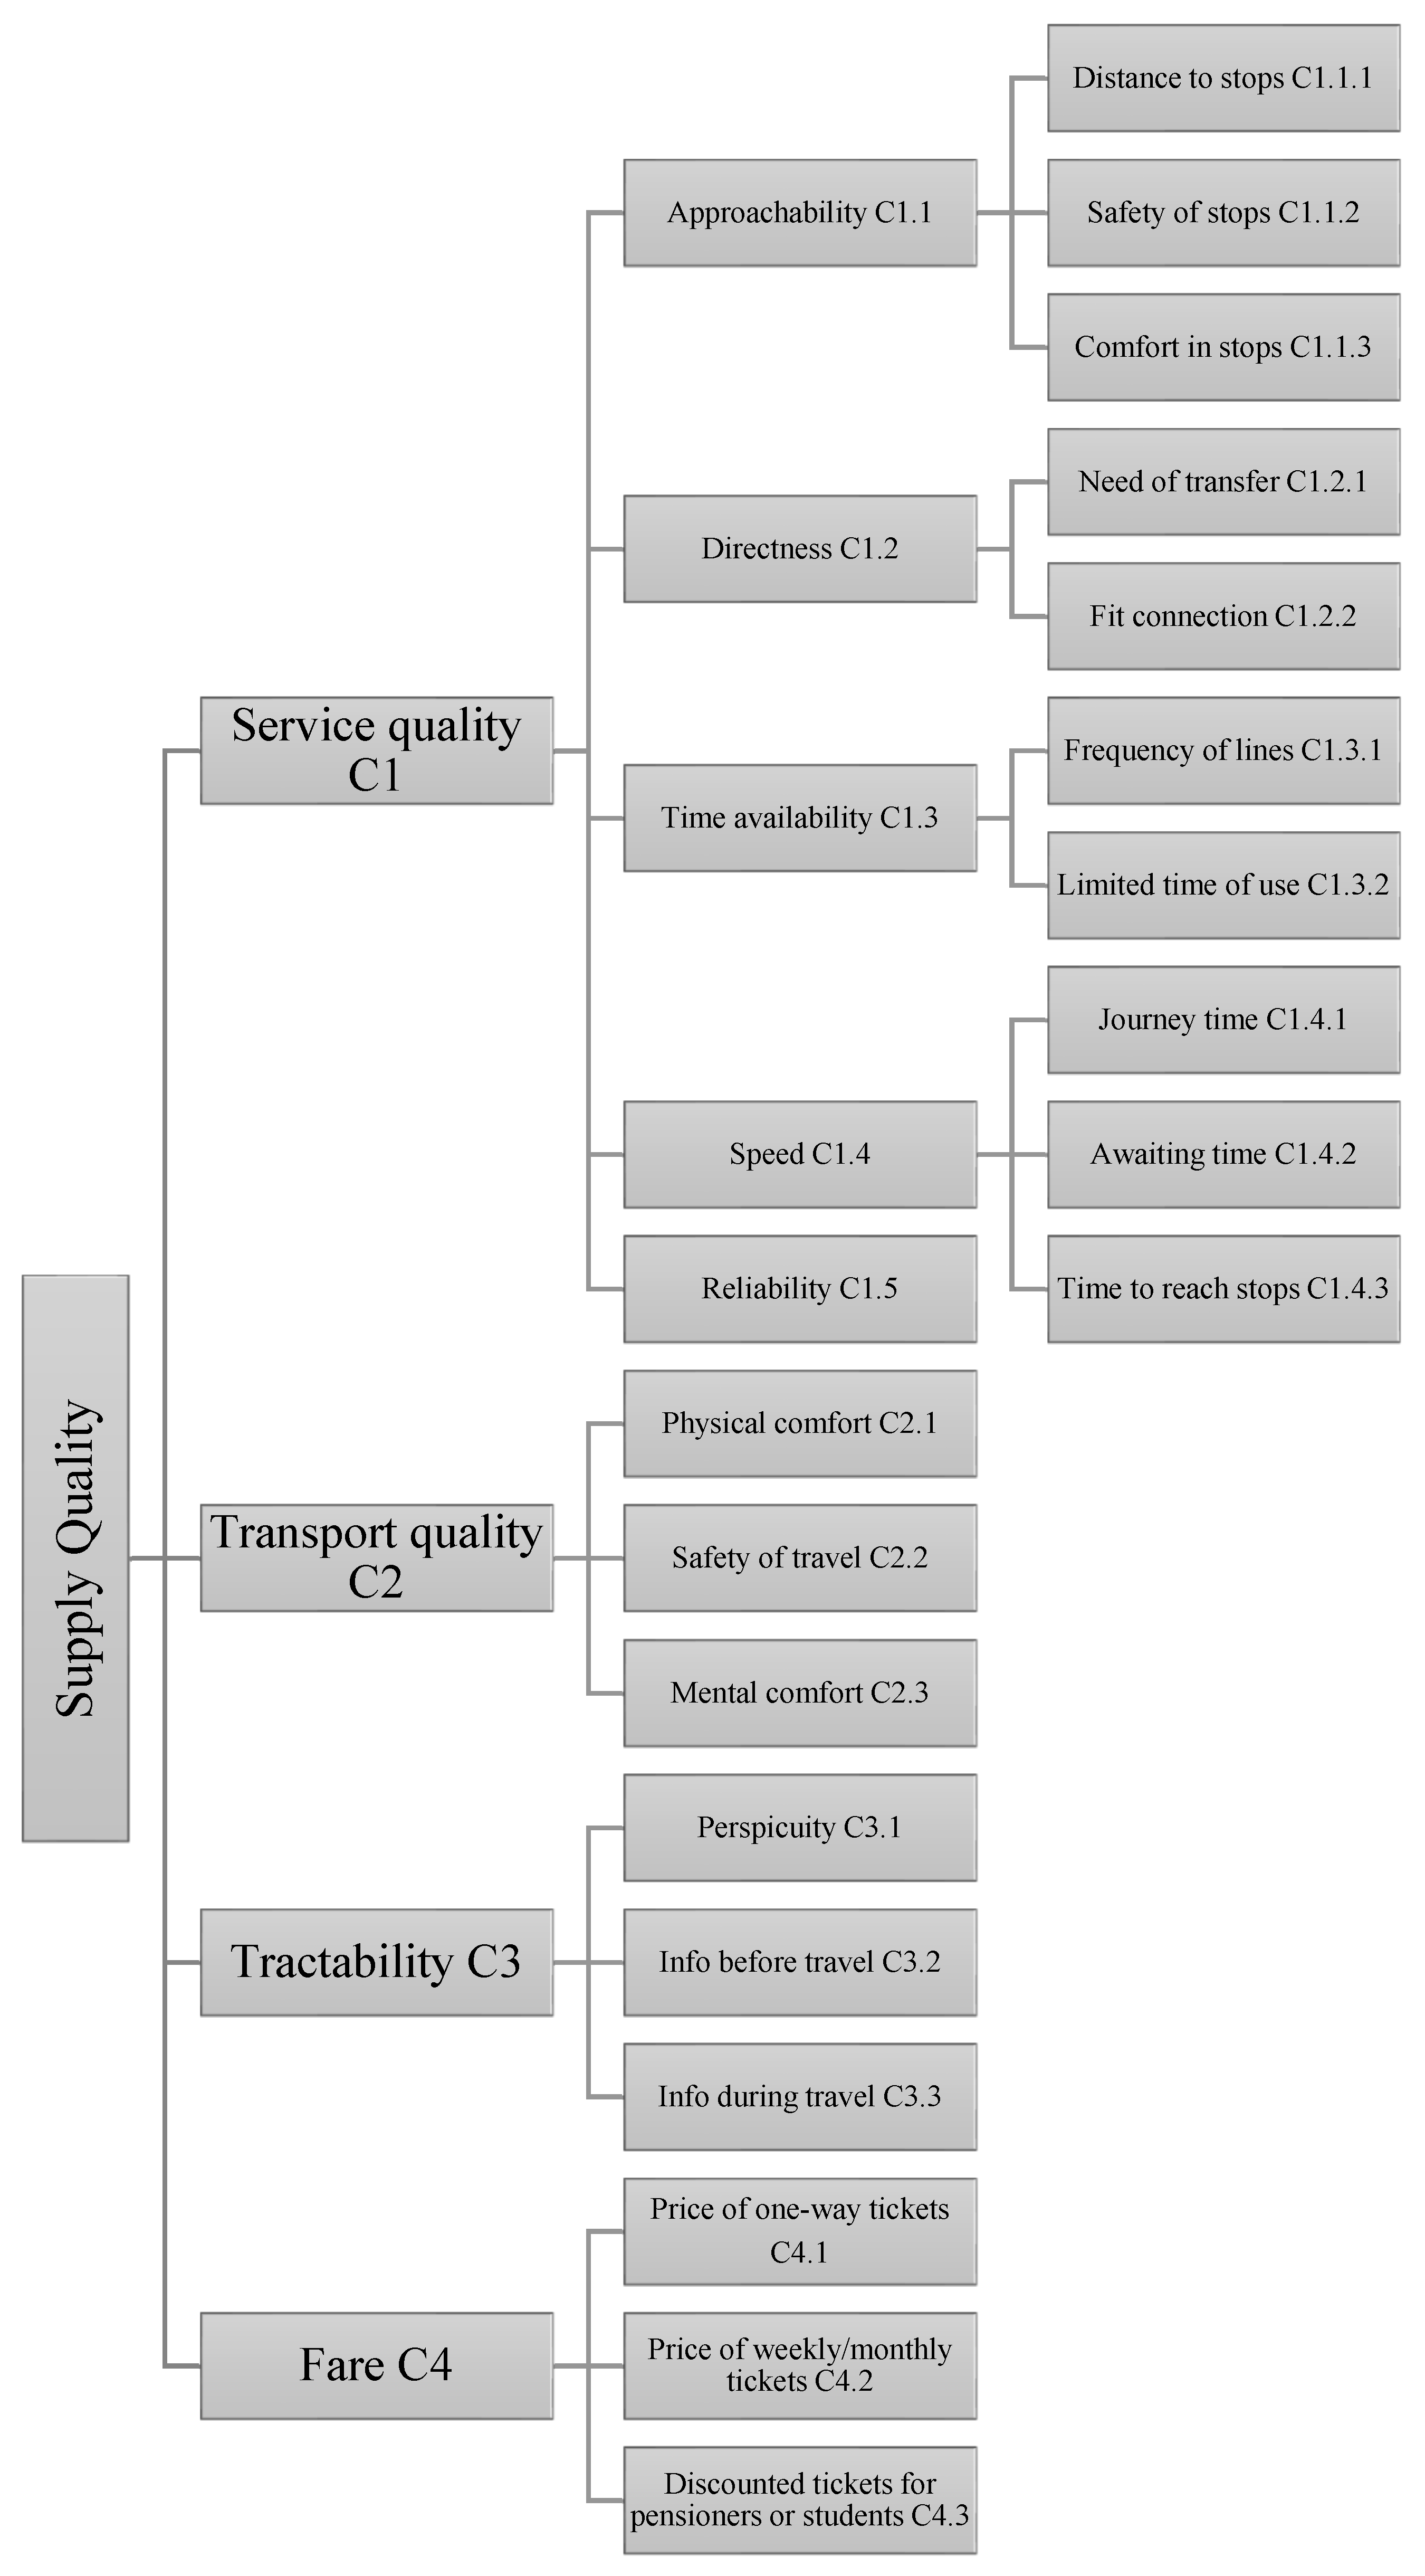
We held focus group discussions during this research to develop a model that may ascertain the stakeholders’ preferences, shown in
Figure 2. A field survey was then conducted to gather the stakeholders’ preferences. In total, 220 participants were involved in the study throughout January 2020.
The participants were randomly chosen from public transport users (employees, school students, university students, workers) without a gender or age group bias. The bus stations of Al Bayader, Sweileh, Al-Abdali, South of Amman, Abu Nsair, Al Jubeiha, and Al-Mahatah were included in the survey to have as many responses as possible from different public transport stations. In total, 95 women and 125 men of other age groups participated in the survey. The required time to complete the study was 19 to 24 min for young passengers and 27 to 31 min for old passengers.
Altogether, 28 attributes of travel demand (as shown in
Figure 2) were assessed to examine stakeholders’ preferences and attitudes towards public bus transport quality.
The hierarchical structure of the criteria demonstrates the survey process. The evaluators must make pair-wise comparisons between the criteria in the same branch of the decision criteria tree. Participants must compare pairs of criteria to determine the importance of service quality, transport quality, tractability, and fare on the first level for all possible pairs. The degree of consistency (CR) was checked for all pairwise comparison matrices, however, we only considered the consistent judging matrices in our study, where all examined responses were acceptable (CR < 0.1).
As final step, a sensitivity analysis was conducted to check the robustness of the results. In this phase, the impact of modifying the score of a level 1 element was analyzed in terms of rank reversal of the lower criteria. We considered the results robust if a slight increase or decrease did not cause change in ranking of the lower attributes.
The typical comparison question is: How much more important is public transport’s service quality than the transport quality? The entire survey follows the same principle.
Table 3 demonstrates the definition of the criteria that was included and analyzed in the study.
4. Discussion
In this analysis, all the scores reflect the current situation of the examined transportation system. The survey questions targeted the evaluation of different travel demand elements in a pairwise comparison related to development. From travel demand perspective, a significant issue is the service quality of travel. However, in this situation, as shown in the table of scores (
Table 4), the service quality was only ranked third in the prioritization of first level elements. Even though the tickets’ price was only ranked second on the first level, the possible discounted tickets element was in second place on the second level. Note that, in AHP, the influence of the higher level criteria was significant on the connected lower level elements, consequently, in the lower levels, a component of the final score was originated from the linked higher level attribute.
Consequently, in the examined case study, greater utilization of public transport did not depend on general service improvements. An increase in public transport travel could be reached by improving transport quality elements, mainly travel safety (the highest-ranked level 2 element). On the third level, an increase in the bus lines travel frequency seemed to be the best option to make public transport more attractive. Users and potential users indicated that more frequent lines are required (a thorough examination of which specific lines should be more frequent). More attention should be paid to the connection between buses or buses and trains. The waiting times were also criticized, and this issue is a direct consequence of the low frequency of lines and the inefficient connections within the urban transport network. The fact that night buses are not available was also criticized.
A previous traditional AHP analysis has been conducted by Alkhrabsheh et al. [
18] to evaluate the supply quality of public transportation of Amman, Jordan, and the transport quality criterion was reported to be of the highest importance in the first level, which is the same rank identified in our study. Both studies identified tractability as being the least important criterion. The service quality criterion was identified as being the second most important criterion in our study. However, this criterion was ranked third by [
17] in their research. Ref. [
52] adopted the best–worst method to estimate the public transport service quality in Amman, Jordan, and the ranking of the main criteria in the first level was the same as in our study, while there were some differences in the second and the third levels. This similarity can be considered as evidence for the robustness of the new proposed methodology.
Based on the obtained results from the grey-AHP model, the most urgently needed improvement to the public transport quality is the safety of travel on public vehicles. Proper training of public bus drivers and regular maintenance of the buses could be efficient measures to implement. It is also advisable to reconsider the city’s road safety regulations, implement regular pavement maintenance of the road, and build exclusive lanes for the public buses. Decision-makers are also advised to revise the urban lines’ schedules because the passengers criticized both the frequency and the times of available services, as the frequency and the times seem to be the most urgent requirements of public transport users. The government is advised to modify the current timetables and conduct a cost–benefit analysis on lines that could be more frequent or increase specific routes’ daily operating period.
The issue of fares can be improved by providing discounted tickets. The local government should consider introducing lower priced tickets (possibly weekly or monthly tickets) for specific groups of society to attract more people to public transport. Improvements would further decrease the number of private cars on the roads. Moreover, some other aspects can be also considered, such as the conflicting interests of stakeholders, their characteristics and priorities related to the public transportation [
53], and the changes before and during COVID-19 that could be detected [
54,
55]. Moreover, the real demand of different users group has to be highlighted [
56,
57,
58].
However, results clearly show the capability of the applied grey-AHP model of providing the possibility for an in-depth analysis supporting the public transport development decisions. The criteria and the survey method can be applied to arbitrary transport development problems even without any modifications.
5. Conclusions
In contrast to the traditional transport demand analysis methods, the introduced grey-AHP model can solve intricate problems in uncertain conditions, which makes it a very effective technique. Moreover, the grey-AHP model provided more information on passenger preferences’ specific elements, including the current fare. As a limitation, however, we mention that only a small group of passengers were involved in the presented survey.
The methodology of grey-based applications for the amelioration of public transport supply quality systems is limited to grey relational analysis, a method under grey systems theory. Our study proved the applicability of other grey-based multi-criteria methodologies for estimating the supply quality of public transport in an integrated manner. The presented approach was applied for Amman city to demonstrate its effectiveness and applicability.
Some limitations were identified in the current research. First, more real data surveys should be conducted with more potentially non-efficient experiential matrices. From an application point of view, it must be emphasized that the difference between grey-AHP and AHP values is small in this Amman case study.
As a general conclusion we recommend that transport quality should be improved according to the analyzed results. Officials are recommended to start tackling the transportation problem in the city by considering transport quality improvements. In level 2, “Safety of Travel” is the priority for passengers to improved. For instance, the operator must increase the regular maintenance for public buses. The municipality must introduce extensive training for bus drivers to enhance the perceived safety of the passengers. For level 3, the frequency of lines criterion is the key to be improved. As this criterion will increase the public buses’ reliability in the city, deploying more buses and rescheduling the timetable is needed.
Our results showed that the grey-AHP model was successful. Since not all the evaluators were fully aware of the importance of proportions in the pairwise comparisons, more flexible numbers helped in gaining a more trustworthy scoring and ranking. The grey-AHP approach can be suggested for all decision support cases in which nonprofessional participants evaluate the decision structure elements, particularly when pairwise comparisons are applied, as shown by our survey results. The grey-AHP method is a tool to acquire public’s opinion related to the quality and the fare system development of the current public bus transport system in the examined city. The model, the survey procedure, and the analysis can be applied to arbitrary urban areas. Transport development initiatives for collecting the data reflecting the preferences of the citizens are required. The intricate decision-making process can then be guided straightforwardly using the grey-AHP model, even if the evaluators have no experience in the field. However, it is highly recommended to hold focus group decision meetings with the evaluators to raise their awareness and evaluate the project properly. For further study, the integration of grey theory with other MCDM techniques (e.g., the analytic network process) can be a promising area for interested researchers.


