Article

Advancing Sustainable Development and Protected Area Management with Social Media-Based Tourism Data

1
Natural Capital Project, Woods Institute for the Environment, Stanford University, Stanford, CA 94305, USA
2
School of Environmental and Forest Sciences, University of Washington, Seattle, WA 98195, USA
3
Puget Sound Partnership, Olympia, WA 98501, USA
4
Nature & Health, University of Washington, Seattle, WA 98195, USA
5
Center for Ocean Solutions, Stanford University, Stanford, CA 94305, USA
*
Author to whom correspondence should be addressed.
Sustainability 2021, 13(5), 2427; https://doi.org/10.3390/su13052427
Submission received: 8 January 2021 / Revised: 13 February 2021 / Accepted: 15 February 2021 / Published: 24 February 2021
(This article belongs to the Special Issue Nature-Based Tourism, Protected Areas, and Sustainability)

Abstract

:
Sustainable tourism involves increasingly attracting visitors while preserving the natural capital of a destination for future generations. To foster tourism while protecting sensitive environments, coastal managers, tourism operators, and other decision-makers benefit from information about where tourists go and which aspects of the natural and built environment draw them to particular locations. Yet this information is often lacking at management-relevant scales and in remote places. We tested and applied methods using social media as data on tourism in The Bahamas. We found that visitation, as measured by numbers of geolocated photographs, is well correlated with counts of visitors from entrance surveys for islands and parks. Using this relationship, we predicted nearly 4 K visitor-days to the network of Bahamian marine protected areas annually, with visitation varying more than 20-fold between the most and least visited parks. Next, to understand spatial patterns of tourism for sustainable development, we combined social media-based data with entrance surveys for Andros, the largest island in The Bahamas. We estimated that tourists spend 125 K visitor-nights and more than US$45 M in the most highly visited district, five times that of the least visited district. We also found that tourists prefer accessible, natural landscapes—such as reefs near lodges—that can be reached by air, roads, and ferries. The results of our study are being used to inform development and conservation decisions, such as where to invest in infrastructure for visitor access and accommodation, siting new marine protected areas, and management of established protected areas. Our work provides an important example of how to leverage social media as a source of data to inform strategies that encourage tourism, while conserving the environments that draw visitors to a destination in the first place.

1. Introduction

Tourism is essential for economic development in many countries around the world, but it can degrade the very ecosystems that draw visitors in the first place [1,2,3]. In the Caribbean, tourism is particularly important for economic growth and employment. The World Travel and Tourism Council estimates that tourism generated $56.4 B in USD—about 14.9% of GDP—in 2016 and provided 2.3 M jobs. The unique natural environment of the Caribbean continues to be one of the region’s biggest draws for visitors. Coral reefs, mangrove forests, beaches, and blue holes attract millions of international tourists every year and support local communities [4,5,6,7,8,9]. However, tourism activities can exacerbate ecological stressors on these vulnerable ecosystems. Coral reefs are threatened by warming waters and coastal run-off, as well as breakage from SCUBA divers and anchors [10,11,12]. Blue holes, beaches, mangrove forests, and coastal marshes suffer from unchecked use by visitors, which results in trampling, pollution, erosion, and the introduction of invasive species [13,14,15]. The combination of a rapid influx of tourists and little regulation of ecosystem-associated tourist activities, like diving, snorkeling, and recreational fishing, has caused ecological damage [15].
Caribbean countries are not alone. Around the world, policy-makers, tourism operators, coastal planners, and other stakeholders acknowledge that tourism sustainability includes increasingly attracting visitors and generating profits, while bolstering local livelihoods, and protecting the natural environment and cultural heritage of a destination [16,17,18]. A major challenge to achieving sustainability is the availability of practical tools and data needed to inform tourism policy and decision-making [19]. In this context, the United Nations World Tourism Organization has explored the potential for big data, in addition to traditional sources, to improve tourism statistics [20]. A growing body of academic literature is also investigating the potential of data from mobile phones and social media to advance spatial analysis of tourism patterns [16,21,22], yet demonstrations are needed that illustrate how new data technologies can be leveraged to inform different decision contexts and planning processes.
To foster tourism while ensuring the long-term viability of coastal systems, countries throughout the Caribbean are engaging in sustainable development and protected area planning [23,24]. These coastal management efforts require information about visitation to be effective [23,24]. For example, sustainable tourism development involves understanding what makes a destination attractive [25], where to site new infrastructure to support tourism, how to provide access and accommodation for tourists while ensuring the long-term sustainability of a destination, where to invest in training programs for local businesses and communities [17], and where to enforce regulations and monitor protected areas. These kinds of management issues require spatial data on visitation and an understanding of what features of the natural and built environment draw tourists [16,19]. Integrated planning also benefits from estimates of visitation that are meaningful and easy to communicate with stakeholders and decision-makers [23,26,27], such as numbers of days that tourists visit particular locations, tourism expenditures, and tourism-related employment. Baseline data on spatial patterns of visitation, expenditure, livelihoods, and visitor preferences inform resource allocation and effective management of commonly visited areas. Such visitation data will especially be important for informing and encouraging tourism as the industry seeks to recover from the COVID-19 pandemic [21] without degrading sensitive ecosystems [5,16,28].
Some of the information needed for sustainable tourism development is currently available in the surveys collected by national governments within tourism departments. Many countries in the Caribbean track numbers of foreign tourists entering their countries [29]. Airport entrance surveys, for example, allow countries to estimate visitation and track changes through time. Some countries also survey tourists to ask why they are visiting (e.g., for business or pleasure) and in certain cases what activities they will engage in (e.g., SCUBA diving, beach-going). However, these surveys typically do not collect information at fine enough spatial scales to inform decisions about how to manage these activities or the ecosystems that support them in specific locations. Detailed data about where visitors go, how much they spend, and why they visit particular locations are frequently lacking in the literature and communities of practice, especially in remote areas, at the scales required to inform spatial planning [16,21,22,30,31,32].
Recent technological advancements and the widespread use of mobile phones and the internet are generating opportunities for understanding patterns of visitation in remote places at finer spatial scales [33]. Social media platforms such as Flickr, Twitter, and Instagram allow users to share geolocated photos about a person’s location at a particular time [19,22,34,35,36]. These data sources are being used to explore visitor preferences for wildlife [28,37] and other aspects of nature [38,39], to estimate the value of ecosystems, such as coral reefs for tourism [5], to predict visitors’ responses to marginal improvements in water quality [40], and to assess tourism sustainability (see ref [19] and references within). Many of these studies approximate the popularity of destinations based on the number of social media posts that are shared from the same location. Studies comparing the number of geotagged photographs and visitation as measured by other approaches, such as on-site counts, find that the two measures are correlated for various types of destinations, including lakes, forests, and parks, globally [35,39,40,41,42]. However, there have been few studies that evaluate these approaches for tropical marine destinations or provide real-world examples of how big data are being used to inform coastal development and marine protected area (MPA) planning.
Here we test and apply methods for using social media to map visitation by tourists and use the information to inform protected area management and sustainable tourism in The Bahamas. The objectives of our study are to (1) explore the potential for social media to estimate visitation to marine and coastal areas, (2) use social media-based visitation data in combination with open-source software to produce practical information to support tourism sustainability, and (3) highlight two examples of coastal management—MPA planning and sustainable development—where this information is being applied to sustainable tourism. To address these objectives, we conduct several analyses combining social media-based visitation data with more traditional on-site visitor counts (Supplementary Figure S1). We first evaluate whether geotagged photographs can be used to estimate visitation rates within MPAs, based on information gathered from across the Caribbean. Next, we use the resulting approaches to quantify visitation across the network of Bahamian MPAs and visitation and expenditures across the largest island in the country, Andros. Finally, we ask what factors influence spatial patterns of visitation on Andros and explore the implications for the country’s tourism development. Tourism is vital to The Bahamas, drawing more than six million tourists annually [43,44]. The Bahamian government is also engaged in several integrated management efforts across the country’s archipelago, which make it a ripe place for testing and applying new approaches for tracking visitation [45]. However, the relevance of our study goes beyond The Bahamas and the Caribbean. The types of results generated in this study have the potential to inform protected area management and sustainable development in coastal and marine environments around the world.

2. Materials and Methods

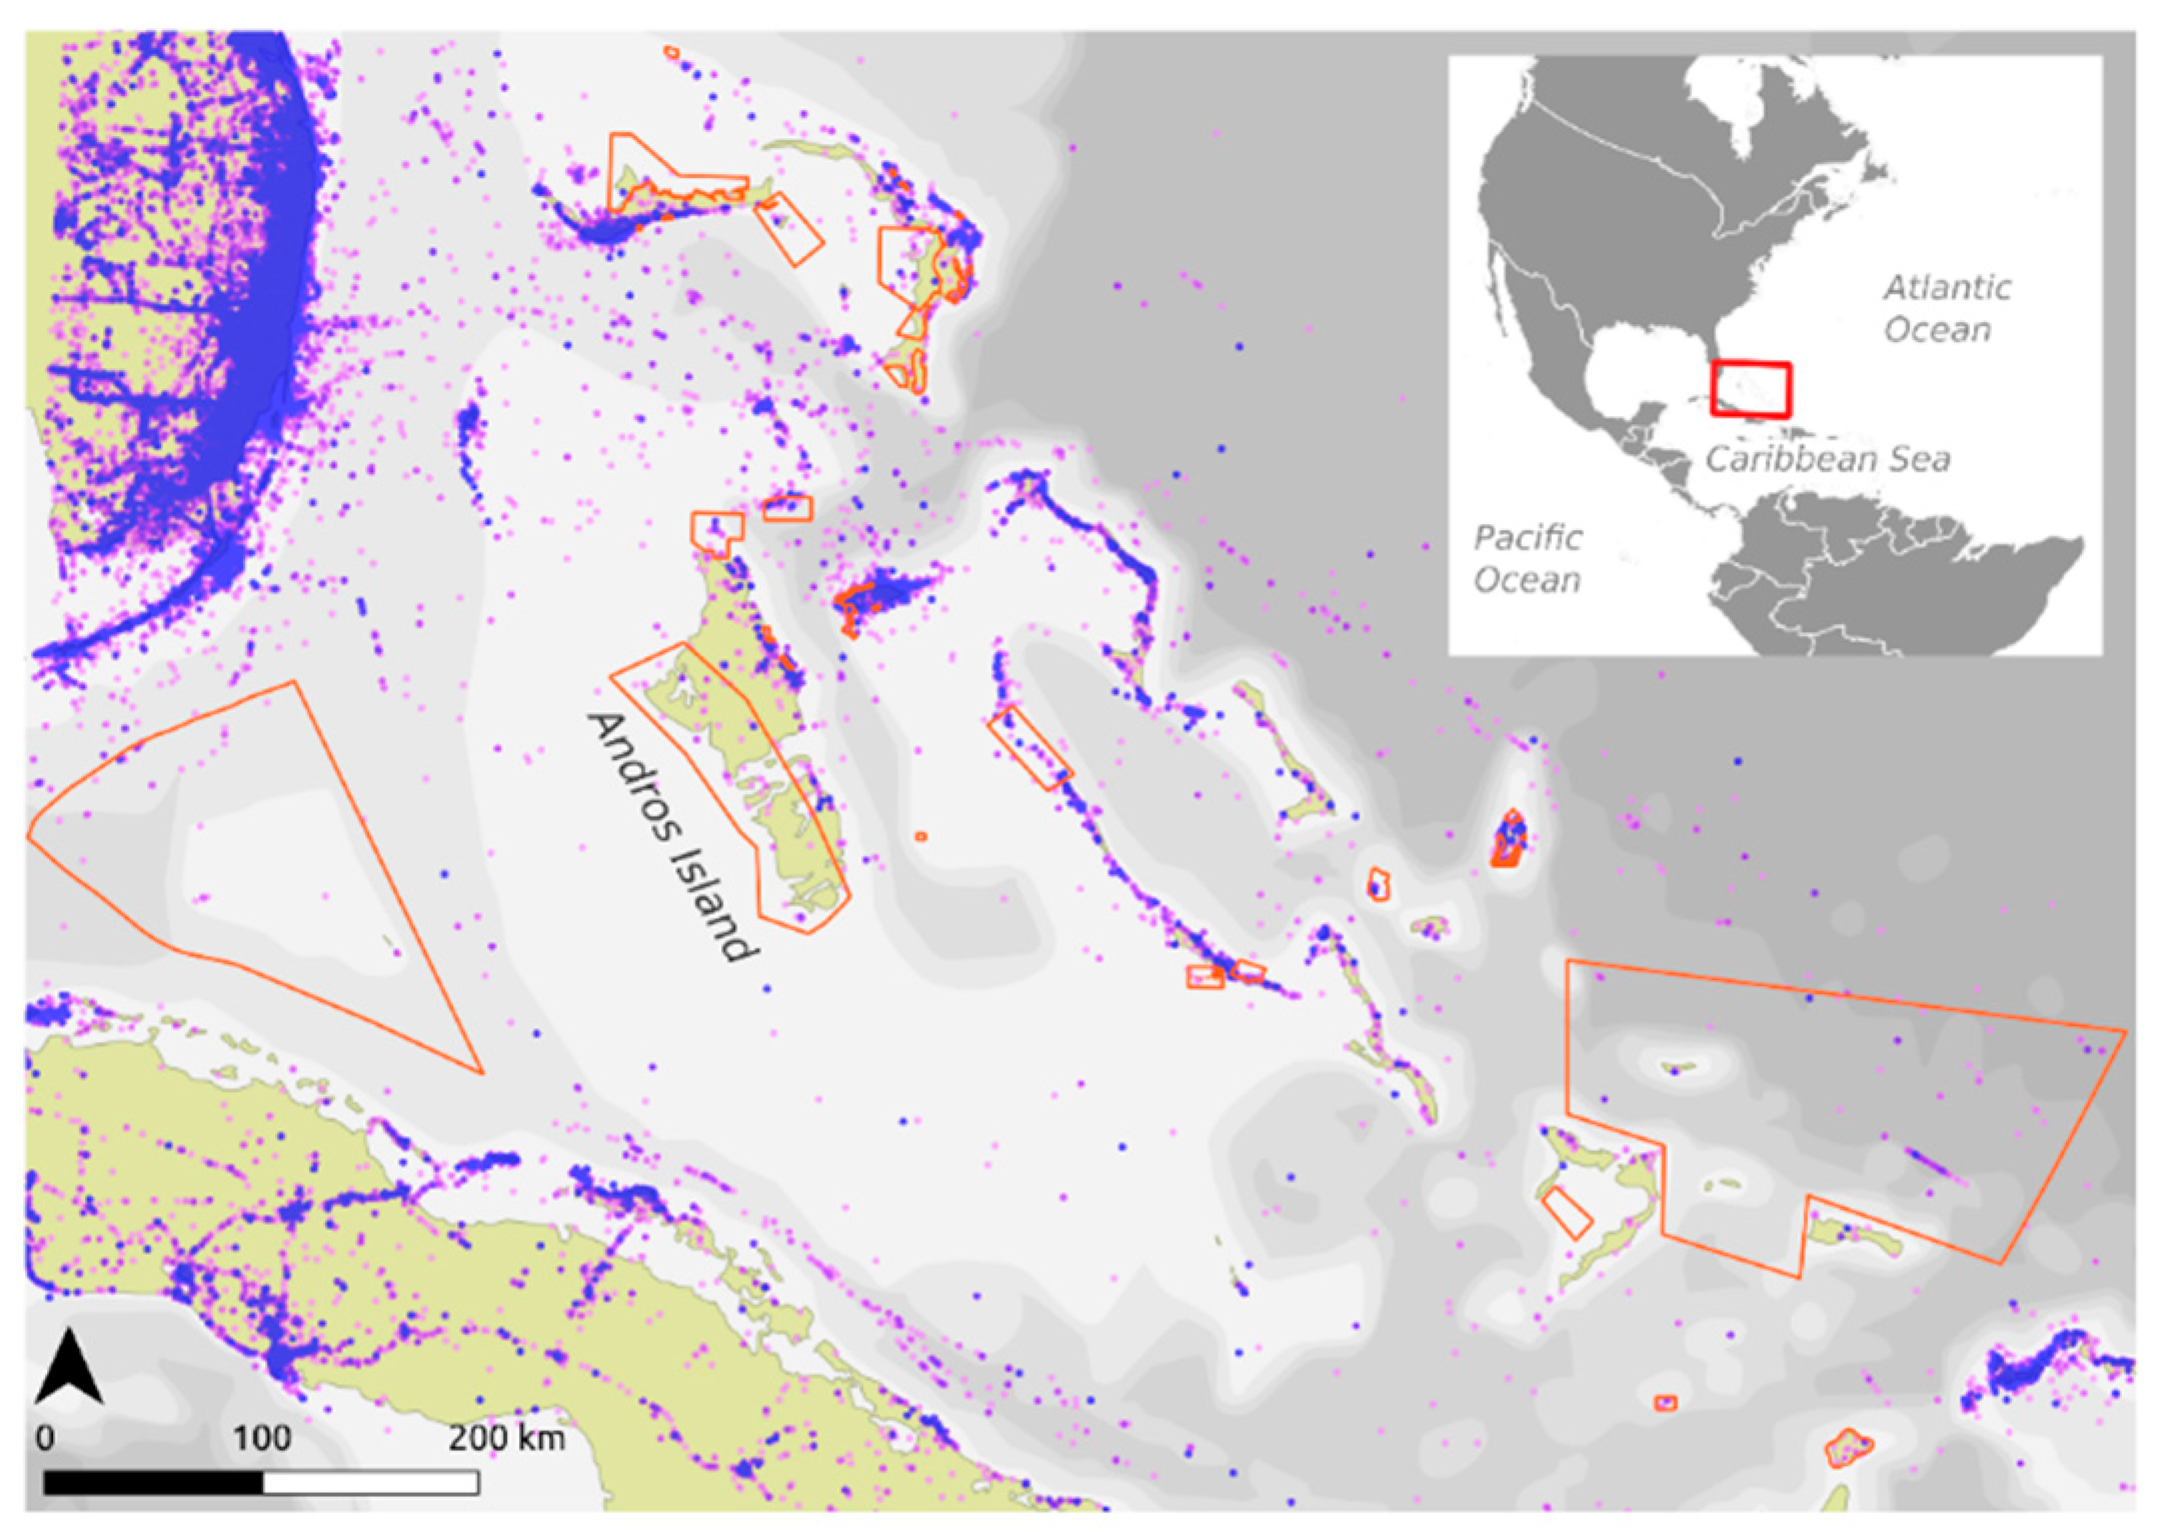
2.1. Study Setting and Existing Planning Efforts

The Bahamas is an archipelago of some 700 islands, cays, and islets that stretches across more than 650,000 km2 of open ocean (Figure 1). The entirety of the country’s population, nearly 400,000 people, live and work within the coastal zone [46]. Marine and coastal ecosystems in The Bahamas provide numerous benefits to the Bahamian people along with habitat to a diversity of animals and plants [47,48,49]. These benefits include protection from coastal hazards [50], commercial and subsistence fisheries [51,52,53,54], carbon storage and sequestration [55], and especially attractions that draw tourists [6,7,8,9]. For example, thousands of miles of beach, barrier, and fringing reefs, and the highest density of blue holes in the world attract millions of tourists each year [56]. The tourism industry alone contributes to over 60% of The Bahamas GDP [43,44] and supports nearly half of the Bahamian workforce [43]. While tourism is critical to the economy and human wellbeing, tourism-related activities such as coastal development (e.g., for hotels and other amenities), dredging (e.g., to improve boat access), and pollution (e.g., litter and coastal run-off) also pose risks to the sensitive environments that people visit [45,57,58].
To protect coastal and marine ecosystems, The Government of The Bahamas is collaborating with several national and international non-governmental organizations including The Nature Conservancy and The Bahamas Reef Environment Educational Foundation (BREEF) on several integrated management initiatives. These efforts include the Caribbean Challenge Initiative (CCI), which is a regional agenda involving governments from ten other countries and territories who, in addition to The Bahamas, committed to protecting and effectively managing 20% of marine and coastal ecosystems in their respective countries by 2020. While 10% of nearshore and marine environments are currently within the Bahamian MPA network, only a few of the 43 parks have finalized management plans. To meet its CCI target and capitalize on the benefits of well-managed MPAs, The Bahamas is expanding its existing network of MPAs and seeking to enhance management of existing protected areas (Figure 1). Additionally, a goal of the initiative is to site and manage MPAs—based not only on their ecological importance, but also on the value of ecosystems within the network to Bahamians for supporting livelihoods through tourism. However, most of the 43 MPAs lack on-site visitor counts, which makes it difficult to know the extent to which visitors are using different MPAs and to make the case for investment in MPAs for tourism development. Thus, an objective of this study was to leverage social media to generate quantitative information on spatial variation in visitation across the network.
Another effort is Vision 2040, the national development planning process, under which Andros was the first island to design a sustainable development master plan. Though Andros is the largest island in The Bahamas (Figure 1) and the fifth-largest in the Caribbean, it is also relatively unpopulated, with less than 8 K permanent residents [59]. The island contains abundant and diverse natural resources [8,48], yet minimal infrastructure and accessibility may contribute to a limited number of tourists choosing Andros as their destination within The Bahamas. Through the Andros Sustainable Development Master Plan, Androsians and The Bahamian government sought to create a roadmap for development that would improve economic opportunity while safeguarding the natural systems that underpin residents’ cultural identity and well-being. A key knowledge gap in this planning effort was spatial data on visitation across Andros and guidance about where to target investment in conservation and development to support the sustainable tourism.
To inform management of tourism activities within the Bahamian MPA network and across Andros Island, we tackled three main research questions. (1) What is the potential for social media (Figure 1) to provide data on visitation and expenditure information in regions with little survey-based data, and at appropriate scales for management? (2) How do visitation, and other metrics of tourism, such as expenditure and employment in nature-based tourism, vary spatially across the Bahamian network of MPAs and across Andros? (3) What factors influence spatial patterns of tourism across Andros?

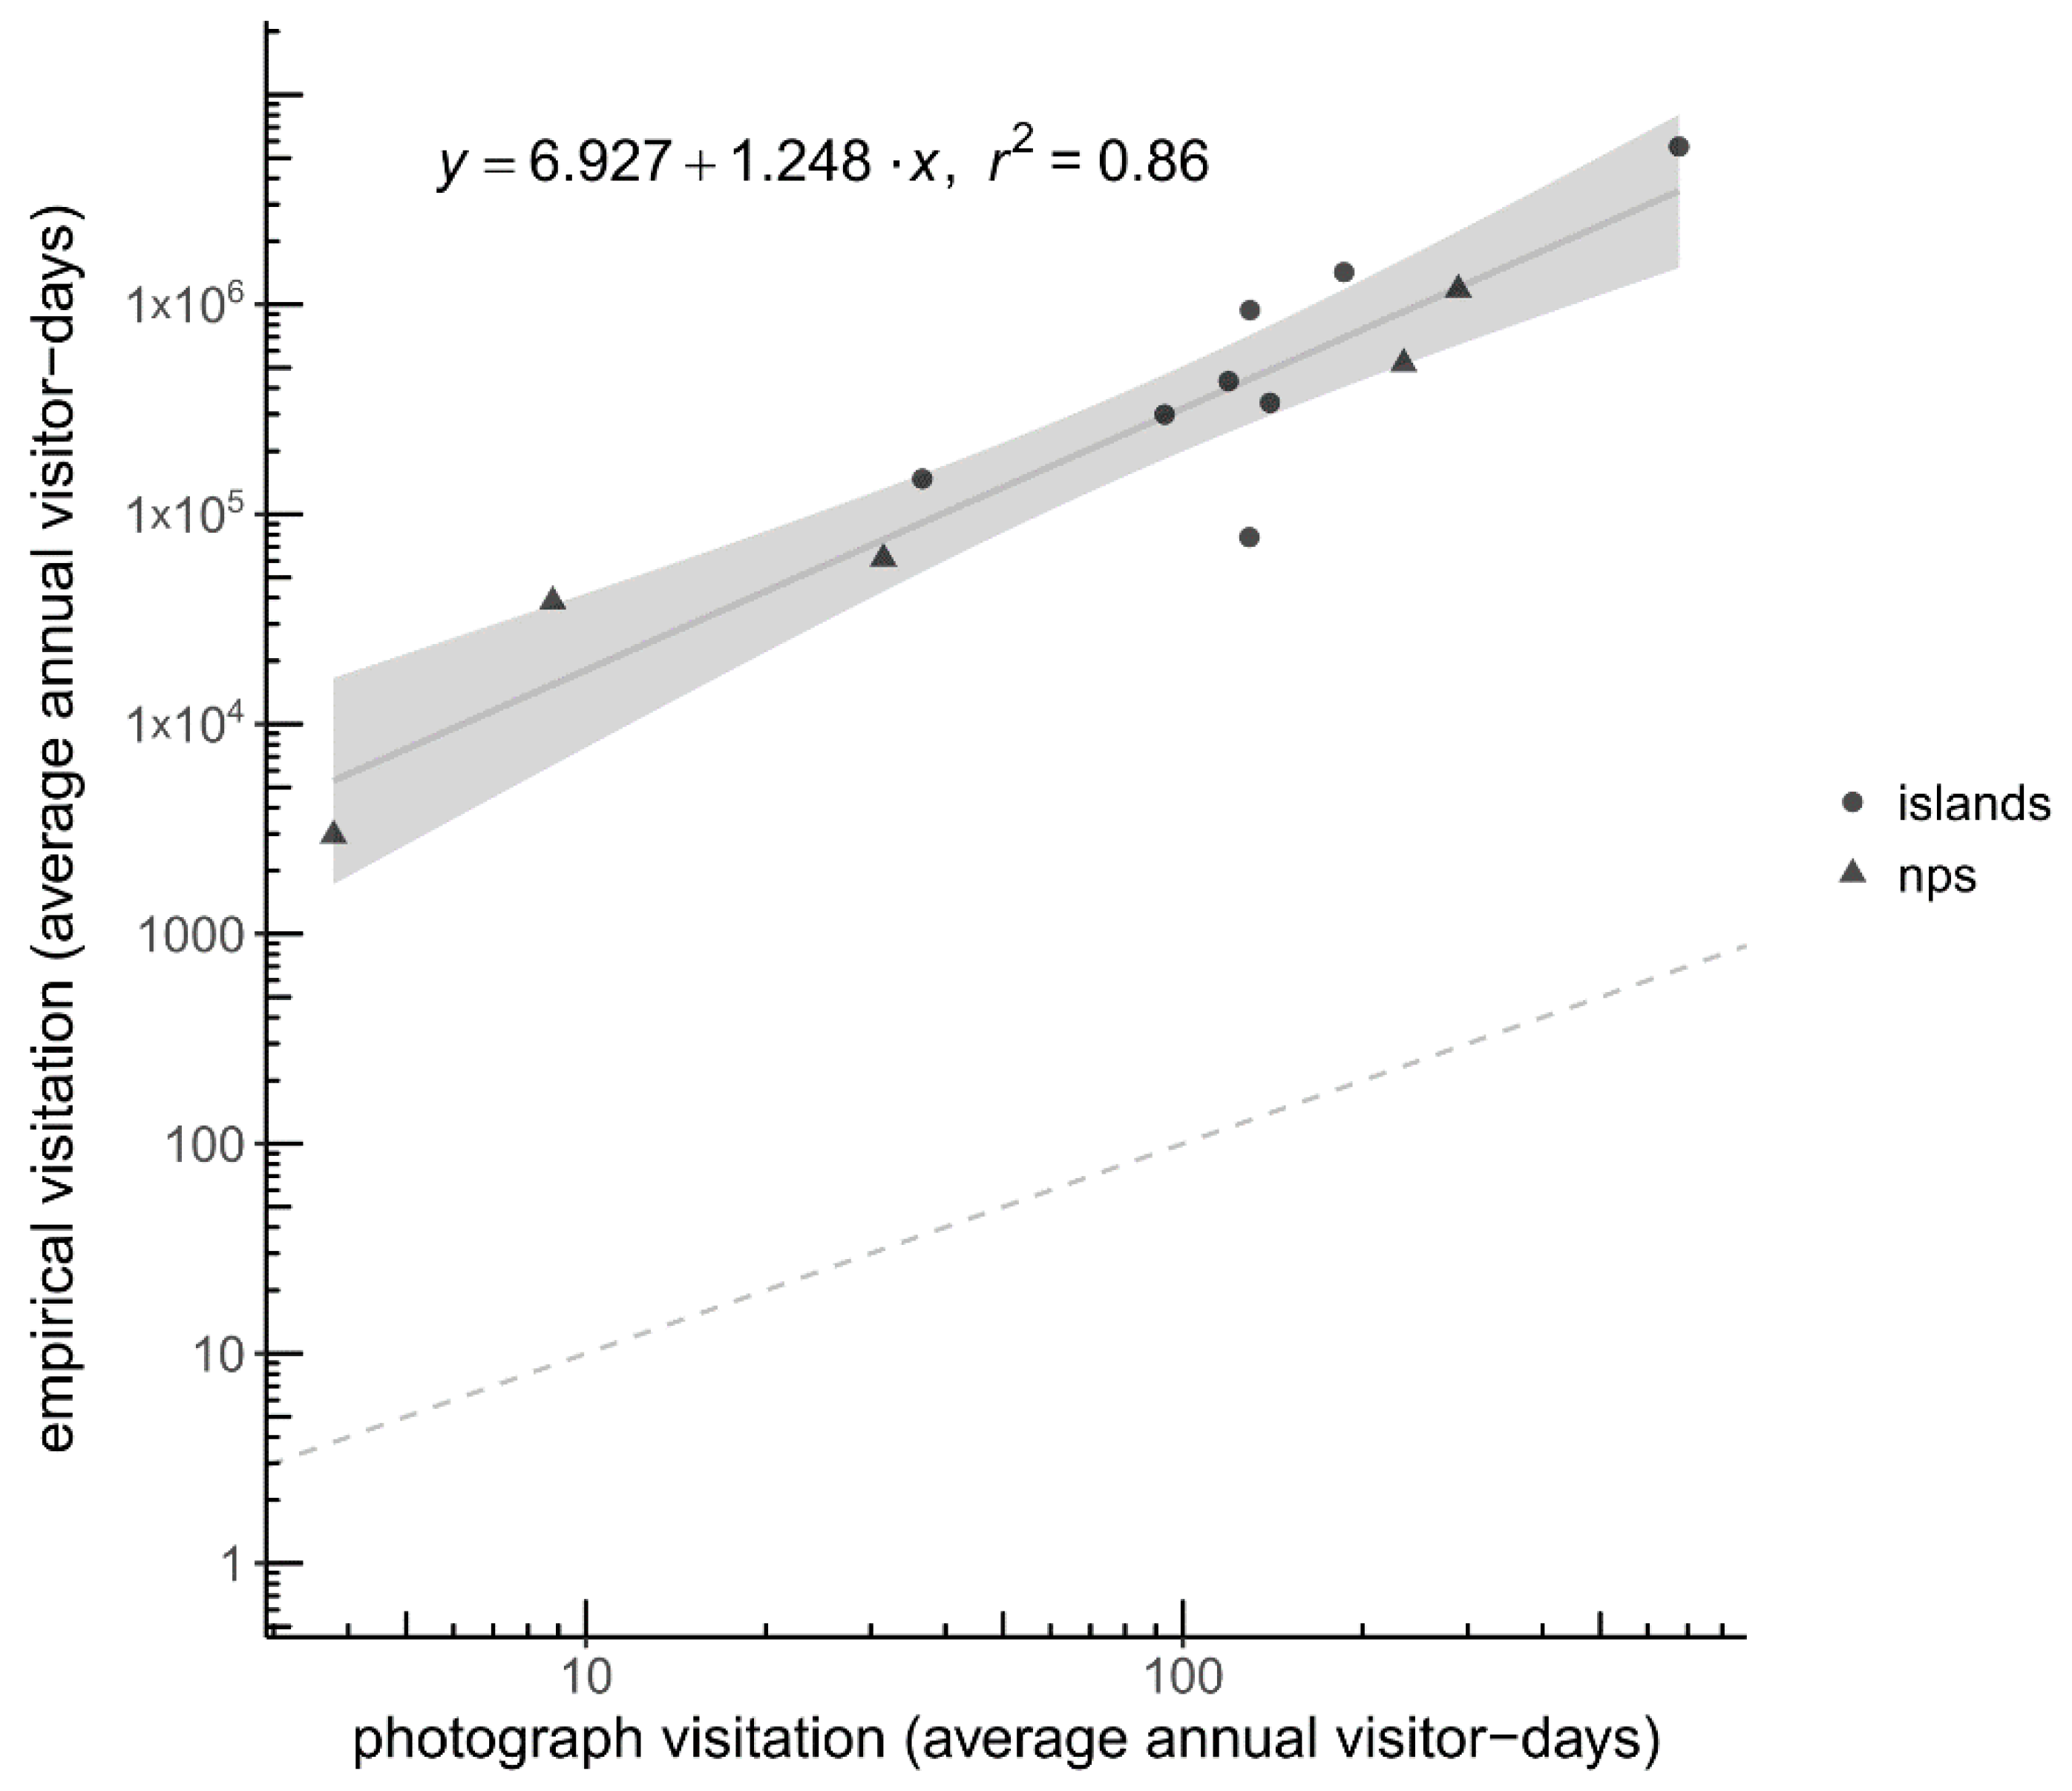
2.2. Comparing Social Media Data and On-Site Counts of Visitors in the Caribbean

To evaluate the degree to which the volume of social media posts correlate with surveyed visitation rates in the Caribbean, we compared annual visitation rates derived from geotagged images shared publicly on the image-sharing website Flickr to on-site visitation estimates published by the Ministry of Tourism of The Bahamas and by the US National Park Service ((NPS), Supplementary Figure S1a). The Bahamas Ministry of Tourism reports total visitor-nights to eight islands or island groups in The Bahamas (Table 1) by year from 2005–2014, based on exit surveys distributed to all passengers on departing flights [56]. The NPS reports monthly visitation rates at all of their sites, five of which are located in the Caribbean (Table 1), for all years in this same period. These statistics are assumed to be quite accurate as they are typically based on counts at controlled access points [60]. We calculated the average annual visitation for every year from 2005–2014 for eight islands and five national parks based on the survey data.
We measured visitation rates from social media in units of photo-user-days (PUD sensu [35]), using the metadata from geotagged photographs shared on Flickr (Figure 1). Over 250 million public photographs are geolocated to a specific latitude/longitude, usually based on a GPS embedded in the camera (e.g., a mobile phone). Photographers may also opt to geolocate photographs by selecting a location on an interactive web map at the time they upload their photographs. Flickr estimates the accuracy of the geolocation (on a scale of 1–16) based on the method of geolocation and the scale of the web map or accuracy of the GPS when the geolocation was created. This location, along with a unique ID for the photographer and the date that the photograph was taken, allows PUD to be calculated, where one PUD in a place represents one unique photographer who took at least one photograph on a specific date [35]. Annual PUD for a place is the sum of PUD values across an entire year. We used the open-source InVEST Visitation model [61], which provides an interface for accessing Flickr metadata, and is freely available for download and application anywhere around the world. We used the model to calculate average annual PUD, based on images taken from 2005–2014, for each island and NPS site for which we had corresponding survey-based visitation rates. InVEST requires GIS data representing the geographic boundaries of these places to query the database of image metadata.
To evaluate the potential for social media to serve as a proxy for visitation, we modeled variability in on-site measures of visitation as a function of PUD in a simple linear regression. To test whether the relationship between the surveys and PUDs differed between islands and NPS sites, we tested a model with a second fixed effect to distinguish the two types of sites. We found no significant effect of the site parameter (β = −0.194, SE = 0.504, p = 0.709) in this model (n = 13, F = 31.22) and a similar lack of an effect of the PUD parameter (β = 1.216, SE = 0.178, p < 0.0001), as observed in the model presented in Figure 2. So, we used the combined data to predict visitation rates to the Bahamian MPAs.

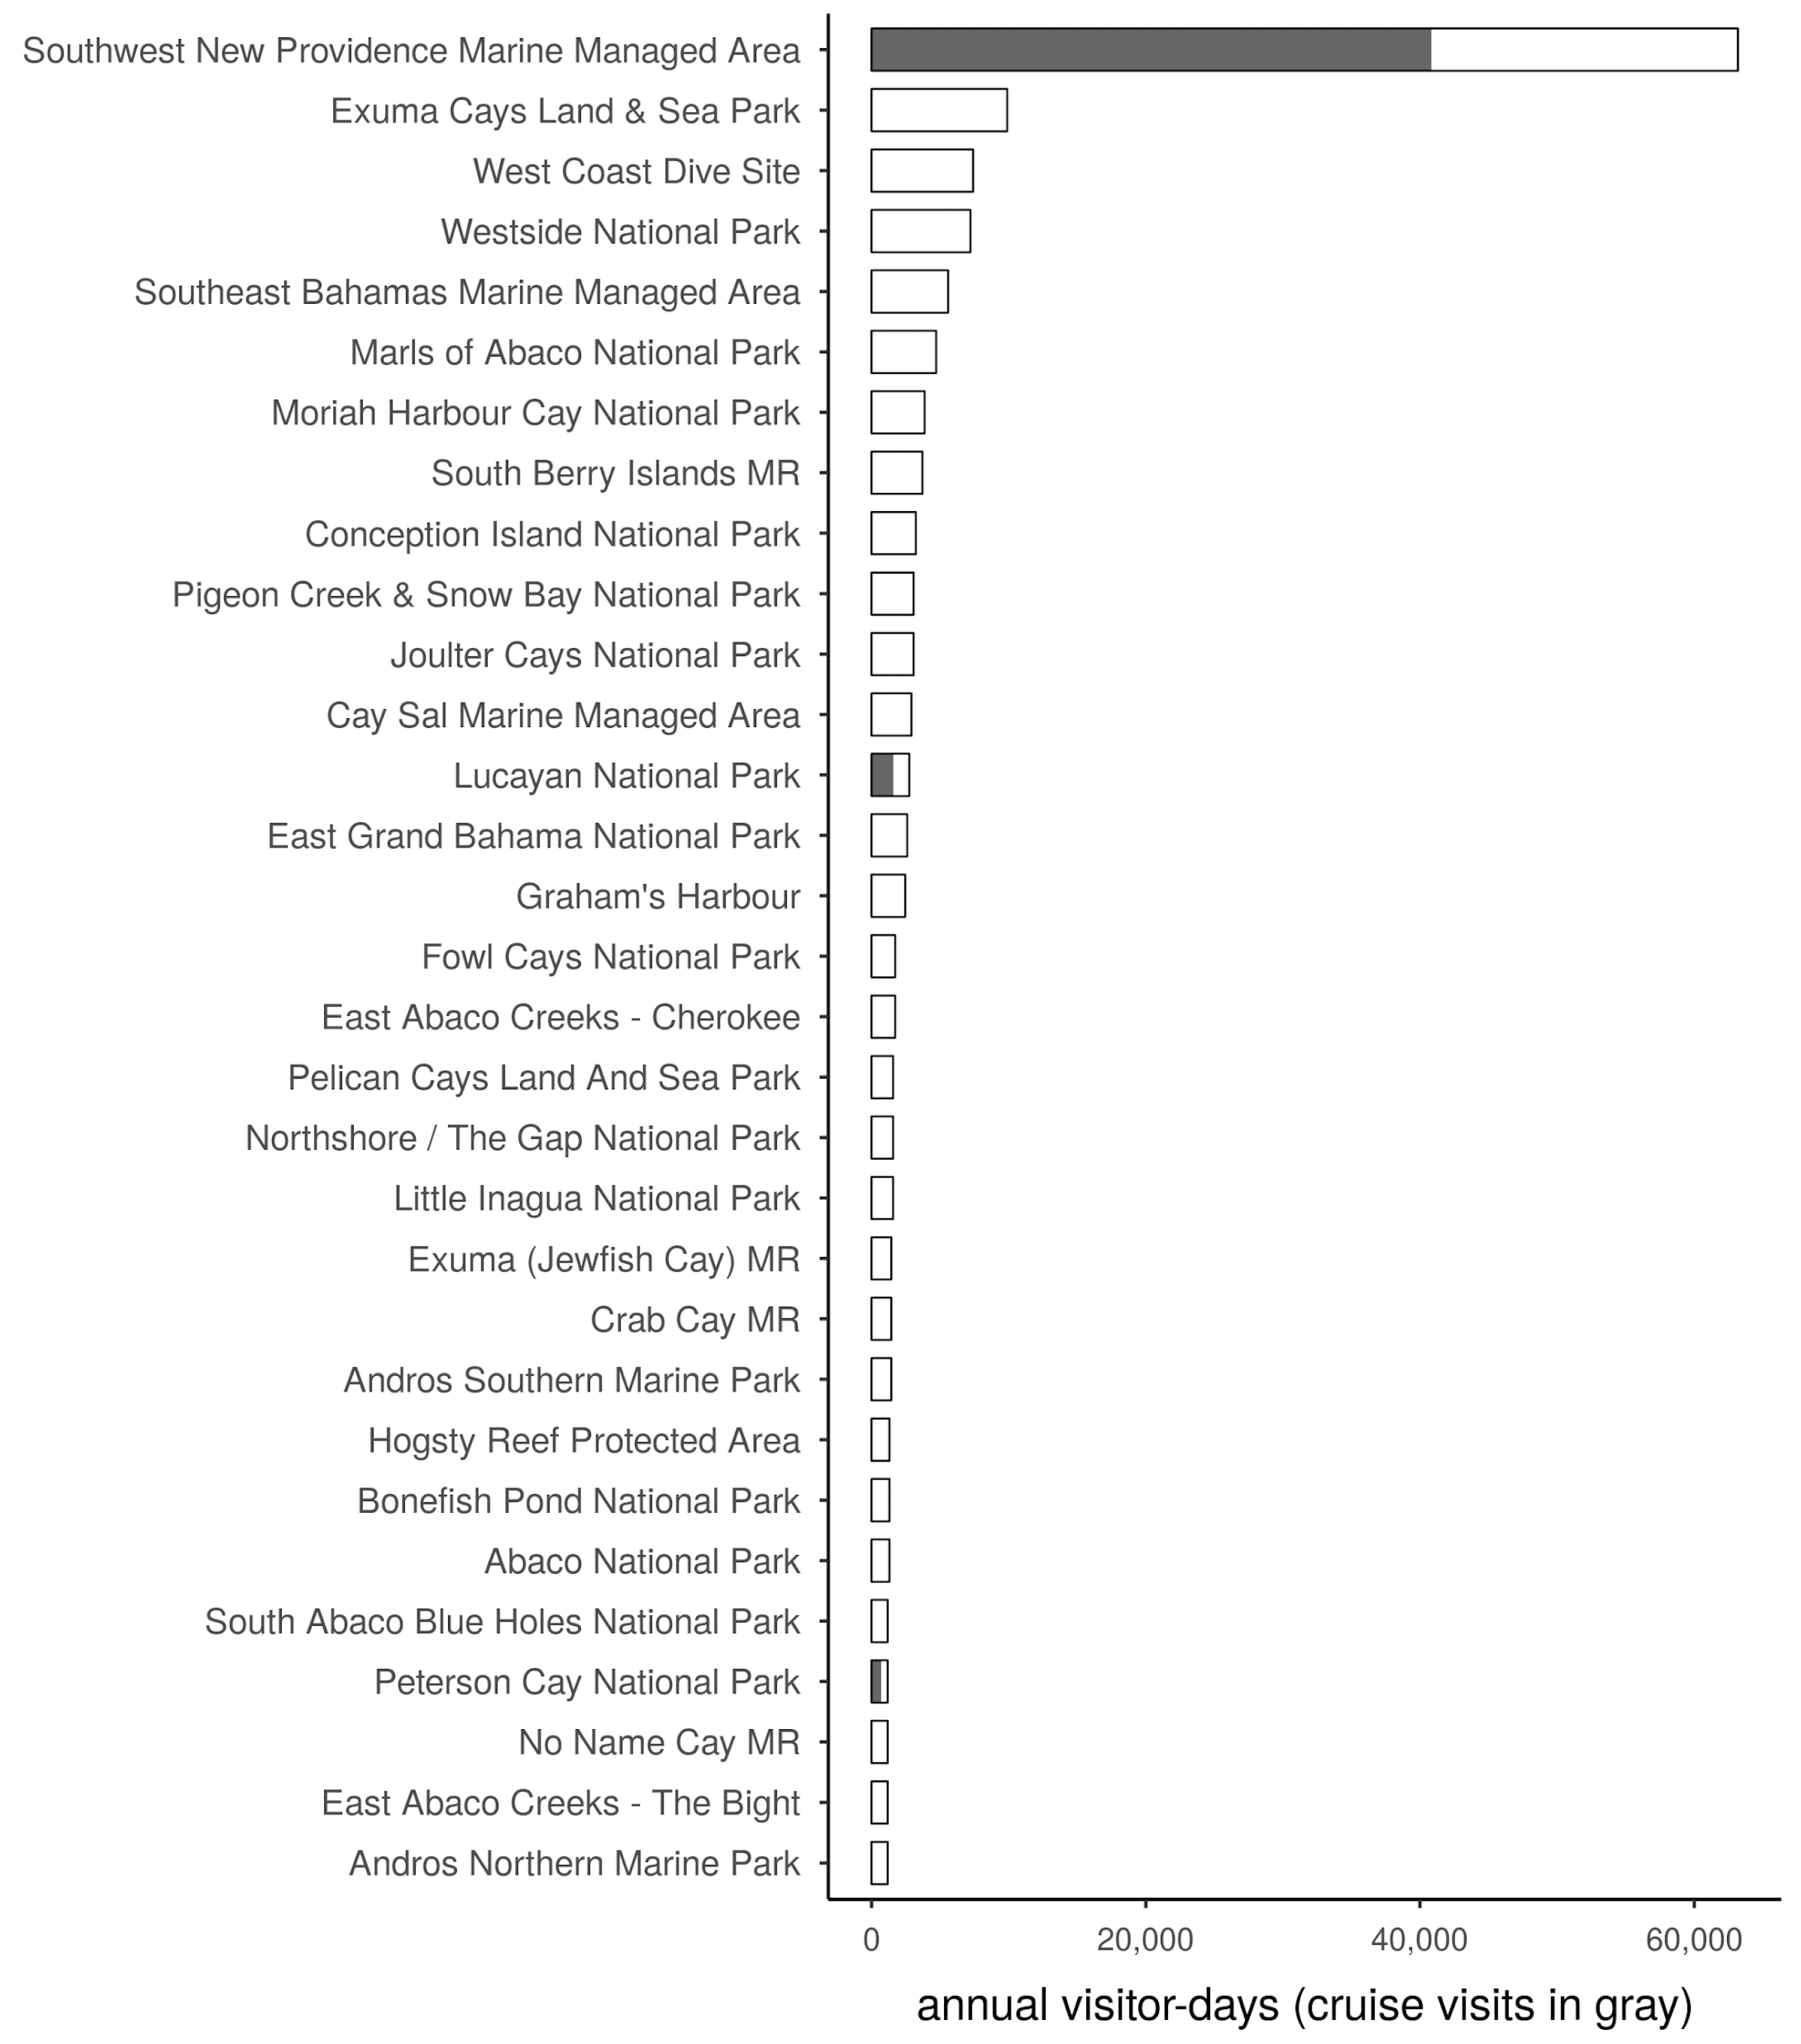
2.3. Predicting Visitation Rates to Bahamian Marine Protected Areas

In order to predict visitation rates to each MPA in The Bahamas, including parks which lack on-site measures of use, we used the combined linear regression model (Section 2.2) to estimate average annual visits to each MPA based on the number of PUDs per site from 2005–2014 (Supplementary Figure S1b). We counted the average annual PUD within each of the 43 MPAs based on all photographs taken from 2005–2014 and with an accuracy score of at least 10 (roughly corresponding to “city-scale” accuracy or better), and predicted average annual visitor-days to these sites.
The photo-based visitation estimates represent all types of visitors, including stopover and cruise visitors. Because these visitors behave differently, and this factors into development planning, we accounted for the relative proportion of stopover and cruise visitors in our estimate of visitor-days. We used the Ministry of Tourism data to identify three MPAs that can reasonably be visited by cruise passengers during a day-trip excursion: Southwest Marine Managed Area, Lucayan National Park, Peterson Cay National Park. We then estimated the proportion of visitors that may be cruise passengers using the Ministry of Tourism’s “arrival mode” dataset, which counts total arrivals by mode (air, sea, cruise) to each port of entry in the country [56]. We associated the three MPAs with the port of entry that serves them and multiplied the proportion of cruise visitors for that port by the estimated visitation rate for that MPA.

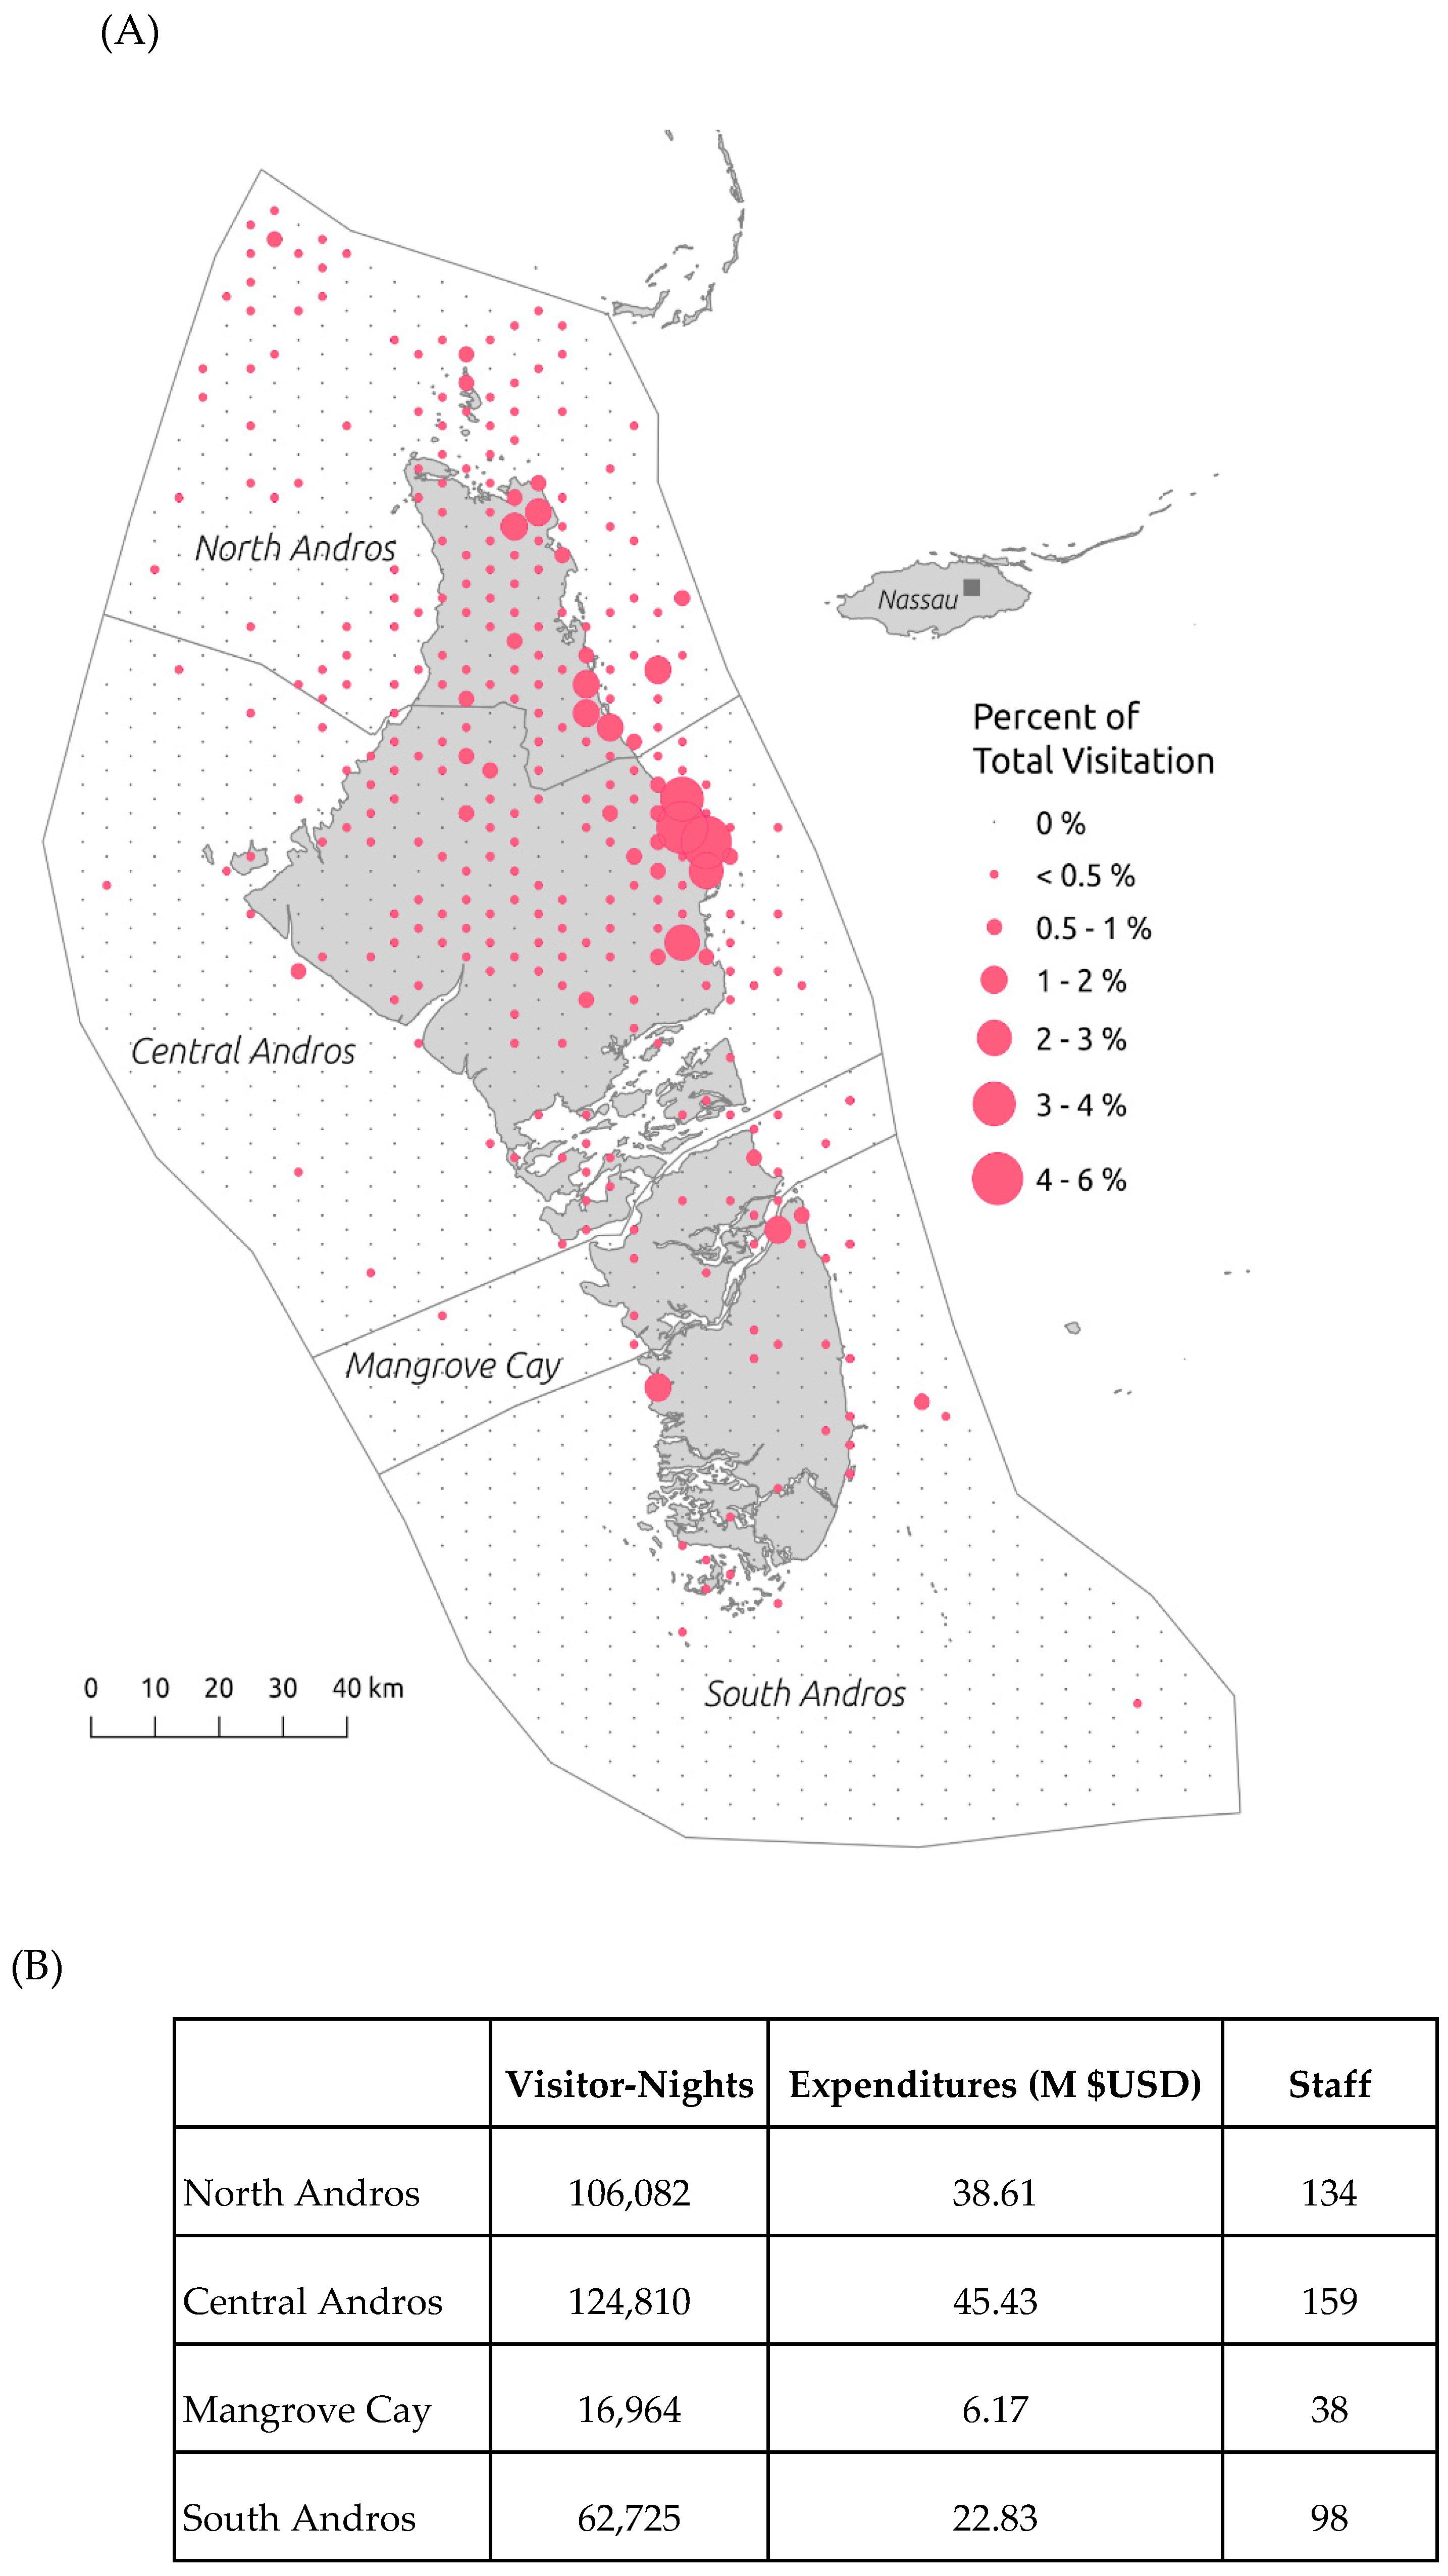
2.4. Distribution of Visitors, Expenditures, and Nature-Based Employment on Andros

To inform sustainable development planning for Andros, we estimated spatial variation in visitation, expenditures, and nature-based tourism employment across the island based on visitation estimates derived from Flickr photographs, airport surveys collected by The Bahamas Ministry of Tourism, and community surveys conducted on Andros [48] (Supplementary Figure S1c). First, we estimated visitation in 5-km grid cells covering the land and sea area of Andros. We used a different approach to estimate visitation for Andros than we used for the MPAs. For the MPA network we built an equation to estimate visitor-days from PUDs for each MPA, as we lacked an estimate of the overall number of visitors to the network. In contrast, for Andros we started with published records of annual visitation rates from the Ministry of Tourism and downscaled them to the 5-km grid cell scale using the relative number of Flickr PUDs per cell (as in [23]).
The Ministry of Tourism entrance surveys provide a historical record of annual visitor-nights to the Family Islands (also known as Outer Islands and including all islands except New Providence and Grand Bahama), of which Andros is one. In 2014 visitation was about 2.5 M visitor-nights to all of the Family Islands. We estimated the percentage of these 2014 visitors going to Andros as the ratio of average annual PUDs from Andros to average annual PUDs from all Family Islands (see Section 2.2 for a description of average annual PUD). We did not rely directly on Ministry of Tourism statistics for Andros because they are known to undercount visitors [62]. Andros is rarely the point-of-entry to The Bahamas, whereas many of the other Family Islands have a point of international entry. We then distributed the estimated Andros 2014 visitor-nights across the island’s grid cells based on each cell’s proportion of the total PUD summed across all cells.
Next, we estimated average annual expenditures on Andros Island based on our estimate of average annual visitor-nights, described above, and an estimated $364 USD spent per night by stopover visitors [56]. Again, we distributed these expenditures across the island’s grid cells based on each cell’s proportion of the total PUD summed across all cells. We report visitor-nights and expenditures per 5-km grid cell and aggregated to the four administrative districts on Andros. Visitation information is generally reported as visitor-nights in survey data; however, for the MPA analysis (above) it made more intuitive sense to report the data as visitor-days as tourists were generally not staying overnight in the MPAs. While in some countries, MPAs include multiple use areas, in The Bahamas most of the area within the MPAs are natural ecosystems, lacking overnight lodging for tourists.
Finally, we estimated the number of tourism-related jobs on Andros for each of the four districts. We used information about the number of jobs supported by tourism on Andros—including staff related to accommodation, meals, and transport, as well as guides for fishing, diving and other eco-tourism activities—collected through local surveys of communities on Andros conducted in 2009 [48]. These data on numbers of people employed in a variety of nature-based jobs were collected at the district level. We simply added together the numbers of people by district to estimate a total number of people employed in nature-based tourism for North Andros, Central Andros, Mangrove Caye, and South Andros. Only those jobs related to nature-based tourism (i.e., related to overnight visitors) were included in the analysis (see reference [48] and Table 15 within).

2.5. Factors Influencing Visitation on Andros

To understand the factors that influence spatial distribution of visitation on Andros, we used a revealed preference approach. This approach involves estimating the contribution of predictor variables using a simple linear regression model that explains spatial variation in PUD visitation rates [23,38,39,43]. The predictor variables consisted of natural features, measures of accessibility, development, and other human activities (Table 2, Supplementary Figure S1d). The results of the analysis reveal tourists’ preferences for different features [23,40], but do not tell us why individuals prefer certain features [25].
Key natural features were identified by stakeholders as beaches, blue holes, bonefish habitat, birding areas, coppice forest, pine forest, mangroves, and seagrass. Data for these habitats were derived from Landsat (2005, 30 km resolution) and Rapideye (2009, 5 km resolution). Several of the natural features also had amenities associated with them, including bathrooms, boardwalks, and other supporting features. In addition, we included coral reefs and their proximity to the main dive-focused lodge on the island. We measured this variable as the percent cover of coral in each grid cell multiplied by the distance to the dive lodge and scaled 0–1. We represented the habitat variables as percent cover of the grid cell adjusted based on cumulative risk from multiple human activities that pose stress to the ecosystems (following methodology from [23,58]).
Accessibility of each grid cell was measured by the product of that cell’s Euclidean distance from the nearest port of entry and a custom-made “ease-of-transport” parameter. This parameter represents the relative ease of transport among seven subregions of Andros based on empirical information about the available modes and reliability of transport (airplane, ferry, roads) and the relative ease of traveling from two tourist origin points (Nassau, the capital of The Bahamas, and the United States) to each subregion. We constructed a weighted network with these nine locations and all available links between them based on input from local communities, stakeholders, and experts. Link weights are the sum of weights assigned to each transport method present on that link. Then, for each of the subregions, we found the least-cost-path to that subregion from the two origin points, where the total cost of a path is the sum of all link weights along the path. Finally, a subregion’s least-cost-path score was applied to each grid cell within that region by multiplying by the distance from each cell to the nearest airport and then scaling it (0–1).
We included developed areas and other human activities in the predictor variables for the regression model. Tourism depends on infrastructure—hotels, lodges, and roads to support it, but other human activities, such as agriculture, could be detractors. Understanding how various activities on the landscape may relate to visitation can help to inform spatial planning by directing certain activities away from, or in proximity to, tourism areas. For example, including tourism-related infrastructure in the analysis reveals where investments in infrastructure could bolster tourism development. Our data for developed areas were based on aerial imagery of private, residential, and commercial infrastructure, including roads, lodges, airports, factories, housing, and calculated as percent cover of development in a grid cell. Agricultural areas included both large- and small-scale agriculture as digitized through aerial imagery from The Nature Conservancy and The Bahamas Department of Forestry. Finally, we included dredged ports (based on aerial imagery and stakeholder input) as a proxy for ease of boat use.
Lastly, we regressed PUDs against all attributes within each grid cell to estimate the extent to which visitation depends on all the input variables. We checked the model for assumptions of normality and multicollinearity among predictors. We found coppice and mangrove habitat distributions to be over 90% correlated, so we included only one of these predictors (coppice) in the final model. The resulting regression coefficients reveal how future changes to habitats and patterns of human activities, access, and infrastructure as a result of sustainable development decisions and conservation planning will alter visitation rates.

3. Results

3.1. Testing PUD Visitation in the Caribbean

Visitation based on Flickr photographs corresponds well with empirically-derived estimates for the Bahamian archipelago and US NPS sites in the Caribbean (Figure 2). We found a significant positive relationship between average annual visitation as measured by on-site counts compared to PUDs derived from Flickr social media (n = 13, R2 = 0.86, F = 67.53, P < 0.001)). Although there is appreciable variation across all islands and parks, there is a positive relationship between the number of people counted and the Flickr-generated measure of user-days in the parks and islands.

3.2. Visitation to Bahamian Marine Protected Areas

We estimated an average of 383,000 visitor-days to the entire Bahamian MPA network annually, with visitation varying dramatically across the network (Figure 3). Size of the park explains some of the variation, which is evident by the high estimates of visitation for large MPAs such as Cay Sal and Southeast Bahamas Marine Managed Area (Figure 3). Scaling visitation rates by area reveals which places are most visited per unit area. For example, Crab Cays National Park and Green’s Bay National Park have a large number of visitors relative to their size (Figure 4). While park size explains some of the variation, it does not account for all the variation, suggesting that parks have unique characteristics that draw tourists. For example, the greatest number of people visit Southwest Marine Managed Area (SWMMA), likely due to its proximity to Nassau and accessible coastal waters. Our results suggest that sites like SWMMA will require a suite of interventions, such as signage, designated coastal access sites, and other actions to manage tourism impacts sustainably. In contrast, one of the oldest parks in the network, and the only no-take area, Exuma Cays Land and Sea Park is the second most-visited area, despite it being much less accessible. The aesthetic beauty, uniqueness, and ecology of Exuma Cays Land and Sea Park likely draw tourists [25]. Thus, conservation actions that protect the integrity of this ecosystem, such as mooring balls or temporal restrictions during periods of sensitive ecological activity, are potentially important components of the long-term competitiveness and sustainability of this destination. We also found that parks differ in the relative proportion of cruise ship versus stopover visitors, with only SWMMA, Lucayan, and Peterson Cay receiving cruise ship visitors, and thus requiring management actions specifically targeted towards sustainable cruise ship operations.

3.3. Visitation, Expenditures, and Nature-Based Employment on Andros

We found that tourists spent roughly 311 K visitor-nights on Andros and the surrounding study area in 2014 (Figure 5). Most of the visitation occurred on the east side of the island, which is the more developed region. The western side is almost entirely designated as a national park. Tourism also varied substantially among districts. Visitation was highest in the Central district with an estimated 125 K visitor-nights and $44.4 M USD in expenditures in this district in 2014. An estimated 160 staff and guides supported tourism in Central Andros. After Central Andros, North Andros received the second greatest number of visitors. We estimated 106 K visitor-nights in 2014 and $38.6 M USD in total visitor expenditure annually. In North Andros this employed an estimated 134 staff and guides.
Relative to the total size of the district, Mangrove Cay received considerable tourism. We estimated 17 K visitor-nights and $6.2 M USD in expenditures annually, as well as 38 supporting staff and guide jobs [48]. Finally, we estimated 63 K visitor-nights and $23 M USD expenditures in South Andros in 2014, corresponding to 98 staff and guide jobs.

3.4. Factors That Influence Visitation on Andros

Several variables influence spatial patterns of visitation to Andros. Broadly, these can be thought of as factors that represent ecosystems that could draw tourists (e.g., coral reefs, blue holes), factors that facilitate access to sensitive environments for tourists to enjoy (e.g., distance between lodge and reef, frequency and reliability of flights, and ferries between districts), and factors that represent development for tourism (e.g., roads and lodging). Of the eight variables we explored, we found that development explained the greatest variation in the linear regression model ( β = 2.029 , p < 0.0001). After coastal development, access, coral located near dive lodges, beaches, bonefish habitat, dredged ports, and pine were all significant predictors of visitation (Table 2). Agriculture was a significant negative predictor.
Notably, this list of important predictor variables includes factors that represent the combined relevance of natural features and access. For example, corals located near dive lodges were a significant predictor of visitation. Furthermore, districts with both access and ecosystems tended to draw tourists. Tourism is supported by a combination of ecological and economic factors in Central Andros including a suite of medium to high-end eco-tourism lodges, access via a road from North Andros, flights into Fresh Creek airport, coral reef dive sites relatively close to the main dive lodge on the island, and sandy shorelines for beach-going. Access to visitors from Nassau and international ports helps to facilitate tourism to North Andros, in addition to a large number of boutique lodges to support guests [48]. In conclusion, the distribution of predictor variables varies spatially and influences which districts receive the greatest visitation (Figure 5).

4. Discussion

Countries around the world are engaging in sustainable tourism development that aims to increase the competitiveness of a destination while ensuring benefits for local communities and protection of ecosystems that attract visitors [16,17,23,63,64,65]. To advance these initiatives, we explored the potential of big data to provide information on visitation to coastal and marine ecosystems that are often remote or cover prohibitive area for monitoring. We found that visitation estimates derived from social media correspond well with the survey-based data at two spatial scales in the Caribbean: (1) islands of the Bahamian archipelago and (2) protected areas managed by the US National Park Service. We then applied these findings to the Bahamian network of marine protected areas and the fifth-largest island in the Caribbean, Andros, to quantify visitation and expenditures at management-relevant scales and to inform key planning processes. Our results provide the first comprehensive count of visitation across the current network of 43 MPAs in The Bahamas, highlighting the importance of MPAs not just for species conservation, but also for tourism-related benefits. They also demonstrate the combined importance of healthy ecosystems, access, and infrastructure for influencing spatial variation in visitation to tropical coastal and marine systems. These results have implications for sustainable tourism, coastal development, and protected area planning in The Bahamas and beyond [45,66].
Our finding that PUDs correspond well with visitor nights for islands in The Bahamas and Caribbean parks managed by the US NPS is consistent with evidence from parks in Europe [22,28], the US [39,42], and South Africa [41], among other locations. In recent years, these studies and many others have estimated nature-based recreation and tourism over large spatial scales [16,67], in many cases by leveraging social media [33]. However, by and large, the literature focuses on temperate, terrestrial regions (but see [5,23]). Moreover, the literature using social media and mobile phone location data to better understand spatial variation in visitation is growing, yet it tends to be academic in focus [19]. Our paper helps to advance this body of work by exploring the utility of social media approaches for tracking visitation in coastal and marine environments and by providing two examples—MPA planning and sustainable development—of how spatial information on tourism can be used to inform policies.
Importantly, our application of novel data about nature-based recreation in The Bahamas provides the first comprehensive estimate of visitation across the entire MPA network (Figure 3 and Figure 4) and spatial variation in visitation within Andros (Figure 5). Previous work on tourism-related visitation in The Bahamas has focused on in-depth analysis of a couple of key MPAs [44] and airport entrance records by islands [56]. These sources of information are very important for understanding ecological characteristics, visitor interests, and the needs of specific parks, as well as national patterns of visitation over time. However, they lack information about relative patterns of visitation to marine protected areas across the entire network and remote locations on Andros. Understanding spatial patterns in numbers of visitors is important for prioritizing investments in infrastructure, enforcement, staff, and other resources to encourage tourism while supporting local communities and protecting sensitive environments. Our results show that social media-based data has the potential to contribute to MPA management and island development by providing visitor statistics for remote areas that lack on-site visitor counts and by providing comprehensive spatial data at management relevant scales.
Our estimates of visitation across the network of MPAs have implications for protected area management and communications. Management of protected areas has traditionally focused on conserving coastal and marine species by reducing impacts from human-induced stressors. By quantifying the number of visitors to MPAs, our analysis demonstrates that these parks draw tourists and lead to spending in tourism-related industries. Experiences recreating in nature are important for physical and mental health [68,69,70], and nature-based tourism supports the livelihoods of people in surrounding communities [17,71,72]. Our estimates of nearly 400 K visitor-days to MPAs annually can in turn be used to build local and national support for protected areas. In fact, The Government of The Bahamas recently committed to strengthening the management structures for MPAs through amendments to The Bahamas National Trust and Protected Areas Fund Bills [66]. Evidence linking visitation and expenditures from tourism to MPAs helps communicate the case for incorporating MPAs into comprehensive development planning and for public investment in MPA surveillance, enforcement, and management.
For Andros, we were able to quantify the relative importance of factors influencing variation in visitation (Table 2). First, using social media and surveys, we estimated large differences in visitation and expenditures among the Island’s four districts (Figure 5). These metrics were useful for communicating with stakeholders and decision-makers about the importance of nature-based visitation for supporting local businesses and providing jobs, and for showing variation among districts in benefits from tourism [17,45]. Second, our analysis of factors that influence spatial variation in visitation indicated that sensitive environments, such as coral reefs, pines, and beaches, tend to draw tourists. This finding is consistent with other studies showing that natural features of beauty and recreational opportunities have a positive influence on visitation [25,28,40,73]. Visitors are likely attracted to natural features because the beauty of a destination involves more than visual aesthetics. Individuals prefer locations where they can be immersed fully and engage all their senses [25]. Our results also have implications for management of nature-based tourism destinations. Effectively managing ecosystems and ensuring their long-term health—and beauty—is important for tourism sustainability, but also requires financial resources that are often limited. Our results indicate where to prioritize the development of best management practices, communication materials, and investments in specific infrastructure (e.g., boardwalks) to help visitors recreate while minimizing their impacts to sensitive environments. Effective management of nature-based tourism will be particularly important in a post-COVID-19 world, as early analyses of visitation patterns suggest that tourists are particularly interested in places where they can appreciate the natural environment and have the freedom to move around safely [74].
Despite their importance, natural features are not the only factors that tourists consider, especially in a place like Andros where natural resources are so abundant. Our results show that it is the intersection of nature with factors related to access and accommodation—such as corals near scuba diving lodges and districts with frequent ferries and flights—that seem to attract visitors. These results concur with studies from very different environments suggesting the combined importance of natural features and access for supporting visitation [73]. From a management perspective, our data suggest that investments in infrastructure should be focused in certain locations to reduce risk, and allow access, to specific habitats: both key aspects of tourism sustainability. Our findings for Andros also provide insights into why two very different sites are the two most-visited MPAs in The Bahamas. Exuma and SWMMA are representative of different categories of highly visited parks [73,75], with the former being the oldest MPA in the network, well known for its natural beauty despite its remote location, and the latter representing the importance of access for visitation, especially in highly populated areas [28].
Our study adds value to past efforts to quantify nature-based tourism on Andros by providing additional site-specific information. Previous work on the Island shows that tourism comprises over 30% of Andros’ economic activity and provides employment for over 400 Androsians [48]. All tourism on Andros depends in some way on natural resources [48]. Bonefishing in particular comprises 81% of the revenue and employs over 80 people [8]. These past studies are comprehensive and provided a basis for our hypotheses about what factors may influence spatial patterns of visitation and local data about nature-based employment (Figure 5). Yet survey-based studies are time- and resource-intensive, and they provide only a snapshot of estimates for visitation and expenditures for one year. The large spatial coverage (whole island) and fine-scale (5 km) resolution of PUDs allowed us to model how potential interventions—such as improved access through upkeep of roads and boutique lodges—would enhance visitation without degrading sensitive habitat that draw tourists in the first place. An exciting next step for future work would be to use social media approaches to collect data that would help institutions monitor social, economic, and ecological indicators of tourism sustainability. Such indicators would be useful for assessing the sustainability of coastal development plans, nature-based loans (e.g., Andros Sustainable Development Master Plan [19,45,76]), and efforts that seek to recover from the COVID-19 pandemic [21], while maintaining the improvements in environmental condition that occurred over the same period [77].
Despite the promise of social media for providing estimates of nature-based tourism and recreation, there are important limitations to consider. For one, our comparison of PUDs to surveyed visitation was limited to a total of 13 sites (five NPS sites and 8 island sites). In addition to the small number of sites, these sites may not be entirely representative of the MPAs and Andros, where we are applying the approach. Small national parks may be more similar to MPAs than island regions. Moreover, in remote areas with sparse social media coverage (e.g., many of the Bahamian MPAs) PUDs may be providing an accurate ranking of popularity across sites, but less certain estimates of actual visitor numbers [41]. Parks in the network of MPAs vary widely in size, proximity to population centers, and ecological characteristics. It is likely that our estimates of visitation are more accurate for those sites with more visitors overall [33,41]. Furthermore, social media users are not a random sample of tourists visiting Andros and parks in our study. The magnitude of this bias likely depends on site, activity, age, whether the visitors are national or international, and social media platform [78,79]. The Flickr data we used in the study may also be biased by the popularity of the website which varies by year, geography and user groups [28,33]. Future work could build on our results by exploring the relationship between social media-based visitation and on-site visitor counts for a greater number and variety of ocean and coastal sites. It would also be interesting to test the value of combining multiple social media platforms (e.g., Twitter, Instagram) in addition to Flickr for ocean destinations [33].
Biases and uncertainties are inherent in traditional approaches as well. Our results suggest that airport surveys account for fewer Andros visitors than Flickr data (see outlier in Figure 2). Visitation to Andros may be under-represented by the statistics from immigration cards because they record only a visitor’s point of entry to The Bahamas which is rarely Andros [62]. This may explain why photographs appear to overestimate visits to Andros—compared to official visitor-night statistics—and underestimate visitation to Nassau which is the most common point of entry for foreign visitors, but not always their final destination. This finding illustrates the importance of using multiple sources of information and complementary approaches with different biases to assess visitation.

5. Conclusions

Our paper highlights the potential to advance conservation and sustainable development in the Caribbean by estimating coastal and marine tourism with data derived from social media. Our results provide the first estimate of visitation for all 43 MPAs in The Bahamas, demonstrating the applicability of social media as data in coastal and marine environments. These estimates of visitation across a large network of marine protected areas (including remote sites) highlight the importance of protected areas for tourism-related benefits to people, and not just as a fisheries management tool. We also show how visitation rates based on social media can help to identify factors that influence spatial variation in tourism on a fine enough scale to inform management and development planning. Importantly, our paper goes beyond a purely academic analysis of tourism using two concrete examples of coastal and marine management. For protected areas, we show that spatial information about visitation can be used to communicate the value of ecosystems within MPAs for providing ecosystem services to people, in addition to the value of species conservation, thus, helping to encourage public investment in MPAs for sustainable tourism [66]. At the island scale, our findings were used to help direct investments towards safeguarding coastal ecosystems, improving access, and priority infrastructure for tourism development [45]. We believe the results of our work provide a useful example for other countries seeking to leverage big data to foster science-policy processes for sustainable tourism.

Supplementary Materials

The following are available online at https://www.mdpi.com/2071-1050/13/5/2427/s1.

Author Contributions

Conceptualization, K.K.A., D.M.F. and K.W.; methodology, D.M.F., S.A.W. and K.K.A.; software, S.A.W. and D.M.F.; analysis and data collection, D.M.F. and K.W.; writing—original draft preparation, K.K.A., D.M.F., K.W. and H.J.P.; writing—review and editing, S.A.W., K.K.A., H.J.P. All authors have read and agreed to the published version of the manuscript.

Funding

This research was funded by the Biodiversity and Ecosystem Services Program at the Inter-American Development Bank (BH-T1040) and The Bahamas Reef Environment Educational Foundation (BREEF).

Institutional Review Board Statement

Not applicable.

Informed Consent Statement

Not applicable.

Data Availability Statement

The InVEST Recreation Model that was used to access aggregated Flickr data is freely available for download at https://naturalcapitalproject.stanford.edu/software/invest (accessed on 13 February 2021).

Acknowledgments

We thank the staff in the Office of the Prime Minister of The Bahamas Development Planning Unit from 2015–2017, in particular, Nicola Virgill-Rolle and Brett Lashley, for their expertise and vision for the Andros Sustainable Development Master Plan. We also thank the staff at BREEF, in particular, Casuarina McKinney-Lambert, for their vision and guidance for the MPA analysis. In addition, we thank the many government departments, nongovernmental organizations, and individuals that provided data, expertise, and local knowledge, particularly Peter Douglass, Craig Dalgren, Venetia Hargreaves-Allen, Shenique Albury-Smith, Shelley Cant, Lindy Knowles, Stacie Moultrie, Michele Lemay, Steve Schill, and John Knowles.

Conflicts of Interest

The authors declare no conflict of interest.

References

  1. McClung, M.R.; Seddon, P.J.; Massaro, M.; Setiawan, A.N. Nature-based tourism impacts on yellow-eyed penguins Megadyptes antipodes: does unregulated visitor access affect fledging weight and juvenile survival? Biol. Conserv. 2004, 119, 279–285. [Google Scholar] [CrossRef]
  2. Reed, S.E.; Merenlender, A.M. Quiet, Nonconsumptive Recreation Reduces Protected Area Effectiveness. Conserv. Lett. 2008, 1, 146–154. [Google Scholar] [CrossRef]
  3. Pirotta, E.; Lusseau, D. Managing the wildlife tourism commons. Ecol. Appl. 2015, 25, 729–741. [Google Scholar] [CrossRef] [Green Version]
  4. Cooper, E.; Burke, L.M.; Bood, N.D. Coastal Capital, Belize: The Economic Contribution of Belize’s Coral Reefs and Mangroves; World Resources Institute: Washington, DC, USA, 2009. [Google Scholar]
  5. Spalding, M.; Burke, L.; Wood, S.A.; Ashpole, J.; Hutchison, J.; zu Ermgassen, P. Mapping the global value and distribution of coral reef tourism. Mar. Policy 2017, 82, 104–113. [Google Scholar] [CrossRef]
  6. Cline, W. Shark Diving Overview for the Islands of The Bahamas; Cline Marketing Group: Nassau, Bahamas, 2008. [Google Scholar]
  7. Haas, A.R.; Fedler, T.; Brooks, E.J. The contemporary economic value of elasmobranchs in The Bahamas: Reaping the rewards of 25 years of stewardship and conservation. Biol. Conserv. 2017, 207, 55–63. [Google Scholar] [CrossRef]
  8. Fedler, T. The economic Impact of Flats Fishing in The Bahamas; The Bahamian Flats Fishing Alliance: Nassau, Bahamas, 2010. [Google Scholar]
  9. Blackwell, B.; Brumbaugh, D.R.; Dahlgren, C.P. Economic Benefits of the South Berry Islands Marine Reserve; Nature Conservancy Northern Caribbean Program: Nassau, Bahamas, 2013. [Google Scholar]
  10. Halpern, B.S.; Walbridge, S.; Selkoe, K.A.; Kappel, C.V.; Micheli, F.; D’Agrosa, C.; Bruno, J.F.; Casey, K.S.; Ebert, C.; Fox, H.E.; et al. A global map of human impact on marine ecosystems. Science 2008, 319, 948–952. [Google Scholar] [CrossRef] [Green Version]
  11. Burke, L.; Maidens, J.; Kramer, P.; Green, E.; Greenhalgh, S.; Nobles, H.; Kool, J. Reefs at Risk in the Caribbean; World Resources Institute: Washington, DC, USA, 2004. [Google Scholar]
  12. Burke, L.; Reytar, K.; Spalding, M.; Perry, A. Reefs at Risk Revisited; World Resources Institute: Washington, DC, USA, 2011. [Google Scholar]
  13. Abeyratne, R.I.R. Management of the environmental impact of tourism and air transport on small island developing states. J. Air Transp. Manag. 1999, 5, 31–37. [Google Scholar] [CrossRef]
  14. Holder, J.S. Pattern and impact of tourism on the environment of the Caribbean. Tour. Manag. 1988, 9, 119–127. [Google Scholar] [CrossRef]
  15. Davenport, J.; Davenport, J.L. The impact of tourism and personal leisure transport on coastal environments: A review. Estuar. Coast. Shelf Sci. 2006, 67, 280–292. [Google Scholar] [CrossRef]
  16. Romão, J.; Guerreiro, J.; Rodrigues, P.M.M. Territory and Sustainable Tourism Development: A Space-Time Analysis on European Regions. Reg. Anaesth. 2017, 4, 1–17. [Google Scholar] [CrossRef] [Green Version]
  17. Gu, X.; Hunt, C.A.; Lengieza, M.L.; Niu, L.; Wu, H.; Wang, Y.; Jia, X. Evaluating residents’ perceptions of nature-based tourism with a factor-cluster approach. Sustain. Sci. Pract. Policy 2020, 13, 199. [Google Scholar]
  18. United Nations Environment Programme. Division of Technology, Industry, and Economics. World Tourism Organization. Making Tourism More Sustainable: A Guide for Policy Makers; United Nations Environment Programme, Division of Technology, Industry and Economics: Nairobi, Kenya, 2005; ISBN 9789284408214. [Google Scholar]
  19. Pérez Guilarte, Y.; Barreiro Quintáns, D. Using Big Data to Measure Tourist Sustainability: Myth or Reality? Sustain. Sci. Pract. Policy 2019, 11, 5641. [Google Scholar] [CrossRef] [Green Version]
  20. World Tourism Organization (UNWTO). Measuring Sustainable Tourism. In Proceedings of the 6th International Conference on Tourism statistics: Measuring Sustainable Tourism, Manila, Philippines, 21–24 June 2017. [Google Scholar]
  21. Roman, M.; Niedziółka, A.; Krasnodębski, A. Respondents’ involvement in tourist activities at the time of the COVID-19 pandemic. Sustain. Sci. Pract. Policy 2020, 12, 9610. [Google Scholar] [CrossRef]
  22. Silva, F.B.e.; Herrera, M.A.M.; Rosina, K.; Barranco, R.R.; Freire, S.; Schiavina, M. Analysing spatiotemporal patterns of tourism in Europe at high-resolution with conventional and big data sources. Tour. Manag. 2018, 68, 101–115. [Google Scholar] [CrossRef]
  23. Arkema, K.K.; Verutes, G.M.; Wood, S.A.; Clarke-Samuels, C.; Rosado, S.; Canto, M.; Rosenthal, A.; Ruckelshaus, M.; Guannel, G.; Toft, J.; et al. Embedding ecosystem services in coastal planning leads to better outcomes for people and nature. Proc. Natl. Acad. Sci. USA 2015, 112, 7390–7395. [Google Scholar] [CrossRef] [PubMed] [Green Version]
  24. National Sustainable Tourism MasterPlan for Belize 2030; Ministry of Tourism, Civil Aviation, and Culture: Kathmandu, Nepal, 2011.
  25. Kirillova, K.; Fu, X.; Lehto, X.; Cai, L. What makes a destination beautiful? Dimensions of tourist aesthetic judgment. Tour. Manag. 2014, 42, 282–293. [Google Scholar] [CrossRef]
  26. Tallis, H.; Mooney, H.; Andelman, S.; Balvanera, P.; Cramer, W.; Karp, D.; Polasky, S.; Reyers, B.; Ricketts, T.; Running, S.; et al. A Global System for Monitoring Ecosystem Service Change. Bioscience 2012, 62, 977–986. [Google Scholar] [CrossRef] [Green Version]
  27. Rosenthal, A.; Verutes, G.; McKenzie, E.; Arkema, K.K.; Bhagabati, N.; Bremer, L.L.; Olwero, N.; Vogl, A.L. Process matters: a framework for conducting decision-relevant assessments of ecosystem services. Int. J. Biodivers. Sci. Eco. Srvcs. Mgmt. 2015, 11, 190–204. [Google Scholar] [CrossRef]
  28. Mancini, F.; Coghill, G.M.; Lusseau, D. Using social media to quantify spatial and temporal dynamics of nature-based recreational activities. PLoS ONE 2018, 13, e0200565. [Google Scholar] [CrossRef] [Green Version]
  29. Travel & Tourism: Economic Impact 2020 Caribbean; World Travel and Tourism Council: London, UK, 2020.
  30. Brown, G. Mapping landscape values and development preferences: a method for tourism and residential development planning. Int. J. Tour. Res. 2006, 8, 101–113. [Google Scholar] [CrossRef]
  31. Eagles, P.F.J. Trends in Park Tourism: Economics, Finance and Management. J. Sustain. Tour. 2002, 10, 132–153. [Google Scholar] [CrossRef]
  32. Deng, J.; King, B.; Bauer, T. Evaluating natural attractions for tourism. Ann. Tour. Res. 2002, 29, 422–438. [Google Scholar] [CrossRef]
  33. Wood, S.A.; Winder, S.G.; Lia, E.H.; White, E.M.; Crowley, C.S.L.; Milnor, A.A. Next-generation visitation models using social media to estimate recreation on public lands. Sci. Rep. 2020, 10, 15419. [Google Scholar] [CrossRef]
  34. Elwood, S.; Goodchild, M.F.; Sui, D.Z. Researching Volunteered Geographic Information: Spatial Data, Geographic Research, and New Social Practice. Ann. Assoc. Am. Geogr. 2012, 102, 571–590. [Google Scholar] [CrossRef]
  35. Wood, S.A.; Guerry, A.D.; Silver, J.M.; Lacayo, M. Using social media to quantify nature-based tourism and recreation. Sci. Rep. 2013, 3, 2976. [Google Scholar] [CrossRef] [PubMed]
  36. Ghermandi, A.; Sinclair, M. Passive crowdsourcing of social media in environmental research: A systematic map. Glob. Environ. Chang. 2019, 55, 36–47. [Google Scholar] [CrossRef]
  37. Hausmann, A.; Toivonen, T.; Slotow, R.; Tenkanen, H.; Moilanen, A.; Heikinheimo, V.; Di Minin, E. Social media data can be used to understand tourists’ preferences for nature-based experiences in protected areas. Conserv. Lett. 2018, 11, e12343. [Google Scholar] [CrossRef] [Green Version]
  38. Levin, N.; Lechner, A.M.; Brown, G. An evaluation of crowdsourced information for assessing the visitation and perceived importance of protected areas. Appl. Geogr. 2017, 79, 115–126. [Google Scholar] [CrossRef] [Green Version]
  39. Fisher, D.M.; Wood, S.A.; White, E.M.; Blahna, D.J.; Lange, S.; Weinberg, A.; Tomco, M.; Lia, E. Recreational use in dispersed public lands measured using social media data and on-site counts. J. Environ. Manag. 2018, 222, 465–474. [Google Scholar] [CrossRef]
  40. Keeler, B.L.; Wood, S.A.; Polasky, S.; Kling, C.; Filstrup, C.T.; Downing, J.A. Recreational demand for clean water: evidence from geotagged photographs by visitors to lakes. Front. Ecol. Environ. 2015, 13, 76–81. [Google Scholar] [CrossRef] [Green Version]
  41. Tenkanen, H.; Di Minin, E.; Heikinheimo, V.; Hausmann, A.; Herbst, M.; Kajala, L.; Toivonen, T. Instagram, Flickr, or Twitter: Assessing the usability of social media data for visitor monitoring in protected areas. Sci. Rep. 2017, 7, 17615. [Google Scholar] [CrossRef] [Green Version]
  42. Sessions, C.; Wood, S.A.; Rabotyagov, S.; Fisher, D.M. Measuring recreational visitation at U.S. National Parks with crowd-sourced photographs. J. Environ. Manag. 2016, 183, 703–711. [Google Scholar] [CrossRef]
  43. Tourism Today. Bahamas Ministry of Tourism about the Industry; Tourism Today: Nassau, Bahamas, 2015. [Google Scholar]
  44. Hargreaves-Allen, V.; Pendleton, L. Economic Valuation of Protected Areas in The Bahamas; Conservation Strategy Fund: Washington, DC, USA, 2010. [Google Scholar]
  45. Government of The Bahamas. Sustainable Development Master Plan for Andros Island; Government of The Bahamas: Nassau, The Bahamas, 2017. [Google Scholar]
  46. World Statistics Pocketbook, 2020 ed.; United Nations Publications: New York, NY, USA, 2020.
  47. Hargreaves-Allen, V. The Economic Value of Ecosystem Services in the Exumas Cays; Threats and Opportunities for Conservation; Conservation Strategy Fund: Washington, DC, USA, 2011. [Google Scholar]
  48. Hargreaves-Allen, V. An Economic Valuation of the natural Resources of Andros Islands, Bahamas; Conservation Strategy Fund: Washington, DC, USA, 2010. [Google Scholar]
  49. Clavelle, T.; Jylkka, Z. Ecosystem Service Valuation of Proposed Protected Areas in Abaco, The Bahamas; Sustainable Fisheries Group: Santa Barbara, CA, USA, 2013. [Google Scholar]
  50. Micheletti, T.; Jost, F.; Berger, U. Partitioning Stakeholders for the Economic Valuation of Ecosystem Services: Examples of a Mangrove System. Nat. Resour. Res. 2016, 25, 331–345. [Google Scholar] [CrossRef]
  51. Smith, N.S.; Zeller, D. Unreported catch and tourist demand on local fisheries of small island states: the case of The Bahamas, 1950–2010. Fish. Bull. 2016, 114, 117–131. [Google Scholar] [CrossRef] [Green Version]
  52. Sherman, K.D.; Shultz, A.D.; Dahlgren, C.P.; Thomas, C.; Brooks, E.; Brooks, A.; Brumbaugh, D.R.; Gittens, L.; Murchie, K.J. Contemporary and emerging fisheries in The Bahamas—Conservation and management challenges, achievements and future directions. Fish. Manag. Ecol. 2018, 25, 319–331. [Google Scholar] [CrossRef]
  53. National Fishery Sector Overview: The Commonwealth of The Bahamas; Food and Agriculture Organization of the United Nations (FAO): Quebec City, QC, Canada, 2009.
  54. Blue Earth Consultants, LLC. Stakeholder Analysis Report: The Bahamas Conch Fisheries Management and sustainability Program; The Nature Conservancy: Nassau, Bahamas, 2016. [Google Scholar]
  55. Barreto, C.R.; Daneshgar, P.P.; Tiedemann, J.A. Carbon Sequestration of Dwarf Red Mangrove in The Bahamas; American Fisheries Society Symposium: New York, NY, USA, 2015. [Google Scholar]
  56. Tourism Today. Bahamas Ministry of Tourism Statistics; Tourism Today: Nassau, Bahamas, 2015. [Google Scholar]
  57. Sealey, K.S. Large-scale ecological impacts of development on tropical islands systems: comparison of developed and undeveloped islands in the central Bahamas. Bull. Mar. Sci. 2004, 75, 295–320. [Google Scholar]
  58. Katherine, H.; Wyatt, K.; Arkema, S.; Jessica, M.; Silver, B.L.; Adelle, T.; Mary, R.; Jan, J.K.; Anne, D.G. Integrated and innovative scenario approaches for sustainable development planning in The Bahamas. Ecol. Soc. in review.
  59. The Government of The Bahamas. Population & Census: Department of Statistics; The Government of The Bahamas: Nassau, Bahamas, 2017. [Google Scholar]
  60. Ziesler, P.S.; Pettebone, D. Counting on Visitors: A Review of Methods and Applications for the National Park Service’s Visitor Use Statistics Program. J. Park Recreat. Adm. 2018. [Google Scholar] [CrossRef]
  61. Sharp, R.; Tallis, H.T.; Ricketts, T.; Guerry, A.D.; Wood, S.A.; Chaplin-Kramer, R. InVEST 3.2 User’s Guide: The Natural Capital Project; The Nature Conservancy: Arlington County, VA, USA, 2017. [Google Scholar]
  62. Delancy, G.; The Bahamas Ministry of Tourism’s Research and Statistics Department, Nassau, The Bahamas; Arkema, K.K.; Stanford University, Stanford, CA, USA; Wyatt, K.; Puget Sound Partnership, Olympia, WA, USA. Personal communication, 2017.
  63. Arkema, K.K.; Ruckelshaus, M. Chapter 16—Transdisciplinary Research for Conservation and Sustainable Development Planning in the Caribbean. In Conservation for the Anthropocene Ocean; Levin, P.S., Poe, M.R., Eds.; Academic Press: Cambridge, MA, USA, 2017; pp. 333–357. ISBN 9780128053751. [Google Scholar]
  64. Tynyakov, J.; Rousseau, M.; Chen, M.; Figus, O.; Belhassen, Y.; Shashar, N. Artificial reefs as a means of spreading diving pressure in a coral reef environment. Ocean Coast. Manag. 2017, 149, 159–164. [Google Scholar] [CrossRef]
  65. Armstrong, E.K.; Kern, C.L. Demarketing manages visitor demand in the Blue Mountains National Park. J. Ecotour. 2011, 10, 21–37. [Google Scholar] [CrossRef]
  66. Inter American Development Bank. BH-L 1050 Boosting Resilient and Inclusive Growth in The Bahamas; Inter American Development Bank: New York, NY, USA, 2020. [Google Scholar]
  67. Balmford, A.; Green, J.M.H.; Anderson, M.; Beresford, J.; Huang, C.; Naidoo, R.; Walpole, M.; Manica, A. Walk on the wild side: estimating the global magnitude of visits to protected areas. PLoS Biol. 2015, 13, e1002074. [Google Scholar] [CrossRef] [Green Version]
  68. Bratman, G.N.; Hamilton, J.P.; Daily, G.C. The impacts of nature experience on human cognitive function and mental health. Ann. N. Y. Acad. Sci. 2012, 1249, 118–136. [Google Scholar] [CrossRef] [PubMed]
  69. Grinde, B.; Patil, G.G. Biophilia: does visual contact with nature impact on health and well-being? Int. J. Environ. Res. Public Health 2009, 6, 2332–2343. [Google Scholar] [CrossRef] [PubMed] [Green Version]
  70. Wolsko, C.; Lindberg, K. Experiencing Connection With Nature: The Matrix of Psychological Well-Being, Mindfulness, and Outdoor Recreation. Ecopsychology 2013, 5, 80–91. [Google Scholar] [CrossRef]
  71. Scheyvens, R. Ecotourism and the empowerment of local communities. Tour. Manag. 1999, 20, 245–249. [Google Scholar] [CrossRef]
  72. Goodwin, H.; Roe, D. Tourism, livelihoods and protected areas: opportunities for fair-trade tourism in and around National parks. Int. J. Tour. Res. 2001, 3, 377–391. [Google Scholar] [CrossRef]
  73. Neuvonen, M.; Pouta, E.; Puustinen, J.; Sievänen, T. Visits to national parks: Effects of park characteristics and spatial demand. J. Nat. Conserv. 2010, 18, 224–229. [Google Scholar] [CrossRef]
  74. Sung, Y.-A.; Kim, K.-W.; Kwon, H.-J. Big Data Analysis of Korean Travelers’ Behavior in the Post-COVID-19 Era. Sustainability 2020, 13, 310. [Google Scholar] [CrossRef]
  75. de Castro, E.V.; Souza, T.B.; Thapa, B. Determinants of tourism attractiveness in the national parks of Brazil. Parks Recreat. 2015, 21, 51–62. [Google Scholar]
  76. Lemay, M.; Schueler, K.; Hori, T.; Guerrero, R.; Argimon, M.; Chavez, E. Climate-Resilient Coastal Management and Infrastructure Program, Project Profile (BH-L1043); Inter-American Development Bank: Washington, DC, USA, 2017. [Google Scholar]
  77. Kitamura, Y.; Karkour, S.; Ichisugi, Y.; Itsubo, N. Evaluation of the Economic, Environmental, and Social Impacts of the COVID-19 Pandemic on the Japanese Tourism Industry. Sustain. Sci. Pract. Policy 2020, 12, 10302. [Google Scholar]
  78. Ruths, D.; Pfeffer, J. Social media for large studies of behavior. Science 2014, 346, 1063–1064. [Google Scholar] [CrossRef] [PubMed]
  79. Li, L.; Goodchild, M.F.; Xu, B. Spatial, temporal, and socioeconomic patterns in the use of Twitter and Flickr. Cartogr. Geogr. Inf. Sci. 2013, 40, 61–77. [Google Scholar] [CrossRef]
Figure 1. The Bahamian archipelago, including the network of marine protected areas (orange boundaries), geotagged Flickr photos (purple points), and Andros, the largest island in The Bahamas. Politically considered a single island, Andros is in fact comprised of three major landmasses, North Andros (which contains the districts of North Andros and Central Andros), Mangrove Cay, and South Andros.
Sustainability 13 02427 g001
Figure 2. Average visitor-days per year (2005–2014) to The Bahamas islands and US NPS sites in the Caribbean based on estimates provided by The Bahamas Ministry of Tourism and US NPS compared with the annual visitor-days as measured using photo-user-days. Dotted line is a 1:1 relationship between photo visitation and surveyed visitation. Gray line is the least-squares regression line (R2 = 0.86). Shaded area is 95% confidence interval of the ordinary least squares linear model.
Sustainability 13 02427 g002
Figure 3. Average annual visitor-days for each Bahamian MPA estimated based on the relationship between geotagged photographs and survey-based visitation depicted in Figure 2. Fraction of stopover (white) and cruise ship (gray) visitors is based on Ministry of Tourism port statistics.
Sustainability 13 02427 g003
Figure 4. Annual visitor-days scaled by area for each Bahamian MPA estimated based on the relationship between geotagged photographs and survey-based visitation depicted in Figure 2. Fraction of stopover (white) and cruise ship (gray) visitors is based on Ministry of Tourism port statistics.
Sustainability 13 02427 g004
Figure 5. (A) Percent of total visitation to Andros estimated for each 5-km grid cell based on our approach using geotagged Flickr photographs. (B) Visitation, expenditure, and nature-based tourism employment in each Andros district.
Sustainability 13 02427 g005
Table 1. Bahamas island-groups included by the Ministry of Tourism and US National Park Service sites in the Caribbean.
Bahamas Island GroupsUS National Park Service
AbacoBuck Island Reef National Monument
AndrosDry Tortugas National Park
BiminiSalt River Bay National Historical Park
EleutheraSan Juan National Historic Site
ExumaVirgin Islands National Park
Grand Bahama
Nassau
San Salvador
Table 2. Parameter estimates for factors influencing visitation on Andros.
PredictorMeasurementEstimateStd. ErrorStatisticp-Value
(Intercept) 0.0060.0080.6910.49
Accessscaled 0–1 0.1600.0344.695<0.001
Agriculturepercent coverage−0.3720.119−3.1350.002
Beachpercent coverage2.3020.6463.562<0.001
Bird areaspercent coverage0.0400.0251.6000.11
Blue holescount−0.0630.031−2.0350.042
Bonefish habitatpercent coverage0.0870.0243.671<0.001
Coppicepercent coverage−0.0170.014−1.1730.241
Coral reef proximate to dive lodgepercent coverage*distance to dive lodge, scaled 0–10.1600.0762.1100.035
Developmentpercent coverage2.0290.2059.886<0.001
Dredged portspresence (1), absence (0)0.2510.0357.103<0.001
Pinepercent coverage0.1810.0237.923<0.001
Protected areaspercent coverage−0.0050.009−0.4830.63
Seagrasspercent coverage−0.0130.018−0.7220.471
Publisher’s Note: MDPI stays neutral with regard to jurisdictional claims in published maps and institutional affiliations.

